
Abstract
Gulf War Illness (GWI) affects about 25% of Persian Gulf veterans with a cluster of chronic symptoms, including immune dysfunction and neurological issues. Recent studies implicate gene expression changes in immune function to be associated with GWI. Since DNA methylation can regulate such changes in gene expression, and disruption of DNA methylation pattern is implicated in various immune and neurological diseases, we aimed to study the DNA methylation patterns in peripheral blood mononuclear cells from GWI patients. Global DNA methylation levels were similar in GWI patients and controls. However, the genome-wide microarray technology detected 10,767 differentially methylated CpG sites across gene regulatory elements and within coding regions. Approximately 88% of them were hypermethylated in GWI patients. The separate analysis found 776 differentially methylated gene promoters (DMP), which were predominantly hypermethylated. Pyrosequencing validation confirmed microarray results. Functional analysis revealed that majority of the DMPs belonged to genes responsible for metabolism and immune system. This is the first pilot human study characterizing genome-wide epigenetic changes associated with GWI. It suggests a significant contribution of epigenetic dysfunction in GWI. Moreover, it supports the dysregulation of immune function in GWI. Lastly, it suggests studies with the larger cohort to validate our findings.
Introduction
Gulf War Illness (GWI) is a severely debilitating condition affecting up to 25% of veterans of the 1990–1991 Persian Gulf deployment with a cluster of chronic symptoms (White et al., 2016). These symptoms include fatigue, memory and cognition impairments, headaches, and musculoskeletal/joint pain (White et al., 2016). The causes and mechanisms of GWI are unknown, but is believed to be caused by a combination of factors such as genetic predisposition, and adverse interactions with environmental factors such as exposure to toxic chemicals and/or pathogens (Steele et al., 2012; Terry, 2012; Kerr, 2015).
With no specific biomarkers for diagnosis or management of GWI, the treatment has been palliative and symptom driven (Nicolson and Nicolson, 1998). While research has suggested that environmental exposures during the war contributed to the onset of the condition, further exacerbation by chronic stress during and after the war could have also contributed to aggravation and persistence of GWI (Steele et al., 2012; Terry, 2012; Kerr, 2015; White et al., 2016). Clinical features of GWI resemble symptoms such as an imbalance of endocrine and immune function (Craddock et al., 2014) similar to other complex diseases, including Myalgic Encephalomyelitis/Chronic Fatigue Syndrome (ME/CFS), Fibromyalgia, and Posttraumatic Stress Disorder, conditions sometimes comorbid with GWI (Nicolson and Nicolson, 1998; Carruthers et al., 2011).
While a number of objective findings, such as autonomic dysfunction (Haley et al., 2013), increased autoantibodies (Abou-Donia et al., 2017) and reduced natural killer cell activity (Whistler et al., 2009) have been established as a biomarker for GWI patients, few studies have focused on epigenetic changes in GWI mouse and rat models (Pierce et al., 2016; Ashbrook et al., 2018). Epigenetic marks such as genomic DNA methylation is an important mechanism of regulation of gene expression and involves the covalent binding of a methyl group to a Cytosine-5 at a C-phosphate-G (CpG) site yielding 5-methylcytosine (5-mC) (Long et al., 2017). Increased methylation of DNA in the promoters of the genes usually leads to repression of these genes (Long et al., 2017). Such epigenetic regulation at the DNA level plays an important role in the interaction between external (environment) and internal (gene expression) factors and thus may explain the late or stimulus-triggered onset of multisystem complex diseases such as GWI. Furthermore, DNA methylation patterns seem to be altered in some diseases, including neurological and immune system-related disorders (Landgrave-Gómez et al., 2015) that are often compared with GWI, such as ME/CFS and irritable bowel syndrome (McDermott et al., 2016).
In the current pilot study, we wanted to determine biological pathways associated with methylation changes in GWI. For this purpose, we used Illumina MethylationEPIC microarrays that allow analysis of DNA methylation changes on 850,000 CpG sites, including distal regulatory elements as well as other genomic regions (Pidsley et al., 2016). Our results are consistent with previously reported dysregulation of the immune system in GWI. Identification of such DNA methylation patterns provides insight into the changes in transcription regulation that can manifest in GWI disease pathobiology, which could allow for specific target identification and facilitate development of novel therapeutic modalities.
Materials and Methods
Cohort recruitment
The study protocol was approved by the Institutional Review Boards of the Miami Veteran Affairs Human Research Protections Program and Nova Southeastern University (Protocol #4987.79). All subjects were recruited from the Miami Veterans Administration Medical Center and gave written informed consent.
GWI cases comprised 20 male veterans who were deployed to the Persian Gulf Theater between August 8, 1990 and July 31, 1991 and met Centers for Disease Control and Prevention (CDC) and Kansas criteria for GWI (White et al., 2016). CDC criteria require presence of one or more symptoms in each of at least two of the three domains of fatigue, musculoskeletal, and mood/cognitive domain. Kansas GWI criteria require that veterans have multiple symptoms within a qualifying domain, and/or symptom(s) of at least moderate severity, in at least three of the six domains of neurological/cognitive/mood, fatigue/sleep problems, respiratory, pain, gastrointestinal, and skin. To qualify for either, symptoms must have been present for at least 6 months and not present before the war.
Controls were 20 nondeployed males matched 1 to 1 to GWI cases on age, ethnicity, and BMI. To qualify, controls must meet neither CDC nor Kansas symptom criteria for GWI, nor Kansas exclusionary criteria (concurrent significant conditions such as diabetes, heart disease, cancer that could produce symptoms that might be confused for GWI), nor could any inquired-about symptom be greater than mild in severity.
Exclusion criteria for all subjects were following: alcoholism or drug abuse; smoking, medical conditions such as organ failure, rheumatologic inflammatory disorders, chronic active infections such as HIV, hepatitis B and C, transplant, and primary sleep disorders; taking medications that could potentially impact immune function were excluded (e.g., steroids, immune suppressors); major depression with psychotic or melancholic features, schizophrenia, bipolar disorder, delusional disorders, dementias of any type. Exclusionary viral serology was performed during the screening visit and included HIV, Hepatitis B, Hepatitis C, and JC virus.
The following questionnaires were completed for all enrolled subjects (GWI veterans and healthy controls [HCs]): the Multidimensional Fatigue Inventory to measure fatigue (Smets et al., 1995), the Medical Outcomes Study 36-item short-form survey (SF-36) to assess health-related quality of life (Ware and Sherbourne, 1992), the Davidson Trauma Scale to assess symptoms of posttraumatic stress disorder (Davidson et al., 1997), the Pittsburgh Sleep Quality Index screens for quality and quantity of sleep with focus on restorative sleep (Buysse et al., 1989), and the Pain Severity Form is a patient assessment of pain.
Isolation of peripheral blood mononuclear cells and DNA extractions
Peripheral blood mononuclear cells (PBMCs) were isolated from blood samples as described previously by our group (Trivedi et al., 2018). Genomic DNA was extracted from PBMCs using the Qiagen DNeasy Blood & Tissue Kit (Qiagen cat. no. 69504), according to the manufacturer's instructions. DNA quality and concentration were assessed by Agilent TapeStation 4200 (Agilent Technologies). All DNA samples had DNA Integrity Number above 8.
Genomic DNA methylation profiling
A total of 500 ng of genomic DNA was submitted to the Center of Genome Technology of the John P. Hussmann Institute for Human Genomics in the Miller School of Medicine, University of Miami. The EZ DNA Methylation Kit (Zymo Research) was used to bisulfite convert genomic DNA. Following the processing according to Illumina's specifications, DNA was hybridized with the Illumina MethylationEPIC microarrays (Moran et al., 2016).
Global DNA methylation was analyzed using the MethylFlash Methylated DNA 5-mC Quantification Kit (EpiGentek, cat. no P-1034) as previously described (Trivedi et al., 2014a, 2014b). Results were normalized against a standard curve prepared according the manufacturer's protocol using the given 0–100% methylated standards.
DNA methylome data analysis
Illumina MethylationEPIC microarrays have extensive coverage, which allows to interrogate over 850,000 methylation sites quantitatively across the genome at single-nucleotide resolution. It covers different regions across genes, including promoters, 5′UTRs, first exons, gene bodies, and 3′UTRs, as well as distant regions. Coverage includes 99% of RefSeq genes with multiple probes per gene, 96% of CpG islands from the UCSC (University of California, Santa Cruz) database, and additional content that was input from whole-genome bisulfite sequencing data (Pidsley et al., 2016).
For normalization and comprehensive analysis of differential methylation, Illumina MethylationEPIC microarray signal intensity data (IDAT files) were imported into the R/Bioconductor (v.3.3.1) package RnBeads (v.1.2.0) (Assenov et al., 2014). We eliminated probes with a detection p-value >0.01 from further analysis. Probes were also removed from further analysis if they overlapped single nucleotide polymorphisms (SNPs), according to dbSNP versions 132, 135, and 137, either at the flanking single nucleotide extension or at the interrogated CpG locus using RnBeads function
Differentially methylated regions or loci in GWI veterans versus controls were identified using R/Bioconductor limma package (Law et al., 2016) that is incorporated into RnBeads analysis. CpG sites were considered to be differentially methylated if they met the following criteria: the absolute beta-value difference between the mean beta-values of cases and controls was greater than 0.05, and false discovery rate (FDR) ≤0.05 using the Benjamini–Hochberg procedure (Hochberg, 2007) as shown in the Supplementary Table S2.
Promoter regions (1500 bp upstream of the transcription start site [TSS] and 500 bp downstream of TSS) were considered to be differentially methylated if the absolute beta-value difference between the mean beta-values of cases and controls was greater than 0.05 with a FDR ≤0.2 according to Benjamini–Hochberg procedure (Supplementary Table S3). We also determined differentially methylated promoters (DMPs) following FDR ≤0.1 and FDR ≤0.05 criteria. Such data are included in the Supplementary Data (Supplementary Tables S4 and S5).
RnBeads calculates the combined rank score for differential DNA methylation to each genomic region as described previously (Assenov et al., 2014). We present our data in the Supplementary Data ordered by the combined rank. The raw microarray data have been deposited in Gene Expression Omnibus (GEO) at NCBI (
Validation of DMPs by pyrosequencing
Pyrosequencing was used for a validation of the data obtained with the Illumina MethylationEPIC microarrays. We performed bisulfite conversion followed by pyrosequencing as previously described by our group (Trivedi et al., 2014a). The primer sequences for ZBTB18 were: forward - 5′- GAGTTTGAGGAGATGTATTTGATATT-3′ and reverse - 5′- AACTTTTCAACCAATTTATAAATCTTTTCT-3′. The primer sequences for TRPG1 were: forward- 5′- GTGAGTGATAGAGGGTTTTTAAATAGAT-3′ and reverse- 5′- CCTTTACAACTCCAACCTAAACTACAAC-3′. The results are reported as the percentage of the 5-methylated cytosines with respect to total, methylated, and unmethylated cytosines (Supplementary Table S1). The controls, non-CpG cytosine residues, were used to validate bisulfite conversion. CpG sites were considered to be differentially methylated if they met the following criteria: p ≤ 0.05 according to the Student t-test.
Ingenuity pathway analysis
To annotate genes with the DMPs and rank canonical pathways we utilized Ingenuity Pathway Analysis software (IPA, Qiagen). This allowed the identification of pathways from IPA database that were most significant to the set of genes with the DMPs. The ratio between the number of genes that map to the pathway divided by the total number of genes that map to the canonical pathway was utilized to determine the significance of the association between the gene set and the canonical pathway (
Results
Cohort demographics and study design
GWI patients and Gulf War era HC participants were matched by age and BMI as shown in Table 1. In the Controls, we had nine Hispanic, four Caucasians, six African American, and one Asian. In the GWI cases, we had six Hispanic, four Caucasians, nine African American, and one Asian. GWI patients' scores of physical and mental health were significantly lower in comparison to HC according to the SF-36 scores. Genomic DNA from 10 GWI patients and 10 HC were hybridized to the Illumina MethylationEPIC microarrays. The results obtained from data analysis of the methylation microarrays were validated by pyrosequencing on all the samples from the initial experimental cohort (Fig. 1), as well as on additional 10 GWI patients and 10 HC as a validation cohort for a total of 20 subjects in each cohort.
Demographic Information and SF-36 Results Comparing Gulf War Illness Cases and Healthy Control Subjects Participated in the DNA Methylation Analysis and Validation
Data are shown as mean ± standard error of mean.
p ≤ 0.05, Student t-test.
GWI, Gulf War Illness.

Study design flowchart. Genomic DNA was isolated from GWI veterans (N = 10) and healthy controls (N = 10) and analyzed using Illumina Infinium Human MethylationEPIC BeadChip microarrays. Following data analysis results were validated on GWI patients (N = 20) and control (N = 20) samples using pyrosequencing analysis. GWI, Gulf War Illness.
Differentially methylated CpG sites in GWI
Using ELISA-based assay methods, we did not find statistically significant differences in global DNA methylation levels (Supplementary Table S1). While the levels of global DNA methylation did not change, genomic DNA methylation patterns could change in specific genomic regions, and these changes are beyond capability of the ELISA method. The ELISA-based methodology does not detect specific fluctuations at particular locations in the genome and it only shows overall cytosine modifications. Therefore, we employed Illumina MethylationEPIC microarrays to evaluate genome-wide site-specific DNA methylation levels.
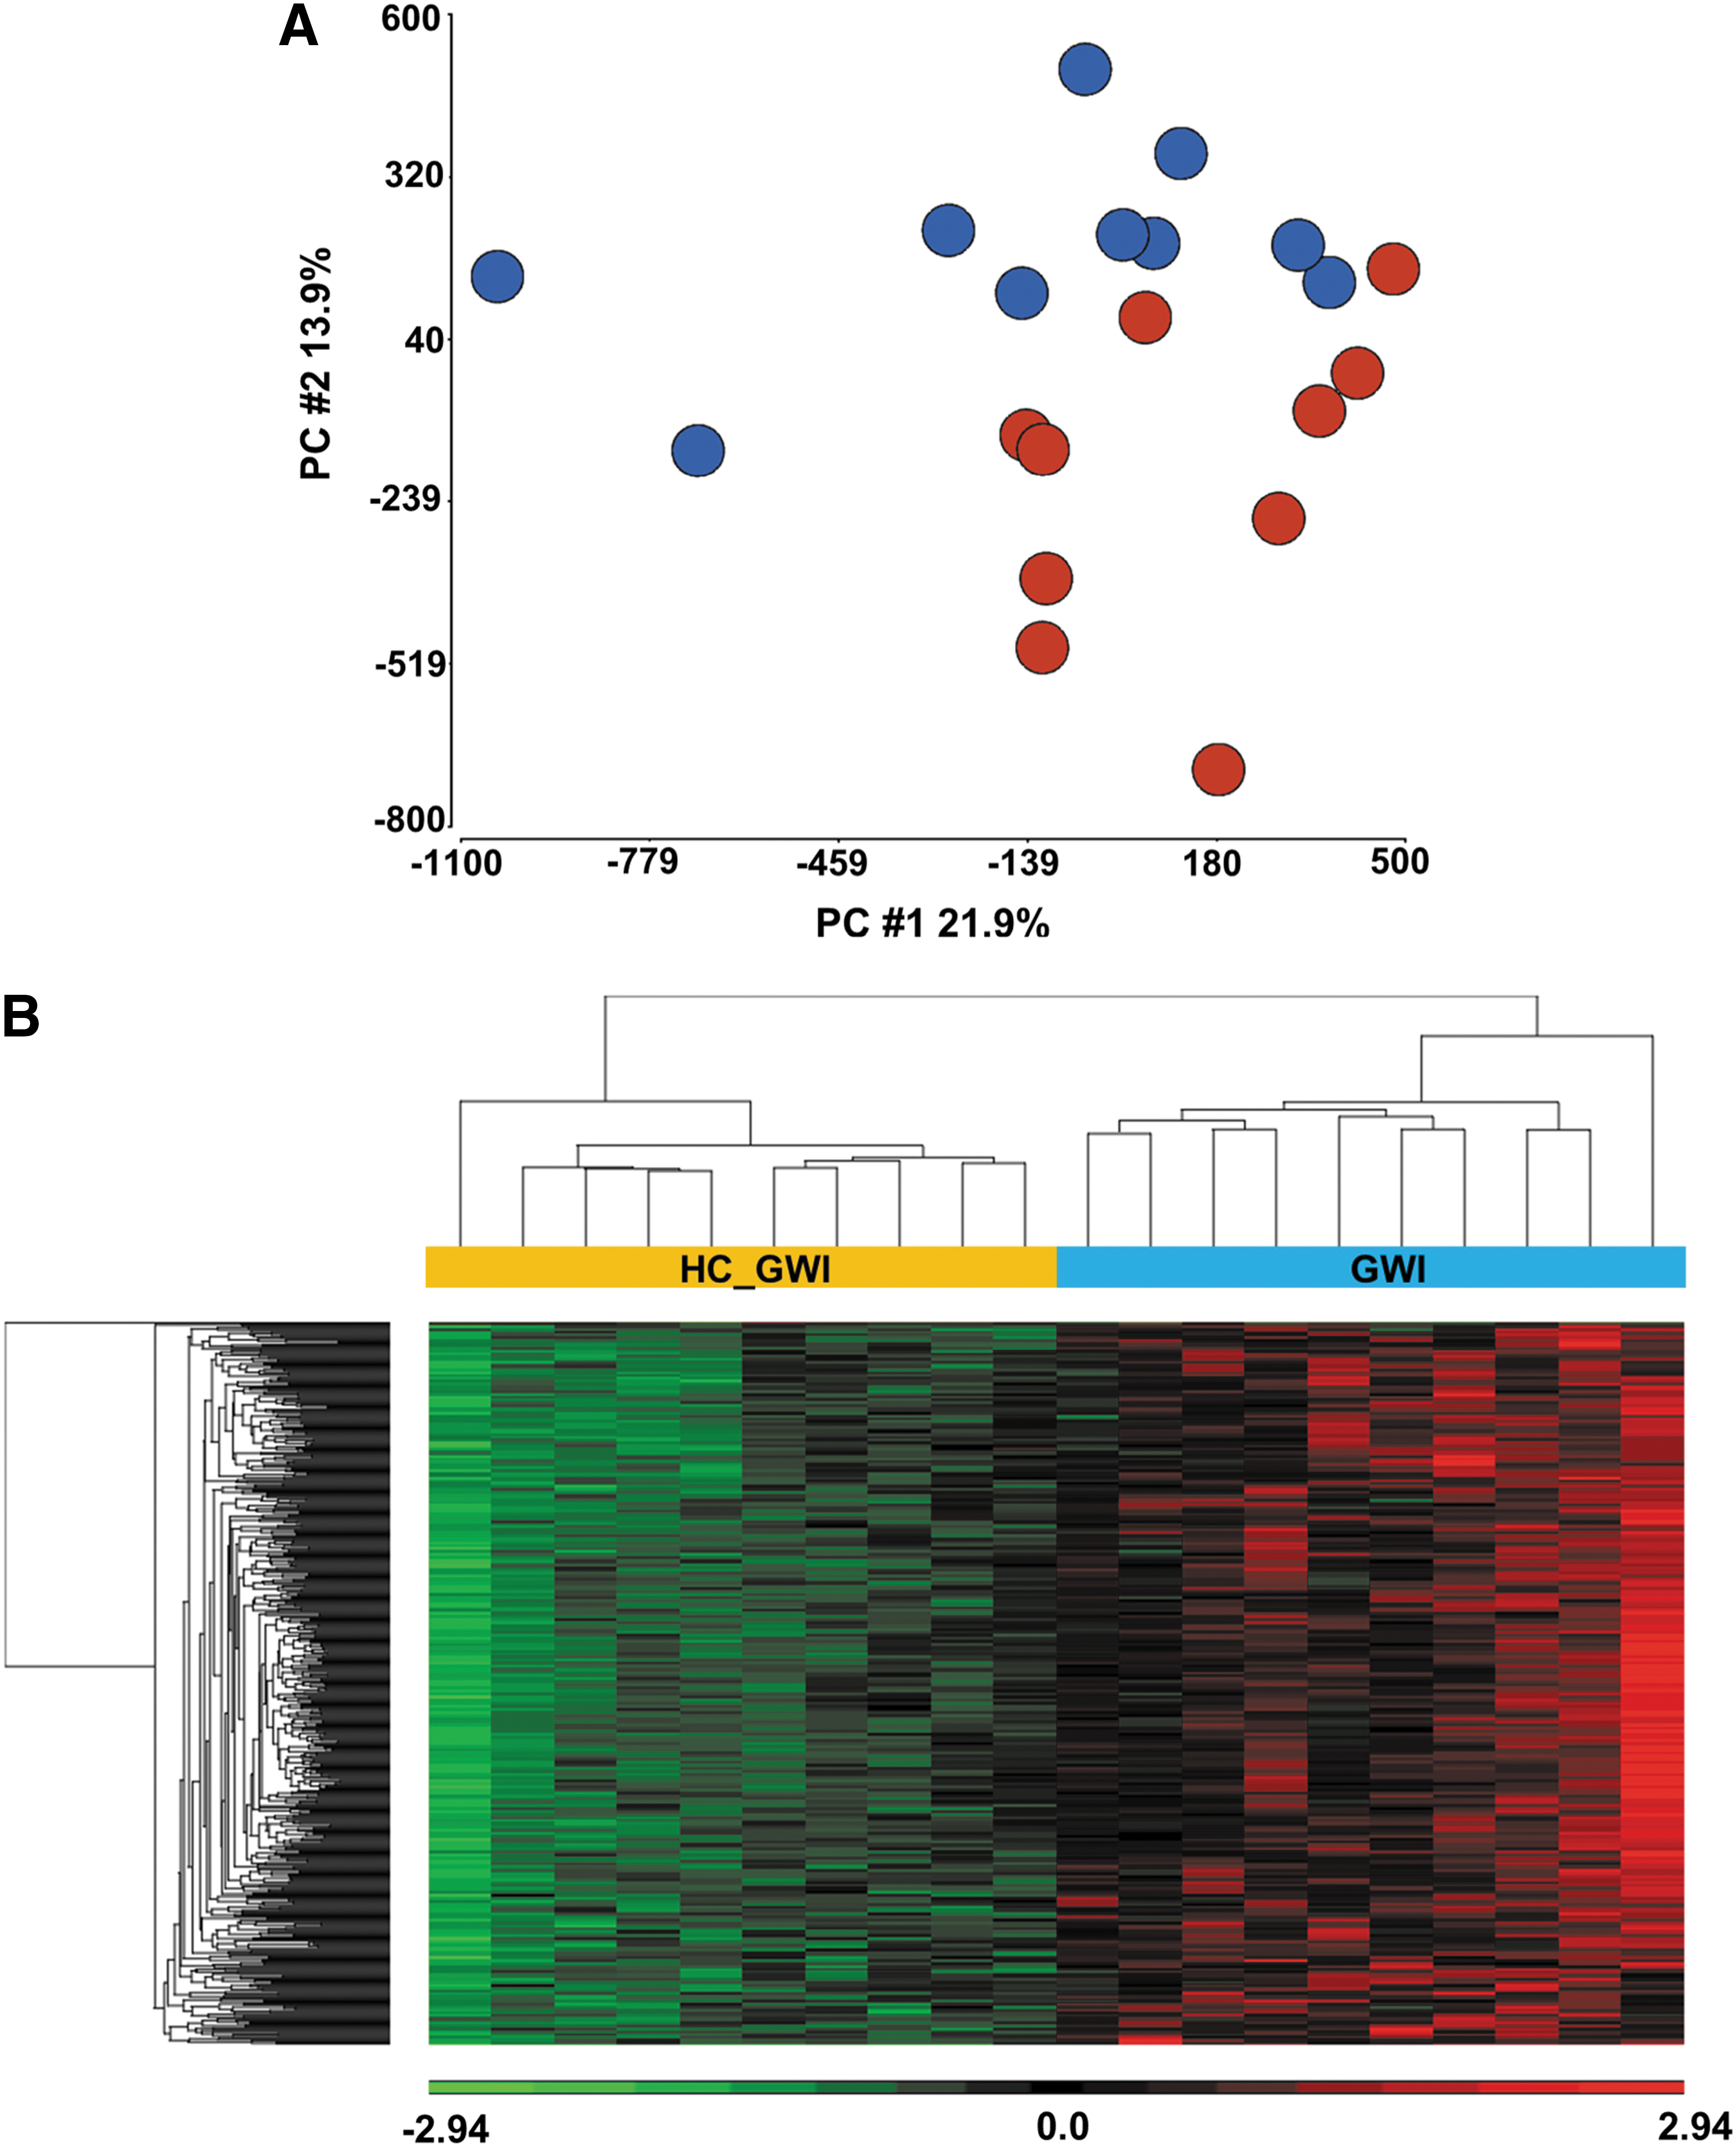
Using principal component analysis (PCA) of the whole DNA methylomes as an initial exploratory analysis, we found that genomic DNA methylation patterns can predict and distinguish between GWI patients and HC as shown in Figure 2A. In addition, unsupervised hierarchical clustering of the 500 most variable CpG sites (according to RnBeads ranking, see Methods) shows clear segregation between GWI patients when compared with HC (Fig. 2B) confirming that DNA methylation patterns in PBMCs of GWI patients differ from those of HC.
Upon filtering and preprocessing of the raw genomic DNA methylation data with the R/Bioconductor RnBeads package, as many as 633,604 probes were left for further analysis. Differential analysis of these probes led to the finding of 10,767 differentially methylated CpG sites (DMS) (FDR <0.05 and beta mean difference >0.05). The majority of DMS (88%) is hypermethylated in the GWI patients in comparison to the HC participants in experimental cohort. Supplementary Table S2 shows the list of DMS.
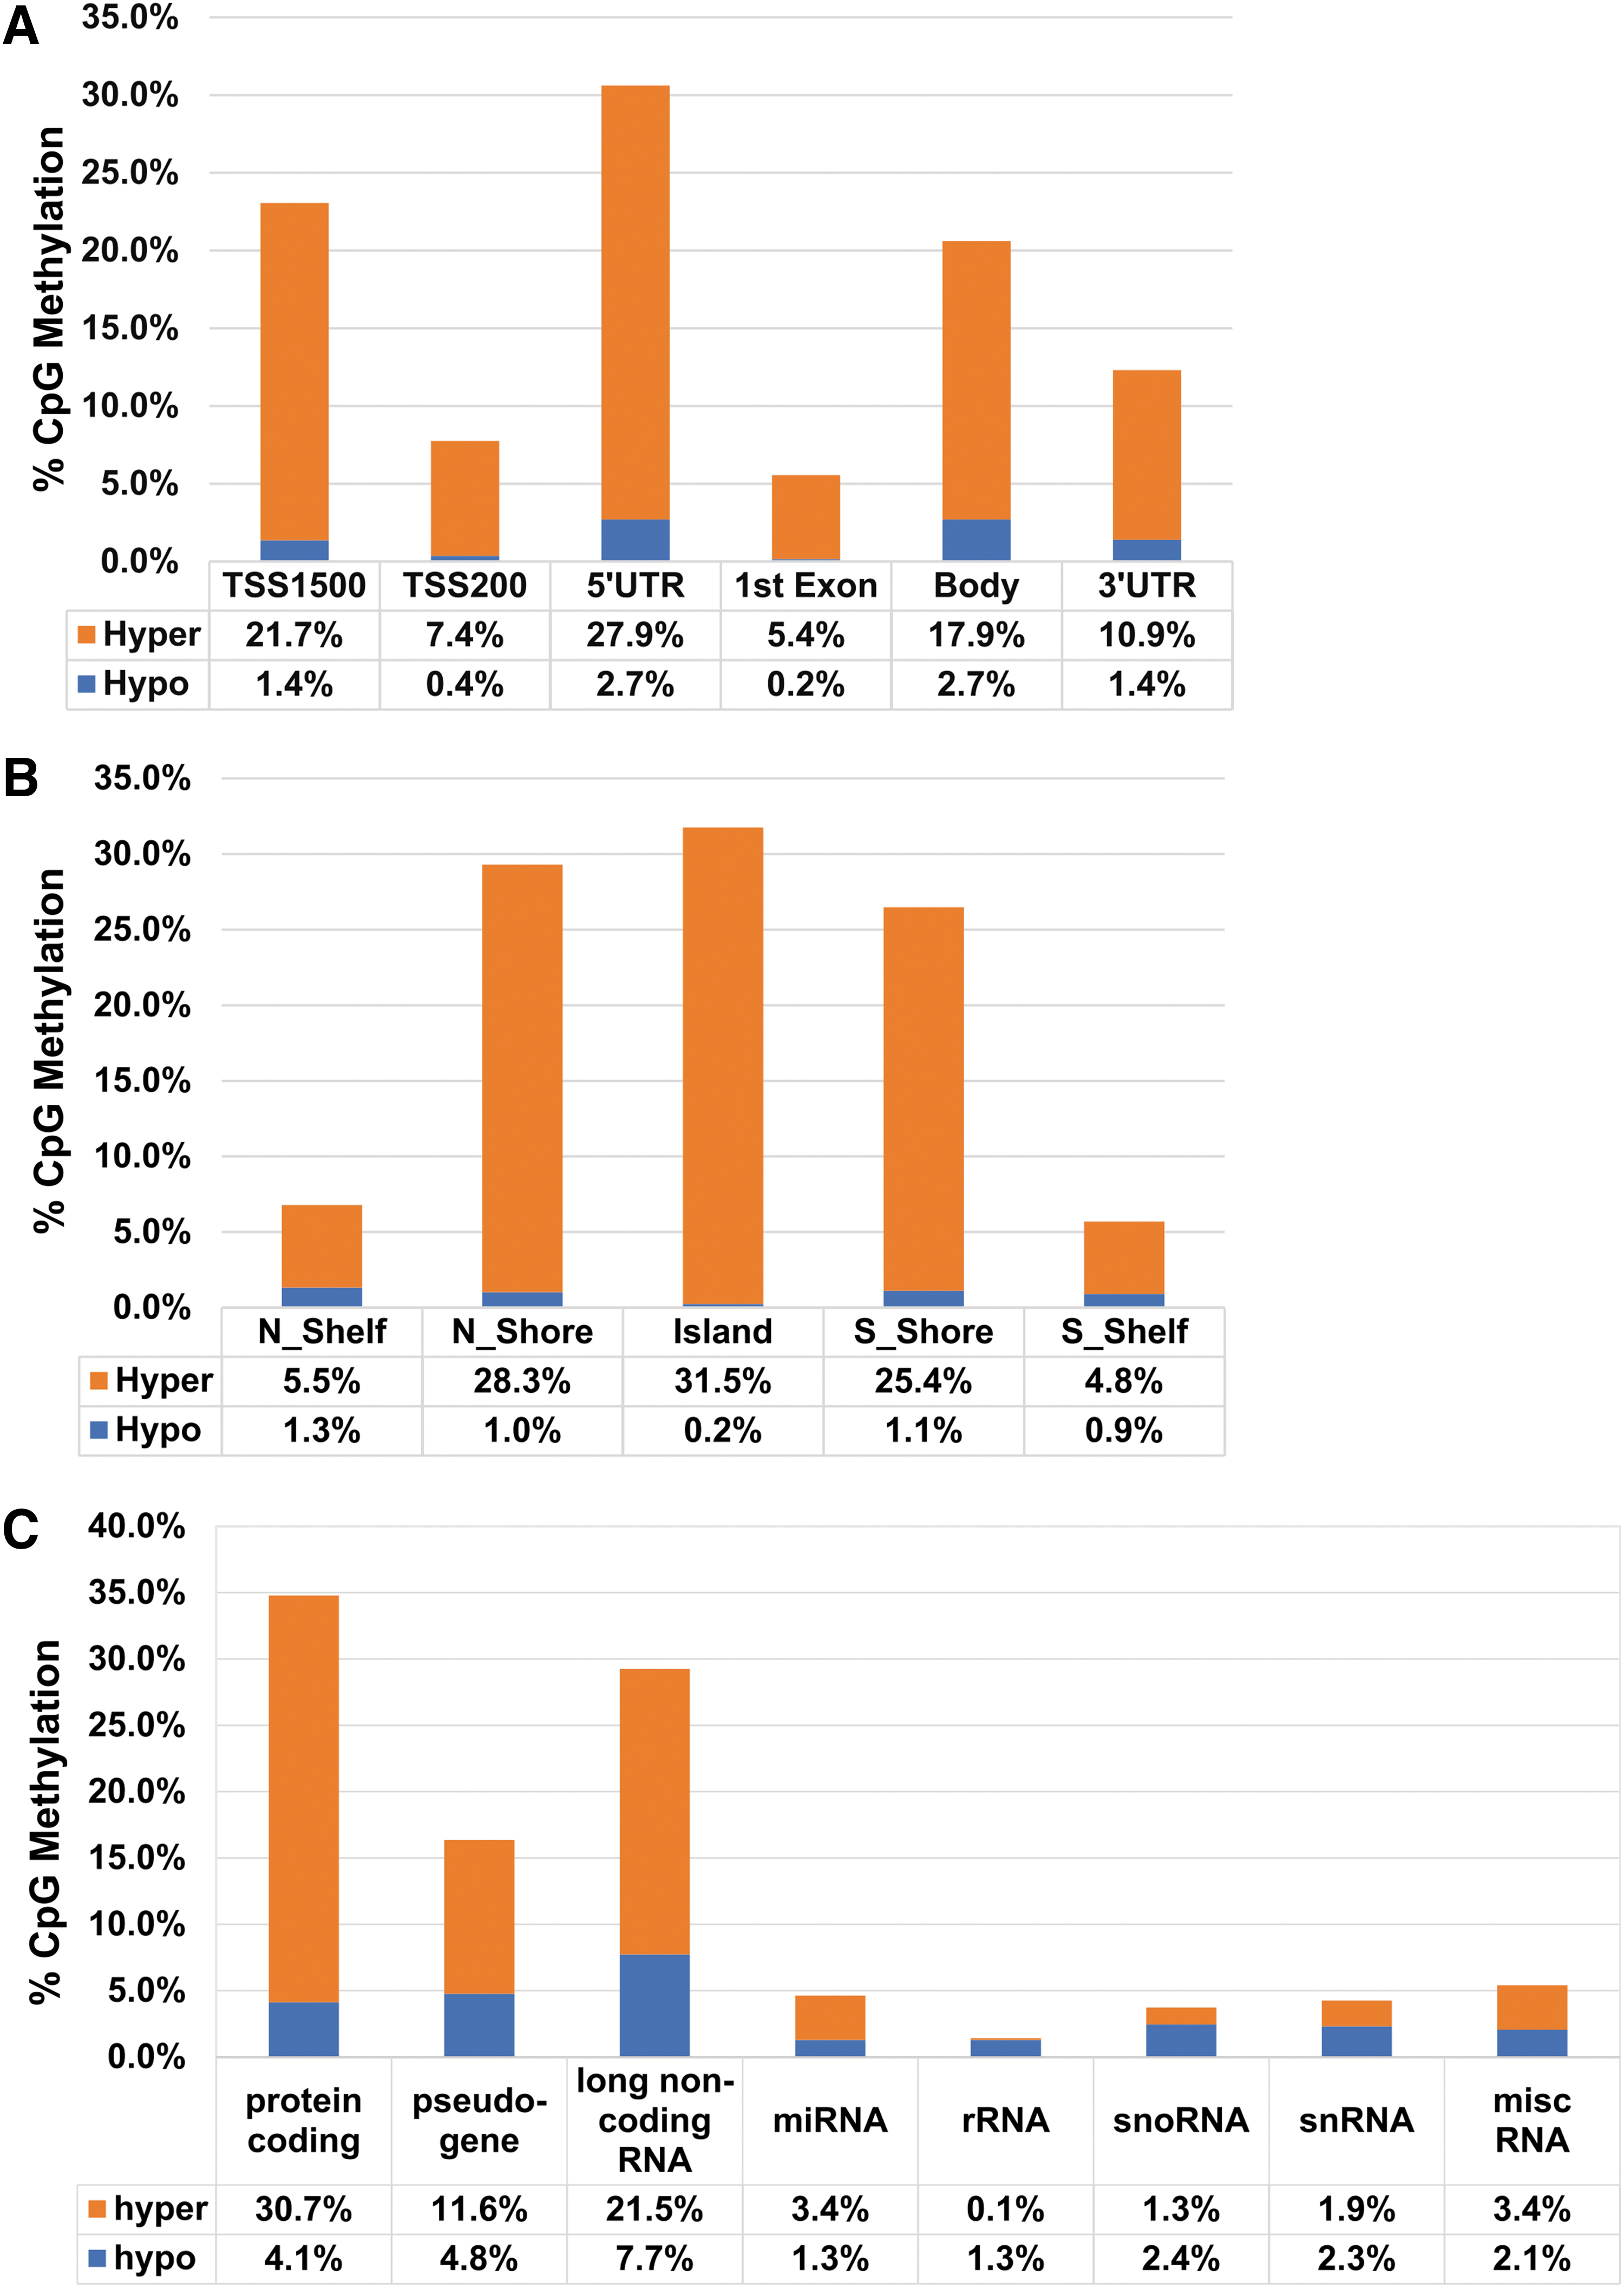
Distribution of DMS according to genic location indicates that 26.2% are located inside of the gene body, and 73.7% are located in promoters and other regulatory elements (Fig. 3A). According to CpG island location, distribution of DMS shows that more than half of the DMS are located within the islands and in the north and south shores (closer to the islands), and less of them are located in the north and south shelves (further away from the islands) (Fig. 3B). The shores and the shelves are defined as 2 kb upstream and downstream of CpG islands (N, S Shores), and 2 kb upstream and downstream of CpG shores (N, S Shelves).
Distribution of DMS according to
Differentially methylated promoters
Methylation status of the promoter regions can directly influence the gene expression levels; hence, we analyzed the DMPs in our GWI cohort. The promoters are defined in RnBeads package as the region located between 1500 bp upstream of TSS and 500 bp downstream of TSS (Methods section). Using the criteria FDR ≤0.05 with the mean beta differences >0.05, we found 13 DMPs. At the same time using the criteria FDR ≤0.1 with the mean beta differences >0.05, we found 41 DMPs. In addition, when we used the criteria FDR ≤0.2 with the mean beta differences >0.05, we found 776 DMPs in PBMCs of GWI cases. Supplementary Tables S3–S5 list these DMPs sorted by combined rank according to the RnBeads package (Assenov et al., 2014).
To get a broader perspective of the specific pathways and genes that were altered, we decided to use the FDR ≤0.2 for the further studies. To use valid results for functional analysis we validated DMPs with FDR >0.1 (see “Validation of Illumina MethylationEPIC microarray results by pyrosequencing” below). While 203 of these DMPs are hypomethylated, 573 were hypermethylated in the GWI group.
In addition, we evaluated the distribution of DMPs based on the gene biotype. While DNA methylation of protein coding gene promoters (34%) was high, about 14% of DMPs belong to pseudogenes, 29% belong to long noncoding RNA genes, and 23% belong to short noncoding RNA genes, including microRNAs, small nuclear RNAs, and small nucleolar RNAs (Fig. 3C). Such distribution of DMPs in the regulatory and protein coding regions suggests that the observed differential methylation likely contributes to altered regulation of gene expression status in the GWI patients.
Among others, we found hypermethylation of the CpG islands in promoters of 16 different T cell receptor joining genes (TRAJ57, TRGJP, TRGJP1, TRGJ1, TRDJ2, etc.). We also determined that the CpG islands in promoters of immunoglobulins (IGKV1-6, IGHD6-19, IGHD1-20, IGDCC3, etc.) as well as interleukin 1 alpha and interleukin 1 receptor, are hypermethylated in PBMC of GWI patients as compared with HCs.
Differentially regulated pathways in GWI
For pathway analysis we used the list of DMPs following the criteria of the FDR ≤0.2 and mean beta difference of 0.05. We interpreted the biological significance of DMPs in GWI and performed Gene Ontology analysis using the IPA on these 776 genes with the DMPs using IPA algorithm.
Ingenuity Pathways Analysis computes a score for each network according to the fit of that network to the user-defined set of Focus Genes. The score in Table 2 is derived from a p-value and indicates the likelihood of the Focus Genes in a network being found together due to random chance. A score of 2 indicates that there is a 1 in 100 chance that the Focus Genes are together in a network due to random chance. Therefore, scores of 2 or higher have at least a 99% confidence of not being generated by random chance alone (Long et al., 2004).
List of Genes for the Top Diseases and Functions Using the Ingenuity Pathway Analysis
The score is derived from a p-value and indicates the likelihood of the Focus Genes in a network being found together due to random chance.
The majority of the promoters regulate expression of genes that function in metabolism and immune response (Fig. 4A and Table 2). For example, promoters of several genes belonging to the glutathione-mediated detoxification pathway were hypermethylated. Hypermethylation was also observed in genes belonging to Eicosanoid signaling pathway. Promoter methylation was also impaired in genes belonging to interleukin (IL)-10 signaling, retinoic acid-inducible gene (RIG)-I-like, nuclear factor kappa-light-chain-enhancer of activated B cells (NF-κB), and activation of interferon regulatory factor (IRF) by cytosolic pattern recognition receptors. Promoter hypermethylation was also observed for NFκB Inhibitor Alpha (NFKBIA), interleukin 1A and its receptor (IL1A and IL1R1), and Mitogen-Activated Protein Kinase Kinase Kinase Kinase 4 (MAP4K4), TGF-β Activated Kinase 1 and MAP3K7 Binding Protein 3 (TAB3), and Interferon Alpha 6 (IFNA6) (Fig. 4B).

Canonical pathway analysis of genes with the DMPs.
We employed IPA's network gene analysis, which utilizes all DMPs from the dataset based on their role in various diseases and conditions. Figure 4B shows genes (and top diseases associated these genes) with changes in methylation in individuals diagnosed with GWI. The main disease-associated functions of the differentially methylated gene promoters are related to cell death and survival, immunological diseases, cellular development, nervous system development, inflammatory response and are related to genes typically associated with metabolism and inflammation. Therefore, these analyses have confirmed alterations in the functions related to metabolism and immune function in GWI patients.
Validation of Illumina MethylationEPIC microarray results by pyrosequencing
For validation by pyrosequencing we selected two DMPs that had high density of CpG sites, possible GWI relevance by their role and relatively high FDR (0.12 for ZBTB18 promoter and 0.18 for TPRG1-AS promoter, respectively). The first gene, Zinc Finger and BTB Domain Containing 18 (ZBTB18), is a zinc finger transcriptional repressor with a crucial role in brain development and neuronal differentiation. The second one, TRPG1-AS, regulates Anthranilate synthase component II and is needed for biosynthesis of amino acids.
We assayed DNA methylation levels of at least six CpG sites in the promoter area for each of the selected genes. For ZBTB18, we tested three of the CpG sites, which corresponded to oligonucleotides printed on Illumina MethylationEPIC microarrays, and three additional CpG sites that are not included in microarray content but are located in the gene promoter region between cg15896892 and cg19698993. In the case of the TPRG1-AS gene, four of the nine tested CpG sites correlated with probes included in Illumina MethylationEPIC microarrays. Additionally, we also validated three other DMPs namely Dipeptidyl Peptidase 3 (DPP3), Forkhead box D2 (FOXD2), and F-box protein 39 (FBXO39). These were chosen randomly from the list of DMPs with FDR <0.2, to validate the results of the array by using bisulfite sequencing. As summarized in Figure 5 and Supplementary Figure S1, pyrosequencing analysis strongly validated the direction of methylation differences between GWI and control subjects (p < 0.01) as identified by Illumina MethylationEPIC microarray (FDR ≤0.2) in most of the CpG sites assayed.

Bisulfite conversion followed by PS to validate DMPs identified by Illumina MethylationEPIC microarrays (EPIC). The average methylation level of CpG sites within promoters of
Discussion
Overall, we identified differential methylation status at CpG sites and promoter regions using an experimental cohort of N = 10 for GWI patients and HC and validated our findings using a targeted approach on an expanded validation cohort of N = 20 in each group. In fact, the methylation levels detected by pyrosequencing validation in GWI individuals were even more pronounced and in the same direction (hypo or hyper) at the same CpG sites in GWI individuals than the differences observed when assayed by MethylationEPIC microarrays.
Our results of the ELISA-based global methylation assays did not show any statistically significant differences between GWI patients and controls. However, site- and region-specific analysis by Illumina MethylationEPIC microarrays allowed to find 10,767 DMS out of total 633,604 analyzed after preprocessing (about 1.7%). ELISA-based assays were not sensitive enough to detect such differences. These assays are also not region specific.
While studies in various disease models have reported alterations of the genetic code itself, emerging epigenetic studies provide critical new information on disease pathogenesis especially under the influence of various environmental factors (Baccarelli and Bollati, 2009; Feil and Fraga, 2012; Jeffries and Sawalha, 2015). Various groups have reported aberrant DNA methylation (hyper or hypomethylation) in many diseases, including cancer, aging, immune dysfunction, and neurological disorders (Landgrave-Gómez et al., 2015; Delgado-Morales et al., 2017). This is the first pilot study to focus on in-depth epigenetic characterization in human PBMCs of GWI.
During the Persian Gulf War, military personnel were exposed to various toxic exposures such as insecticides that contained organophosphates and as many as 100,000 troops may have been exposed to low (i.e., nonacutely toxic) levels of sarin/cyclosarin following the destruction of Iraqi munitions storage complexes.
While several of these toxins are shown to affect the neurodevelopmental trajectory, not much is known about their downstream effects on the adult organism. These various exposures may lead to epigenetic toxicity by affecting the epigenome and exerting undesirable effects. Considering that the exposure might have been taken several decades ago, some of these symptoms last much longer, and sometimes are also passed on to subsequent generations (Soubry et al., 2014). Hence, this epigenetic toxicity may explain the long-term effects and the predisposition to diseases due to environmental factors, including chemicals.
In this study, we utilized DNA methylation to distinguish between GWI patients and HC using PCA of the whole DNA methylomes. PCA analysis of whole methylomes and unsupervised hierarchical clustering of the 500 most variable CpG displayed a clear segregation of GWI patients.
Our results confirm the presence of alterations in promoters that possibly regulate the expression of genes that function in metabolism and immune response. Previous studies have shown dysfunction in immune response, including decreased NK cell activity and increased ratio of CD4/CD8 in GWI patients (Vojdani and Thrasher, 2004; Georgopoulos et al., 2017). Interestingly, reports of increased methylation of T cell receptor joining genes show that the function of CD4 helper T cells is impaired (Vojdani and Thrasher, 2004; Zhang and Ho, 2011). In this study, we found that CpG islands in promoters of 16 different T cell receptor joining genes (TRAJ57, TRGJP, TRGJP1, TRGJ1, TRDJ2, etc.) are hypermethylated, which can affect T cell receptors' recombination and function of helper T cells. Similarly, studies show increased number of B cells in GWI patients (Vojdani and Thrasher, 2004; Whistler et al., 2009; Broderick et al., 2013), and our DNA methylation data shows disturbance of B cell function. In contrast, increased methylation of miRNA-148a promoter may suggest impaired regulation of B cell tolerance and autoimmunity (Gonzalez-Martin et al., 2016).
Three genes with DMPs (AVP, ARNTL, and CREBBP) form a core component of the circadian clock, and can be linked to a disturbance in sleeping pattern frequently observed in GWI patients (Chao et al., 2016).
Promoter methylation was also impaired in genes belonging to IL-10, NF-κB, IRF, and RIG-I signaling, which are all different pathways related to inflammation response. Promoter hypermethylation was also observed for NFKBIA, which is an inhibitor of inflammation, MAP4K4, which mediates TNFα pathway signaling, TAB3, which regulates NF-κB signaling, and IFNA6, which is involved in regulation of cytokine signaling (Fig. 4B).
Hypermethylation of CpG islands in promoters of immunoglobulins (IGKV1-6, IGHD6-19, IGHD1-20, IGDCC3, etc.) as well as IL1A and IL1R1, indicates impairment in regulation of immune responses, inflammatory reactions, and hematopoiesis in GWI (Liu et al., 2005). In parallel, hypermethylation of miRNA-193b promoter may cause dysregulation of cytokine signaling and hematopoiesis (Haetscher et al., 2015). CpG islands in promoters of genes, which regulate proteolysis (CTSD, MAP4K4, XBP1, TP53INP1, etc.), signaling (TXK, FGR, ZNF304, TYROBP, NFKBIA, etc.), and metabolic process genes (MTHFS, DAO, UPB1, etc.) are preferentially hypermethylated and so these genes could be potentially “switched off.” All of these datasets are in agreement with the multiple reports indicating impaired cytokine signaling in GWI.
This pilot study was limited in that it was performed in a total cohort of 40 participants; however, we did use an experimental cohort of N = 10 and validated our findings using an expanded validation cohort of N = 20/group. Moreover, it is noteworthy to mention that there were 2 CpG sites (CpG5 and CpG6 for TPRG1-AS) that did not report any change with the pyrosequencing but showed significant changes when assayed by microarrays.
It should be noted that, the data collected in this study does not rule out the possibility that specific subtypes of immune cells within our mixed PBMC cell population could have differential contributions of epigenetic variation. Although the relevant cell populations affected in GWI remains unknown at this point. However, our data does provide evidence for distinct epigenetic variation with an immunological component in GWI. Furthermore, replicating studies and evaluating a larger cohort to confirm the results of these altered genes are warranted and further exploration of the altered pathways is key to design new treatments with targeted therapies.
Overall, while some advances have been made to determine the underlying mechanisms of GWI, the exact causes of the disease remain unclear. Elucidation of the key mechanisms that drive GWI and dysfunction within regulatory systems will aid in better diagnosis and management of disease, providing a more targeted approach to treatment that does not solely address symptomatology. We extended our gene expression studies and characterized the regulatory mechanisms for gene expression in the form of epigenetic changes, utilizing state-of-the-art technology.
Conclusions
GWI is a complex disorder with a likely combination of both genetic and environmental components, culminating into altered epigenetic status. This is the first human study to have explored genome-wide epigenetic changes associated with GWI. Our results are consistent with previously reported dysregulation of the immune system in GWI. However, it provides a molecular basis in the form of epigenetic modification for such dysregulation and contribution toward pathobiology of GWI. It is imperative that further studies are warranted for validation of such epigenetic changes in a larger cohort of GWI veterans.
Footnotes
Acknowledgments
The authors acknowledge employees of the Center for Genome Technology at the John P. Hussman Institute for Human Genomics, University of Miami Miller School of Medicine, Ioanna Konidari, Daniela Martinez, and Martin Magurno for running Illumina MethylationEPIC microarrays. This work was supported by the Office of the Assistant Secretary of Defense for Health Affairs, through the Gulf War Illness Research Program under Award No. W81XWH-15-1-0163. Opinions, interpretations, conclusions, and recommendations are those of the author and are not necessarily endorsed by the Department of Defense.
Disclosure Statement
The authors declare no conflict of interest.
Supplementary Material
Supplementary Figure S1
Supplementary Table S1
Supplementary Table S2
Supplementary Table S3
Supplementary Table S4
Supplementary Table S5
References
Supplementary Material
Please find the following supplemental material available below.
For Open Access articles published under a Creative Commons License, all supplemental material carries the same license as the article it is associated with.
For non-Open Access articles published, all supplemental material carries a non-exclusive license, and permission requests for re-use of supplemental material or any part of supplemental material shall be sent directly to the copyright owner as specified in the copyright notice associated with the article.