
Abstract
The capacity to develop adventitious roots (AR) from cuttings is a key factor for the mass deployment of superior genotypes in the woody plant, including Catalpa Scop. Catalpa Scop. was characterized as having excellent woody qualities in China. However, the knowledge of the molecular mechanisms of AR formation is limited in Catalpa Scop. In this study, for the first time, association mapping for AR formation was performed on a selected sample of 108 Catalpa accessions. Genetic diversity and population structure was estimated on the basis of 54 gene-derived simple sequence repeat markers. Genetic diversity analysis revealed that four accessions belonging to Catalpa duclouxii and eight belonging to Catalpa fargesii formed one clade, providing molecular evidence for C. duclouxii belonging to C. fargesii. Marker–trait association analysis revealed four genes associated with three rooting traits, namely AR rating, adventitious root numbers (ARN), and maximal AR length, with phenotypic variation explained for these traits of 10.77–18.49% in experiments in 2 years. Among the four genes, a WRKY transcription factor gene CbNN1 was the only gene that showed association with the ARN in both years, and expression of this gene (determined by analysis by real-time quantitative polymerase chain reaction) increased with increasing rooting ability. These results indicated that the gene CbNN1 might play a positive role in AR formation. The findings from this study will not only be beneficial to the research of AR formation, but also contribute to the phylogeny of interspecies in Catalpa Scop.
Introduction
The genus Catalpa Scop. (Bignoniaceae) comprises 11 species of trees and shrubs native to East Africa and North and South America (Muñoz-Mingarro et al., 2003). Six species are found in China, comprising five native species and one foreign species. Catalpa ovata is distributed in central and northern China. Catalpa bungei and Catalpa fargesii are distributed in central to southwestern China, and the latter has a glabrous form, namely Catalpa duclouxii (Gilmour, 1936). Catalpa tibetica is endemic to southwestern China and shares creamy-yellow flowers with C. ovata. Catalpa speciosa is native to the Mississippi River drainage basin (Beillmann, 1946).
Propagation from shoot cuttings can reproduce numerous new plants at a low cost in a short period, and has been widely used in many plants, especially in forestry species such as Catalpa (Ma et al., 2014; Yang et al., 2014). Genetic improvement of adventitious roots (AR) formation in Catalpa using conventional breeding methods is hampered by its long juvenility phase. To improve the efficiency of Catalpa breeding efforts, it is critical to identify candidate genes or quantitative trait loci (QTL) that control AR formation.
AR formation is a complex regeneration process controlled by many genes (Druege et al., 2016; Xu et al., 2018). QTL analysis is a powerful tool for explaining complex traits such as AR formation (Zaidi et al., 2015; Xu et al., 2017). Association mapping is one of the methods for the genetic improvement of tree species. It can map trait variation using marker polymorphisms based on linkage disequilibrium (LD) in natural populations (Lou et al., 2015; Phung et al., 2016; Pinto et al., 2018). For example, using candidate gene-based association mapping in Eucalyptus globulus, 25 single nucleotide polymorphisms in 20 candidate genes were significantly associated with wood quality and growth traits (Thavamanikumar et al., 2014). The panel of 180 rice varieties was phenotyped for 6 root traits and 2 associations with the highest significance were for root thickness on chromosome 2 and for crown root number on chromosome 11 (Phung et al., 2016).
Many transcriptomic analyses have revealed that transcription factors are key players for AR and lateral root (LR) formation (Abu-Abied et al., 2012; Wang et al., 2015; Kong et al., 2017; Gudimella et al., 2018; Sun et al., 2018). Many transcription factors in plants have been identified and are classified according to their DNA-binding domain, such as WRKY (proteins characterized by the highly conserved WRKYGQK amino acid sequence) (Montiel et al., 2004). Overexpression of the OsWRKY31 gene generated rice (Oryza sativa) plants with reduced LR formation and elongation compared with wild-type and RNA interference (RNAi) plants (Zhang et al., 2008). LR number was significantly increased when AtWRKY75 expression was suppressed in Arabidopsis (Devaiah et al., 2007). AtWRKY46 is expressed throughout LR primordia during early LR development and that expression is subsequently restricted to the stele of the mature LR (Ding et al., 2015).
According to the WRKY domains and zinc-finger motif, WRKY proteins can be classified into three groups. Group 1 proteins contain two WRKY domains and a single C2H2 motif; Group 2 proteins have a single WRKY domain and a C2H2 zinc-finger motif and can be further divided into five subgroups (2a–2e); Group 3 proteins also have a single WRKY domain, but their zinc-finger-like motif is C2HC (Eulgem et al., 2000).
In our previous study, a total of 11,100 differentially expressed genes, including 10,200 unique and 900 common, were identified using the Illumina sequencing method for transcriptome analysis of softwood cuttings of C. bungei “Yu1” at four stages of AR formation (Wang et al., 2015). In addition, numerous simple sequence repeat (SSR) loci were identified, based on the AR transcriptome (Wang et al., 2016). The next focus of our research aimed to exclude noise in the data and detect the key genes affecting AR formation.
Therefore, in the present study, 108 accessions of Catalpa Scop. were used to conduct association mapping for AR formation by combining information on 54 gene-derived SSR markers. These markers were used to analyze the genetic diversity, population structure, and LD values. Adventitious root rating (ARR), adventitious root numbers (ARN), and maximal adventitious root length (MARL) were measured to assess adventitious rooting capability. One objective of this study was to identify and analyze candidate genes for AR formation, to estimate their contribution to genetic variance. Whether C. duclouxii is belonging to C. fargesii is controversial. Therefore, it is another objective of this study to clarify the relationship between C. duclouxii and C. fargesii. The results will contribute to improved understanding of the molecular regulation of adventitious rooting and the phylogeny of interspecies in Catalpa.
Materials and Methods
Plant materials
One hundred and eight Catalpa accessions are grown at the Catalpa germplasm repository of the Institute of Botany, Jiangsu Province and Chinese Academy of Sciences (GRC/CNBG). Of the 108 accessions, C. bungei “Yu1” and C. bungei “Jinsi” are cultivars, whereas the remaining 106 are wild relatives, including 82 C. bungei, four C. duclouxii, 11 C. fargesii, and 9 C. ovate accessions, collected from 5 provinces of China (Supplementary Table S1; Supplementary Data are available online at
Adventitious root parameter measurements
First, 3-year-old branches were taken from the 108 accessions in early March and then stored in sand until new shoots' height were 7–10 cm. Second, shoots were excised with one to two leaves. After excision, the bases of the shoots were dipped for 60 s in a solution with 3.0 g/L indole-3-butyric acid (Sigma, St. Louis, MO). The shoots were incubated on a rooting table under 80–90% relative humidity. Samples of C. bungei “Yu1” and C. bungei “Jinsi” were harvested at 0 (control), 1 (activation), 15 (callus formation), 35 (root formation), and 45 (root elongation) days after cutting (DAC). Basal parts (∼1.0 cm of the root zone) of the shoots were taken, immediately frozen in liquid nitrogen, and stored at −80°C for subsequent analysis.
Sixty days after excision, shoots were sampled for analysis of AR development. ARR, ARN, and MARL was measured. Three replicate experiments were performed in 2013 and again in 2016. For each replication, 10 plants for each accession were incubated on a rooting table. One-way analysis of variance (ANOVA) was conducted using SPSS statistics software (SPSS Statistics for Windows, version 17.0, released 2008; SPSS, Inc., Chicago, IL).
SSR marker genotyping
Genomic DNA was extracted from the leaves using a modified version of the cetyltrimethyl ammonium bromide method (Kabelka et al., 2002). Seventy gene-derived SSR markers were selected based on our transcriptome analysis (Wang et al., 2015). Polymerase chain reaction (PCR) amplification was carried out in 10 μL reaction mixtures. Amplification reactions were initiated with a predenaturing step (95°C for 5 min), followed by denaturing (95°C for 30 s), annealing (55°C for 45 s), extension (72°C for 60 s) for 32 cycles, and final extension at 72°C for 10 min. Amplified PCR products were separated on 8.0% denaturing polyacrylamide gels using a vertical electrophoresis device. SSR bands were visualized by the silver staining method. Information on primer sequences and PCR amplification conditions for each set of primers are listed in Supplementary Table S2.
All amplifications were scored as either 1 (a band present) or 0 (band absent). The alleles were coded A, B, C, and so forth in a decreasing size order for each band.
Genetic diversity and phylogenetic analysis
The number of alleles per locus (N a), genetic diversity, fixation index (FIS ), population genetic differentiation (Fst ), Nei's genetic distances, and analysis of molecular variance (AMOVA) were determined using GenALEx 6.5 (Peakall and Smouse, 2012). Nei's distance was used for the unrooted phylogeny reconstruction using a neighbor-joining method as implemented in MEGA 5.0 (Tamura et al., 2011). Polymorphism information content (PIC) values were determined using PowerMarker 3.25 (Liu and Muse, 2005).
The polymorphic bands of each marker were analyzed using the NTSYS-pc program (Rohlf, 2000). Cluster analysis was performed using the unweighted pair group method with arithmetic average (UPGMA) in the SAHN subprogram (Rohlf, 2000).
Population structure and association mapping
Genotyping data of 108 accessions were collected to estimate the most likely K value (Q matrix) using Structure 2.2 software (Pritchard et al., 2000). The optimal number of subpopulations (K) was inferred from 1 to 15, with 5 runs at each K. For each run, 10,000 burn-ins were performed followed by 10,000 Markov chain Monte Carlo simulations. A modal value of ΔK was used to assess the most likely K corresponding to the Q matrix (Evanno et al., 2005).
A mixed linear model was tested in TASSEL 2.1 (
Sequence analysis of WRKY genes
Sequences of WRKY genes from Arabidopsis thaliana, Sesamum indicum, Erythranthe guttata, Dorcoceras hygrometricum, Nicotiana sylvestris, Vitis vinifera, Brassica napus, Zea mays, O. sativa, Populus trichocarpa and Theobroma cacao were downloaded from the National Center for Biotechnology Information (NCBI;
The putative subcellular localization was analyzed using ProtComp version 9.0 software (
Real-time quantitative PCR analysis
Total RNA of C. bungei “Yu1” and C. bungei “Jinsi” was extracted using the TRIzol reagent according to the manufacturer's instructions (Invitrogen, Carlsbad, CA). RNA concentration was quantified using ultraviolet spectrophotometry and the quality was checked by electrophoresis in a 1% agarose gel. For each sample, 2 μg of total RNA was reverse transcribed into complementary DNA (cDNA) using Moloney Murine Leukemia Virus reverse transcriptase (Promega, Madison, WI). Reverse transcription was performed at 37°C for 60 min in a 20-μL reaction with a final denaturation step at 95°C for 5 min.
Primers were designed using Primer premier 51 (Supplementary Table S3) and synthesized by SIPUJIN (Nanjing, China). Reactions were carried out using SYBR Green PCR Master Mix (Roche Applied Science, Mannheim, Germany) in an ABI 7500 real-time PCR system (Applied Biosystems, Foster City, CA) with three replicates. The Actin gene from C. bungei was amplified as an internal control for data normalization. Reaction volumes of 25 μL contained 12.5 μL SYBR Green PCR Master Mix, 9.5 μL deionized H2O, 1 μL primers, and 2 μL cDNA. Amplification reactions were initiated with a predenaturing step (95°C for 10 min), followed by 40 cycles of denaturing (95°C for 10 s), annealing (60°C for 35 s), and extension (72°C for 35 s).
Three replicates of the quantitative PCR (qPCR) assay were performed for each gene. Data were processed using the 2−ΔΔCt method (Livak and Schmittgen, 2001).
Results
Gene-derived SSR markers and population structure
In our previous transcriptome analysis of AR formation in softwood cuttings, we identified 11,100 different expressed genes and 3999 SSR loci (Wang et al., 2015, 2016). Of the 3999 SSR loci, only 650 loci (16.25%) targeted to annotated different expressed genes. Therefore, in the present study, a total of 70 gene-derived SSR markers were selected from these 650 loci (Supplementary Table S2).
Among the 70 markers, 54 markers produced a total of 279 alleles from the 108 accessions (Supplementary Table S4). The alleles per locus ranged from two (CBG020, CBG034, CBG036, CBG037, CBG050, and CBG058) to nine (CBG009, CBG011, CBG012, and CBG027) with a mean of 5.17 (Supplementary Table S4). The mean genetic diversity was 0.55, ranging from 0.35 (CBG036) to 0.73 (CBG012) (Supplementary Table S4). The mean PIC was 0.68, ranging from 0.25 (CBG036) to 0.87 (CBG011) (Supplementary Table S4). Forty-six markers (85.16%) had high genetic information (PIC > 0.5), seven (12.96%) showed moderate genetic information (0.5 > PIC > 0.25), and one (1.85%) slight genetic information (PIC < 0.25).
In the present study, the value of ΔK for the 108 Catalpa accessions was highest when the number of populations was set at 7, suggesting that these accessions can be grouped into seven subpopulations, herein denoted as Pop1 to Pop7 (Fig. 1A). Genetic relationships among most of the accessions were further supported by UPGMA clustering analysis (Fig. 1B).
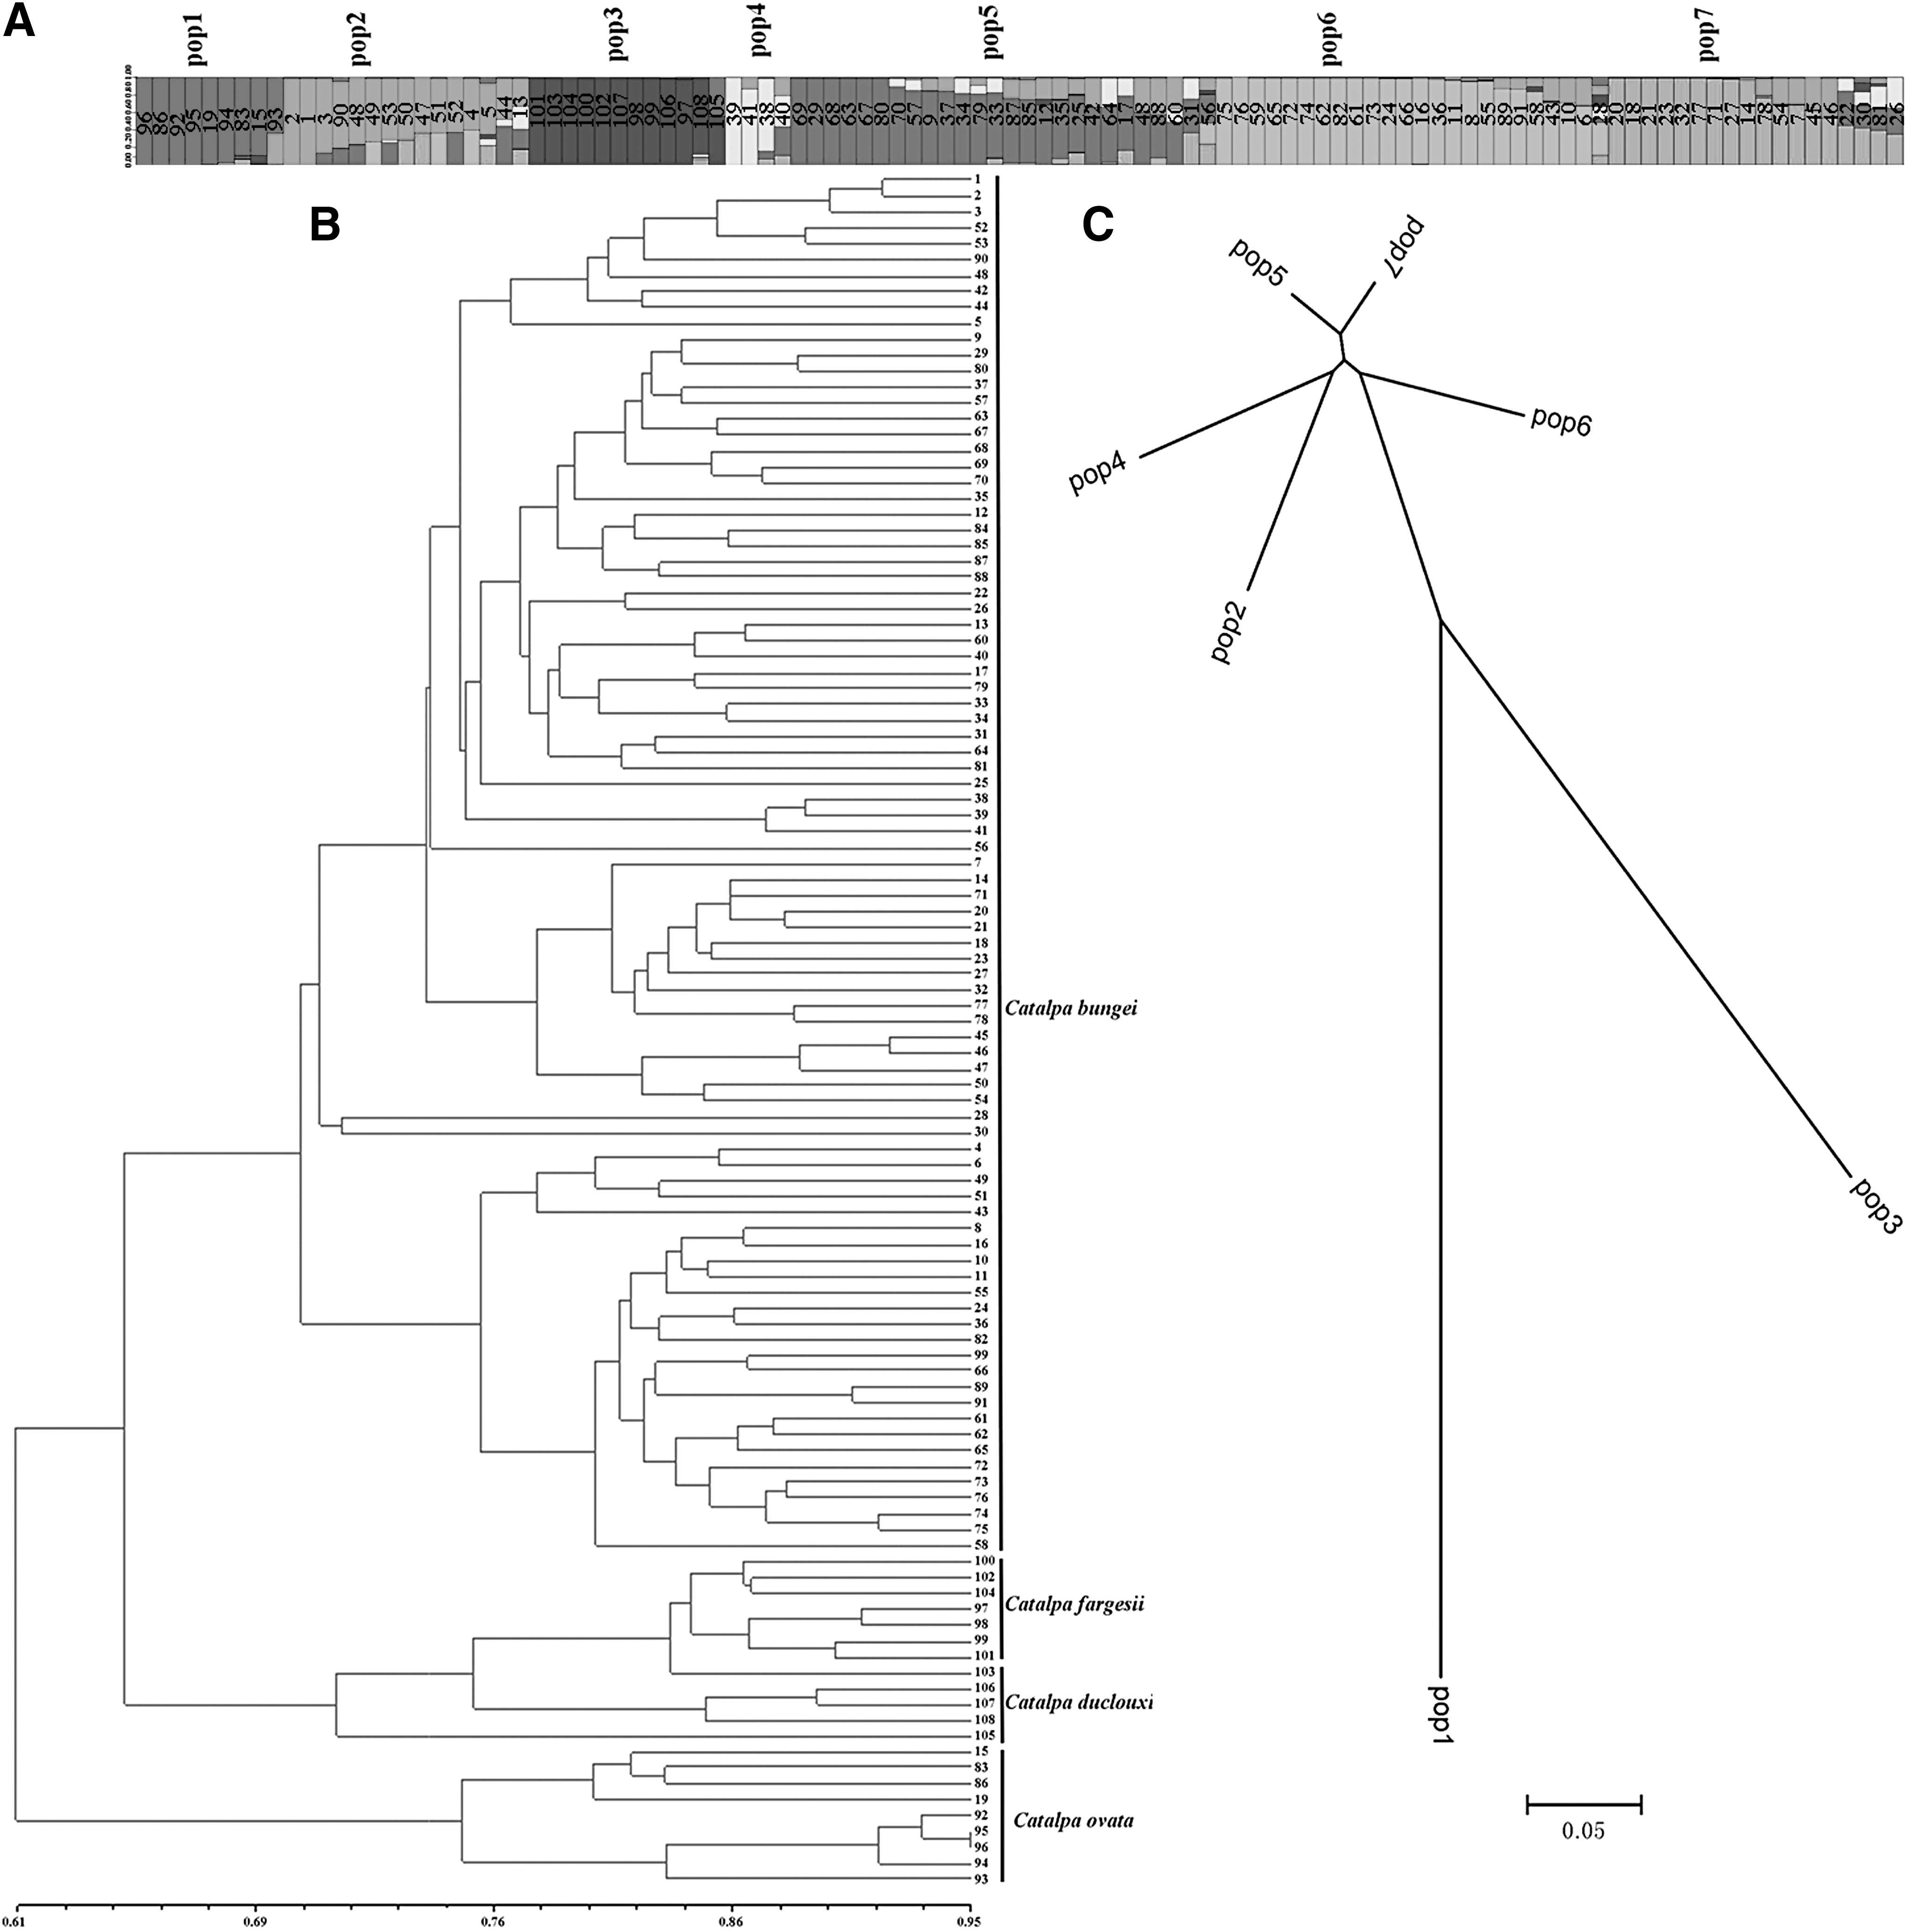
Population structure and genetic diversity of 108 Catalpa accessions based on 54 gene-derived SSRs.
According to the membership pattern when K = 7, the 9 accessions in Pop1 belonged to C. ovata, the 12 accessions in Pop3 to C. fargesii and C. duclouxii, and the 87 accessions in Pop2 (n = 15), Pop4 (n = 4), Pop5 (n = 26), Pop6 (n = 24), and Pop7 (n = 18) to C. bungei (Fig. 1A). Furthermore, among the 12 accessions in Pop3 (4 accessions belonging to C. duclouxii and 8 accessions belonging to C. fargesii), only 2 accessions, both belonging to C. fargesii, were admixed with C. ovata or C. bungei (Fig. 1A).
AMOVA results indicated that 28% (p < 0.001) of the total genetic variation was partitioned among groups and 72% (p < 0.001) within groups (Supplementary Table S5). The Fst value of each locus ranged from 0.03 to 0.43 with mean Fst of 0.17 (Supplementary Table S4). The pairwise Fst values ranged from 0.02 (between Pop5 and Pop7) to 0.19 (between Pop1 and Pop3), with mean pairwise Fst of 0.10 (Table 1). The Nei's genetic distance agreed with the Fst value among the seven subpopulations. The greatest genetic distance (0.74) was between Pop1 and Pop3, whereas Pop5 showed the smallest genetic distance (0.05) from Pop7 (Table 1). As expected, the greatest pairwise Fst value or the Nei's genetic distance was detected between different species (Table 1). Among accessions within the C. bungei species, the greatest Nei's genetic distance was found between Pop4 and Pop6 (Table 1).
Pairwise Estimates of Fst and Nei's Genetic Distance Based on 54 Gene-Derived Simple Sequence Repeat Loci Among the Seven Model-Based Subpopulations
Pairwise Fst appears above the diagonal and genetic distance estimates appear below the diagonal.
Fst , population genetic differentiation; Pop, population.
Based on the pairwise Nei's genetic distances, a neighbor-joining tree of the seven subpopulations was constructed (Fig. 1C). The subpopulations could be clustered into three groups. The subpopulations Pop2, Pop4, Pop5, Pop6, and Pop7 formed group I, whereas Pop1 and Pop3 belonged to group II and group III, respectively (Fig. 1C). The genetic relationships among the subpopulations are largely concordant with those revealed in Figure 1B.
Phenotypic evaluations
The mean value, maximum value, minimum value, kurtosis, and skewness for each trait measured in 108 accessions were calculated and are listed in Table 2. Continuous distributions were observed in all three traits of adventitious rooting ability, based on the skewness and kurtosis statistics (Table 2). ANOVA analysis showed that differences among accessions for each trait were highly significant (p < 0.01), indicating that a large amount of genetic variation existed in the population.
Phenotypic Characteristics for Rooting Ability in 108 Catalpa Accessions
ARN, adventitious root numbers; ARR, adventitious root rating; MARL, maximal adventitious root length; SD, standard deviation.
There existed variances between 2013 and 2016 for the three traits, and the extent of variance varied with traits. The mean of ARR over the 108 accessions was 47.68% and 52.25% in 2013 and 2016, respectively (Table 2). The mean of ARN was 6.04 and 5.87 in 2013 and 2016, respectively (Table 2). The mean of MARL was 6.54 and 7.58 cm in 2013 and 2016, respectively (Table 2).
LD and association mapping of candidate genes
In the present study, 54 SSR markers generated 279 genetic loci and 38,781 pairs to evaluate LD. Across all accessions, 25,371 pairs (65.42%) showed LD (based on D′, p < 0.01) after Bonferroni correction. At the whole population level, the r2 values among all the SSR pairs ranged from 0.057 to 0.97 with a mean of 0.22. The percentage of linked markers with r2 > 0.5 was 8.89%, and the percentage of linked markers with D′ > 0.5 was 78.56%.
Mixed linear model analysis of marker–trait associations revealed that four markers (CBG010, CBG056, CBG063, and CBG068) were associated with ARR, ARN, or MARL in 2013 and 2016 (Table 3). The marker CBG010 was associated with ARN with phenotypic variation explained (PVE) values of 10.77% and 10.13% in 2013 and 2016, respectively (Table 3). The marker CBG056 was associated with ARR and ARN in 2013, whereas it was associated with MARL in 2016 (Table 3). Its PVE ranged from 11.43% to 18.49% (Table 3). The marker CBG063 was associated with ARR only in 2013, with PVE value of 13.35%. The marker CBG068 was associated with ARR only in 2016, with PVE value of 17.64% (Table 3). All four markers were identified from four unigenes that were homologous with Arabidopsis genes (Supplementary Table S2). Therefore, these four unigenes might be candidate genes for roles in controlling adventitious rooting ability.
Percentage of Phenotypic Variation Explained by Associated Markers for Three Traits (p < 0.01)
PVE, phenotypic variation explained.
To further validate the relationship between the four unigenes and rooting ability, qPCR analysis was performed with specific primers. As shown in Supplementary Table S6, the rooting ability of C. bungei “Yu1” was significantly greater (p < 0.01) than that of C. bungei “Jinsi.” As expected, the expression of all four unigenes at two or three stages of AR formation increased more than twofold compared with the control (Fig. 2). Most notably, the relative expression of the unigene WRKY22 increased 42-fold at 45 DAC over that observed at 0 DAC in C. bungei “Yu1,” and the relative expression of the same gene increased 12-fold at 45 DAC over that observed at 0 DAC in C. bungei “Jinsi” (Fig. 2). Meanwhile, the relative expression of this gene at 45 DAC was 3.5-fold higher in C. bungei “Yu1” than that observed in C. bungei “Jinsi” (Fig. 2). These results suggested that the gene expression increased with greater rooting ability. Therefore, the unigene WRKY22, named CbNN1 (Genbank ID: AMP82887), might be an important candidate gene for control of rooting ability.
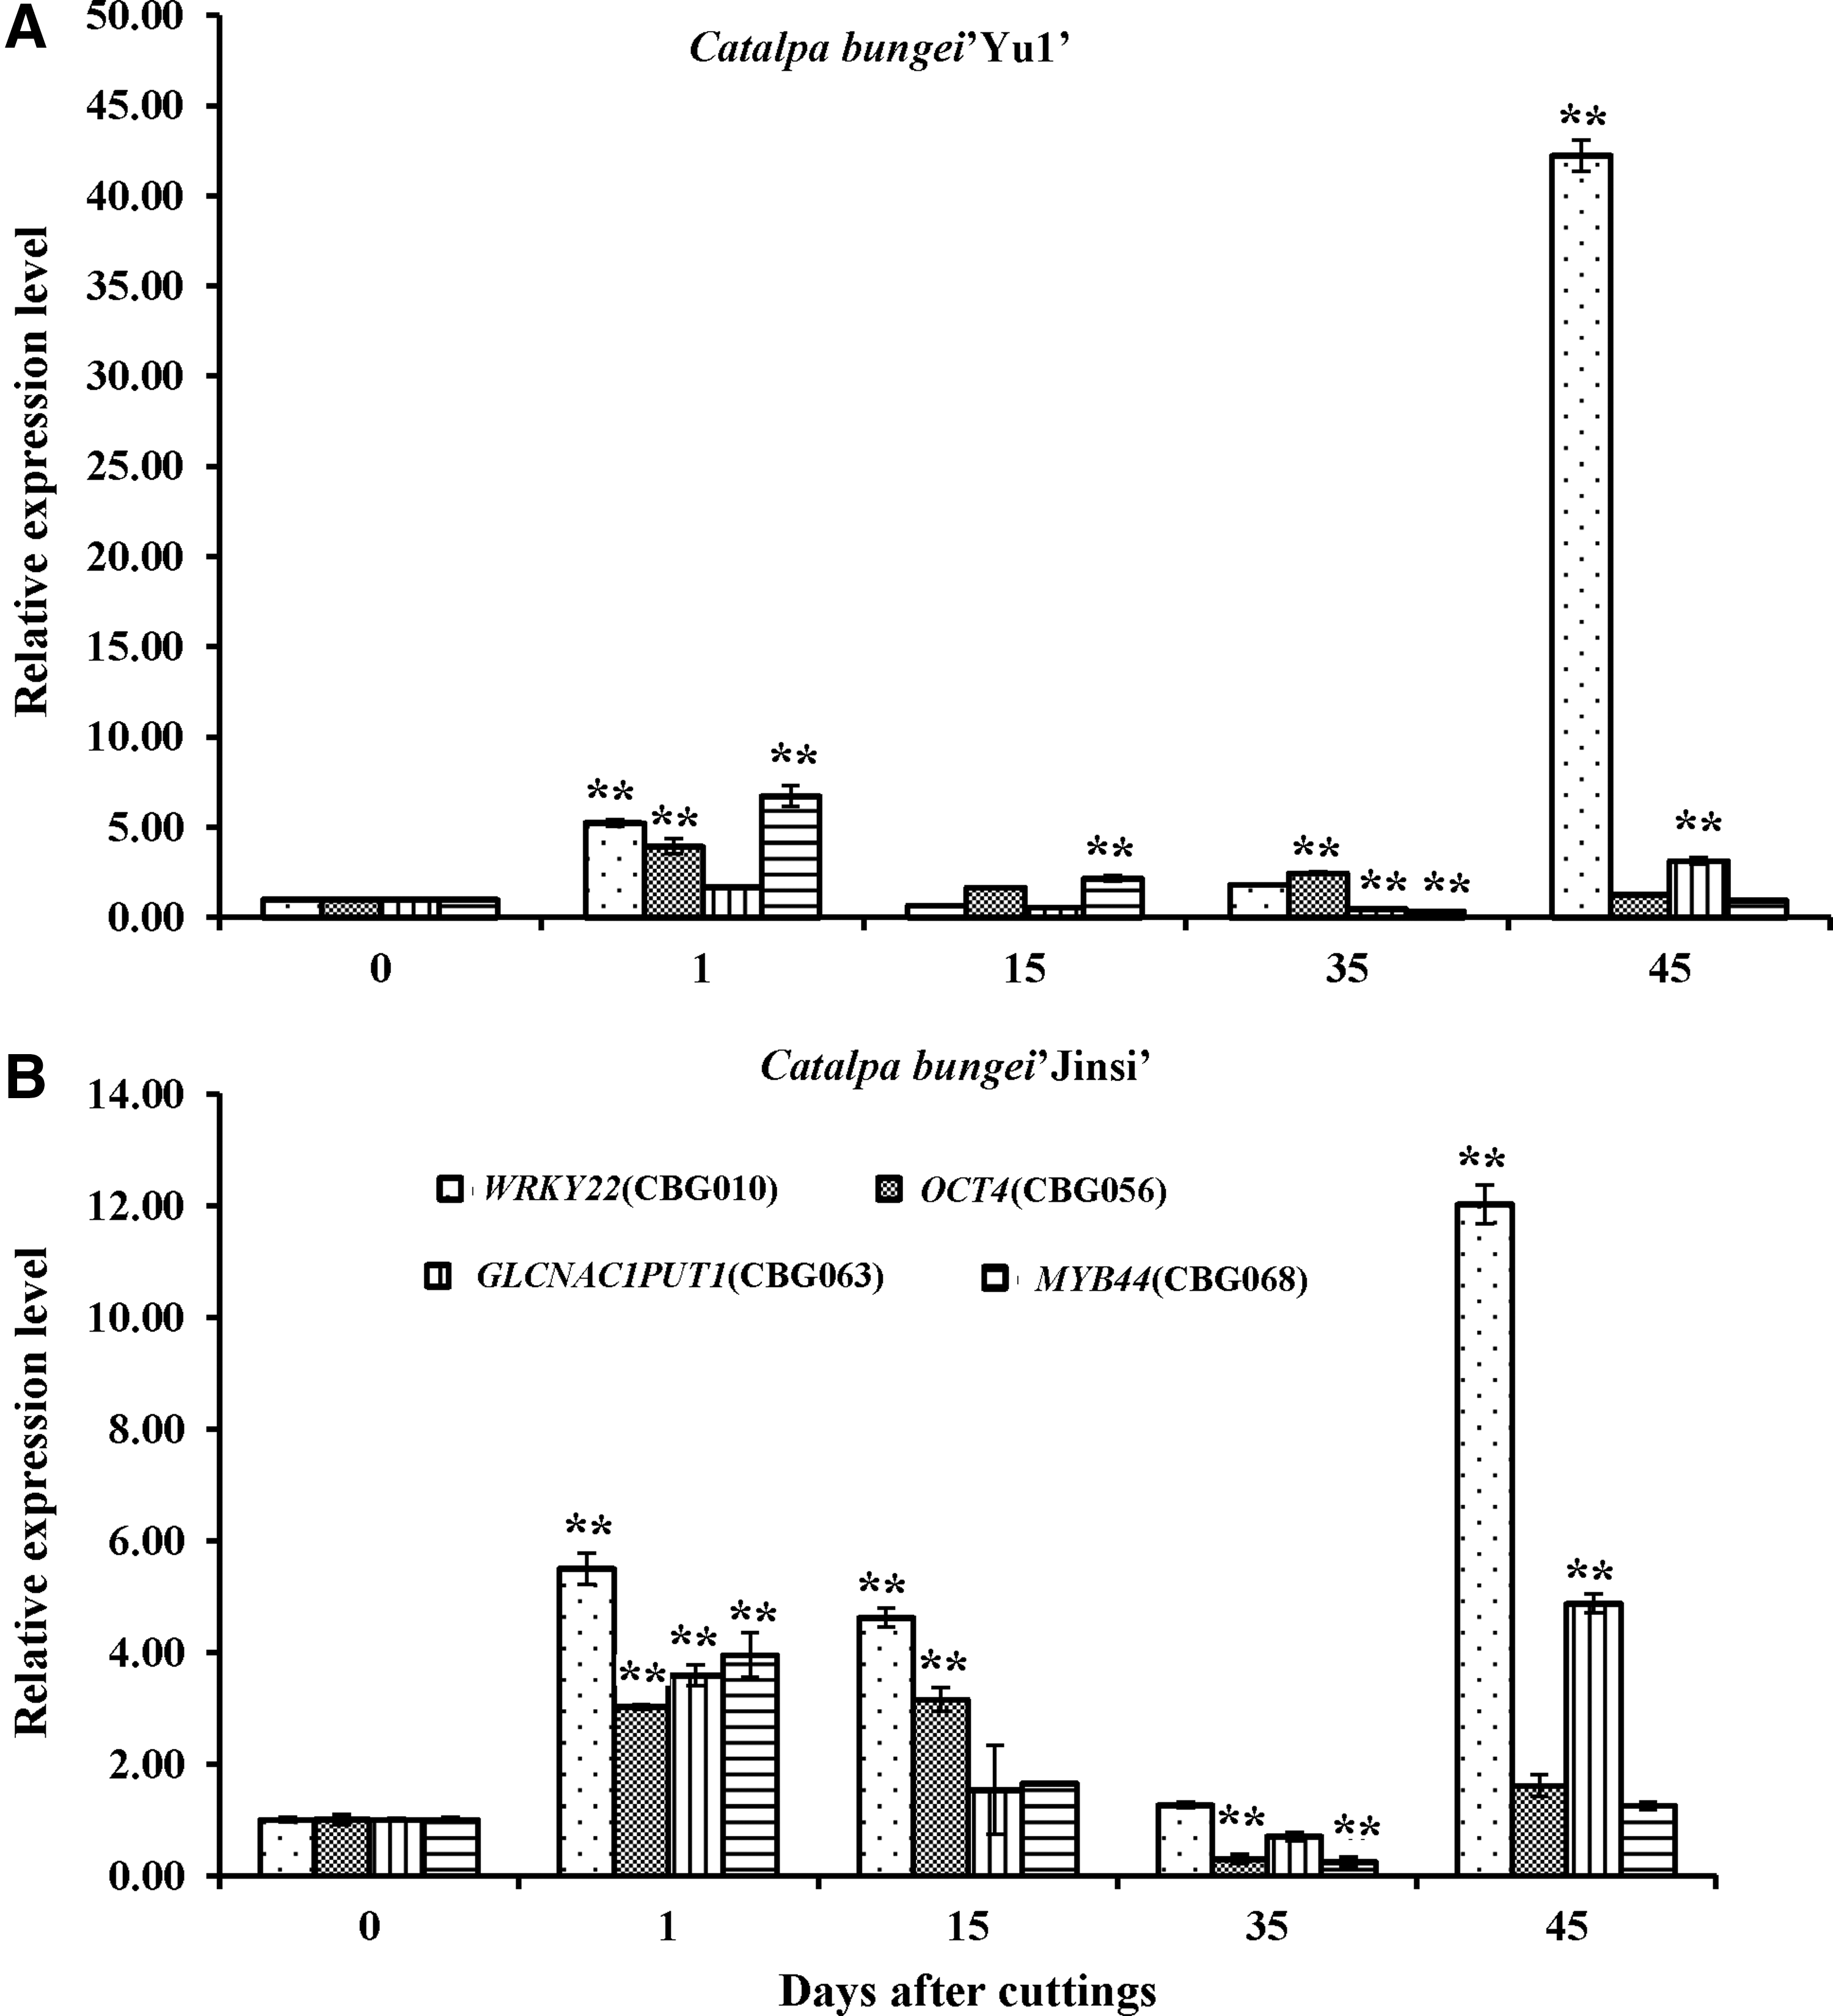
Expression of four candidate genes associated rooting capability in Catalpa bungei “Yu1”
Sequence and expression analysis of CbNN1
The open reading frame of CbNN1 was 1056 bp in length, encoding 352 amino acids with a molecular weight of 38.86 kDa and a pI of 6.32. The instability index and GRAVY were 66.14 and −0.72, respectively, suggesting that it is a hydrophilic unstable protein. Subcellular location analysis indicated that it was located in the nucleus and this was further supported by the presence of NLS (PRSKRRKNH) (Fig. 3A). WRKY proteins can be classified into three groups according to their WRKY domains and zinc-finger motifs: Group 2 proteins have a single WRKY domain and a C2H2 zinc-finger motif (Eulgem et al., 2000). CbNN1 has only one WRKY domain and an extended zinc-finger motif of CX5CX23HX1H. Therefore, it belongs to Group 2 (Fig. 3A). Sequence analysis revealed that it shared 62% identity with SiWRKY22 (Fig. 3B). Based on the results of analysis with SOPMA software, its protein structure comprised random coil as the most common type (52.27%), followed by an alpha helix motif (25.85%), extended strand (16.19%), and beta turn (5.68%) (Supplementary Fig. S1).
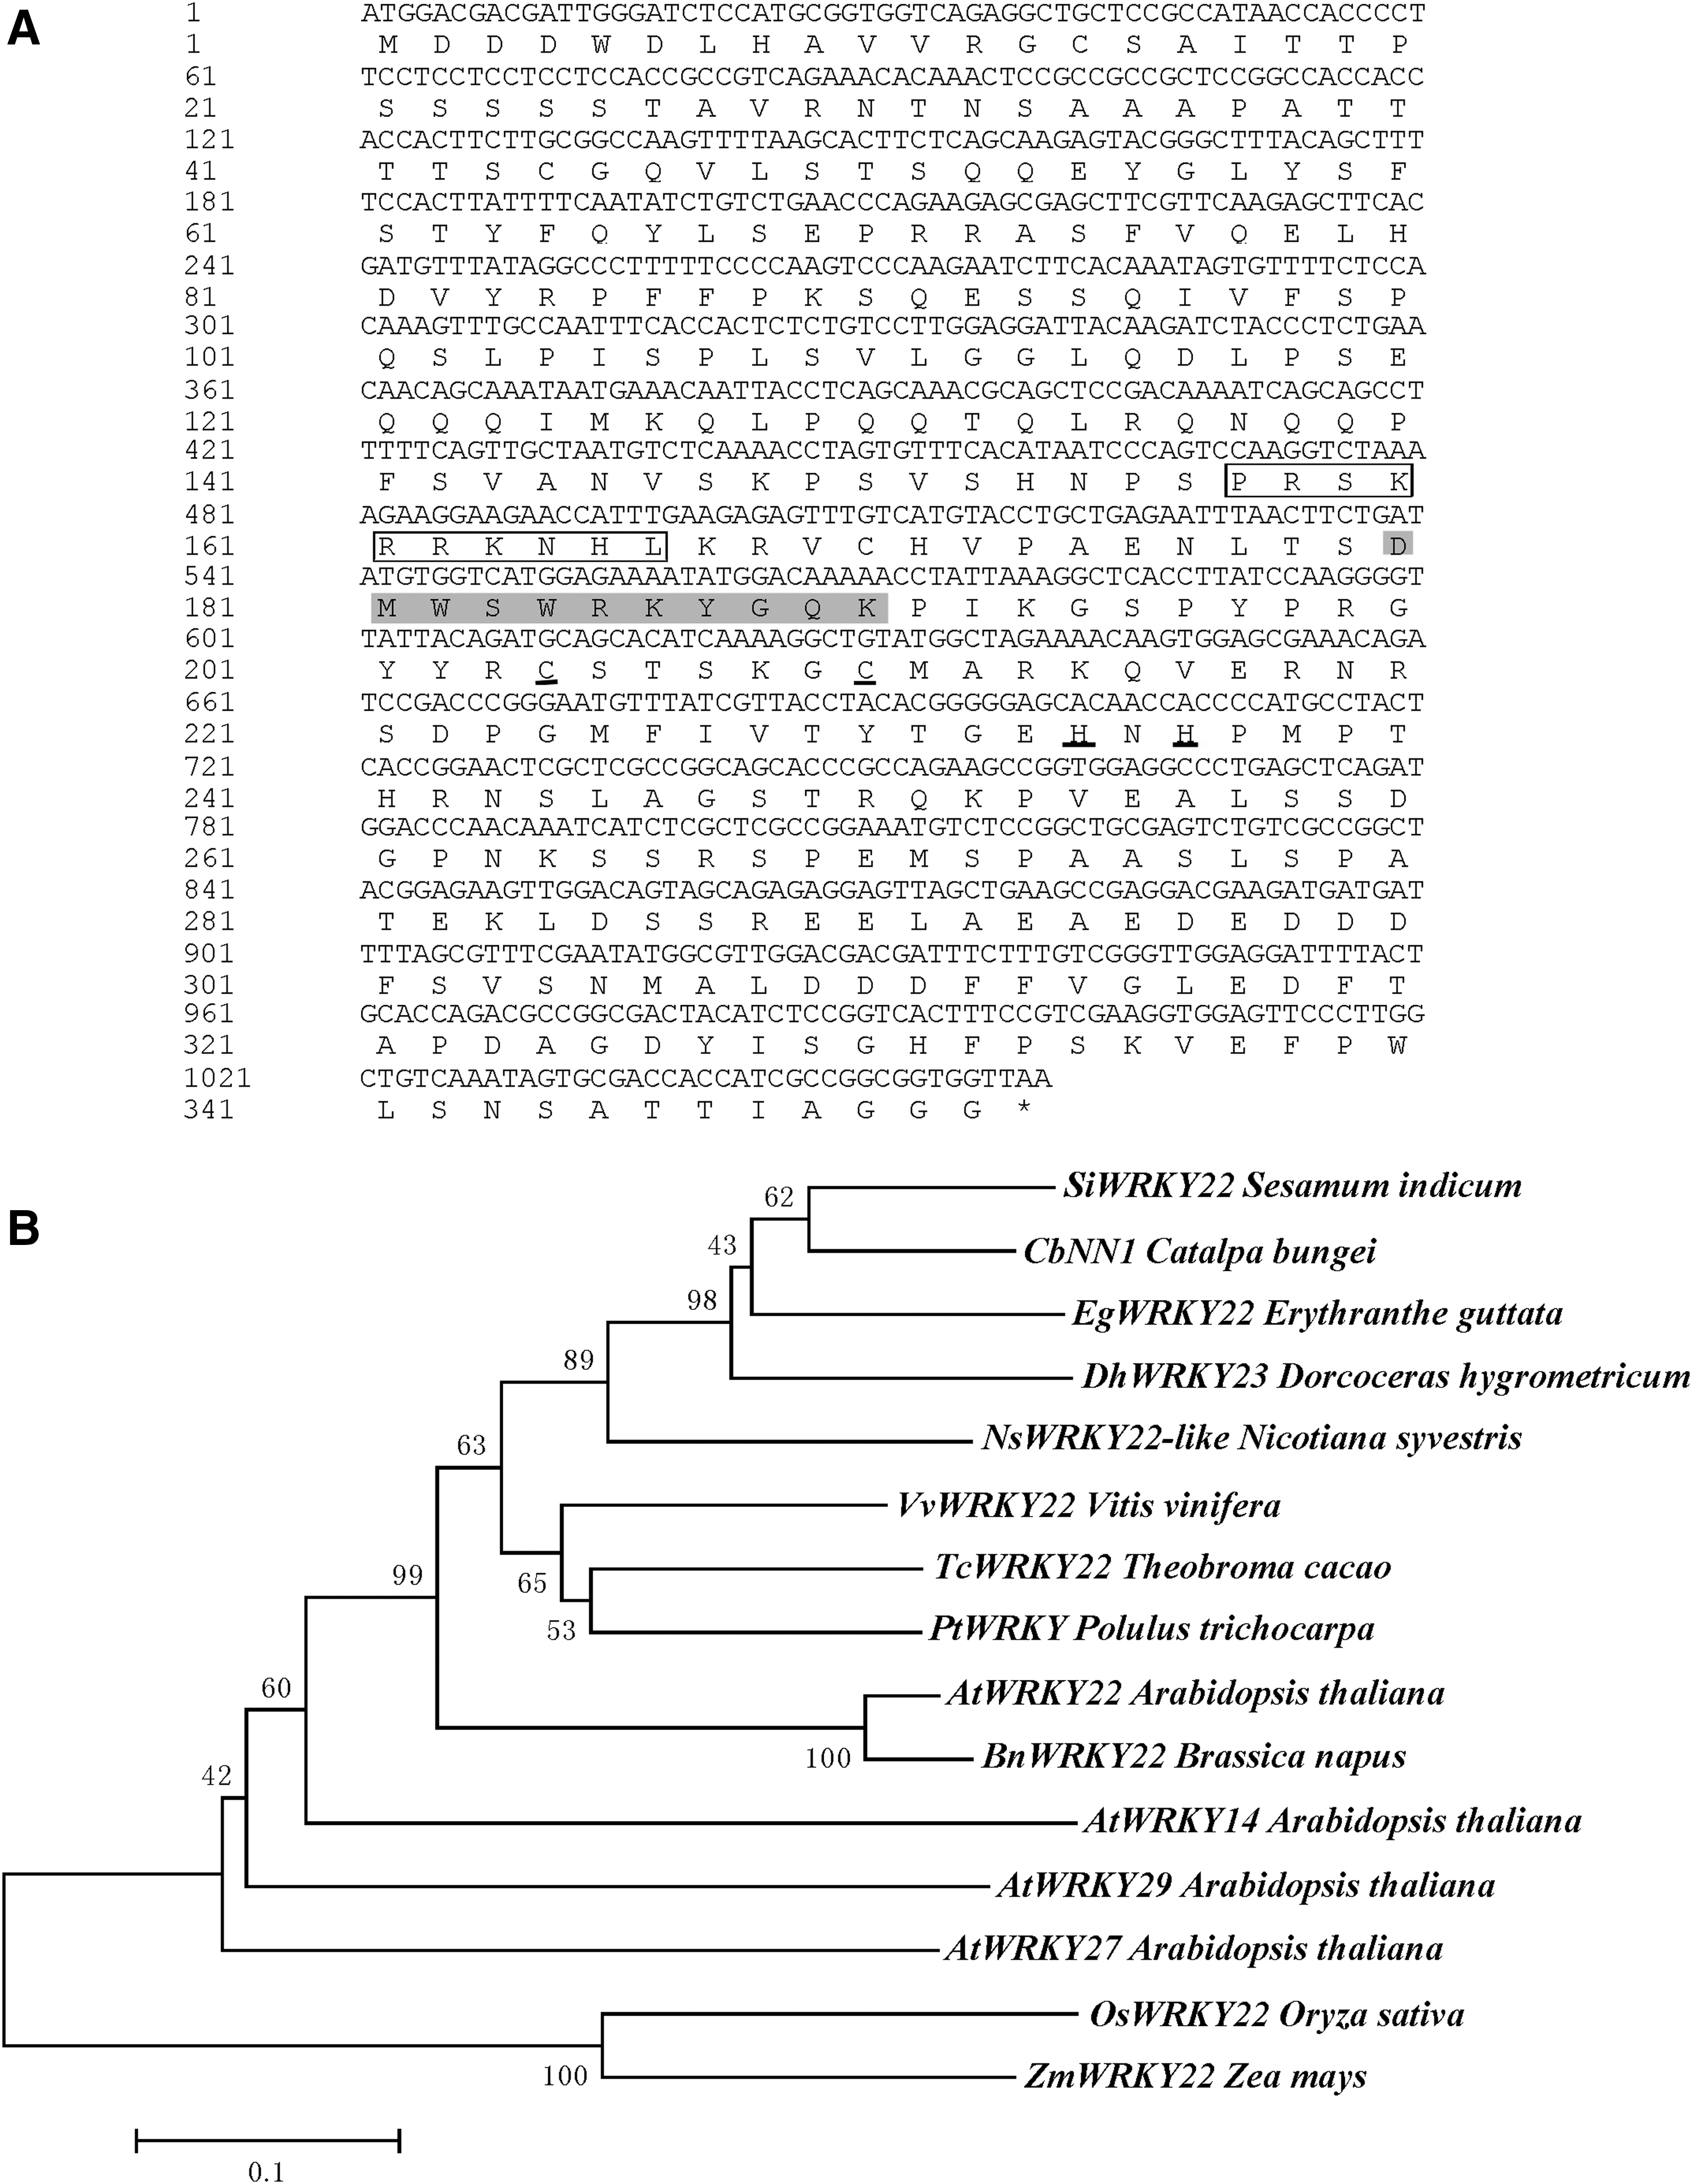
The amino acid sequence analysis
Next, the expression of the gene CbNN1 in different tissues of C. bungei “Yu1” and C. bungei “Jinsi” was evaluated (Fig. 4). CbNN1 transcript was detected in all four tissues with highest levels in the root of both cultivars (Fig. 4). The relative expression of CbNN1 in the root of C. bungei “Yu1” was significantly higher than in C. bungei “Jinsi.” In contrast, the relative expression of CbNN1 in xylem, leaf, and phloem of C. bungei “Yu1” was significantly lower than in C. bungei “Jinsi” (Fig. 4). These results suggested that the gene CbNN1 may play an important role in AR formation in C. bungei.
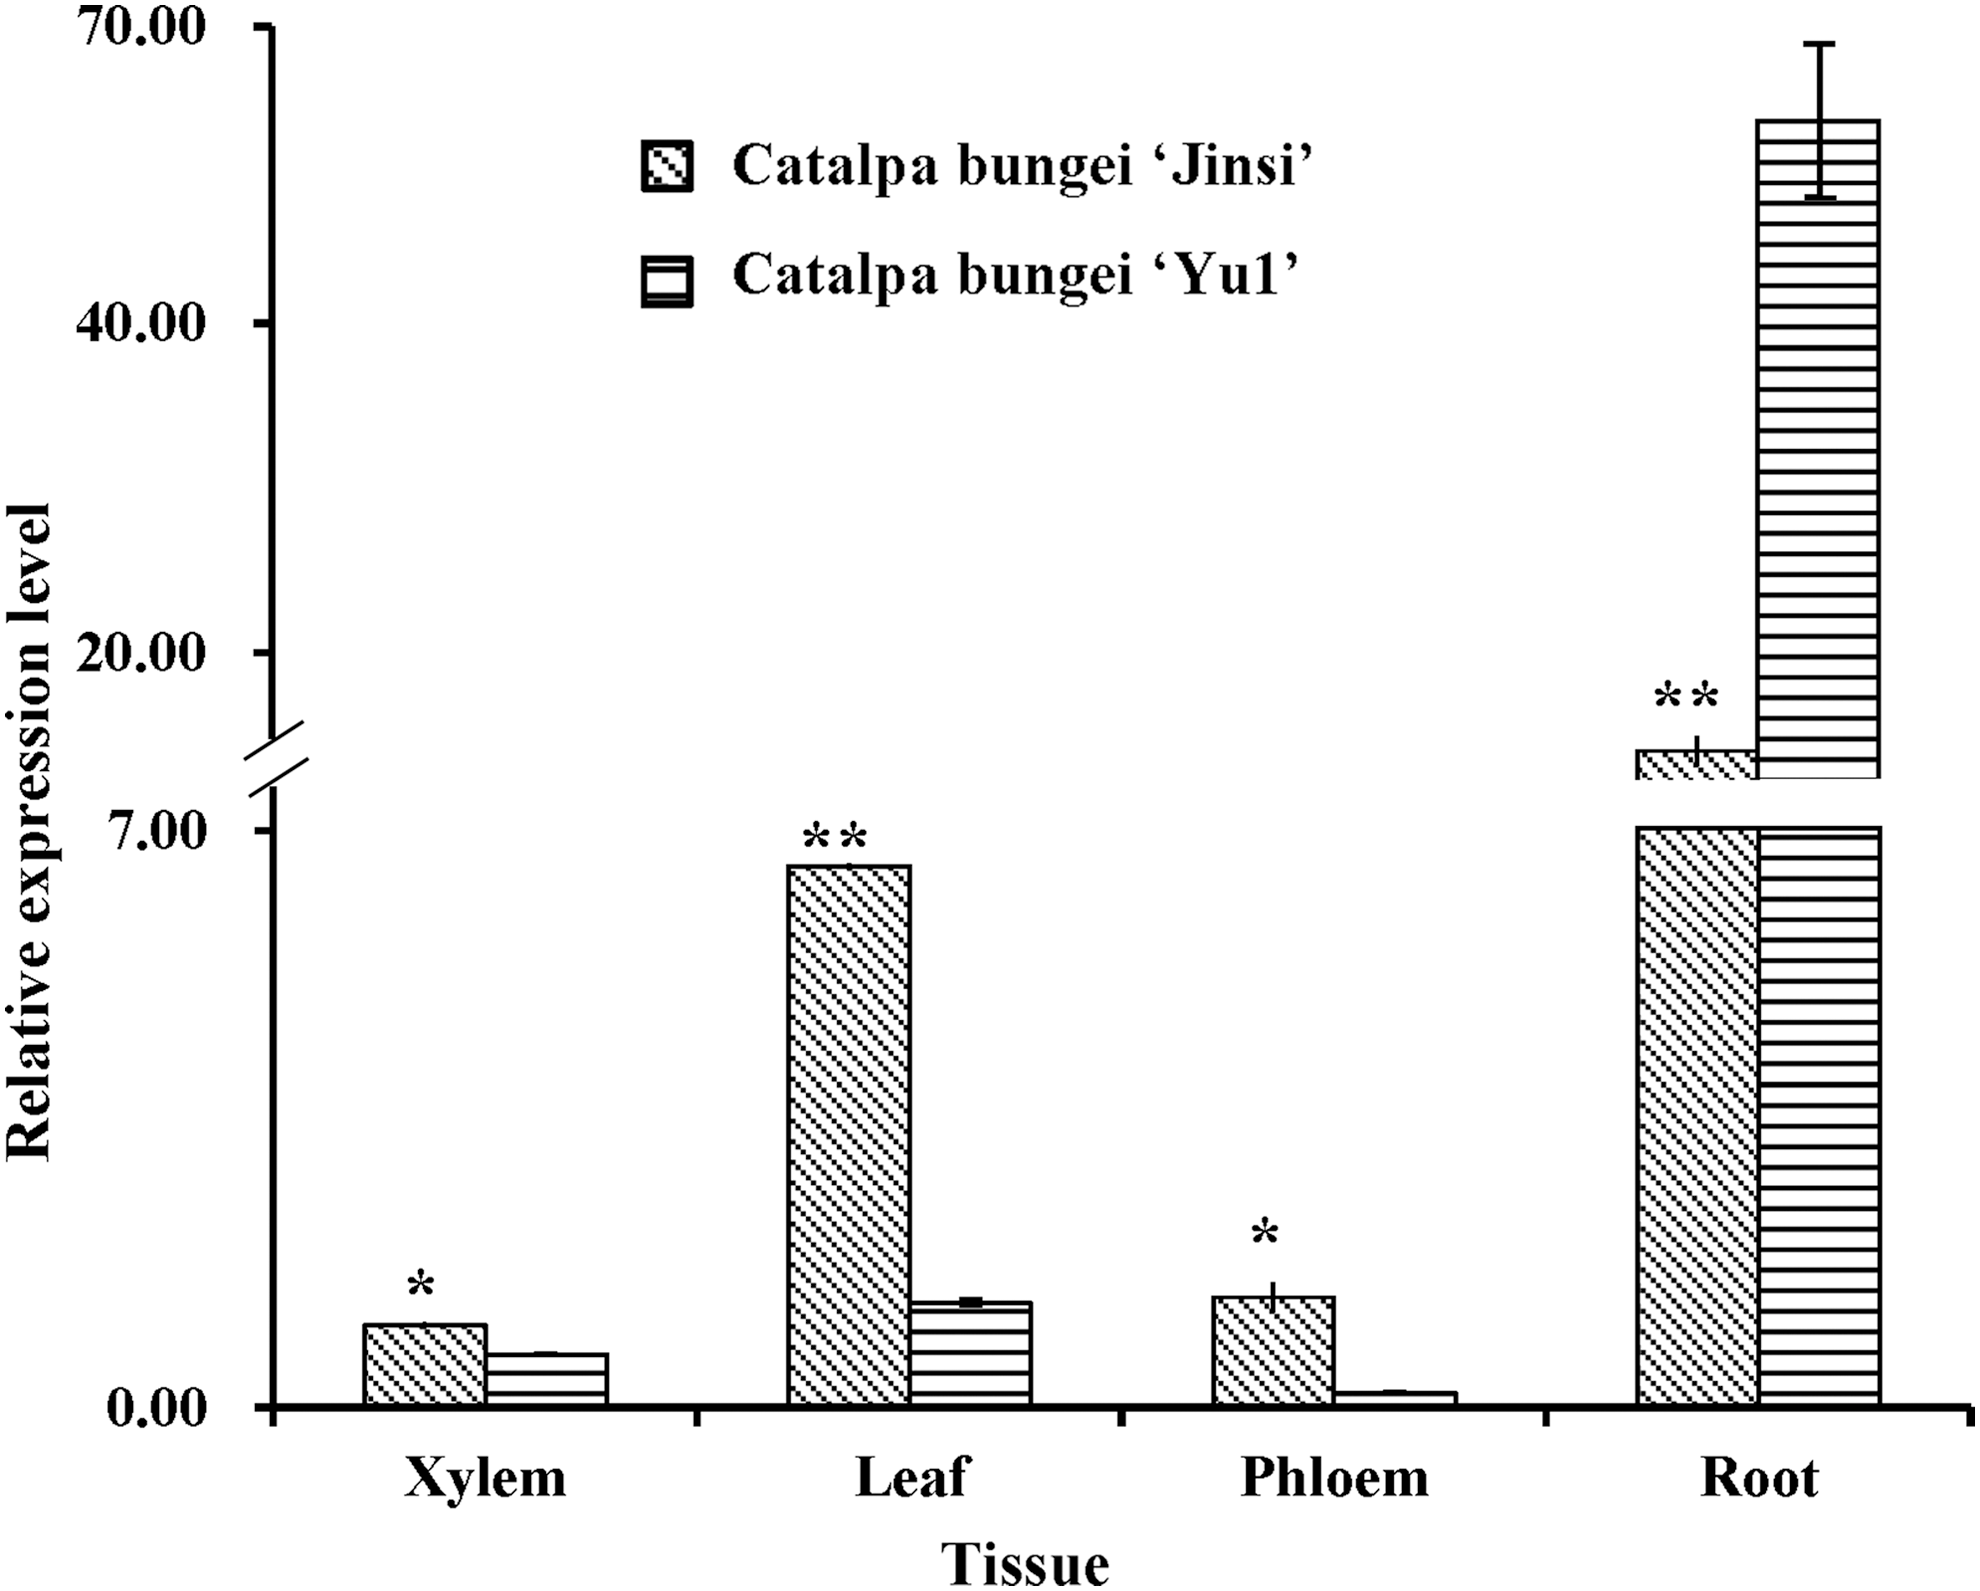
The expression levels of CbNN1 in different tissues in C. bungei “Yu1” and C. bungei “Jinsi.” The Actin gene from C. bungei was amplified as an internal control for data normalization. Each value represents the mean of three independent replicates ± SD. Significant difference at *p < 0.05 and **p < 0.01.
Discussion
Molecular evidence for C. duclouxii belonging to C. fargesii
Whether C. duclouxii is an independent species is controversial. C. duclouxii was described by Dode (1907) and differs from C. fargesii in the glabrous leaf undersurface and inflorescence, and the more branched inflorescence. The characteristics of the two species were so similar that C. duclouxii was treated as a form of C. fargesii (Gilmour, 1936). Subsequently, C. duclouxii was classified as belonging to C. fargesii (Zhang and Santisuk, 1998). However, the close relationship of C. duclouxii and C. fargesii was not supported by an analysis based on the sequences of the internal transcribed spacers of nuclear ribosomal DNA of 12 accessions of Catalpa (Li, 2008).
In the present study, 4 accessions belonging to C. duclouxii and 8 belonging to C. fargesii were grouped into Pop3 and formed 1 clade, according to the analysis of 54 gene-derived SSR markers (Fig. 1). Moreover, among the 12 accessions in Pop3, only 2 accessions were admixed with C. ovata or C. bungei (Fig. 1). Therefore, our results support the notion that C. duclouxii belongs to C. fargesii.
The first report of QTLs for AR formation detected using association mapping in Catalpa Scop.
Association mapping is an effective approach to connecting structural genomics and phenotype in plants (Thornsberry et al., 2001). Choice of appropriate germplasm is important for the success of association mapping. The group of individuals should be selected from a natural population or germplasm collection with a wide genetic diversity (Cao et al., 2012). The average PIC value of 334 Gossypium hirsutum variety accessions from three ecotypes was 0.082 (Abdurakhmonov et al., 2008). In another study, the genetic diversity and identity of 104 landraces from the National Clonal Germplasm Repository of Peach Center (Zhengzhou) that consisted of 6 ecotypes were evaluated and the PIC values varied from 0.23 to 0.52 (Cao et al., 2012).
In the current study we used 108 accessions, including 2 cultivars and 106 wild accessions from 5 provinces of China (Supplementary Table S1). The average genetic diversity was 0.55 and the average PIC was 0.68 (Supplementary Table S4). Forty-six markers (85.16%) had high genetic information (PIC > 0.5) and seven (12.96%) moderate genetic information (0.5 > PIC > 0.25). The PIC value across all accessions in the present study was higher than those reported in earlier work, indicating that our germplasm had higher genetic diversity.
The earliest attempts to detect QTLs for AR formation used mainly Eucalyptus by linkage mapping (Grattapaglia et al., 1995; Marques et al., 1999). Subsequently, the main QTL that explained 66% of the phenotypic variance in rooting was detected in an F2 population of Corymbia torelliana × Corymbia citriodora (Shepherd et al., 2008). Recently, one main QTL for rooting rate that explained 66% of the genetic variance and 57% of the phenotypic variance was found in an F1 population of Malus prunifolia × Malus sieboldii (Moriya et al., 2015). Six QTLs for rooting percent and root length, located on five chromosomes and which explained 12.0–14.7% of the phenotypic variance, were detected in an interspecific cross F1 population of Eucalyptus tereticornis × Eucalyptus camaldulensis (Sumathi et al., 2018). These results might suggest that a few strong or several moderate QTLs are responsible for the high rooting capability in woody species.
Until now, there have been no reports of QTL detection for AR formation using association mapping in woody plants. Based on the higher genetic diversity of the germplasm, a total of four markers associated with ARR, ARN, and MARL were detected and explained 10.13–18.49% of the phenotypic variance (Table 3). Among the four markers, CBG010 and CBG056 were both associated with AR traits in both years (Table 3). These results suggest that several moderate QTLs are responsible for the high rooting capacity in Catalpa Scop and agree with the previous studies that used the linkage mapping to detect the QTLs for AR formation. To our knowledge, this is the first report of QTLs for AR formation being detected using association mapping in Catalpa Scop.
The candidate WRKY transcription factor gene CbNN1 might play a positive role in AR formation
WRKY appears to be a complex family of transcription factors that play important roles in the regulation of adventitious and LR formation and responses to biotic and abiotic stresses (Abbruscato et al., 2012; Moriya et al., 2015; Wu et al., 2017; Wang et al., 2018). Triticum aestivum WRKY51 RNAi plants produced fewer LRs than the wild type, whereas the TaWRKY51 overexpression lines had the opposite phenotype (Hu et al., 2018). In the present study, the marker CBG010 was associated with ARN with PVE values 10.77% and 10.13% in 2013 and 2016, respectively (Table 3). The marker was identified from the unigene comp100607_c0, homologous with AtWRKY22 (Supplementary Table S2). Therefore, the unigene comp100607_c0, named CbNN1 (GenBank ID: AMP82887), might be an important candidate gene controlling AR formation.
In a previous study, AtWRKY22 had been reported to be involved in biotic and abiotic stress. AtWRKY22 is rapidly induced after 1 h of submergence treatment and had the highest raw-intensity induction of all the submergence-responsive WRKY genes (Hsu et al., 2013). AtWRKY22 also regulates dark-induced leaf senescence, promotes susceptibility to aphids, and modulates salicylic acid and jasmonic acid signaling (Zhou et al., 2011; Kloth et al., 2016). In the present study, the expression of CbNN1 was higher in a cultivar with greater rooting ability (Fig. 2). While CbNN1 transcript was detected in all four organs tested, the highest levels were found in the root of both C. bungei “Yu1” and C. bungei “Jinsi” (Fig. 4). The expression of CbNN1 in the root of C. bungei “Yu1” was significantly higher than in C. bungei “Jinsi.” These results suggest that CbNN1 plays an important role in AR formation in C. bungei.
Conclusions
AR formation is controlled by QTL genes (Moriya et al., 2015; Druege et al., 2016; Sumathi et al., 2018; Xu et al., 2018). In this study, for the first time, we used association mapping to identify four genes associated with AR formation in Catalpa Scop. among 54 DEGs. Among the four candidate genes, a novel WRKY transcription factor gene, involved in AR formation, was isolated and characterized. In addition, our research provides molecular evidence for the close relationship of C. duclouxii and C. fargesii.
Footnotes
Acknowledgments
This work was supported by Key R&D Program of Jiangsu Province (Modern Agriculture; Grants No. BE2016384, BE2017372) and Natural Science Foundation of Jiangsu Province (Grants No. BK20161382).
Disclosure Statement
No competing financial interests exist.
1
References
Supplementary Material
Please find the following supplemental material available below.
For Open Access articles published under a Creative Commons License, all supplemental material carries the same license as the article it is associated with.
For non-Open Access articles published, all supplemental material carries a non-exclusive license, and permission requests for re-use of supplemental material or any part of supplemental material shall be sent directly to the copyright owner as specified in the copyright notice associated with the article.