
Abstract
As a common malignancy in women, cervical squamous cell carcinoma is a major cause of cancer-related mortality globally. Recent studies have demonstrated that long non-coding RNA (lncRNA) can function as potential biomarkers in cancer prognosis; however, little is known about its role in cervical cancer. In this study, we downloaded the gene expression profiles along with the clinical data of patients with cervical squamous cell carcinoma from The Cancer Genome Atlas. By applying bioinformatics analysis including random forest selection and Least Absolute Shrinkage and Selection Operator (LASSO) cox regression model along with 10-fold cross-validation, we constructed a 26-lncRNAs risk model that can be used to predict the overall survival of cervical squamous cell carcinoma. After that, Kaplan–Meier analysis combined with log-rank p test was applied to assess the predictive accuracy of the 26-lncRNAs risk model. Further analysis showed that the prognostic value of 26-lncRNAs risk model was independent of other clinicopathological factors. At last, lncRNAs in the model were put into gene ontology biological process enrichment and Kyoto Encyclopedia of Genes and Genomes (KEGG) signaling pathways analysis, which suggested that these lncRNAs might contribute to cancer-associated processes such as cell cycle and apoptosis. This study indicated that lncRNAs signature could be a useful marker to predict the prognosis of cervical squamous cell carcinoma.
Introduction
As the second most common gynecologic cancer worldwide, cervical cancer is characterized as a progressive process from low-grade squamous intraepithelial lesion to high-grade squamous intraepithelial lesion and eventually to invasive carcinoma (Thrall et al., 2010; Torre et al., 2015). Although the morbidity and mortality of cervical cancer have declined in the past 30 years, the 5-year survival rate of advanced-stage patients is still <40% (Eggleston et al., 2006). A large number of cervical cancers are squamous cell carcinomas, which is the second most common cancer in females (Caffarel and Coleman, 2014). Infection with certain types of the human papillomavirus is demonstrated to be the greatest risk factor for cervical squamous cell carcinoma, but viral infection alone is not sufficient for carcinogenesis and cancer development (Moody, 2010). Hence, more and more studies began to explore whether genomic factors could be the indicators for the prognosis of cervical squamous cell carcinoma.
Long noncoding RNAs (lncRNAs) are a subgroup of RNAs that consist of >200 nucleotides in length and contribute to biological functions such as chromatin remodeling, transcription, and post-transcriptional processing, as well as regulation of gene expression (Wang et al., 2014). Aberrant expression levels of lncRNAs are demonstrated to be associated with the diagnosis and prognosis of various human cancers (Ma et al., 2018; Zhang et al., 2018).
Recently, bioinformatics analysis based on high-throughput platforms emerges as a promising and efficient tool to identify biomarkers for diagnosis and prognosis of cancer (Gao et al., 2018). Screening of tumor biomarkers based on microarray data from Gene Expression Omnibus (GEO) and The Cancer Genome Atlas (TCGA) data has recently revealed a series of highly specific and sensitive markers (Wu et al., 2017). A series gene signature associated with cancer prognosis was identified by integrated analysis of GEO and TCGA. For example, secreted phosphoprotein 1 was identified as a promising biomarker to predict clinical outcome of lung adenocarcinoma individuals through analyzing four lung adenocarcinoma data sets in GEO database and validating by the TCGA database (Li et al., 2018a). Network-based meta-analysis identified fibronectin 1 and tumor necrosis factor receptor-associated factor 6 to be the most highly ranked hub genes in papillary thyroid cancer by integrating several expression profiles from TCGA (Zhao and Li, 2018). Moreover, accumulating number of lncRNAs has also been demonstrated to be associated with the prognosis of various cancers, such as prostate cancer, breast cancer, and gastric cancer (Gupta et al., 2010; Crea et al., 2014; Zhu et al., 2016; Zhao et al., 2018). However, lncRNA risk score model that can predict the clinical outcome of cervical squamous cell carcinoma has not been fully explored.
In this study, we mined the cervical squamous cell carcinoma RNA sequencing data from the TCGA projects. By using a random survival forest (RSF) algorithm and Least Absolute Shrinkage and Selection Operator (LASSO) Cox regression analysis, a 26-lncRNA signature-based risk score was established to predict the overall survival of cervical squamous cell carcinoma. Besides, its predictive accuracy was further validated in an independent validation set.
Materials and Methods
Gene expression data sets collection
As we previously depicted, the gene expression data were downloaded from the TCGA database (Mao et al., 2018a, 2018b) (
Normalization and prognosis-associated lncRNAs selection
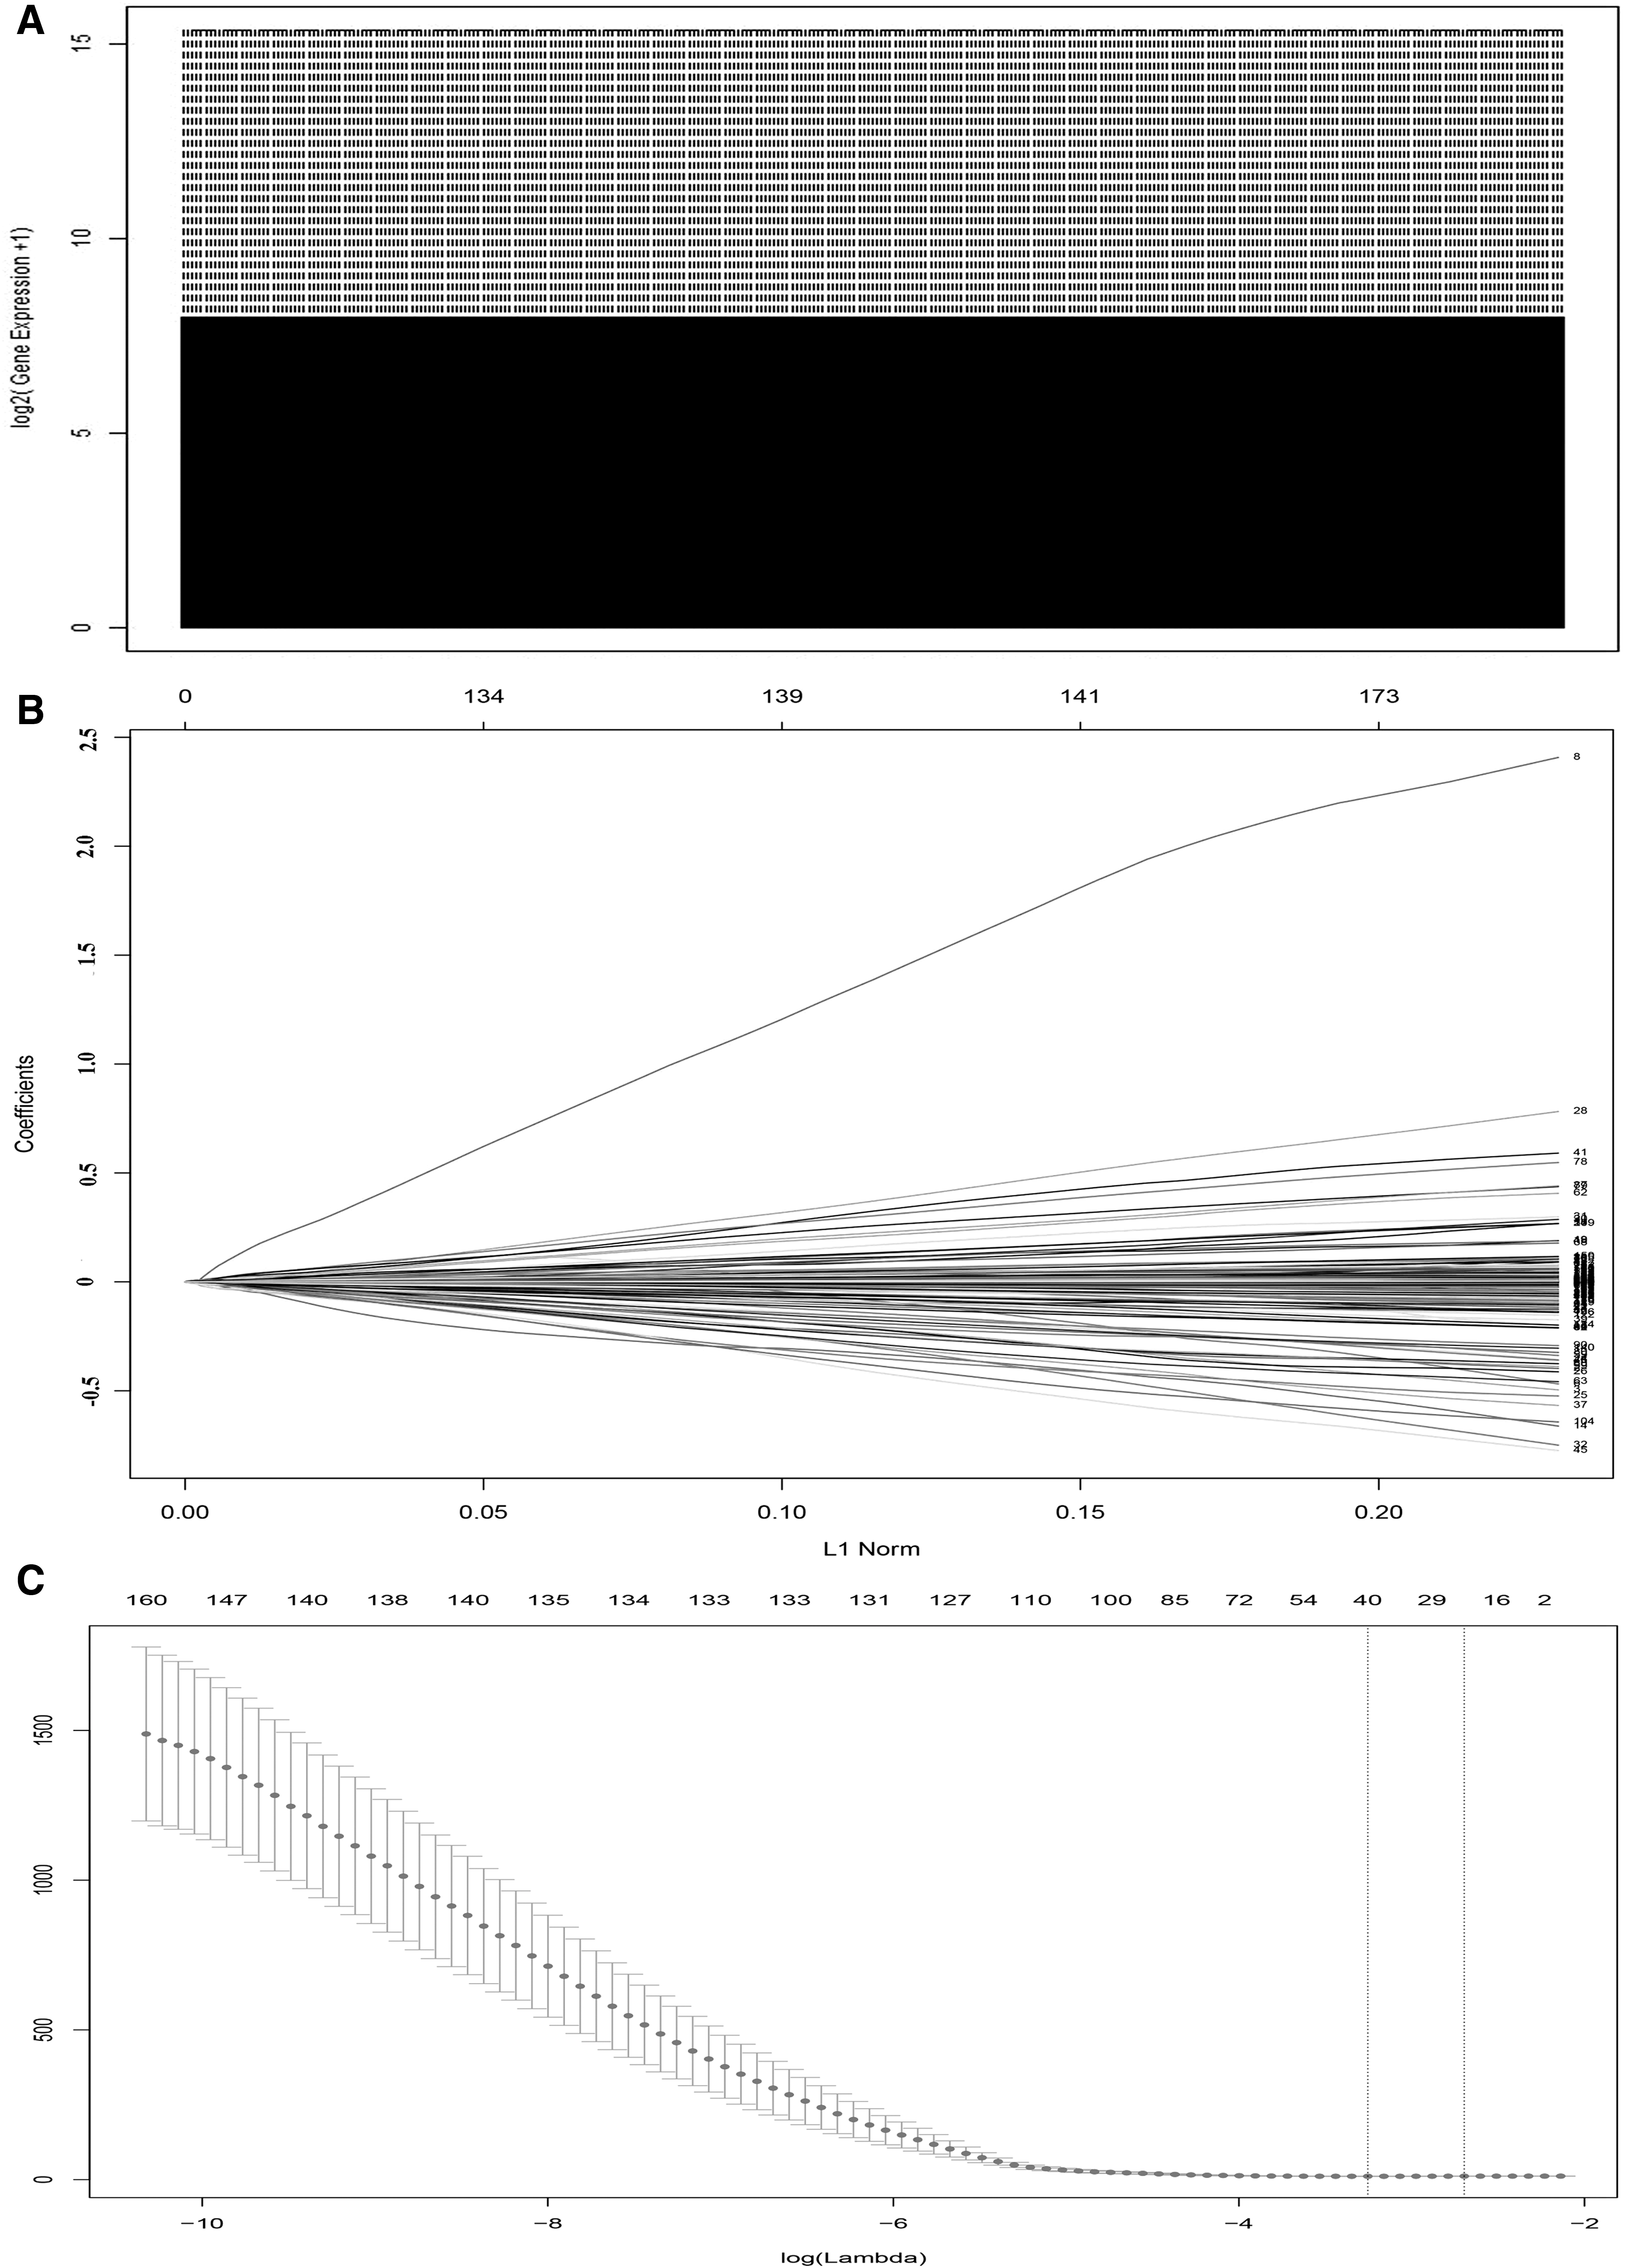
First, the raw data were log2(x + 1) transformed and quantile normalized. Genes with the following conditions would be excluded from the set: (1) Less than 20% of expression data values have at least a 1.5-fold change in either direction from the gene's median value. (2) More than 50% of gene expression was missing. (3) More than 50% of the intensity was <0.1 after normalization (Mao et al., 2018a). After data normalization and filter, lncRNAs in the training set were put into the RSF algorithm, which was used to select prognosis-associated variables. LncRNAs with p < 0.05 were considered as significantly associated with the prognostic classification.
Risk score formula establishment and validation
Then we performed Cox regression analysis combined with LASSO along with 10-fold cross-validation to establish a prognostic risk score model. During this process, the penalty regularization parameter lambda (λ) was chosen through the cross-validation routine with an n-fold equal to 10 by using R package “glmnet.” Lambda.1se was then identified to pick out the variables along with the coefficients that gives the most regularized model while the cross-validated error is within one standard error of the minimum (Tibshirani, 1997). Accordingly, a prognostic risk score formula consisting of 26-lncRNAs weighted by the coefficients from LASSO penalized regression was established. Consequently, a risk score for each patient was calculated and the resulting score allowed the division of patients into two classes, namely the high-risk group and low-risk group, based on the median-risk score value.
At last, Kaplan–Meier survival curves along with log-rank p test was applied to compare the survival differences between high-risk and low-risk group. Moreover, the risk score formula was further validated by fitting in the validation set and the complete set.
Function enrichment analysis
As we previously depicted (Mao et al., 2018a), genes significantly related to the lncRNAs were identified through calculating the Pearson correlation coefficients between mRNAs and lncRNAs in the data from TCGA. Genes correlated with at least one of the lncRNAs in the model were enrolled into the analysis (Pearson correlation coefficient >0.60 or <−0.40). Functional enrichment analysis for these genes was performed and visualized using Cytoscape software with ClueGO and CluePedia Plugins (Shannon et al., 2003; Bindea et al., 2009).
Results
Prognosis-associated lncRNAs identification
All the samples downloaded from TCGA were first quantile normalized. The box plot was used to show the distributions of lncRNA profiles in each sample using the R software package (Fig. 1A). A total of 241 samples were randomly divided into a training cohort (n = 120) and a validation cohort (n = 121). After filtered by RSF algorithm that was used to select prognosis-associated variables, the selected lncRNAs were put into LASSO Cox regression model along with 10-fold cross-validation (Fig. 1B, C). As a result, a 26-lncRNA risk score formula was developed based on their Cox coefficients. Risk score=(AC005410.2*-0.222)+(AC068831.3*-0.182)+(AC090948.2*-0.158)+(LINC01281*-0.153)+(BX323046.1*-0.13)+(AC099524.1*-0.0722)+(AC005523.1*-0.0511)+(AC023983.2*-0.0448)+(AC022382.1*-0.0378)+(MIR4458HG*-0.0214)+(AC005332.7*-0.0211)+(AL158071.2*-0.0153)+(AC004847.1*-0.0108)+(AC024270.5*-0.00217)+(AL021807.1*-0.0000764)+(AC008771.1*-0.0000622)+(HOXA10.AS*0.00512)+(AF127577.4*0.0424)+(LNCSRLR*0.046)+(HCG15*0.0477)+(RBAKDN*0.0751)+(AL359853.2*0.154)+(AC020978.2*0.199)+(LINC00866*0.218)+(AC020900.1*0.257)+(WWC2.AS2*0.37">score=(AC005410.2*-0.222)+(AC068831.3*-0.182)+(AC090948.2*-0.158)+(LINC01281*-0.153)+(BX323046.1*-0.13)+(AC099524.1*-0.0722)+(AC005523.1*-0.0511)+(AC023983.2*-0.0448)+(AC022382.1*-0.0378)+(MIR4458HG*-0.0214)+(AC005332.7*-0.0211)+(AL158071.2*-0.0153)+(AC004847.1*-0.0108)+(AC024270.5*-0.00217)+(AL021807.1*-0.0000764)+(AC008771.1*-0.0000622)+(HOXA10.AS*0.00512)+(AF127577.4*0.0424)+(LNCSRLR*0.046)+(HCG15*0.0477)+(RBAKDN*0.0751)+(AL359853.2*0.154)+(AC020978.2*0.199)+(LINC00866*0.218)+(AC020900.1*0.257)+(WWC2.AS2*0.37). Details about these lncRNAs can be found in Supplementary Table S1.
Overview of the lncRNA profiles in training set and validation set
Then patients were divided into high- or low-risk groups according to the median value. The distribution of the risk score along with the corresponding overall survival data and the expression level of 26-lncRNAs in the signature was plotted and shown in Figure 2. As depicted in the picture, patients with higher risk scores tended to experience a shorter overall survival time and higher death rate. Correspondingly, in the high-risk group, the expression levels of risky genes that have positive coefficients were generally higher than those in low-risk group. In contrast, the expression levels of protective genes, which have negative coefficients, were lower in high-risk group than those in the low-risk group. Similar results were found in both training set (Fig. 2A) and validation set (Fig. 2B).
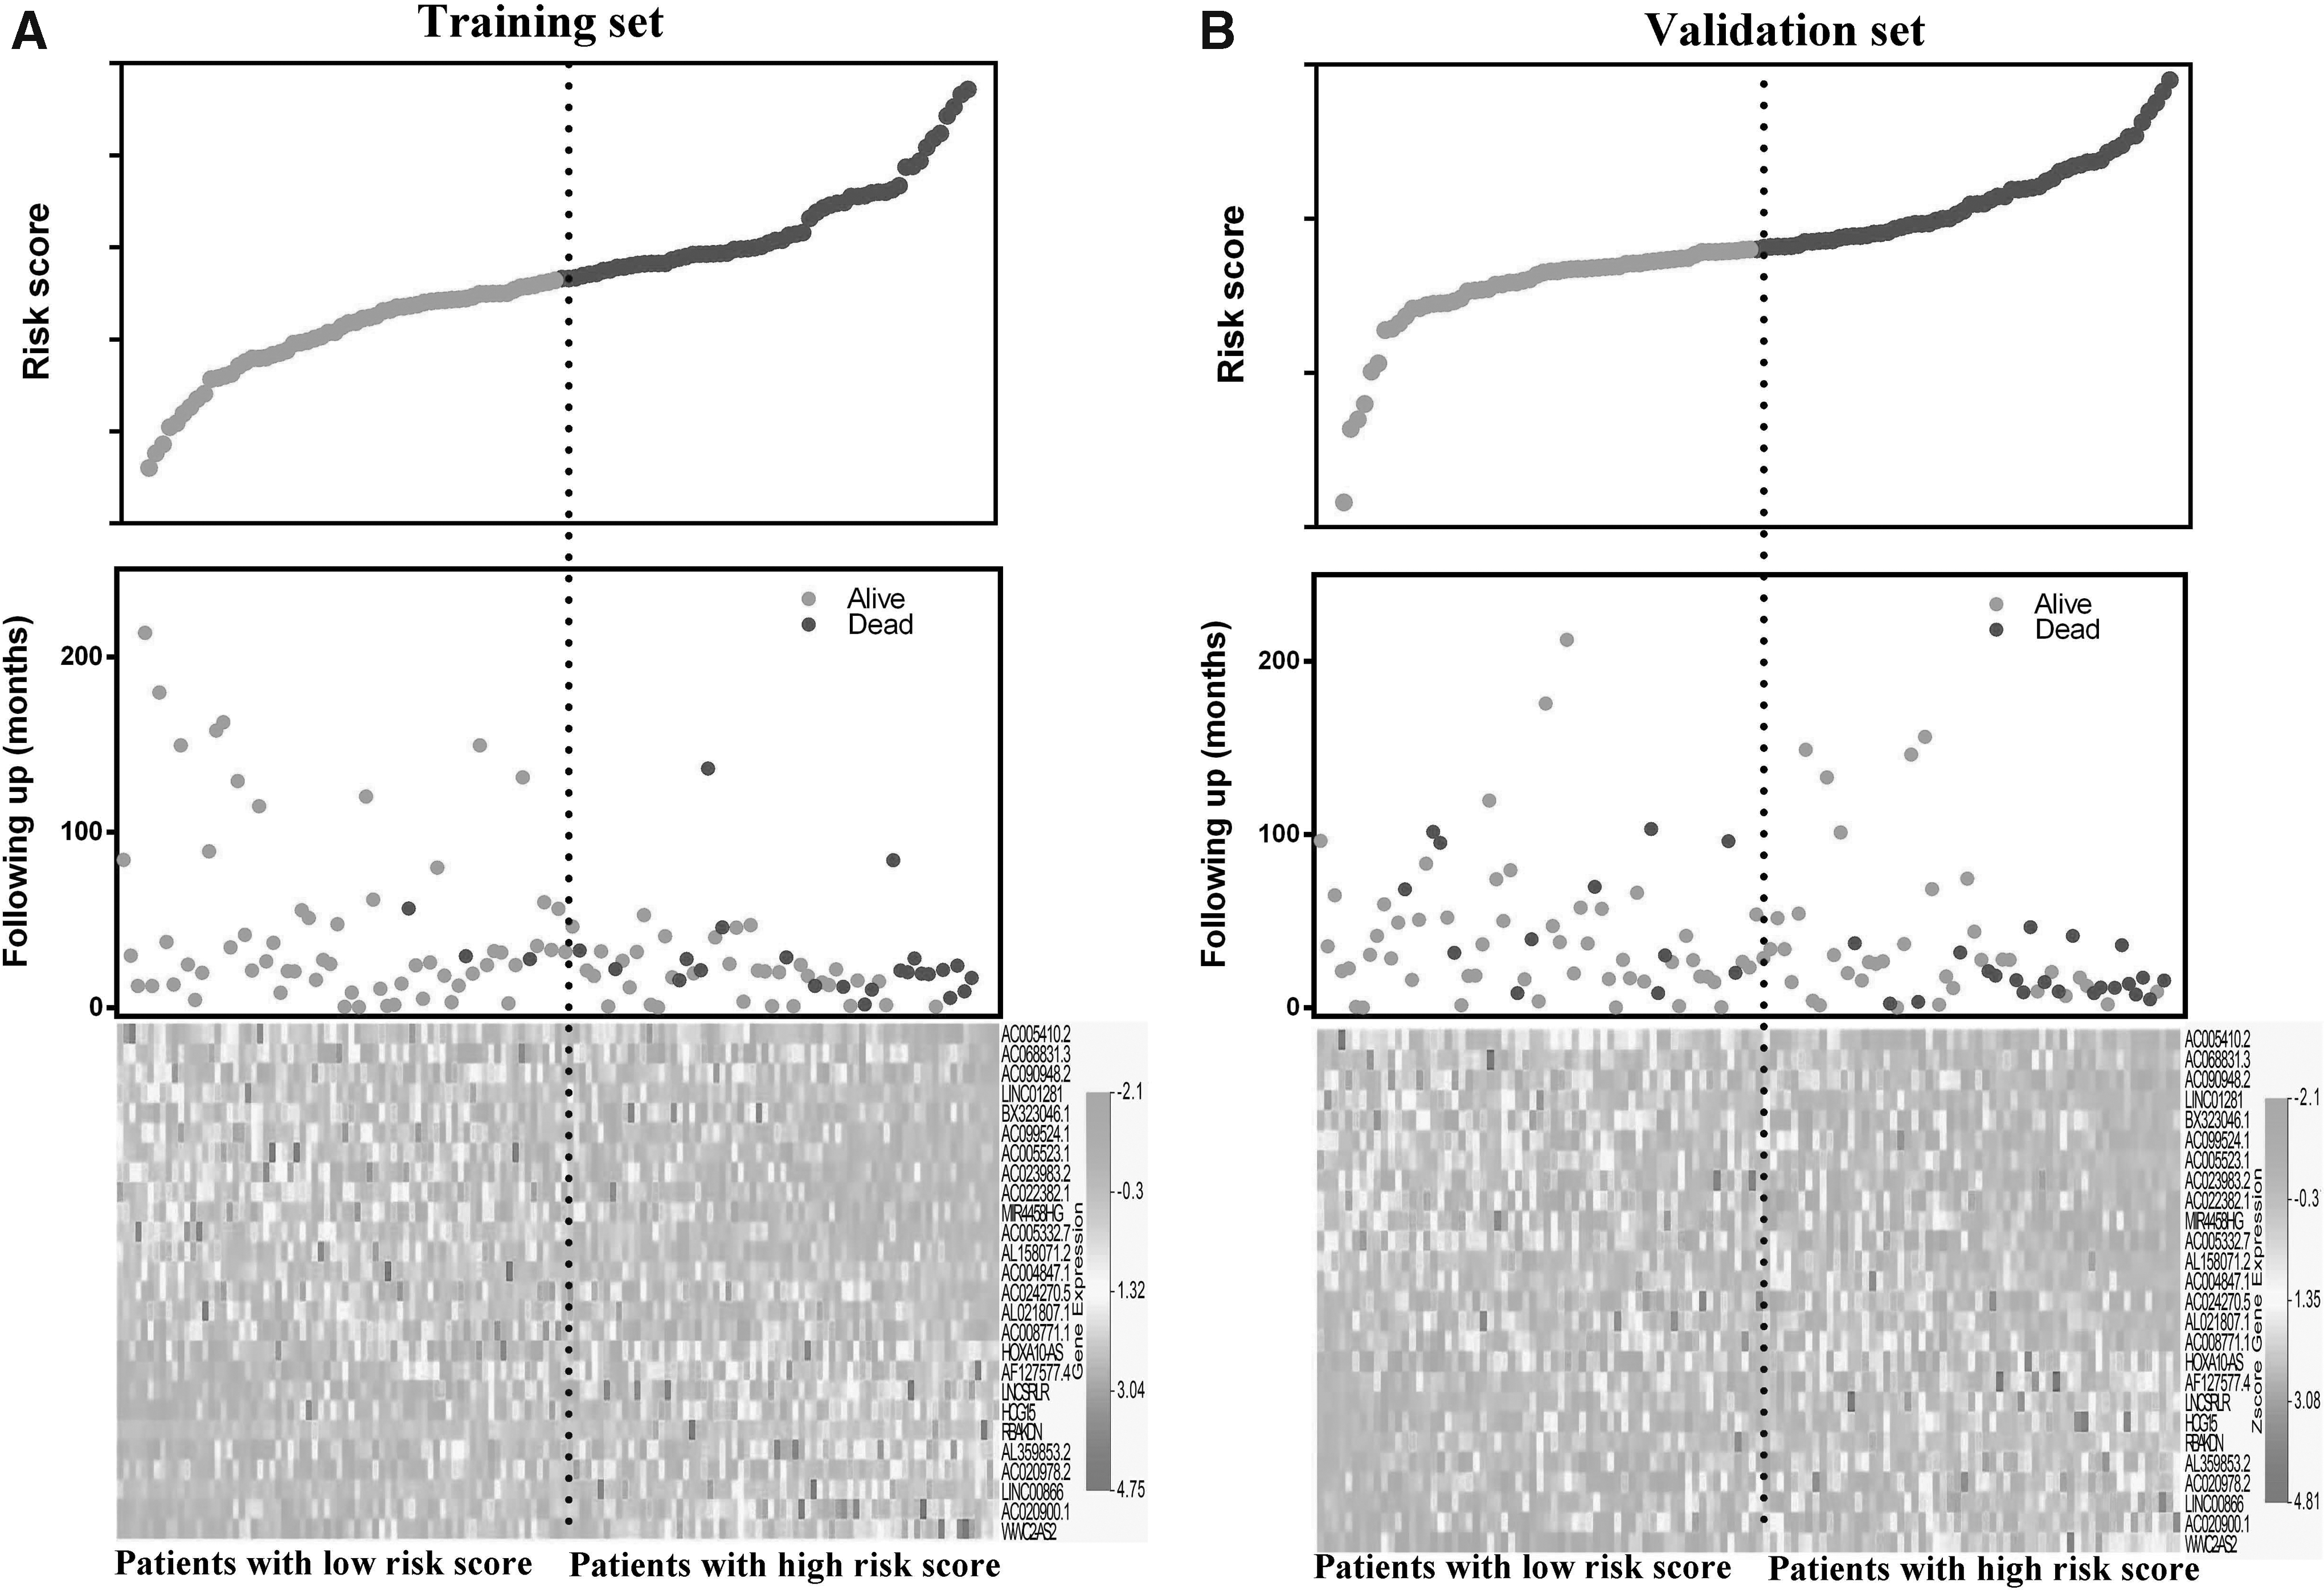
Risk score analysis of the training set and validation set. The distribution of each patient's risk score in the training set
Predictive accuracy evaluation
The predictive accuracy of 26-lncRNA risk score model was evaluated by plotting Kaplan–Meier curves and performing log-rank p test. According to the results, significant differences in Kaplan–Meier survival analysis were observed in high- and low-risk groups separated by the risk score model in both training (Fig. 3A) and validation set (Fig. 3B) (p < 0.001). Moreover, we also downloaded data set from GEO (GSE52903) to assess its predict accuracy (Medina-Martinez et al., 2014). The data sets downloaded from GEO were firstly quantile normalized and the box plot of the normalized data was shown in supplementary materials (Supplementary Fig. S1). Similarly, significant difference of disease-free survival was observed between high- and low-risk groups separated by the 26-lncRNA risk score model (Supplementary Fig. S2).
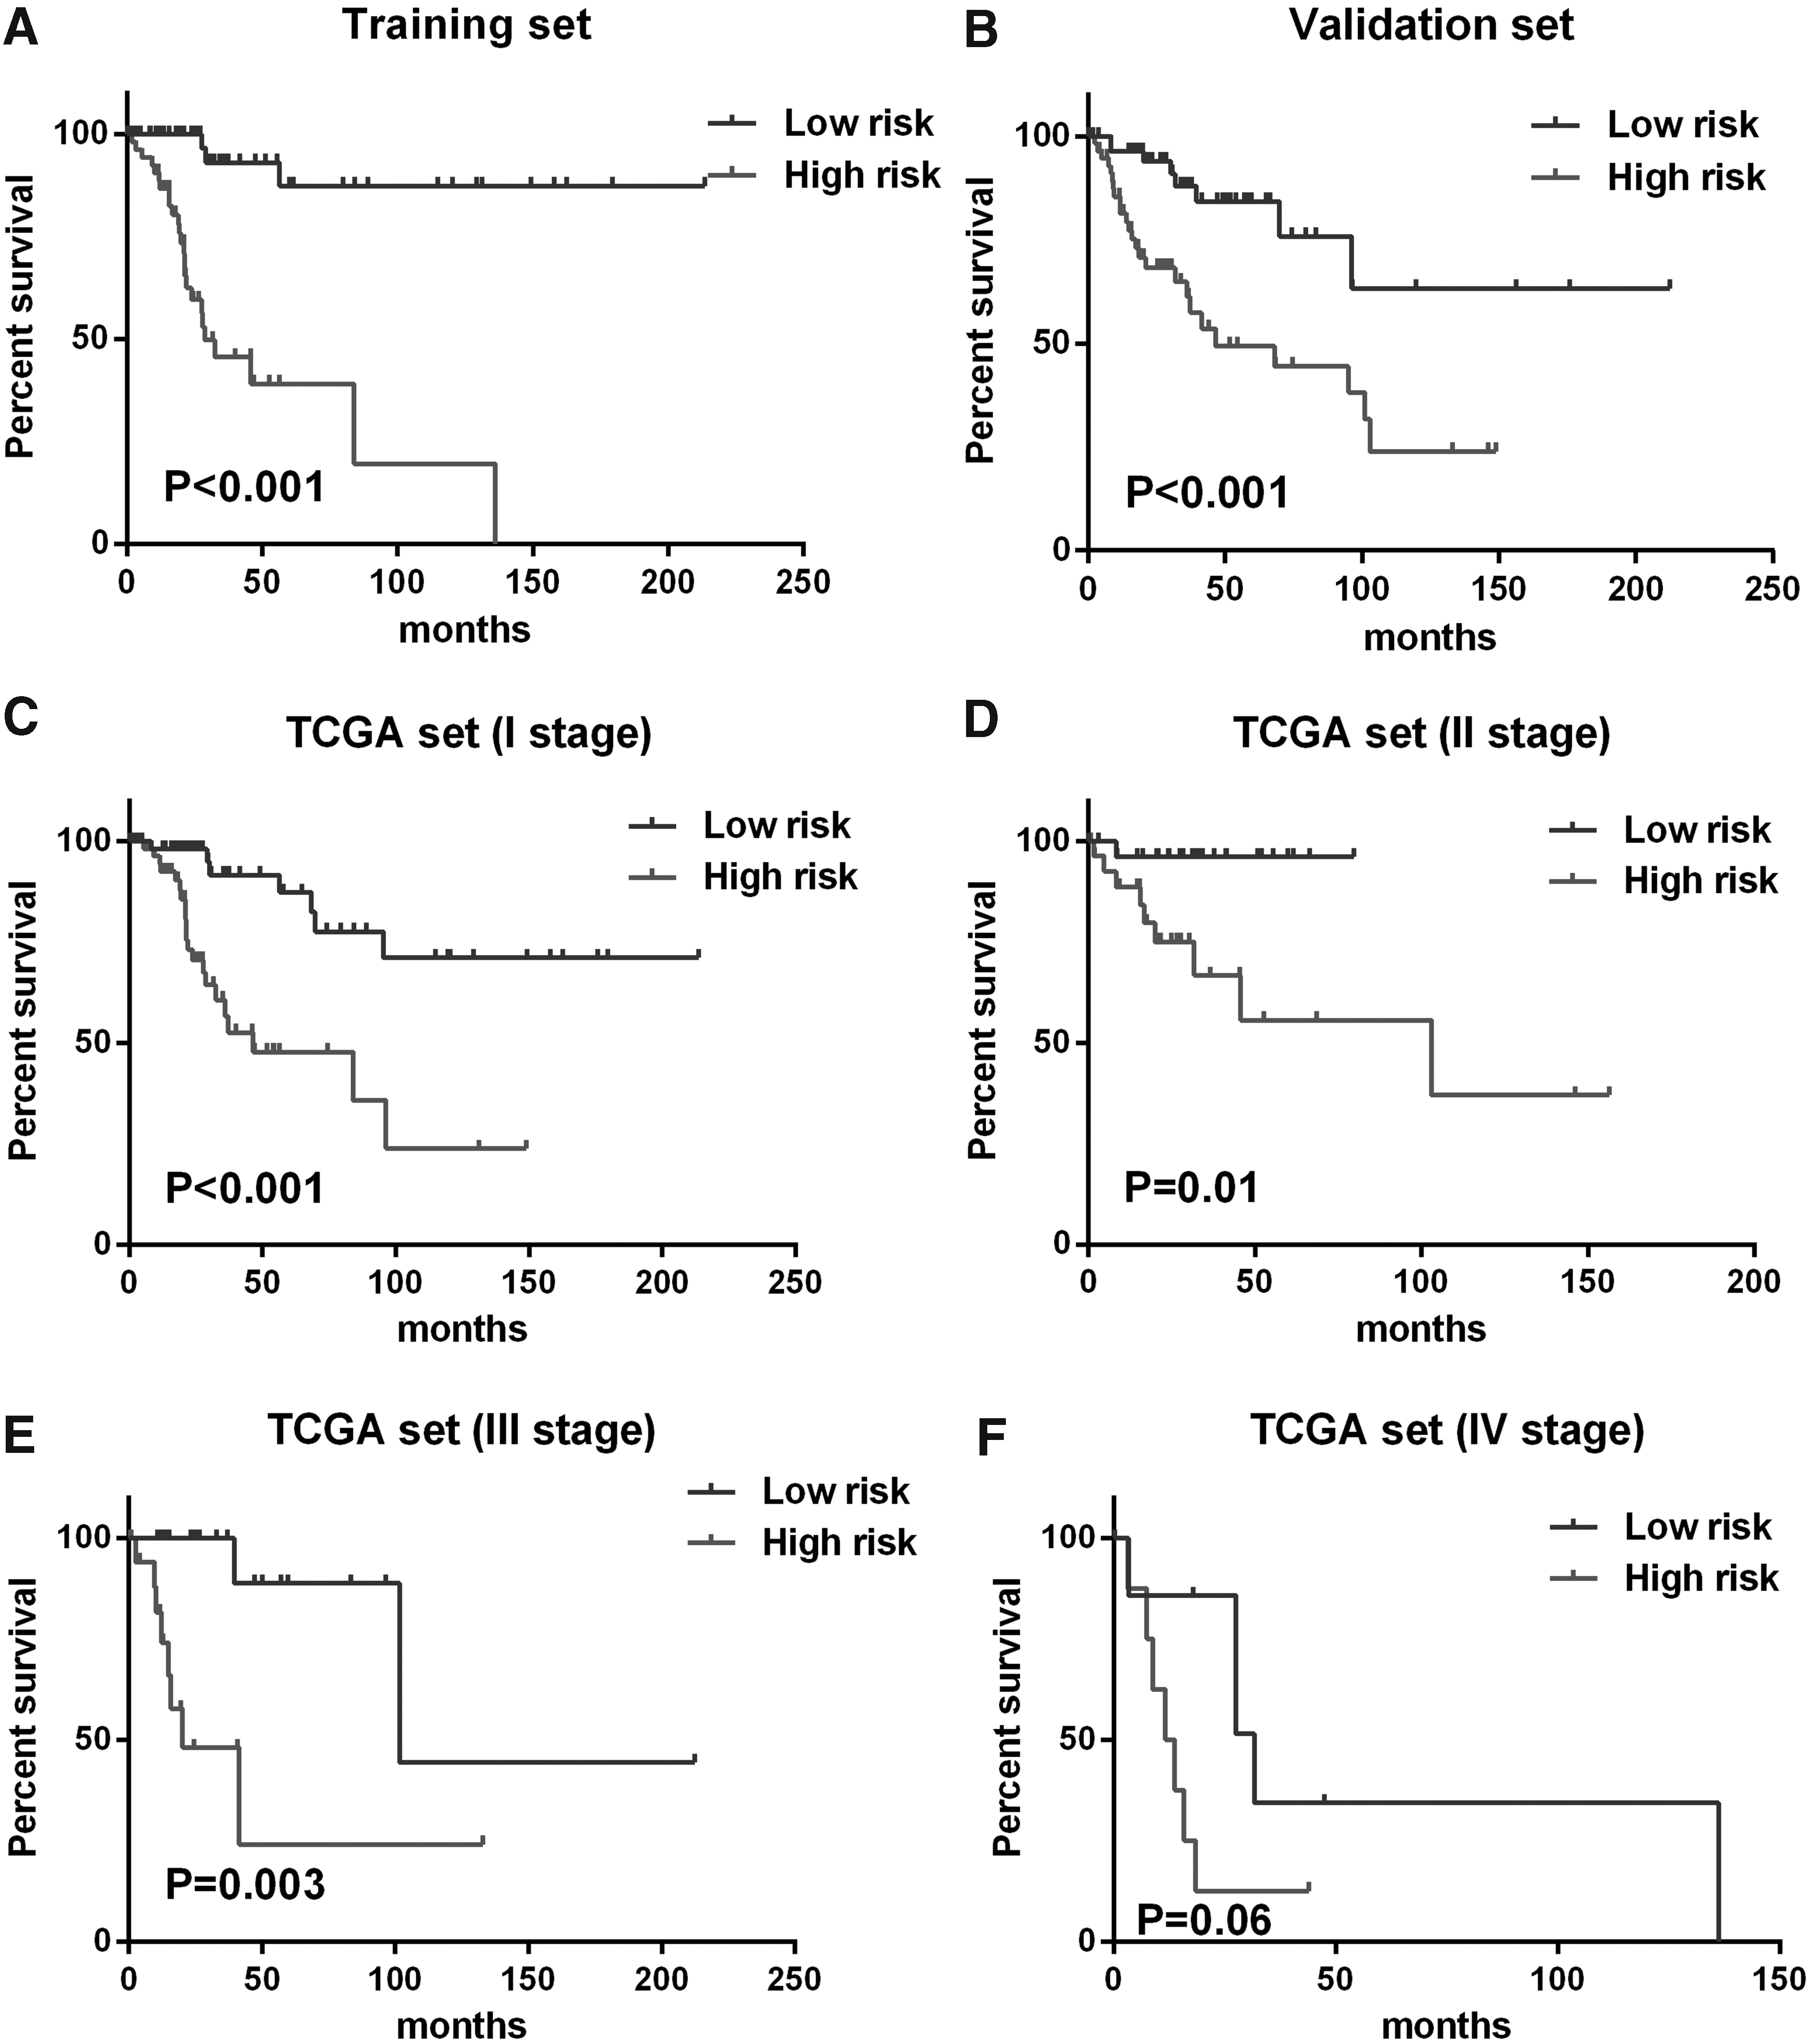
Kaplan–Meier analysis along with log-rank p was used to visualize and compare the disease-free survival of low-risk group versus high-risk group in training set
Besides, stratified analysis was further performed to evaluate the predictive efficiency of the lncRNA-risk score model within tumor-node-metastasis (TNM) stages. As shown in Figure 3, the risk score model could predict the overall survival of patients with I (Fig. 3C), II (Fig. 3D), and III (Fig. 3E) stages, except for those in IV stage (Fig. 3F) as a result of the limited number. These results demonstrated that the prognostic value of the 26-lncRNA risk score model was independent of TNM stages.
Function annotation of lncRNAs in risk score model
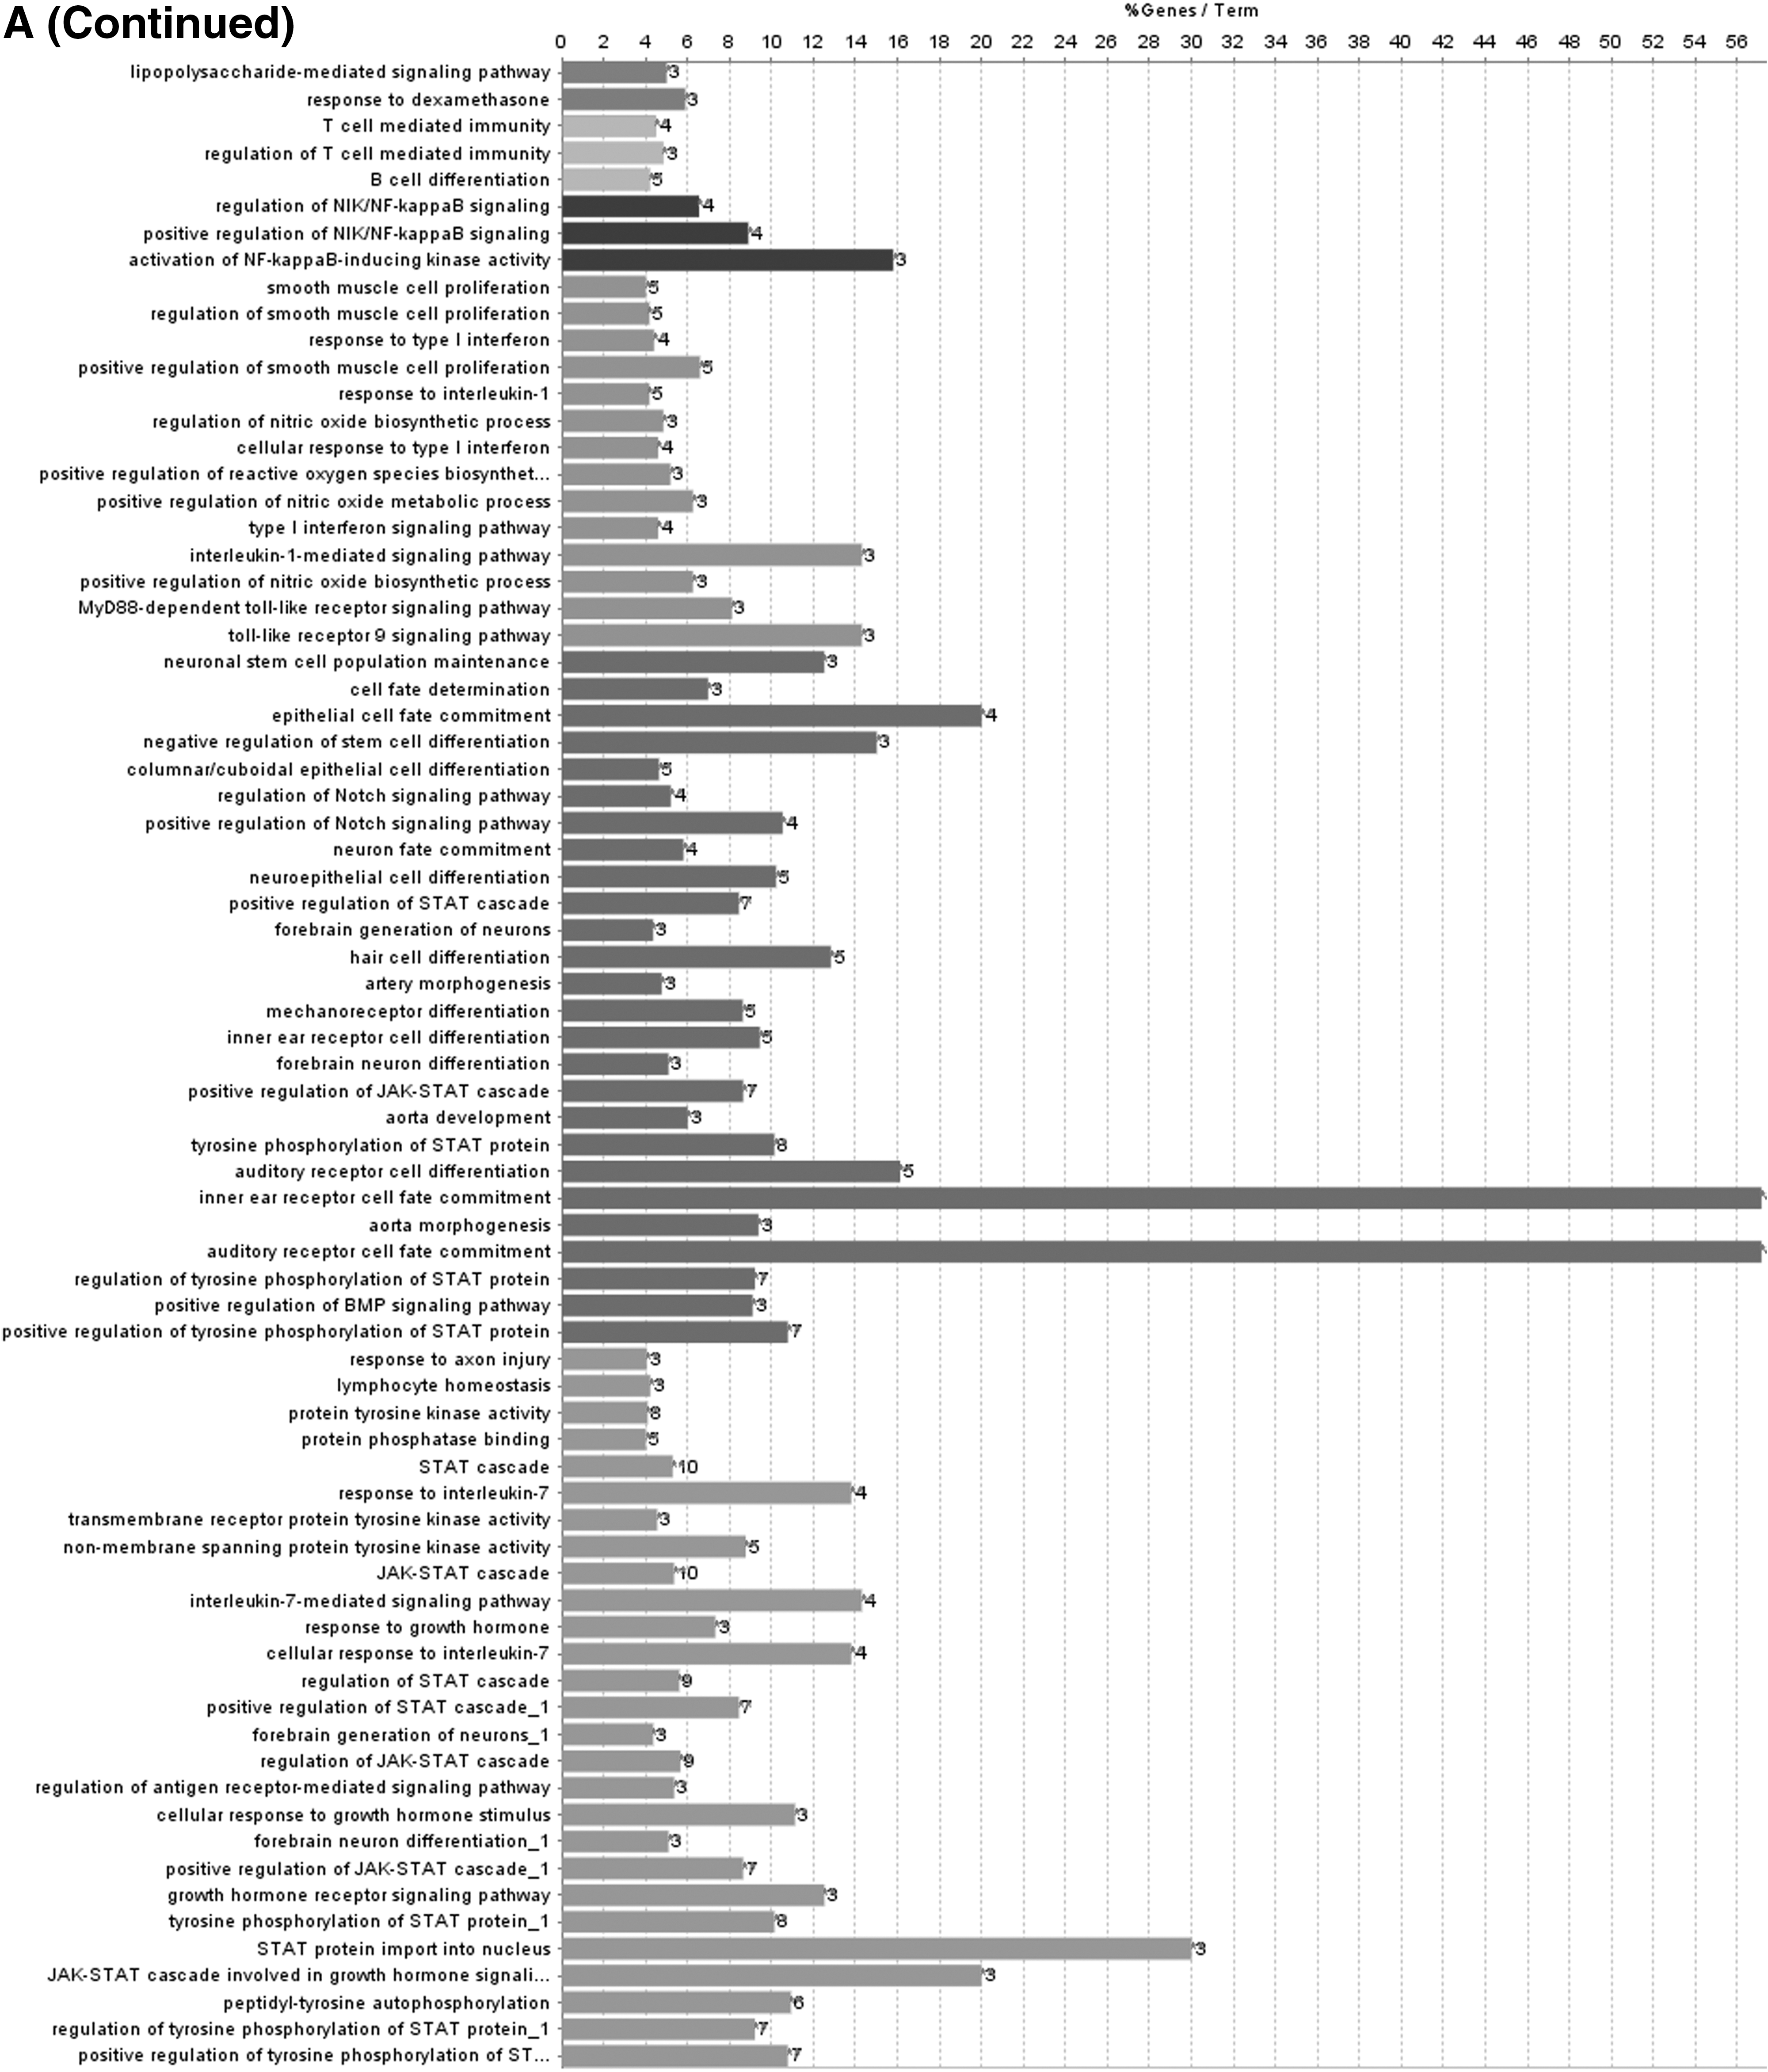
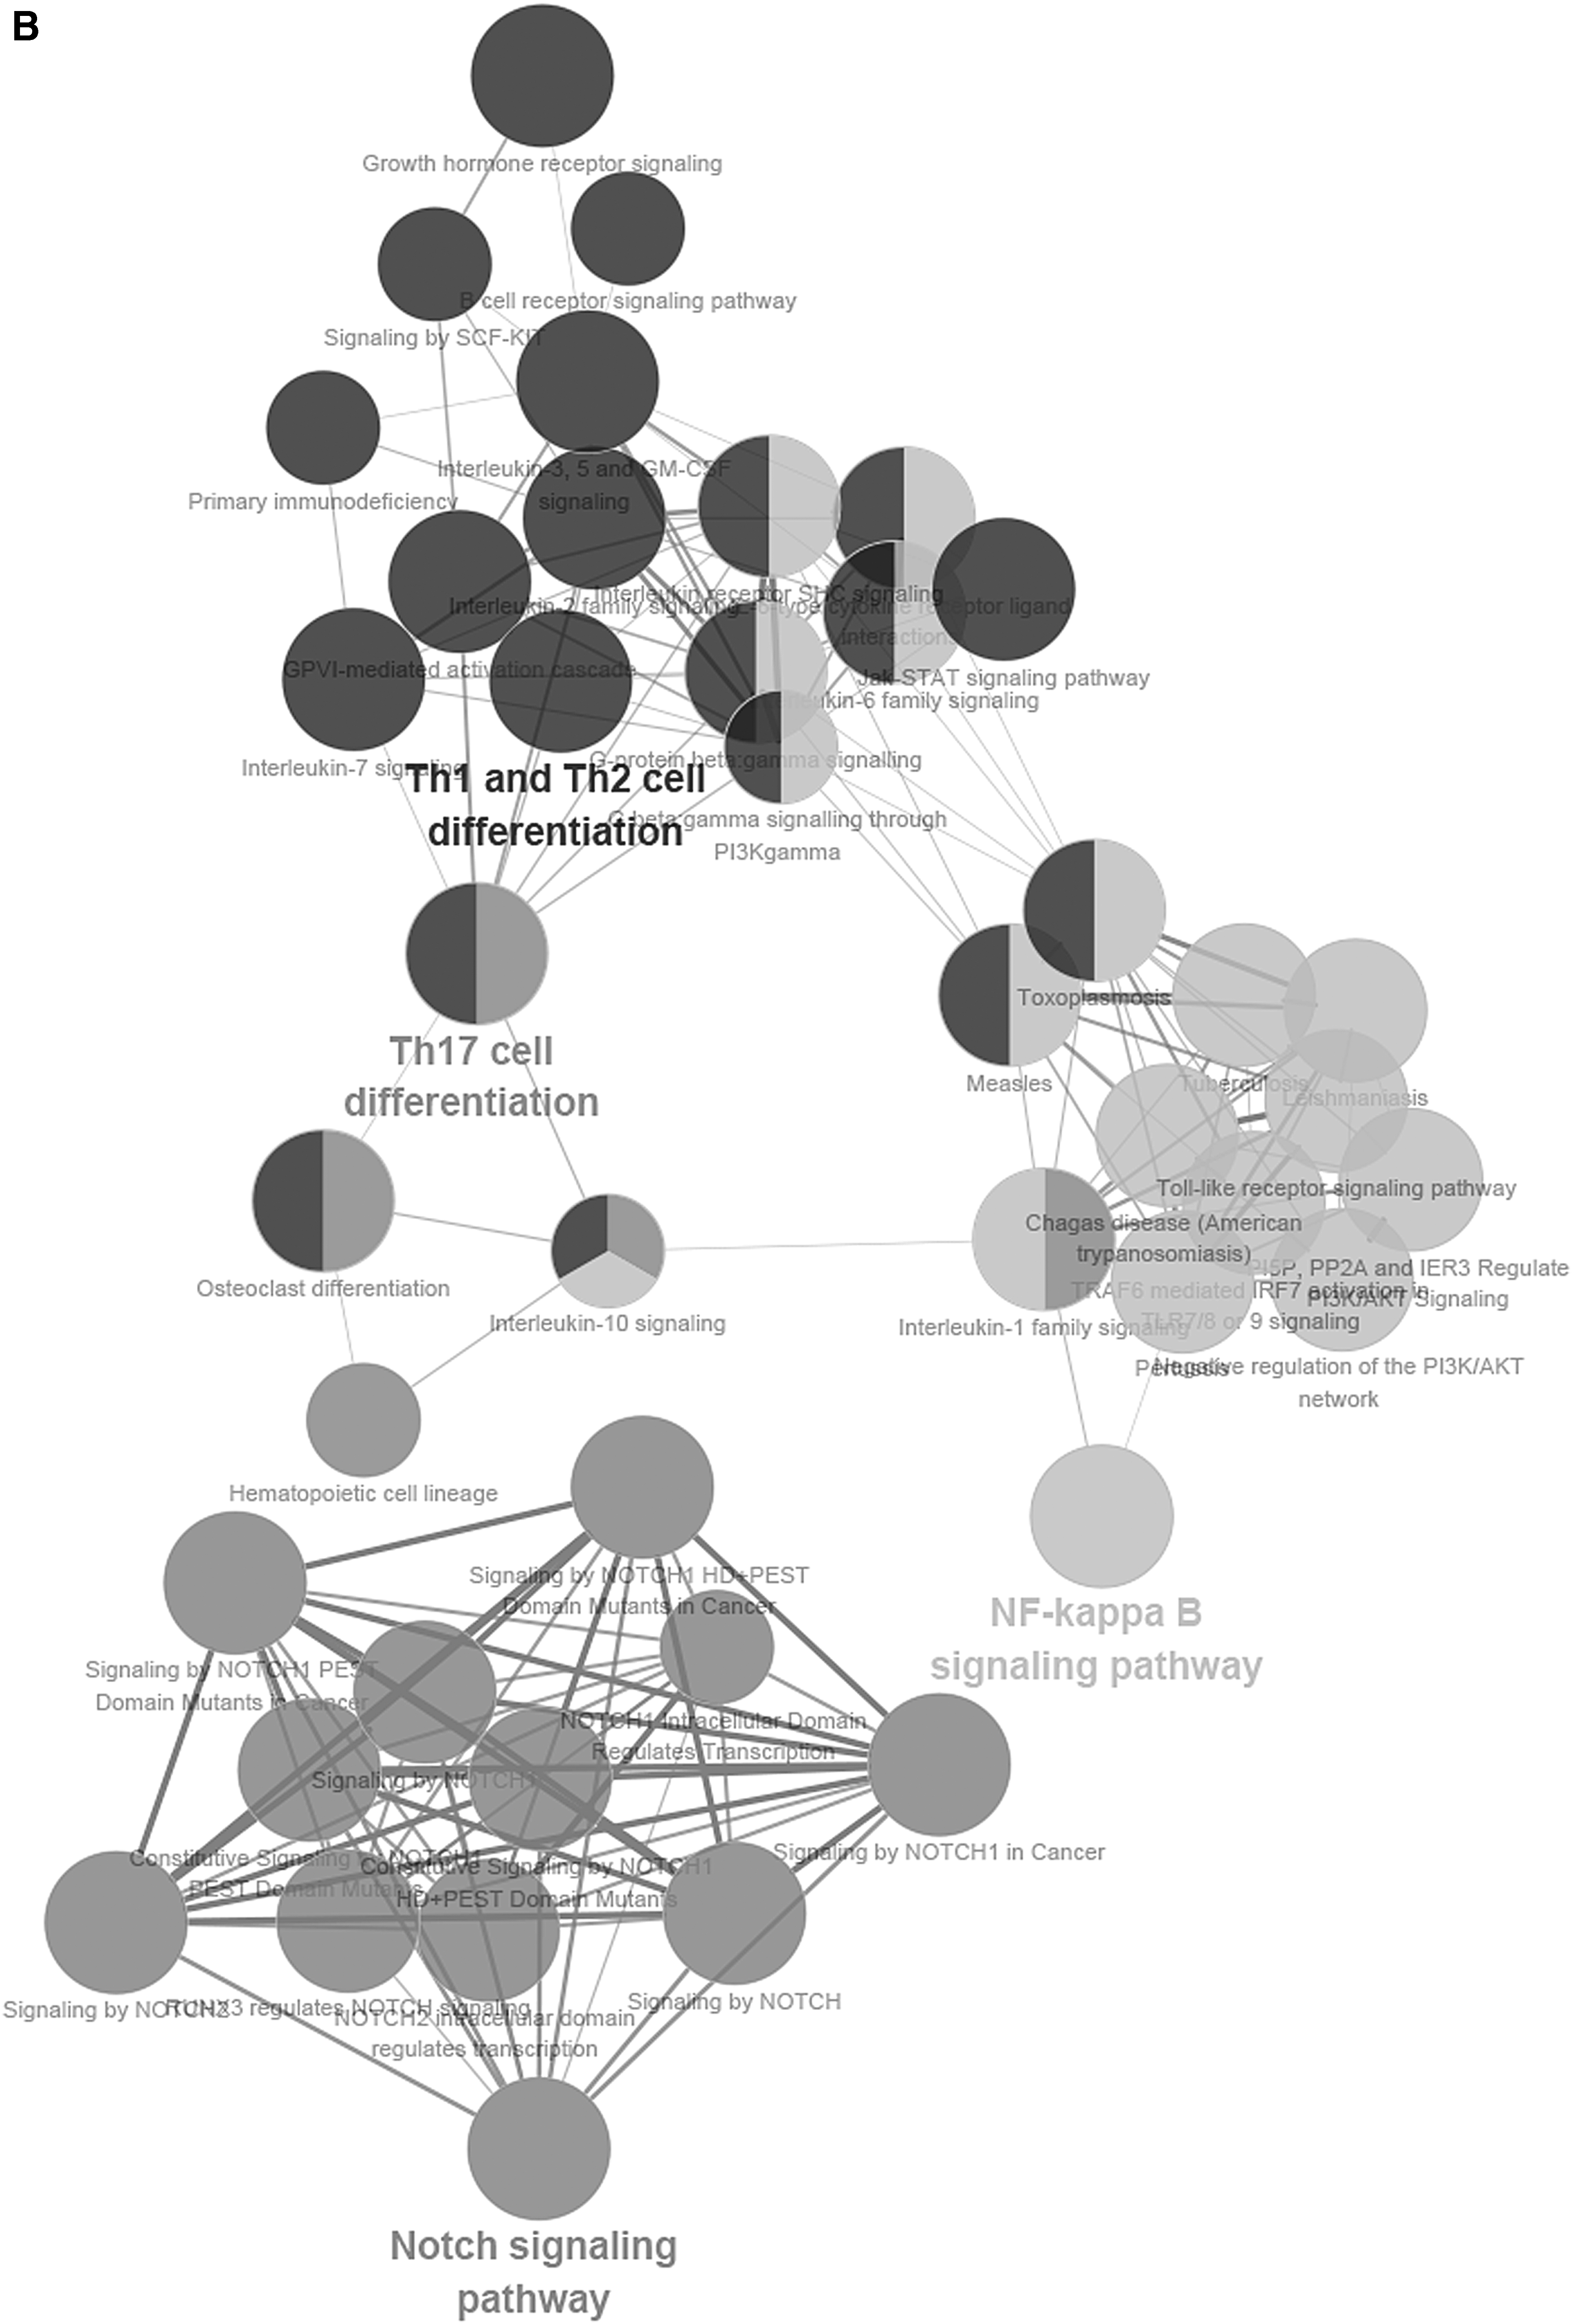
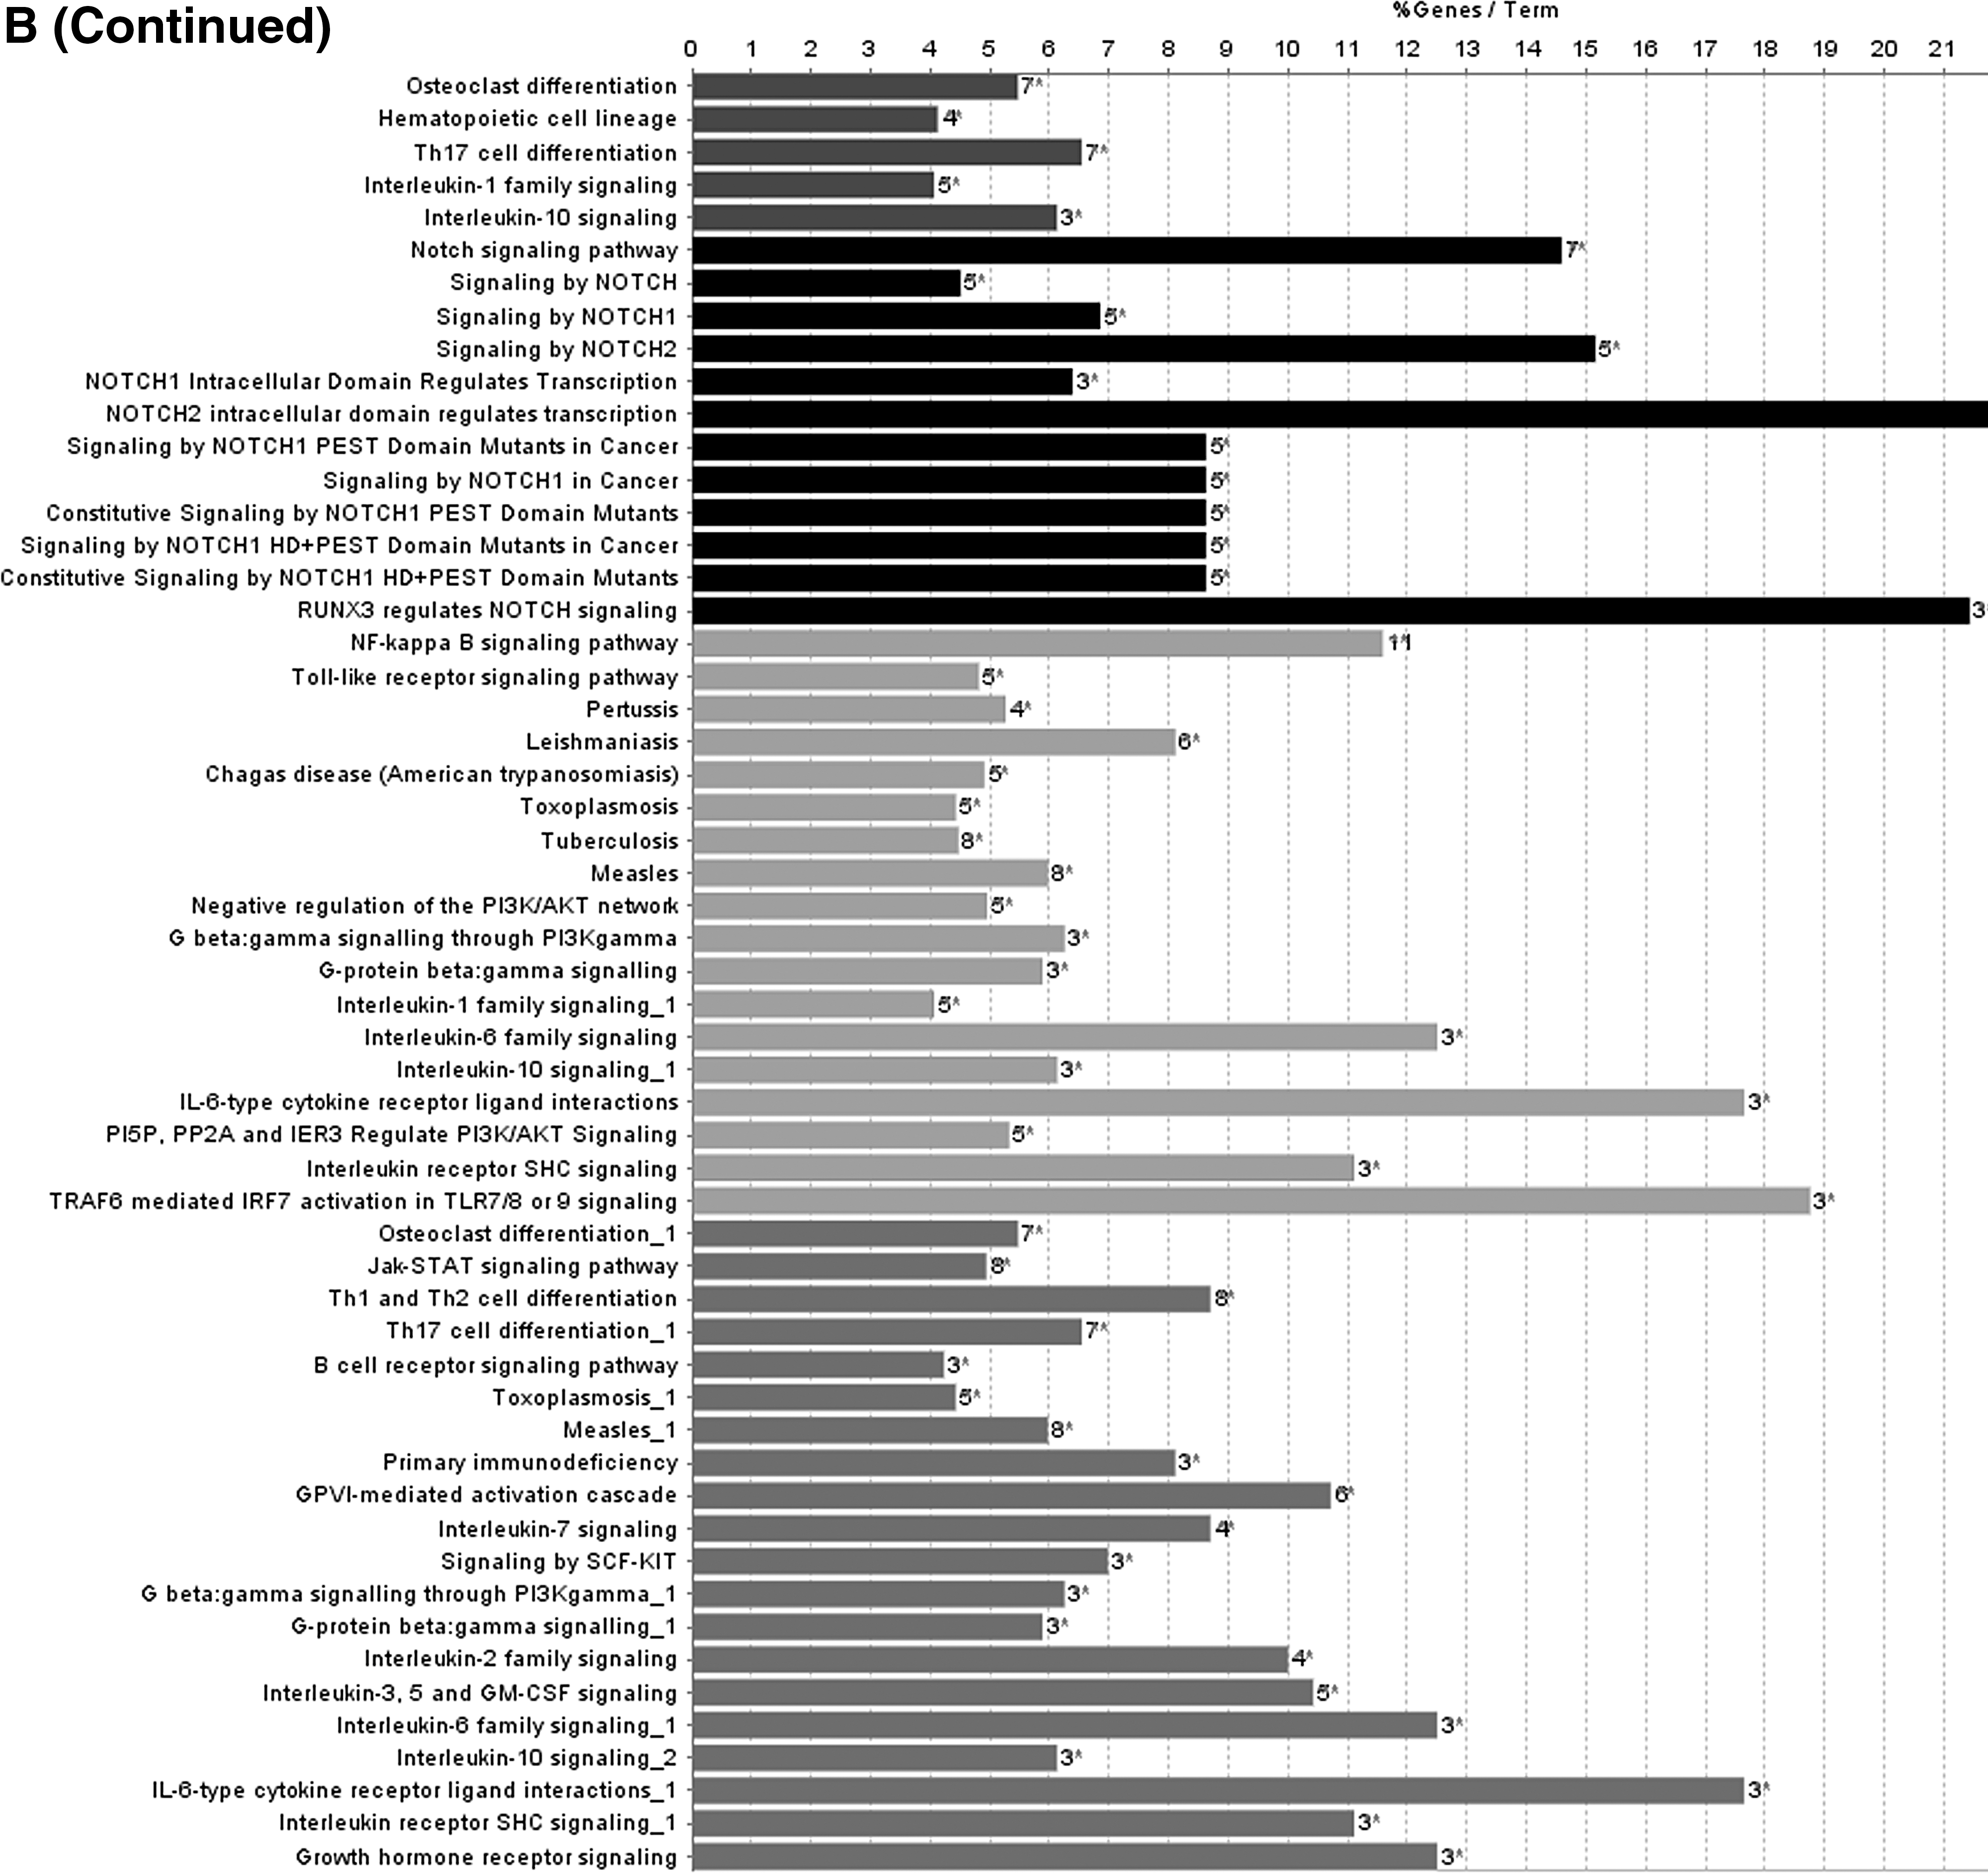
To further describe the function of lncRNAs in the score model, we performed the function annotation and enrichment analysis. As we have previously depicted, lncRNAs usually act as competing endogenous RNAs that modulate the gene expression and maintain the functional balance of various gene networks (Kartha and Subramanian, 2014; Mao et al., 2018a). Pearson correlation coefficient analysis was applied to identify genes significantly associated with lncRNAs in the model. Genes were considered significantly correlated with lncRNAs in the score model if their Pearson correlation coefficient was larger than 0.6 or smaller than −0.4. Then these genes were put into gene ontology biological process and Kyoto Encyclopedia of Genes and Genomes (KEGG) signaling pathways analysis. Results showed that lncRNAs-associated genes were enriched in biological signaling pathways such as Notch signaling pathway and JAK-STAT cascade, which play key roles in modulating cell cycle and apoptosis in cancer (La Fortezza et al., 2016; Sanchez-Vega et al., 2018). According to the results aforementioned, lncRNAs in the model can modulate the expression level of their target genes, which play a role in affecting tumorigenesis and progression of cervical squamous cell carcinoma (Fig. 4).
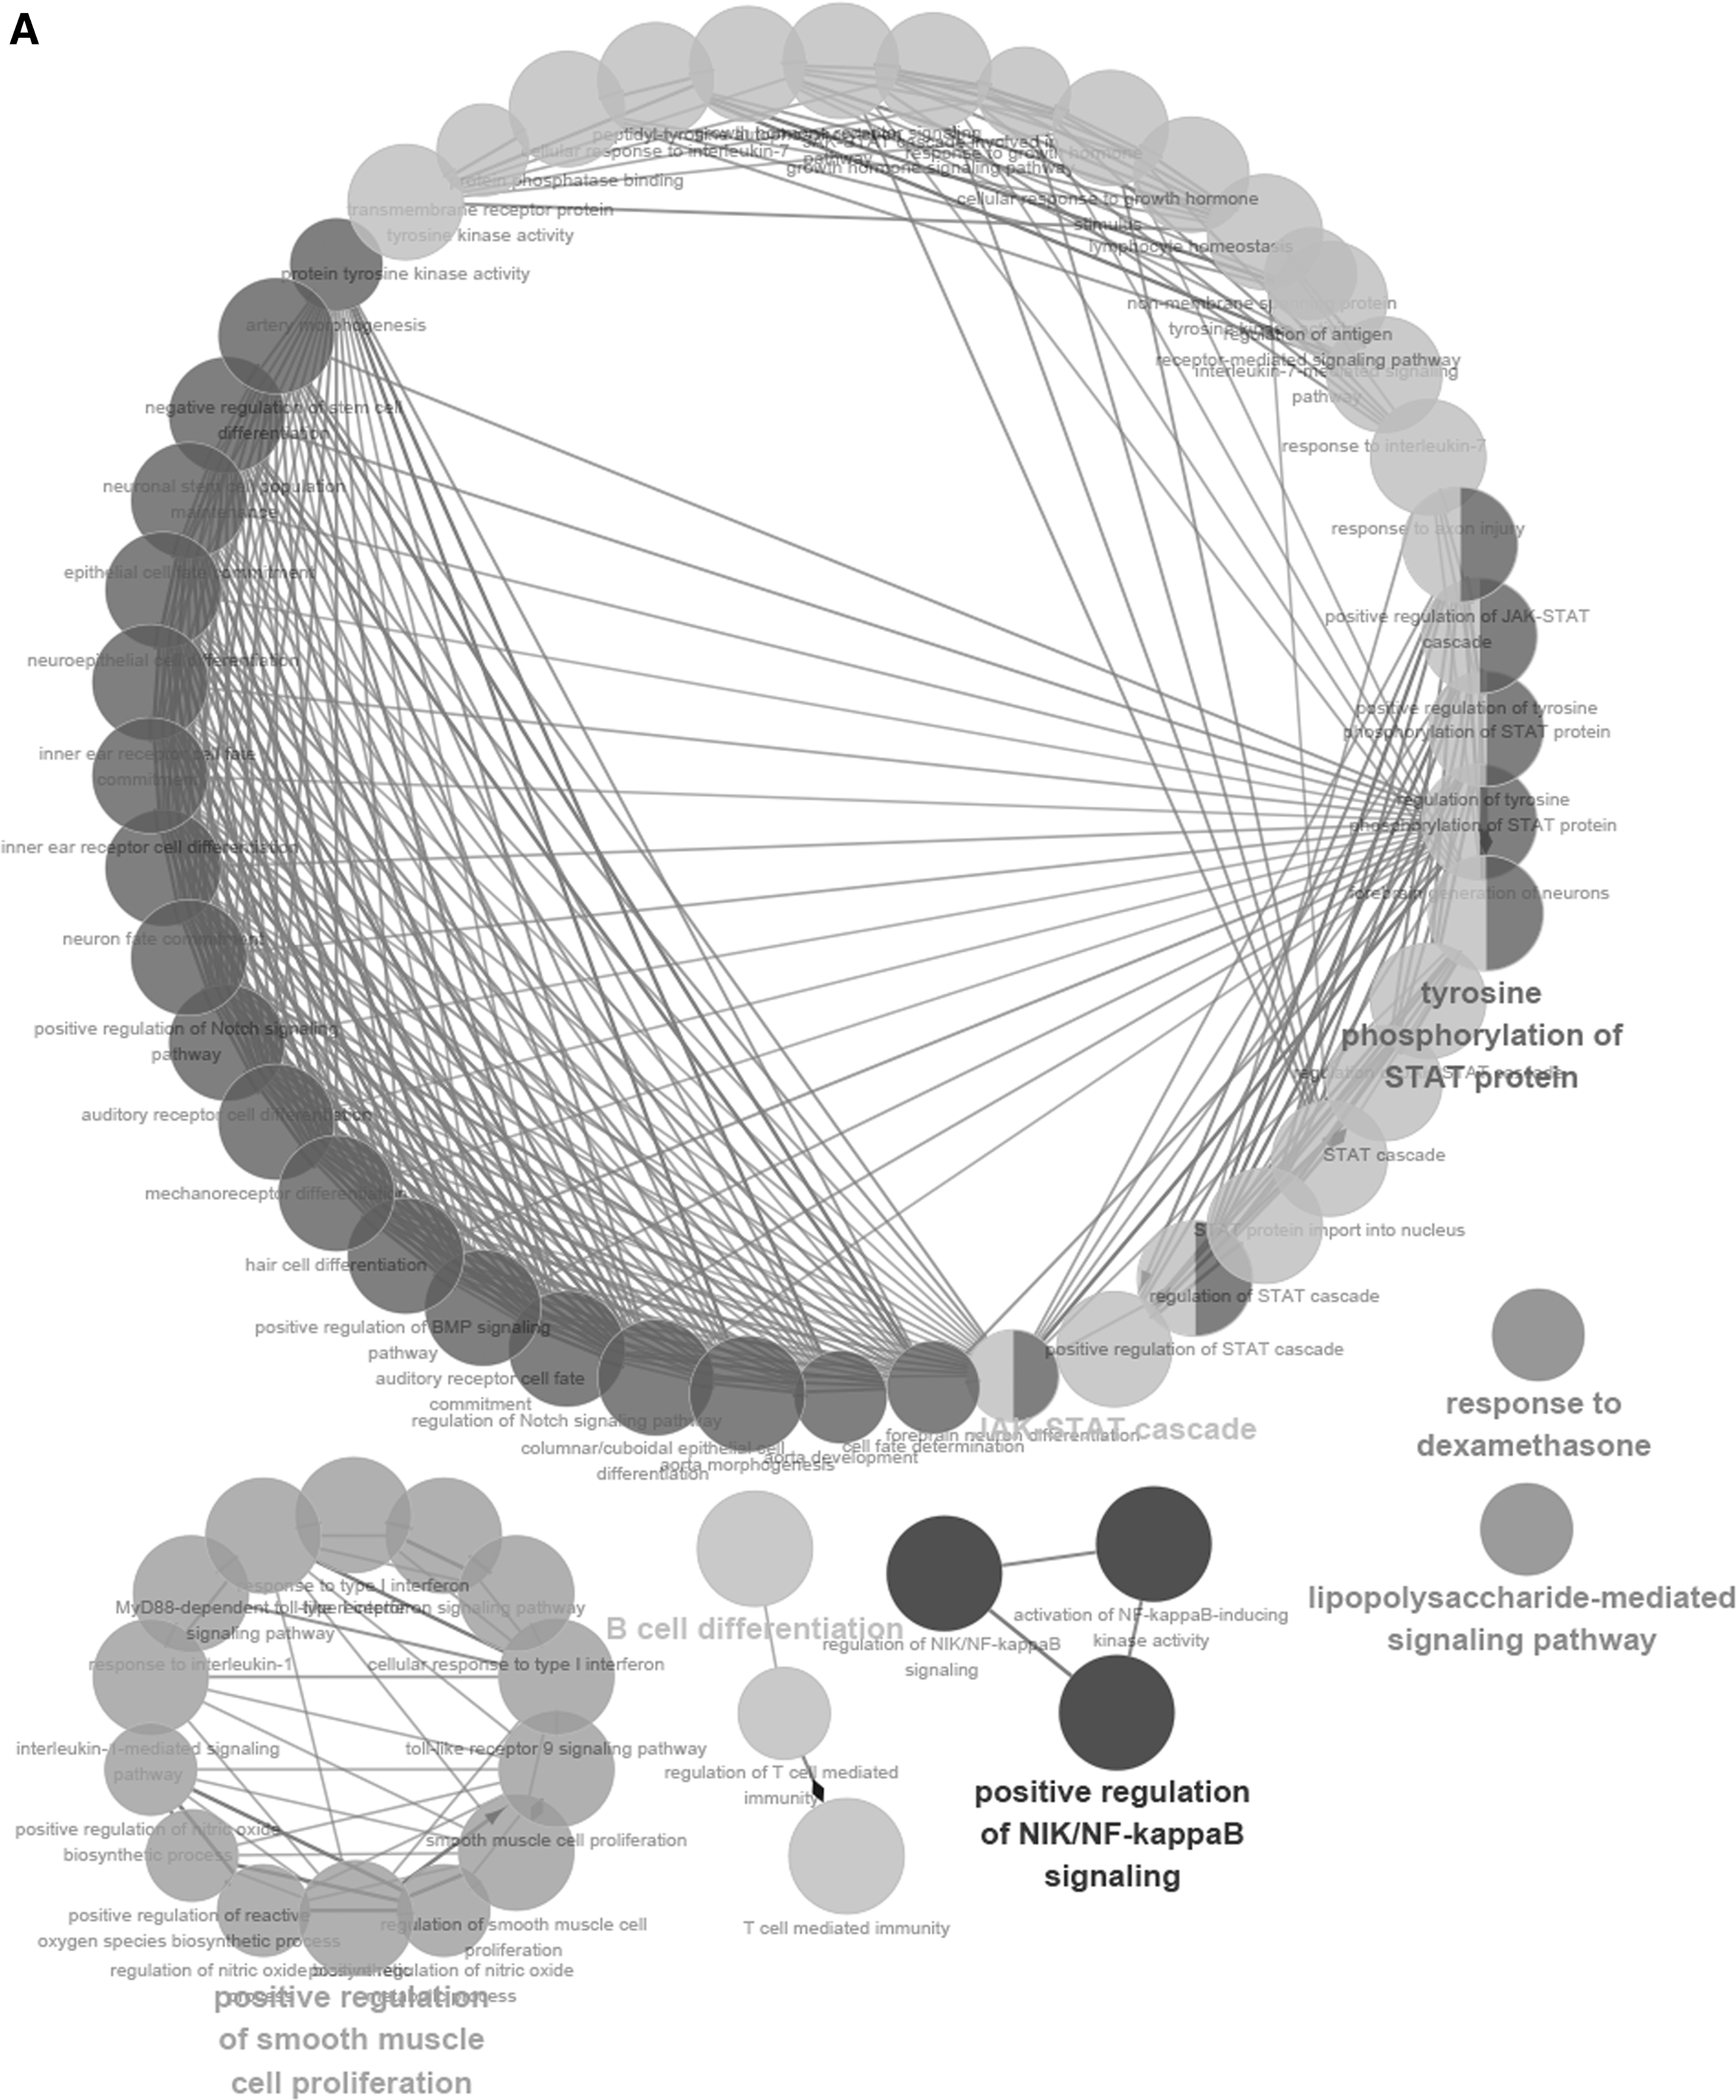
Functional enrichment analysis depicted the biological pathways and processes associated with correlated genes. The results of GO biological process enrichment
Discussion
The prognosis of cervical squamous cell carcinoma remains poor, despite recent advancement in cancer prevention, diagnosis, and treatment (Saslow et al., 2012). Therefore, exploring the molecular mechanisms of cancer progression and identifying biomarkers for early diagnosis, treatment and prevention have become the focus of cervical squamous cell carcinoma research. The discovery of lncRNAs has provided new insight into the molecular mechanisms and treatment of cancer that attracted accumulating attention (Gao et al., 2018). As a result of the advancements of high-throughput technologies including microarray and RNA sequencing, gene expression profiling has become a powerful technique to identify the molecular biomarkers in various cancers (Zhan et al., 2016). A series of multigene signatures have been designed to predict the prognosis of cancer (Li et al., 2017; Zhang et al., 2018; Zhao and Li, 2018).
In this study, we constructed a 26-lncRNAs risk model that can be used to predict the overall survival of cervical squamous cell carcinoma. During this process, we applied a previously depicted regression model—LASSO Cox regression model along with 10-fold cross-validation for parameters' selection and shrinkage. LASSO can minimize the residual sum of squares subject to the sum of the absolute value of the coefficients being less than a constant. Lambda (λ) the penalty regularization parameter was determined through the cross-validation routine
Subsequently, a risk score for each patient in training set and validation set was calculated and then the cohort was classified into high-risk and low-risk groups. Kaplan–Meier survival curves along with log-rank p test were used to compare the survival differences between high-risk and low-risk groups. As we showed in the results, obvious separation was observed in the survival curves of the high-risk group and low-risk group classified by the risk score in both training set and validation set. Hence, the 26-lncRNAs risk score model was of prognostic significance.
Further gene enrichment analysis showed that the lncRNAs in the model may play a role in cancer-related biological process such as cell cycle regulation and signaling pathways such as Notch signaling pathway and JAK-STAT cascade. Actually, previous studies have demonstrated that the expression of HOXA11-AS is aberrantly altered in many cancers (Lu et al., 2018). In lung cancer, lncRNA HOXA10-AS promotes lung adenocarcinoma progression by promoting Wnt/β-catenin signaling (Sheng et al., 2018). In colorectal cancer, clinicopathological analysis showed that lower expression of HOXA11-AS was remarkably linked with tumor size, advanced tumor-node-metastasis stage, lymph node metastasis, as well as carcinoembryonic antigen level of patients (Li et al., 2016). Besides, MIR4458HG was also downregulated in colorectal cancer, which indicated its potential role in modulating colorectal cancer progression (Li et al., 2018b). In lung cancer, HCG15 was significantly differentially expressed, which may be potential candidate driver genes for lung adenocarcinoma progression (Castillo et al., 2017). These studies along with our results suggested the possible regulatory mechanism of the 26-lncRNAs in risk score model. Dysregulation of these lncRNAs can influence the expression of their potential target genes, which play critical roles in cancer-related signaling pathways and biological processes such as cell cycle and epithelial–mesenchymal transition. Subsequently, the proliferation, apoptosis, and invasion ability of cancer cells may be affected, which resulted in the cancer progression and recurrence. This may explain why lncRNAs in the model can be used to predict the prognosis in cervical squamous cell carcinoma and shed light on the possible effects of the lncRNAs in the signature, which deserves further experiments.
Conclusion
In this study, we first downloaded the lncRNA expression profile from TCGA and then constructed a 26-lncRNA signature to predict overall survival in patients with cervical squamous cell carcinoma by performing LASSO Cox regression model along with 10-fold cross-validation. Moreover, the predictive value of signature was further tested in training sets by applying Kaplan–Meier survival curves along with log-rank p test. The functional enrichment analysis and experiments suggested that the lncRNAs in the model might be correlated with several cancer-related processes and pathways, which supported the prognosis predictive ability of the lncRNAs in the signature.
Footnotes
Acknowledgment
This study was supported by Science and Technology Program of Hebei Province (Grant Number: 162777146).
Authors' Contributions
Y.M. contributed to the study design, data profiling, and drafting the article. Y.Z. and L.D. prepared the figures and tables. J.D. and X.L. performed language editing. Final article was reviewed and approved by all the authors.
Disclosure Statement
No competing financial interests exist.
References
Supplementary Material
Please find the following supplemental material available below.
For Open Access articles published under a Creative Commons License, all supplemental material carries the same license as the article it is associated with.
For non-Open Access articles published, all supplemental material carries a non-exclusive license, and permission requests for re-use of supplemental material or any part of supplemental material shall be sent directly to the copyright owner as specified in the copyright notice associated with the article.