
Abstract
Ferroptosis is a new form of regulated cell death. Fibroblast-to-myofibroblast differentiation is known to be involved in the pathogenesis of idiopathic pulmonary fibrosis. Utilizing HFL1 cell line treated with transforming growth factor-β1 (TGF-β1), we investigated the relationship between ferroptosis and pulmonary fibrosis, and the function of glutathione peroxidase 4 (GPX4) in them. The results indicated that α-smooth muscle actin and collagen I (COL I) mRNA expression levels increased significantly from 24 h after TGF-β1-treatment, and further rose after TGF-β1+erastin treatment. The levels of reactive oxygen species (ROS), malondialdehyde were increased, and the levels of GPX4 mRNA and protein were reduced after treatment with TGF-β1, and all these were magnified after TGF-β1+erastin treatment. All these changes induced by TGF-β1 and erastin can be recovered by Fer-1 treatment. The cell viability rate was decreased significantly when treated with TGF-β1+erastin, but no obvious variation of cell viability was found in TGF-β1-treated group and in other groups, suggesting that ROS, lipid peroxidation, and GPX4 inhibition are not sufficient conditions for ferroptosis. Collectively, our study reveals that ROS, lipid peroxidation, and GPX4 play important roles in pulmonary fibrosis and ferroptosis induced by erastin. Erastin promoted fibroblast-to-myofibroblast differentiation by increasing lipid peroxidation and inhibiting the expression of GPX4. Fer-1 may inhibit pulmonary fibrosis and ferroptosis through suppressing lipid peroxidation and enhancing GPX4 expression.
Introduction
Idiopathic pulmonary fibrosis (IPF) is a chronic and progressive interstitial lung disease, with unclear etiology and poor prognosis. There are still no effective therapeutic measures of pulmonary fibrosis in clinical practice currently. Therefore, it is necessary to continue to study the pathogenic mechanisms and to find effective therapeutic strategy of this disease. The prominent pathologic characteristic of IPF is the formation of fibrotic foci, which are composed of myofibroblasts that secrete excessive extracellular matrix (ECM) proteins in the lungs (King et al., 2011). During the formation of fibrotic foci, fibroblasts accumulate, proliferate, and differentiate into myofibroblasts (King et al., 2011). Therefore, myofibroblasts differentiated from fibroblasts are the major responsible cells in the pathogenesis of pulmonary fibrosis (King et al., 2011; Wynn and Ramalingam, 2012). Myofibroblasts are characterized by increased expression of α-smooth muscle actin (α-SMA) and their high capacity of ECM, including collagen I (COL I A1/Col1A1), collagen III, collagen IV, periostin, and fibronectin. (Hinz et al., 2012; Stempien-Otero et al., 2016). α-SMA and COL I were taken as the markers of myofibroblasts (Le et al., 2007).
The transforming growth factor-β1 (TGF-β1) is the strongest fibrosis-promoting cytokine, which transform the fibroblast into myofibroblast by stimulating the expression of α-SMA and collagen production (Massague et al., 2005). TGF-β1-induced myofibroblast differentiation has been used as one of the in vitro assay models to investigate new intervention targets for pulmonary fibrosis (Rahaman et al., 2014).
Iron overloading resulted in iron deposition in peribronchial regions, septa, and alveolar macrophages in heterozygous β-globin knockout mice, and iron burden led to pulmonary fibrosis and corresponded with increased lipid peroxidation and decreased tissue catalase activity (Yatmark et al., 2015). Reactive oxygen species (ROS) mediate TGF-β1-induced myofibroblast differentiation (Liu and Desai, 2015). 8-Isoprostane, a product of free radical-mediated lipid peroxidation, is increased in IPF patients (Montuschi et al., 1998; Psathakis et al., 2006). Exhaled ethane, a second marker of lipid peroxidation, is increased in patients with interstitial lung disease (Kanoh et al., 2005). Intracellular malondialdehyde (MDA) was quantified as an indicator of lipid peroxidation (Xu et al., 2018). It showed an increase of MDA in bleomycin-induced pulmonary fibrosis in mice (Liu et al., 2017). Glutathione (GSH) levels in alveolar epithelial lining fluid are decreased in IPF lungs (Cantin et al., 1989; MacNee and Rahman, 1995). The addition of high-dose N-acetylcysteine to the standard therapy of prednisone and azathioprine can significantly slow IPF progression compared with standard therapy alone (Demedts et al., 2005; Behr et al., 2009).
Ferroptosis is a form of regulated cell death depended on iron and ROS. The morphological features of ferroptosis include smaller than normal mitochondria with increased mitochondrial membrane density and reduction/vanishing of mitochondrial crista in erastin-treated BJeLR cells (Dixon et al., 2012; Xie et al., 2016). Ferroptosis is characterized biochemically by increased levels of lipid hydroperoxides and iron overload, iron-catalyzed generation of ROS, and lipid peroxidation (Dixon et al., 2012; Xie et al., 2016; Latunde-Dada, 2017), and by decreased level of GSH (Yang et al., 2014). Erastin is a small molecule capable of initiating ferroptotic cell death (Dixon et al., 2012). Ferrostatin-1 (Fer-1) could suppress the ferroptosis induced by erastin and RSL3, but not apoptosis and necroptosis (Dixon et al., 2012).
Glutathione peroxidase 4 (GPX4) directly reduce phospholipid hydroperoxide, fatty acid hydroperoxide, cholesterol hydroperoxide, and thymine hydroperoxide using GSH as a cofactor (Imai and Nakagawa, 2003; Imai et al., 2017). Overexpression of GPX4 suppressed the phospholipid peroxidation, resulted in inhibition of ferroptosis (Imai et al., 2017). However, the role of GPX4 in pulmonary fibrosis is still unclear.
From the above, several crucial factors, including iron overload (Dixon et al., 2012; Yatmark et al., 2015; Xie et al., 2016; Latunde-Dada, 2017), ROS (Hecker et al., 2009; Kliment and Oury, 2010; Dixon et al., 2012; Liu and Desai, 2015; Xie et al., 2016; Latunde-Dada, 2017), lipid peroxidation (Montuschi et al., 1998; Kanoh et al., 2005; Psathakis et al., 2006; Dixon et al., 2012; Xie et al., 2016; Latunde-Dada, 2017), and GSH (Demedts et al., 2005; Behr et al., 2009; Yang et al., 2014) are pathogenetic or suppressive for pulmonary fibrosis and ferroptosis in common. However, the relationship between ferroptosis and pulmonary fibrosis is unknown. In the current study, we evaluated the relationship between ferroptosis and pulmonary fibrosis, and the possible molecular mechanisms in connection with GPX4.
Materials and Methods
Cell culture and grouping
HFL1 cells (Tongpai Biological Technology Co., LTD, Shanghai, China) were cultured in Ham's F12K medium with 2 mM L-glutamine and 10% fetal bovine serum (FBS) (Sigma Aldrich, Saint Louis) at 37°C containing 5% CO2. The cultured cells were randomly divided into five groups after culturing 12 h, including control group, TGF-β1-treated group, TGF-β1+erastin-treated group, TGF-β1+Fer-1-treated group, and TGF-β1+erastin+Fer-1-treated group. TGF-β1-treated group was added with TGF-β1 (6ng/mL) (Sigma Aldrich), and the control group was added with the same amount of solvent. TGF-β1+erastin-treated group, TGF-β1+Fer-1-treated group, and TGF-β1+erastin+Fer-1-treated group were treated with erastin (2.5 μM) (Sigma Aldrich), Fer-1 (1 μM) (Sigma Aldrich), and erastin (2.5 μM)+Fer-1 (1 μM) besides TGF-β1 at the same time, respectively. Cells of each group were collected after treating for 6, 12, 24, and 36 h. Cellular morphology was observed under phase-contrast microscope IX51 (Olympus, Tokyo, Japan).
Ultrastructure observation
After different treatments in six-well plate at a density of 2 × 10⁶ cells/well in 2 mL of culture medium, cells were fixed with 2.5% glutaraldehyde and postfixed with 1% OsO4. Then, all samples were routinely washed with phosphate-buffered saline (PBS), dehydrated in a graded series of acetone, and embedded in epoxy resins. Ultrathin sections were cut with an Ultramicrotome Leica EM UC7 (Leica, Mannheim, Germany), deposited on copper grids, stained with uranylacetate and lead citrate and observed by a transmission electron microscope HT7700 (Hitachi, Tokyo, Japan).
Cell viability assay
HFL1 cells were seeded in 96-well plate at a density of 1 × 10⁵ cells/well in 100 μL of culture medium. The cells were precultured for 24 h, then grouped and treated as “Cell culture and grouping.” At 6, 12, 24, and 36 h, 10 μL Cell Counting Kit-8 (CCK8) (Beyotime Institute of Biotechnology, Haimen, China) solution was added per well and incubated for 1 h at 37°C and 5% CO2 incubator, subsequently the absorbance was measured at wavelength of 450nm used SpectraMax M5 (Eppendorf, Hamburg, Germany).
ROS assay
After different treatments in 96-well plate at a density of 1 × 10⁵ cells/well in 200 μL of culture medium, ROS level was determined using 2′,7′-dichlorodihydrofluorescein diacetate (DCFH-DA) (Beyotime Institute of Biotechnology). Culture medium was removed. DCFH-DA, diluted to a final concentration of 10 μM with F12K (FBS-free), was added to cultures and incubated at 37°C for 20 min. Then, cells were washed three times with F12K without FBS. The fluorescence intensity was monitored with excitation wavelength at 488 nm and emission wavelength at 525 nm used SpectraMax M5 (Eppendorf).
Lipid peroxidation assay
After washing with PBS, the culture containing 2 × 10⁶ cells were resuspended in 500 μL PBS and broken used ultrasonic processor. Supernatants were collected and the levels of lipid peroxidation were determined by reference to a Micro-MDA Assay Reagent Kit (KeyGEN BioTECH, Nanjing, China). For this, 200 μL of thiobarbituric acid was mixed with 100 μL of supernatant. The mixture was heated at 95°C for 80 min. After cooling, the absorbance of the reaction mixture was measured at 532 nm used SpectraMax M5 (Eppendorf).
Gene expression analysis
Total RNA was extracted by RNAiso Plus (Takara, Tokyo, Japan) and the purity of RNA was qualified by OD260/OD280. The cDNA was synthesized using a Primescript™ RT Reagent Kit (Perfect Real Time) (Takara). α-SMA, COL I, and GPX4 mRNA levels were assessed by quantitative real-time polymerase chain reaction (qRT-PCR) analysis with SYBR® Green Expression Assay (Takara) on CFX96 Real-Time PCR Detection System (Bio-Rad). PCR conditions were 95°C for 30 s, followed by 40 cycles of denaturation at 95°C for 5 s, and annealing at 60°C for 30 s. The primer sequences of target genes were as follows: α-SMA gene (NM_001613): forward primer: 5′-AGCGTGGCTATTCCTTCGT-3′, reverse primer: 5′-CTCATTTTCAAAGTCCAGAGCTACA-3′; COL I (NM_000088): forward primer: 5′-CCACCAATCACCTGCGTACA-3′, reverse primer: 5′-CATCGCACAACACCTTGCC-3′; GPX4 (NM_001039847): forward primer: 5′-CCGCTGTGGAAGTGGATGAAGATC-3′, reverse primer: 5′-CTTGTCGATGAGGAACTGTGGAGAG-3′; GAPDH (NM_001256799): forward primer: 5′-GAAGGCTGGGGCTCATTT-3′, reverse primer: 5′-CAGGAGGCATTGCTGATGAT-3′. Relative expression levels of target gene and reference transcripts were calculated as 2−ΔΔCt. The test of each sample was repeated six times.
Immunofluorescent microscopy
HFL1 cells were seeded on 14-mm2 confocal plate at a density of 5 × 10⁴ cells/mL. After washing with PBS and fixing in 4% paraformaldehyde (Sigma Aldrich) for 30 min, the cells were permeabilized with 0.1% Triton X-100 (Sigma Aldrich) for 10 min and blocked with 1% bovine serum albumin (BSA) in PBS for 1 h. The plates were incubated overnight at 4°C with anti-GPX4 antibody (Abcam, Cambridge, England) in 1% BSA. After washing with PBS and blocking with 1% BSA in PBS for 20 min, the plates were incubated with a secondary antibody conjugated with goat anti-rabbit IgG H&L (Alexa Fluor 488) (Abcam) for 1 h at 4°C. After a final wash, DAPI (Abcam) was used to stain the cell nuclei for 5 min. Fluorescent images were viewed through laser confocal microscopy Leica TCS SP5 (Leica). Three views were selected randomly for each treatment, and protein expression levels (fluorescence value) were quantified by ImageJ (NIH) software.
Statistical analyses
Data were analyzed by SPSS19.0 statistical software (SPSS, Inc.). Statistical analyses were performed using nonparametric one way ANOVA and Student's t-test. Data are expressed as mean ± SEM, p < 0.05 was considered statistically different, and p < 0.01 was considered a significant difference.
Results
HFL1 cells treated with TGF-β1 presented fibrotic characteristics
α-SMA and COL I mRNA expression levels gradually increased with the processing time, presenting significant rise at 24 h (p < 0.05) and reaching a peak at 36 h (p < 0.01) after treatment with TGF-β1, compared with control group, suggesting that TGF-β1 can transform the fibroblast into myofibroblast, which was a character of pulmonary fibrosis. However, GPX4 mRNA increased early at 6 h, then gradually decreased till 36 h, and obviously reduced from 24 h after treatment with TGF-β1 (Fig. 1).
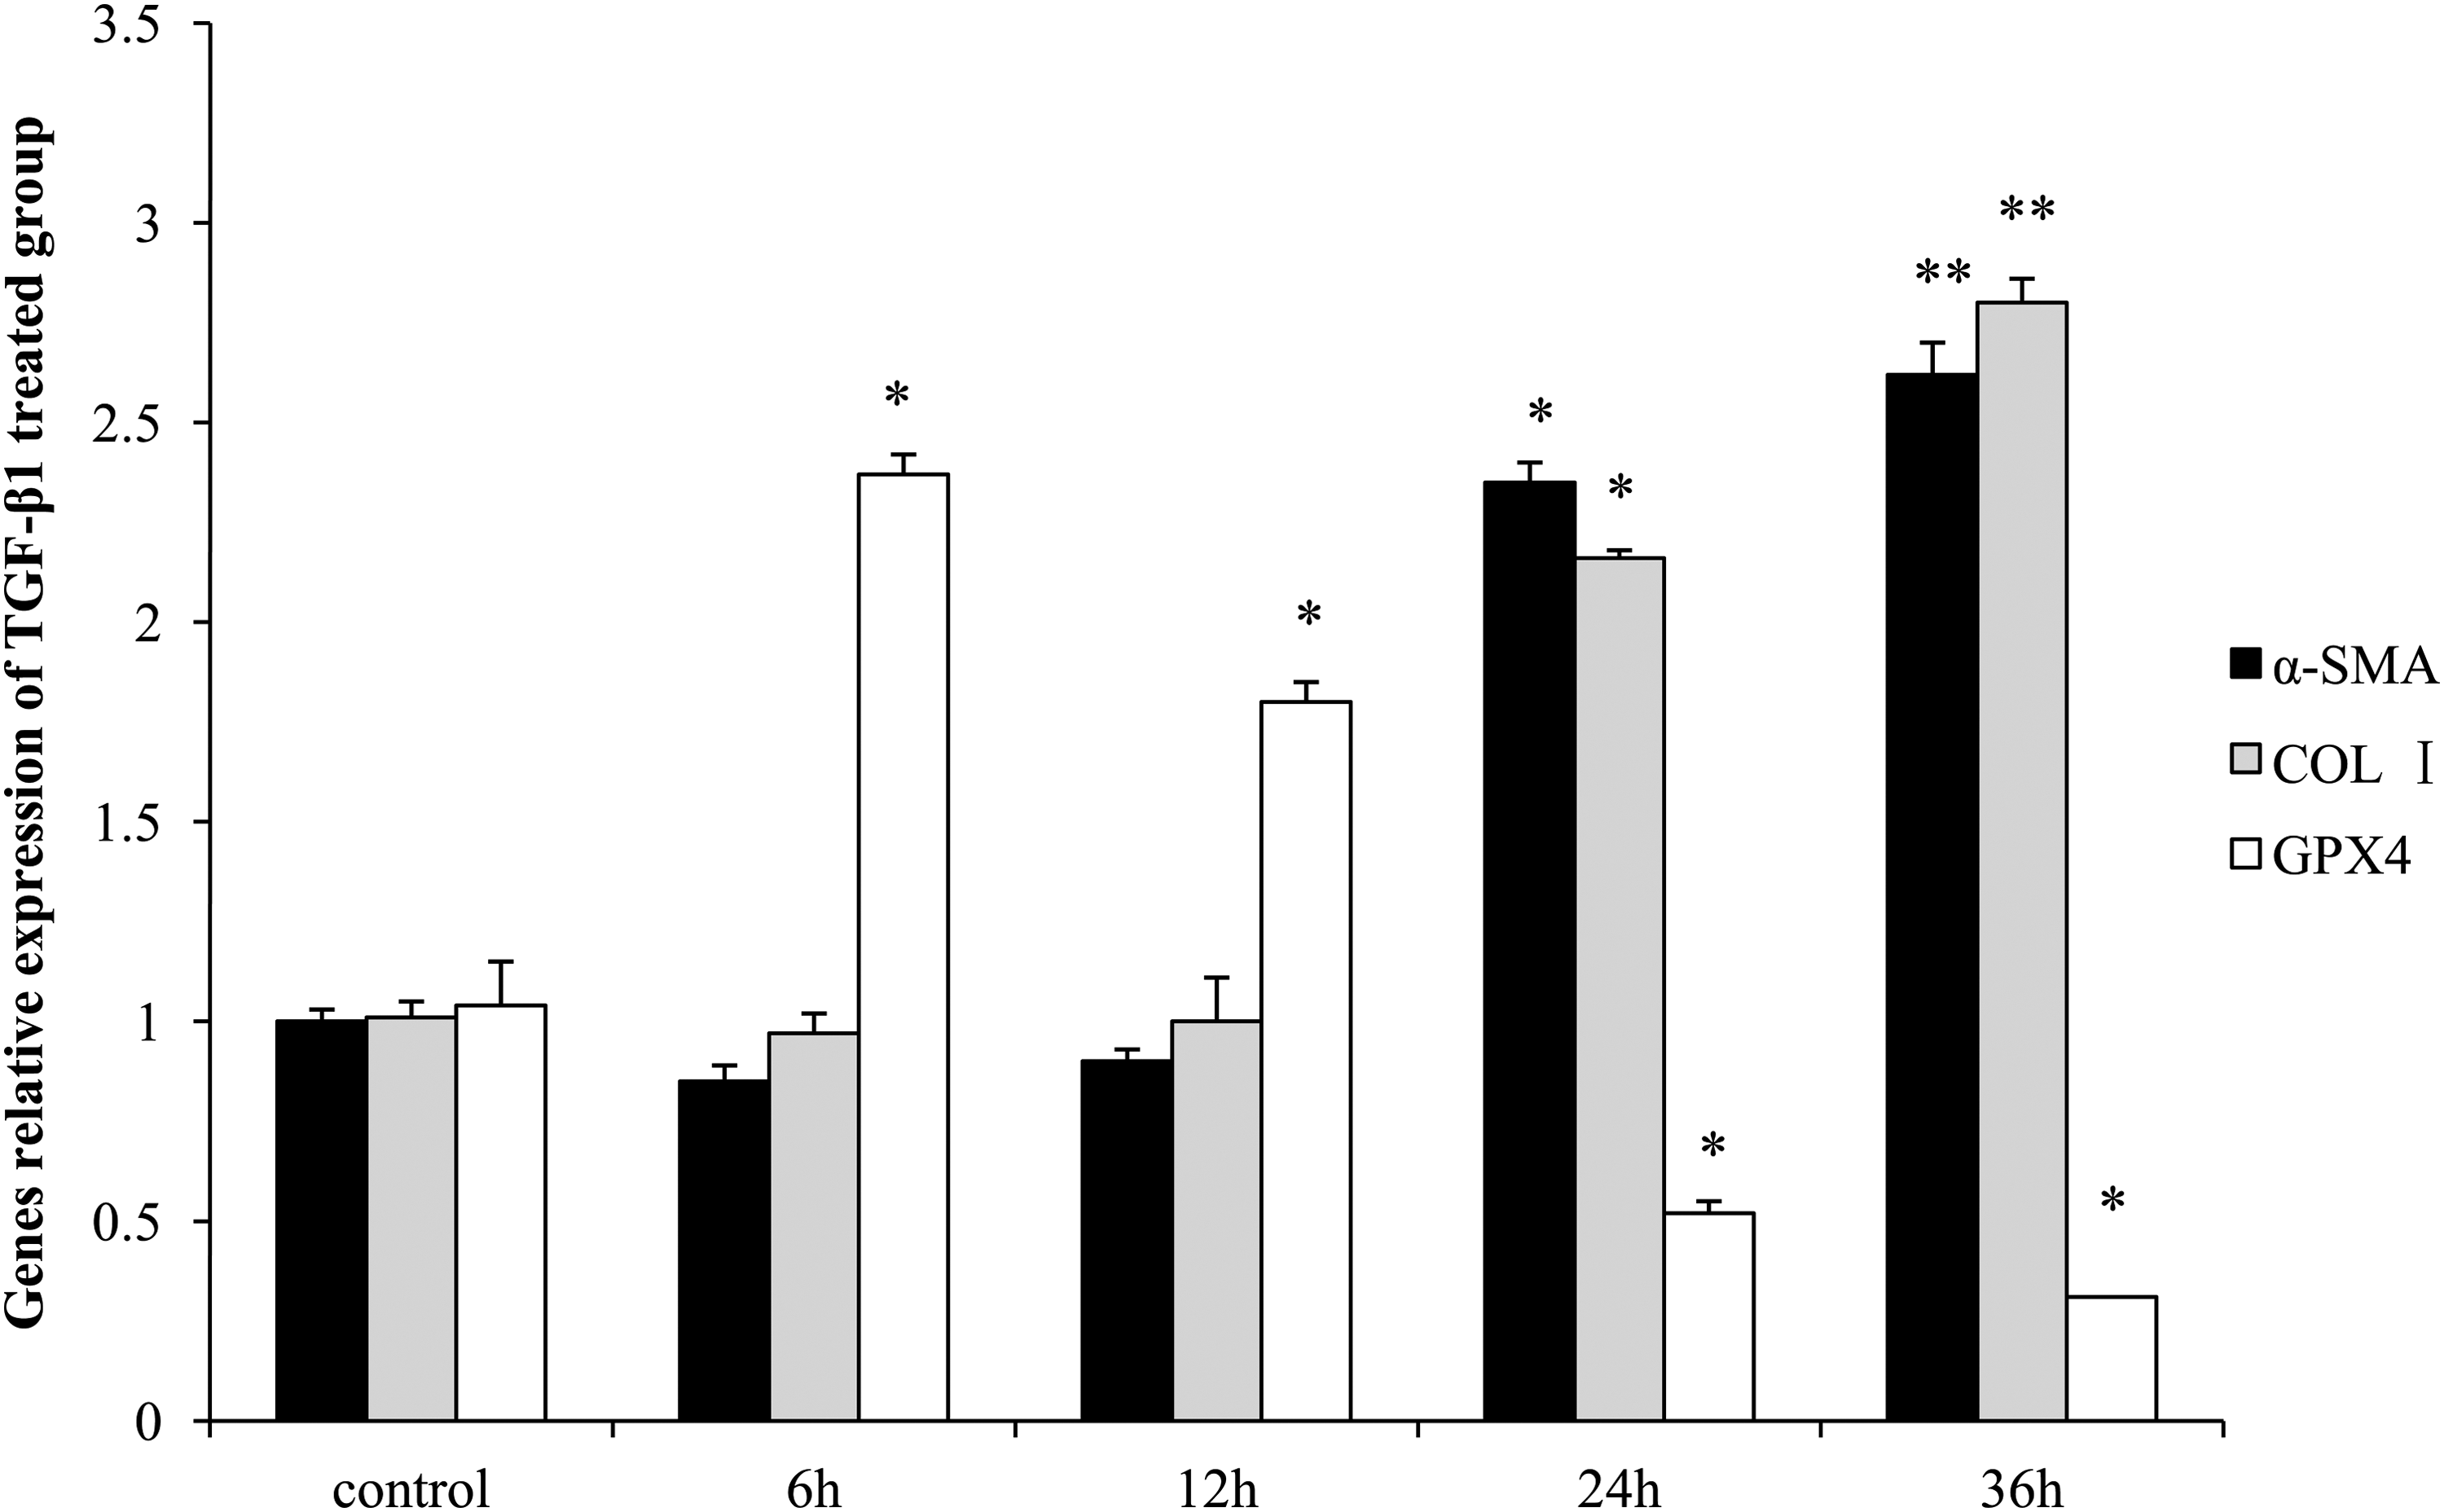
The mRNA expression levels of α-SMA, COL I, and GPX4 in HFL1 cells treated with TGF-β1. The levels were assessed by qRT-PCR and the GAPDH was the internal reference. Data are presented as mean ± SEM (n = 6). Compared with the control group, *p < 0.05 and **p < 0.01. α-SMA, α-smooth muscle actin; COL I, collagen I; GPX4, glutathione peroxidase 4; qRT-PCR, quantitative real-time polymerase chain reaction; TGF-β1, transforming growth factor-β1.
Morphologic changes of HFL1 cells in different treated groups
There were no significant difference in external morphology and no obvious cell death among control, TGF-β1-, TGF-β1+Fer-1-, and TGF-β1+erastin+Fer-1-treated groups. Cell death appeared at 12 h and gradually aggravated after treatment with TGF-β1 and erastin. It was shown that Fer-1 blocked cell death of HFL1 cells induced by erastin (Fig. 2A). As shown in Figure 2A, transmission electron microscope analysis showing the mitochondria of HFL1 cells in TGF-β1-treated group were smaller, with fewer of mitochondrial crista than those in control group at 36 h. The mitochondria in HFL1 cells of TGF-β1+erastin-treated group were smallest, with fewest/vanishing of mitochondrial crista at 36 h.
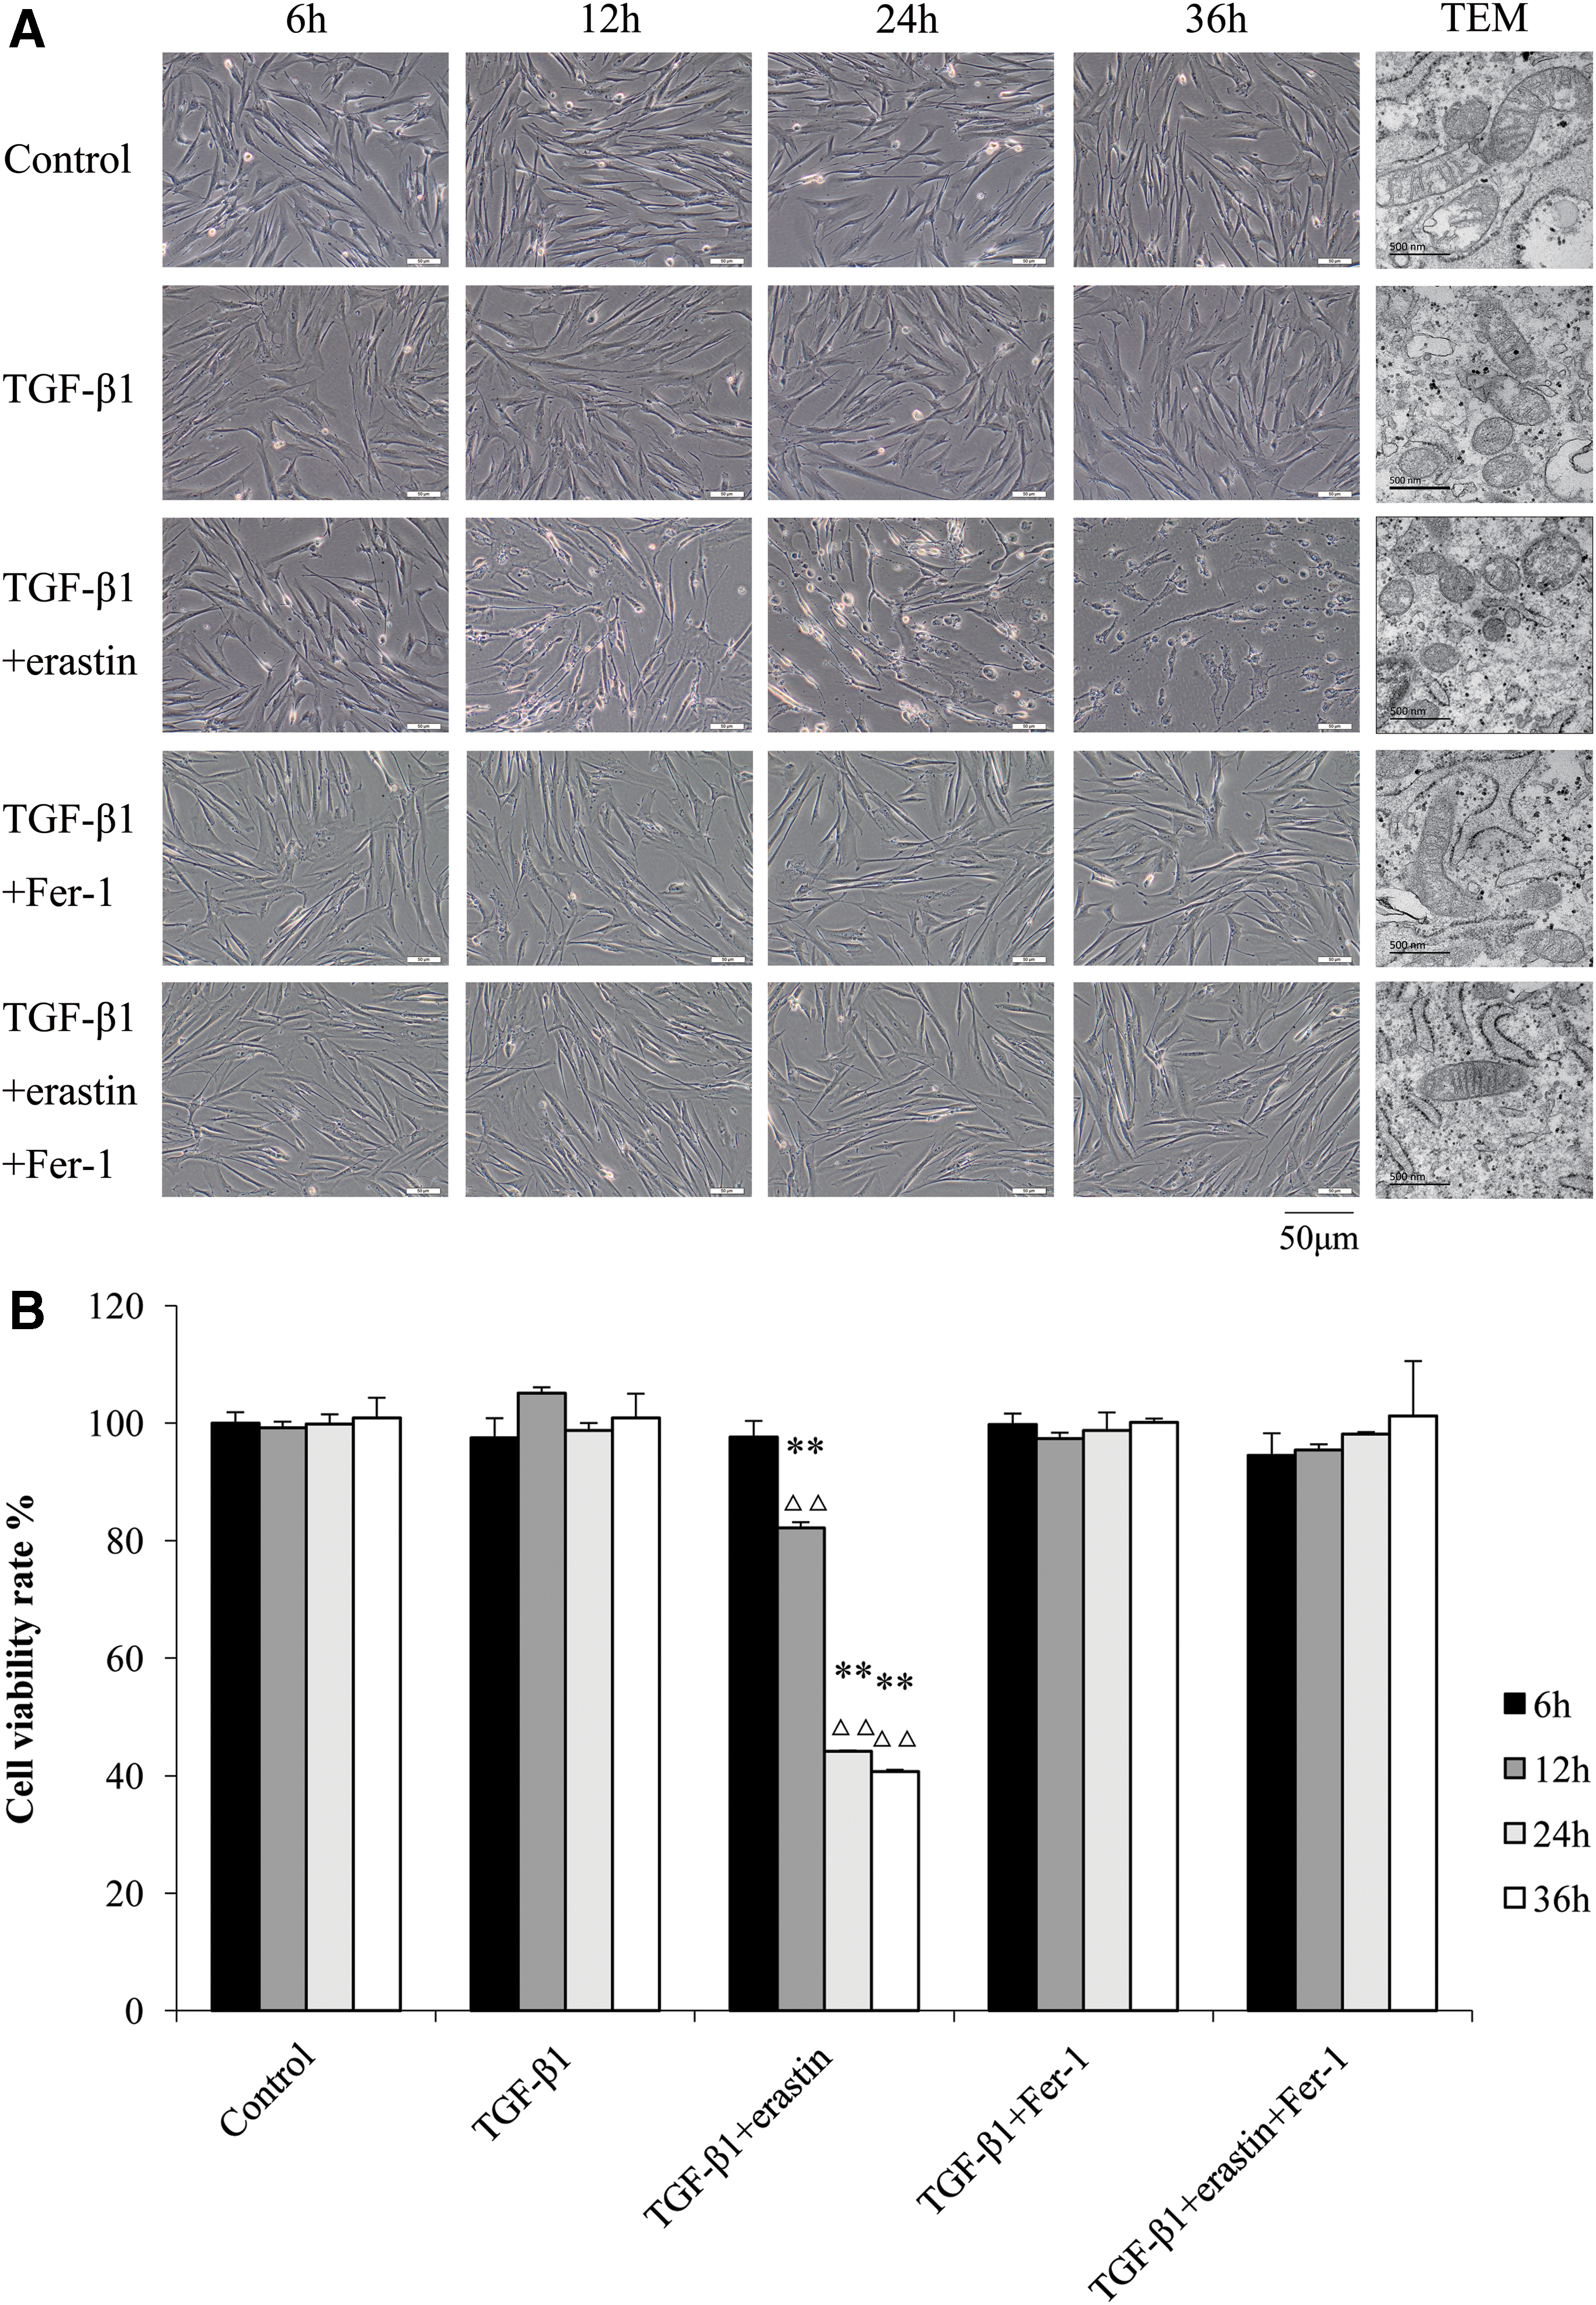
Visualization of HFL1 cell viability in different treated groups over time.
Biochemical changes of HFL1 cells in different treated groups
The cell viability was evaluated by CCK8 assay, and the percentage of cell viability is relative to control cell samples. Compared with control group and TGF-β1 group, the cell viability rate was obviously decreased in TGF-β1+erastin-treated group from 12 h, and further reduced with the time until 36 h (p < 0.01). There were no significant difference between control group and other treatment groups (Fig. 2B).
The content of intracellular ROS in TGF-β1-treated group decreased first at 6 h (p < 0.05) and 12 h (p < 0.01) and then increased obviously from 24 h (p < 0.01) compared with control group. In TGF-β1+erastin-treated group, the levels of ROS were higher significantly from 12 h than those in control group and TGF-β1-treated group at the same time points (p < 0.01), while the levels of ROS in TGF-β1+Fer-1 group were much lower than those in TGF-β1-treated group at 36 h, but higher than those in control group at 24 and 36 h (p < 0.01). The levels of ROS in TGF-β1+erastin+Fer-1 group were higher than those in control group (p < 0.01), but lower than those in TGF-β1+erastin-treated group (p < 0.01) at 24 and 36 h (Fig. 3A).
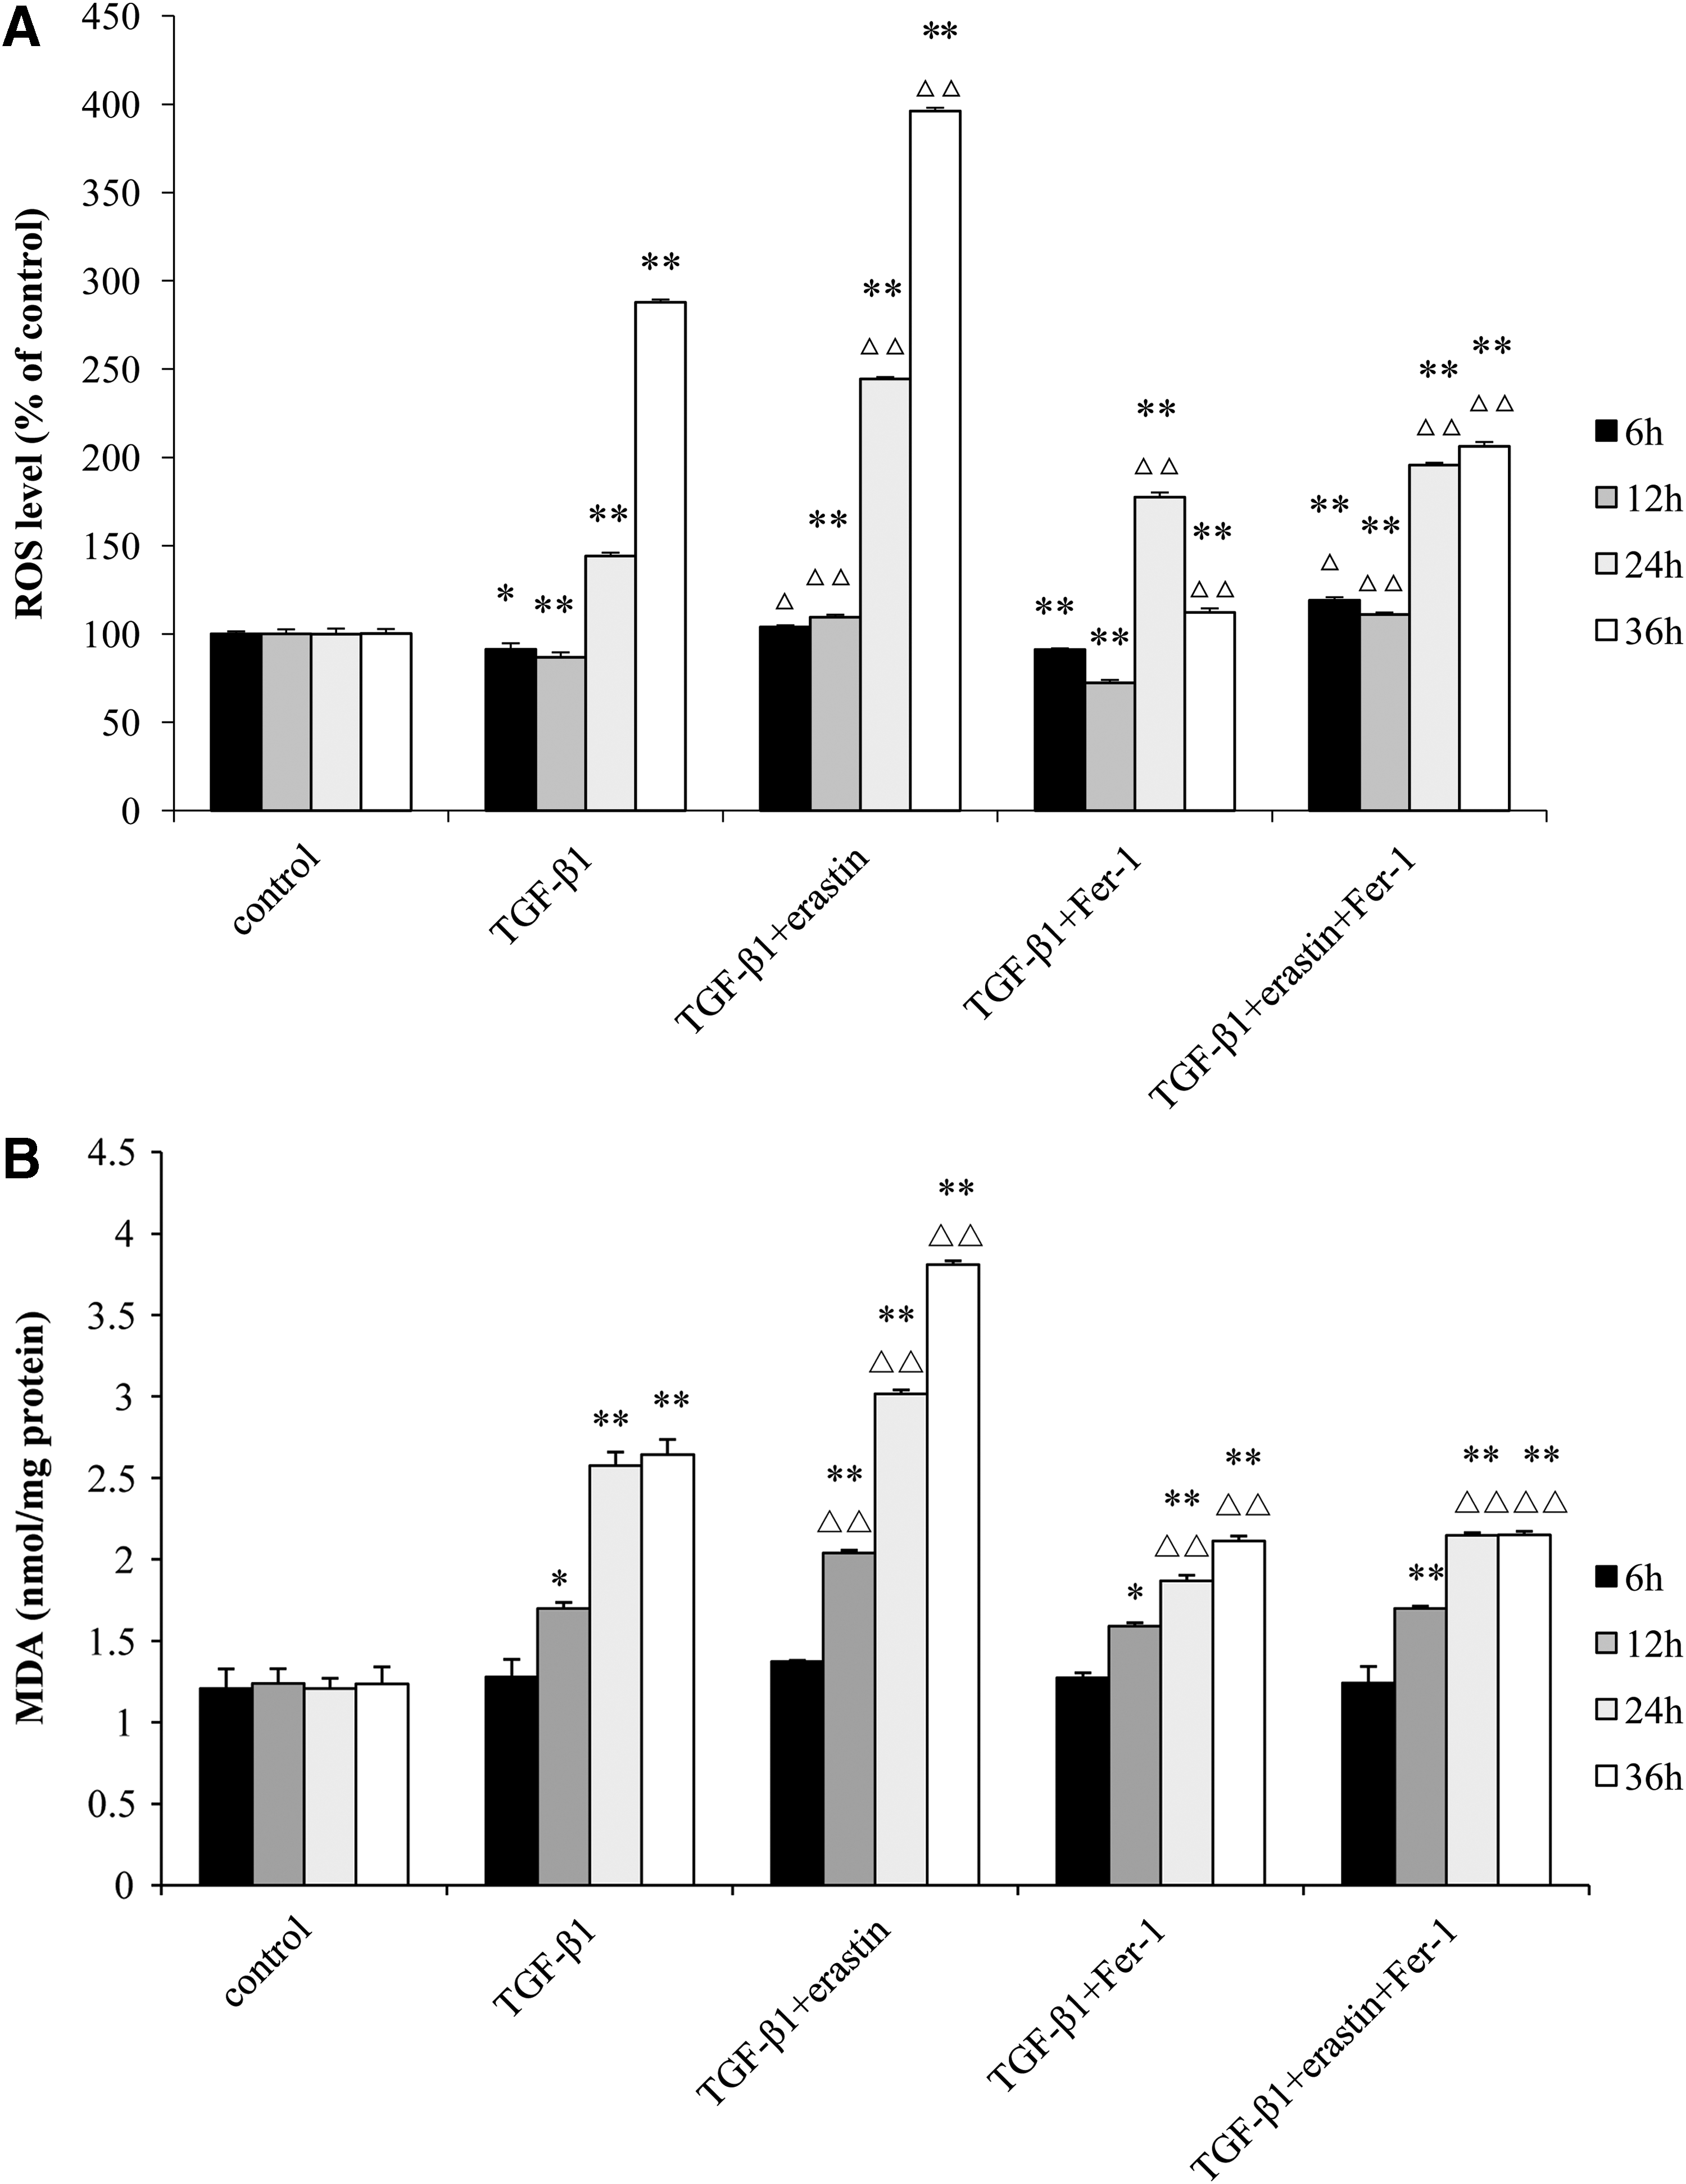
The levels of ROS
The levels of MDA in TGF-β1-treated group increased significantly from 12 h compared with control group (p < 0.05) and rose with the time till 36 h. In TGF-β1+erastin-treated group, the levels of MDA were higher obviously from 12 h than those in control group and TGF-β1-treated group (p < 0.01), while the levels of MDA in TGF-β1+Fer-1 group were much lower than those inTGF-β1-treated group at 24 and 36 h, but higher than those in control group at 12, 24, and 36 h. The levels of MDA in TGF-β1+erastin+Fer-1 group were higher than those in control group (p < 0.01), but lower than those in TGF-β1+erastin-treated group (p < 0.01) at 12, 24, and 36 h (Fig. 3B).
Erastin promoted the differentiation of HFL1 cell to myofibroblast, but blocked by Fer-1
The α-SMA and COL I mRNA expression levels were increased significantly at 24 h (p < 0.05) and reached a peak at 36 h (p < 0.01) in TGF-β1+erastin-treated group compared with TGF-β1-treated group. The expression levels of α-SMA and COL I decreased remarkably in TGF-β1+Fer-1-treated group compared with TGF-β1-treated group (p < 0.05). In TGF-β1+erastin+Fer-1-treated group, the expression levels of α-SMA and COL I were lower than these in TGF-β1+erastin-treated group, but higher than that in TGF-β1+Fer-1-treated group, recover to similar levels of TGF-β1-treated group at 24 and 36 h (Fig. 4A, B).
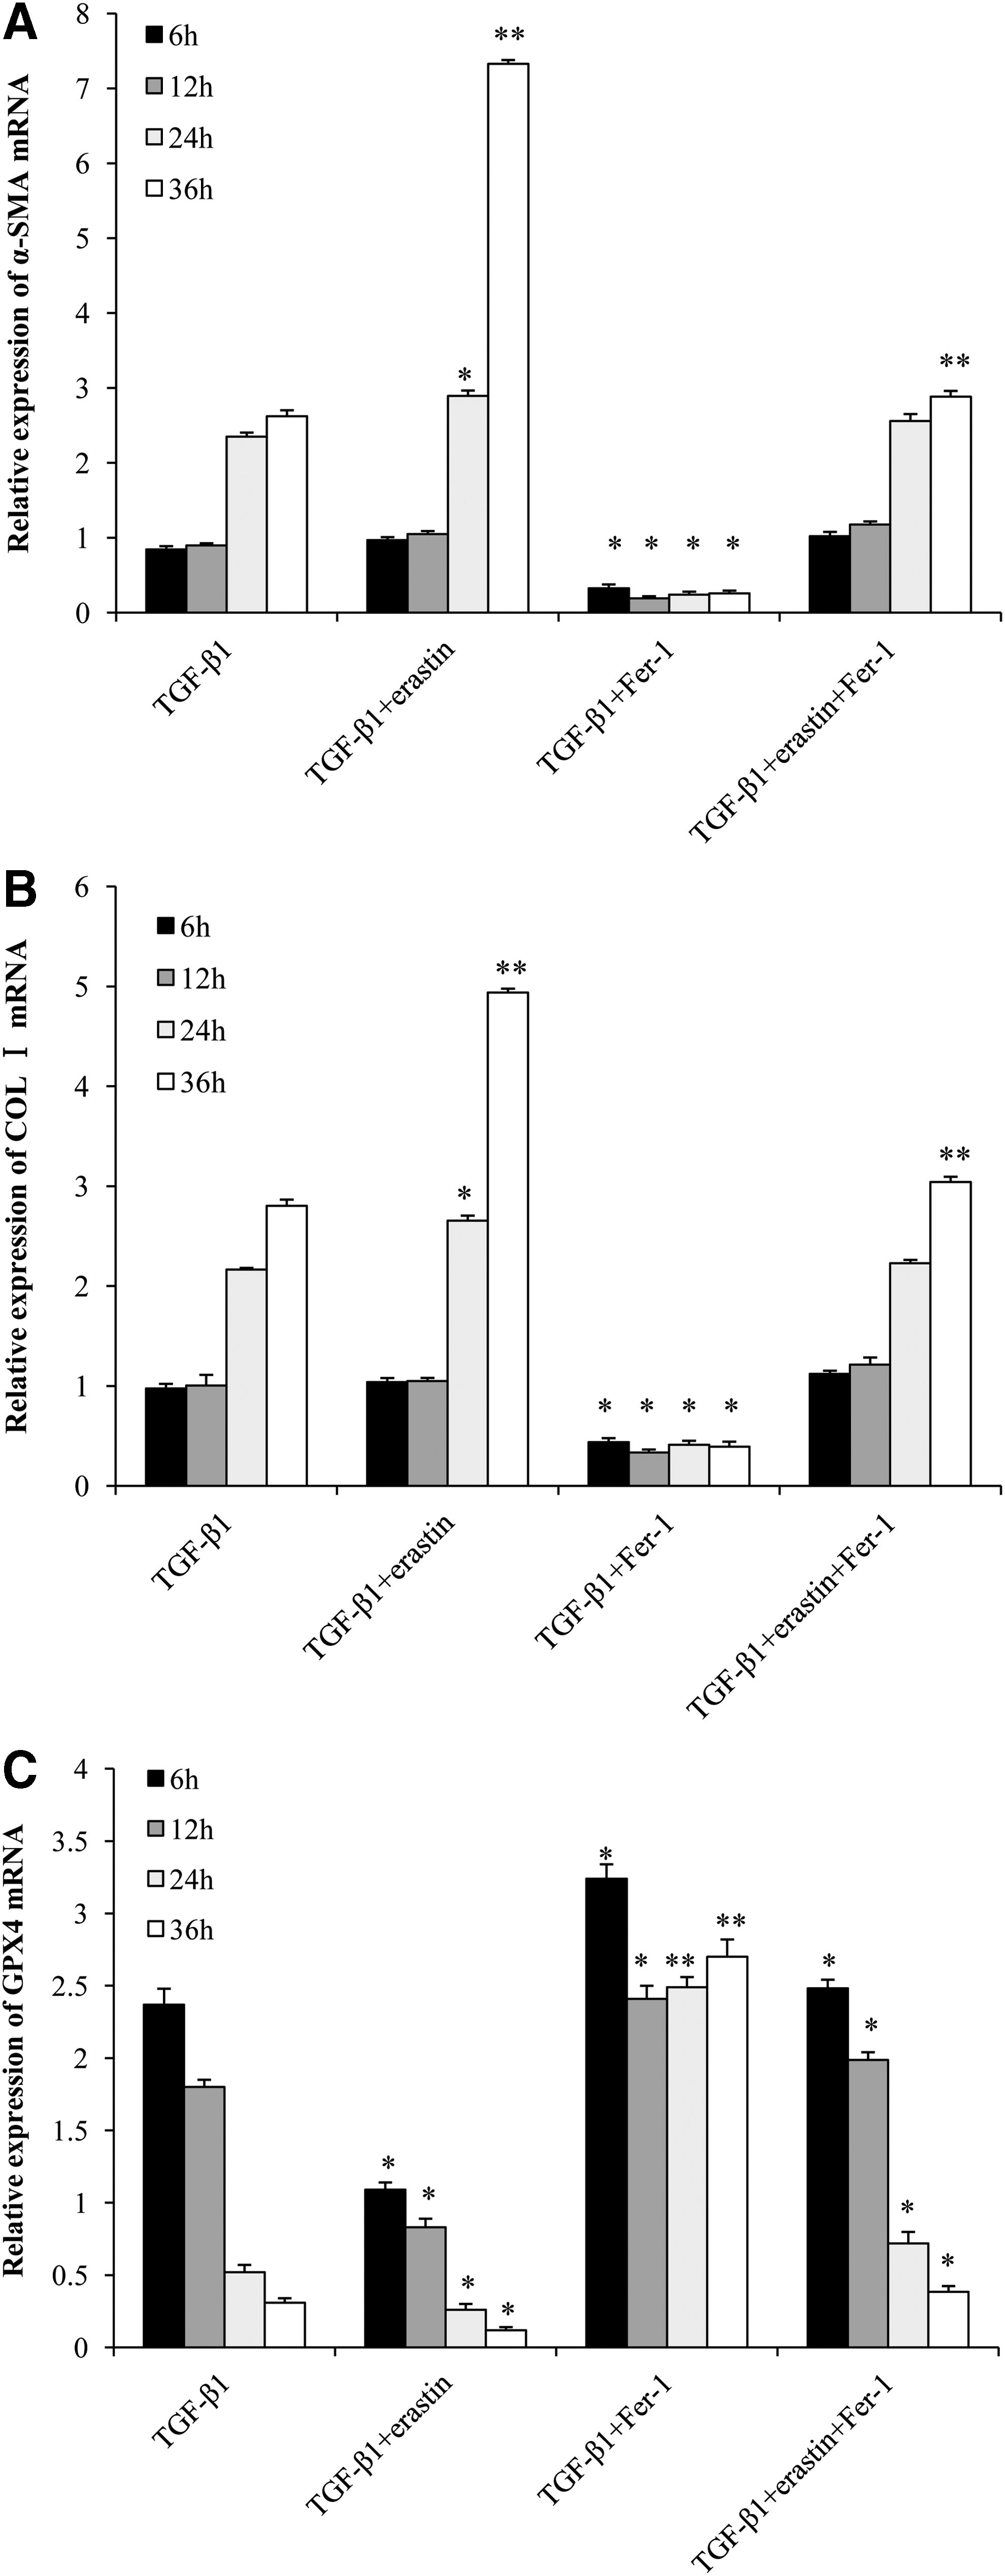
The mRNA expression levels of α-SMA
GPX4 mRNA expression in different treated groups of HFL1 cells
The expression level of GPX4 mRNA decreased from 6 h and gradually declined till 48 h in TGF-β1+erastin-treated group compared with TGF-β1-treated group (p < 0.05). In TGF-β1+Fer-1-treated group, the expression level of GPX4 mRNA increased from 6 h, and kept higher level till 36 h compared with TGF-β1-treated group (p < 0.01). In TGF-β1+erastin+Fer-1-treated group, the expression levels of GPX4 mRNA were higher than these in TGF-β1+erastin-treated group, but lower than that in TGF-β1+Fer-1-treated group (p < 0.05), recovered to similar levels in TGF-β1-treated group (Fig. 4C).
GPX4 protein expression in different treated groups of HFL1 cells
To analyze protein expression felicitously, the protein-positive signals were quantified by ImageJ (NIH) software. The expression of GPX4 protein in TGF-β1-treated group was stronger at 6 h compared with control group (p < 0.01), and gradually weaker till 36 h. GPX4 protein level was obviously lower in TGF-β1-treated group than that in control group after 24 h. The expression levels of GPX4 protein decreased from 6 h and gradually weakened till 36 h in TGF-β1+erastin-treated group compared with TGF-β1-treated group at same time points (p < 0.05). In TGF-β1+Fer-1-treated group, the levels of GPX4 protein were higher than those in TGF-β1-treated group and TGF-β1+erastin-treated group from 6 h (p < 0.05) and much higher after 24 h (p < 0.01). In TGF-β1+erastin+Fer-1-treated group, the expression levels of GPX4 protein were higher than those in TGF-β1+erastin-treated group, but lower than those in TGF-β1+Fer-1-treated group at the same time points (Fig. 5A, B).
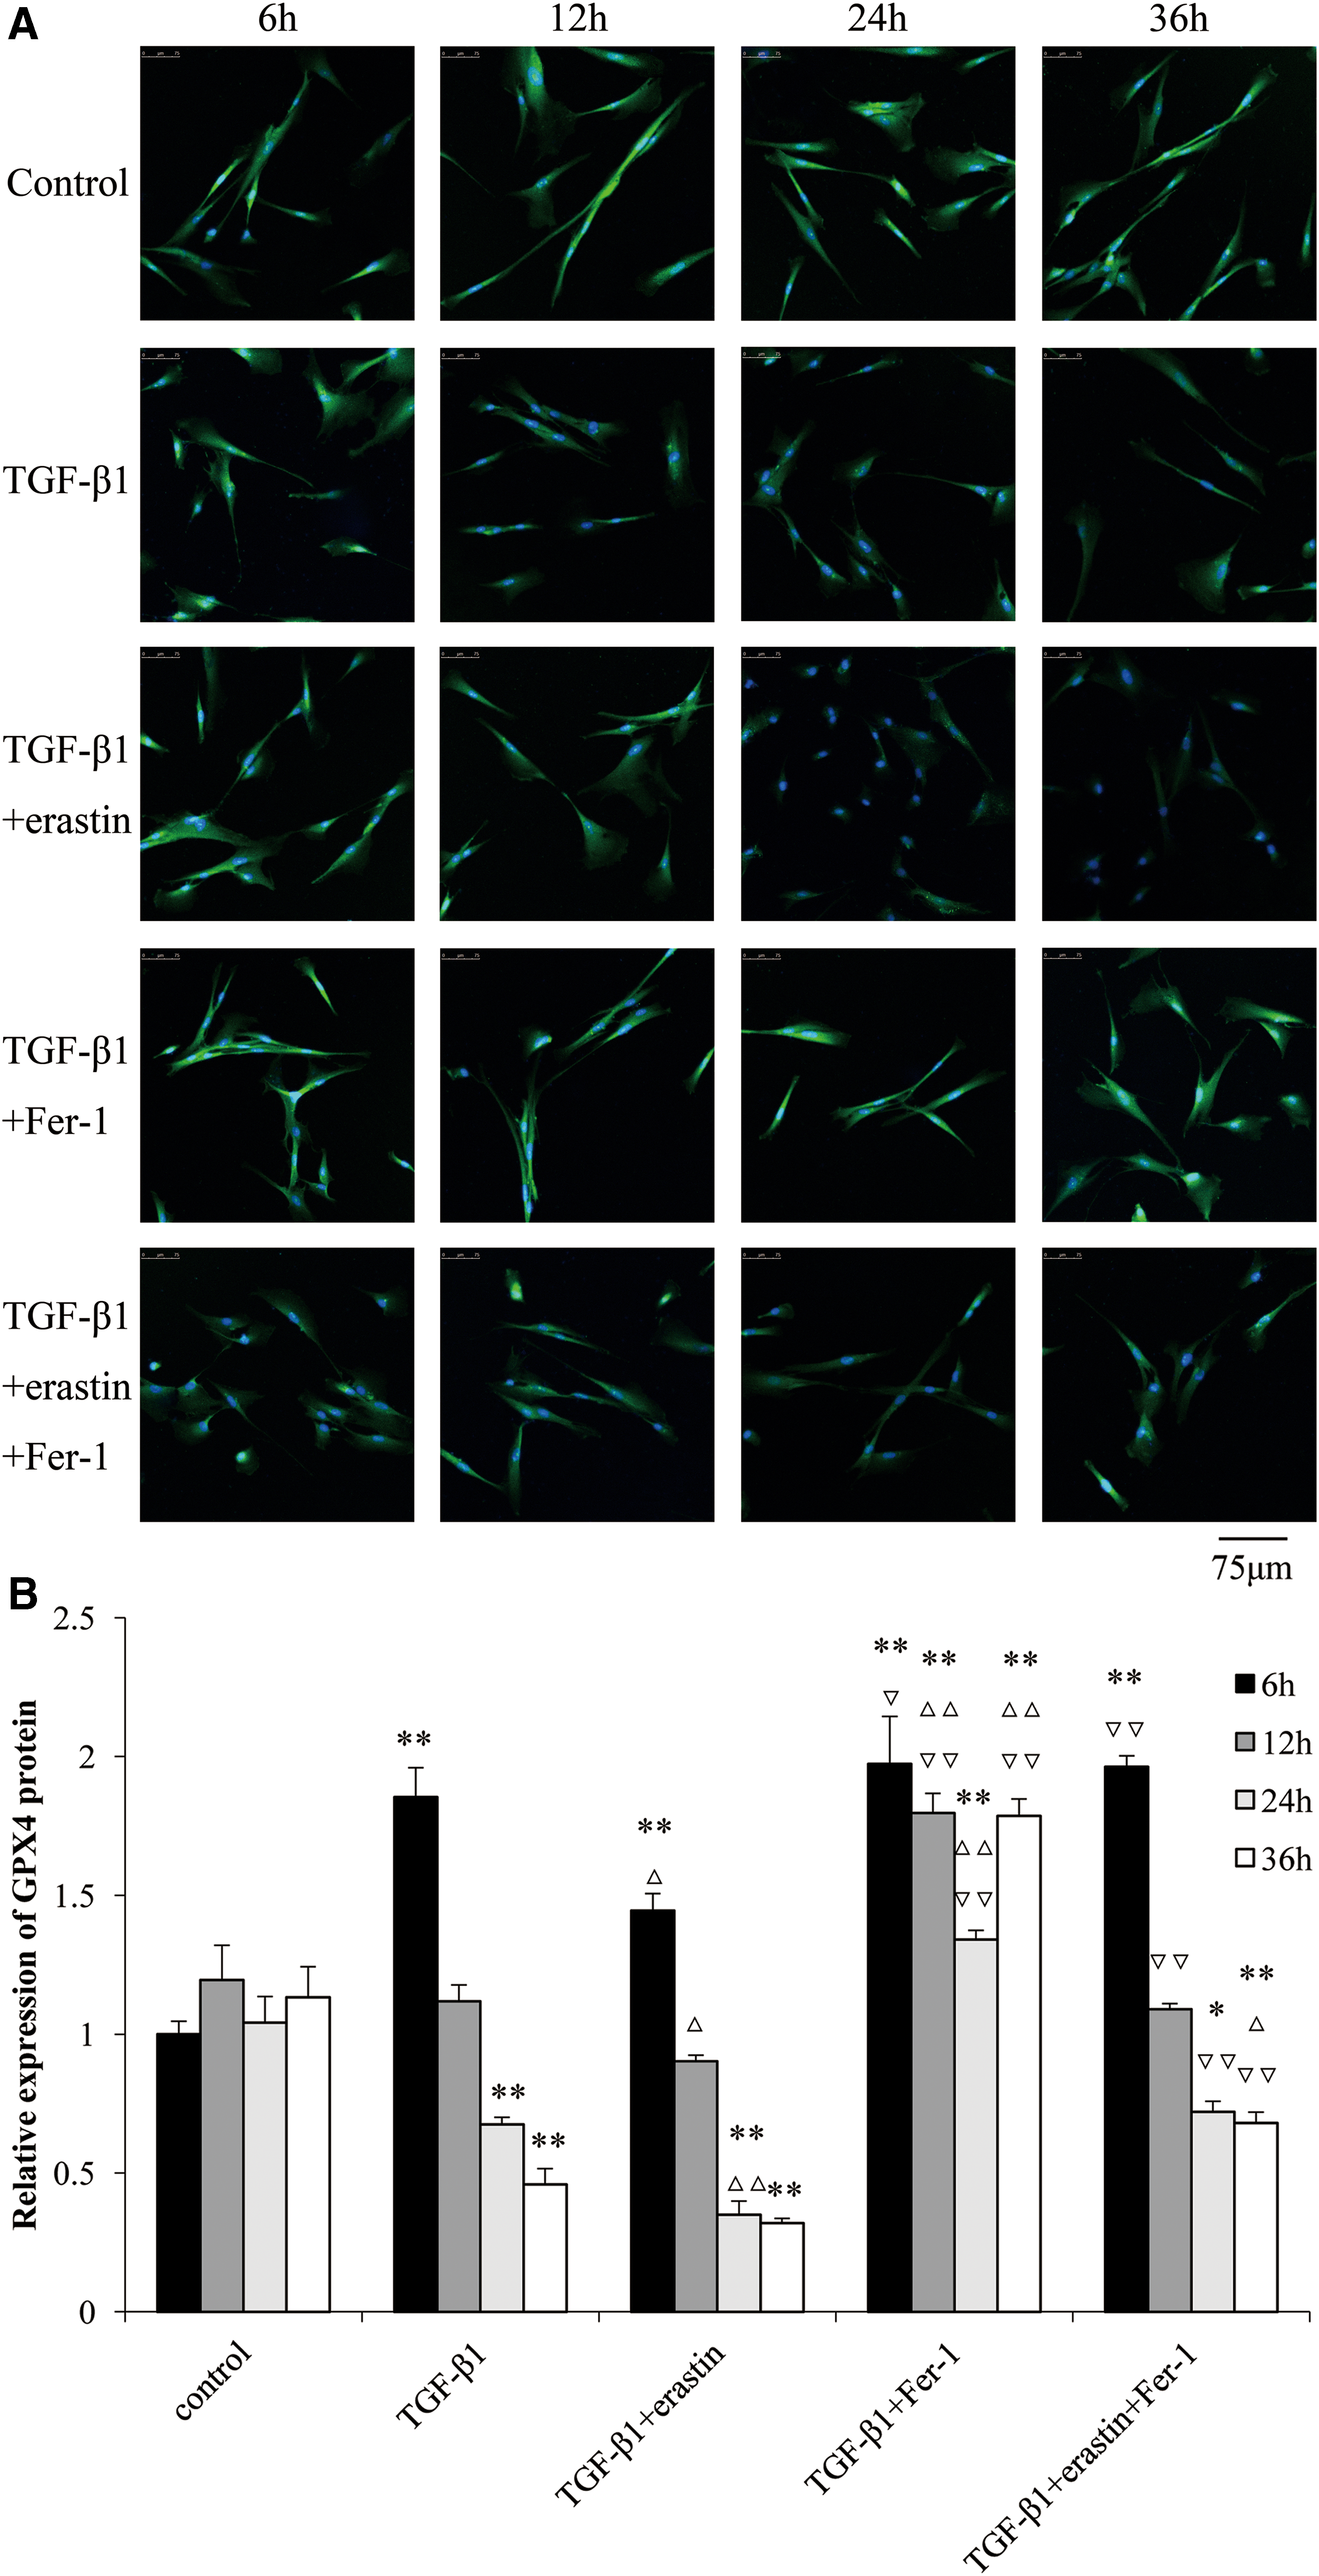
The protein expression levels of GPX4 in different treated groups of HFL1 cells over time.
Discussion
The prominent pathologic characteristic of IPF is the formation of fibrotic foci, which is composed of myofibroblasts that are characterized by overexpression of α-SMA and proteins of ECM, including fibronectin and collagens (King et al., 2011; Hinz et al., 2012). α-SMA and COL I were taken as the markers of myofibroblasts (Le et al., 2007). Human fetal lung fibroblast, HFL1, cells are usually used to explore the molecular mechanisms during IPF (Zhang et al., 2019). In this study, HFL1 cells treated by TGF-β1 were utilized as an experimental cell model of IPF, and found that the mRNA expression levels of α-SMA and COL I were increased significantly in TGF-β1-treated group after 24 h compared with control group. These results were in accordance with past literature (Hinz et al., 2012; Liu et al., 2012), showing that TGF-β1 treatment resulted in myofibroblast differentiation after 24 h.
TGF-β1 treatment suppressed the expression of glutamate-cysteine ligase, the rate-limiting enzyme in de novo GSH synthesis, decreased GSH concentration, and increased protein and lipid peroxidation in lungs of mice (Liu et al., 2012). GPX4 is an antioxidant enzyme that neutralizes lipid peroxides and protects membrane fluidity. It uses GSH as a cofactor to catalyze the reduction of lipid peroxides and protects cells and membranes against peroxidation (Latunde-Dada, 2017). Our results indicated that ROS increased first (6 h), promoting the MDA, an indicator of lipid peroxidation (6 h), and then triggers the increase of GPX4 expression (6 h) in response to excessive lipid peroxidation after TGF-β1 treatment of HFL1 cells. GPX4 activity and expression were decreased resulted from reduction of GSH and enhancement of ROS, lipid peroxidation (12 h). All these changes resulted in the overexpression of α-SMA and COL I (24 h), leading to the myofibroblast differentiation. It is suggested that ROS, lipid peroxidation, and GPX4 play important roles in the process of pulmonary fibrosis.
Erastin can induce ferroptosis in a variety of diseases (Friedmann Angeli et al., 2014; Probst et al., 2017), and Fer-1 acts as a strong inhibitor of ferroptosis (Kliment and Oury, 2010). Ferroptosis is characterized by morphological and biochemical features, including smaller than normal mitochondria with reduction/vanishing of mitochondrial crista (Dixon et al., 2012; Xie et al., 2016), iron overload, increased generation of ROS, and lipid peroxidation (Dixon et al., 2012; Xie et al., 2016; Latunde-Dada, 2017). In this study, the smaller mitochondria with reduction of mitochondrial crista were found in TGF-β1-treated HFL1cells, and smallest mitochondria with least crista appeared in TGF-β1+erastin-treated HFL1 cells. The cell viability assay kept with morphologic changes of HFL1 cells. Meanwhile, the levels of ROS and MDA were increased in TGF-β1+erastin-treated group compared with TGF-β1-treated group. All changes induced by erastin can be recovered by adding Fer-1. These results showed that cell death induced by erastin were in coincident with morphological and biochemical features of ferroptosis. Although changes were similar with some processes of ferroptosis by erastin, including elevated levels of ROS and MDA, smaller mitochondria with reduced crista were observed in TGF-β1-treated HFL1 cells, no cell death or lower cell viability were found, suggesting that mechanism of TGF-β1 were partly in common with erastin treatment, and the determinants of ferroptosis induced by erastin were not ROS generation and lipid peroxidation. The accurate mechanism about them needs further research.
Erastin inhibits cysteine transporter activity and induces the decrease of GSH and GPX4 activity, resulting in iron- or 15-LOX-dependent lipid peroxidation-induced cell death (Friedmann Angeli et al., 2014; Yang et al., 2016). Our results showed that the expression levels of GPX4 mRNA and protein levels obviously reduced early (6 h) compared with TGF-β1 treatment alone, both declined with the time, and almost undetectable at 36 h after erastin treatment. Interestingly, the mRNA expression levels of α-SMA and COL I were significantly increased in TGF-β1+erastin group compared with TGF-β1-treated group from 24 h, accompanied by increased levels of ROS and MDA. These changes induced by erastin, including GPX4, ROS, MDA, α-SMA, and COL I, were reversed by adding Fer-1. These results indicated that erastin treatment perhaps facilitated fibroblast-to-myofibroblast differentiation through reducing GPX4 expression and promoting ROS and lipid peroxidation. Inhibition of GPX4 initiates uncontrolled polyunsaturated fatty acid oxidation and fatty acid radical generation, thereby causing ferroptotic cell death, suggesting that ferroptosis is triggered or induced mainly by reduced detoxification of lipid peroxides by the enzymatic activity of GPX4 (Psathakis et al., 2006) or loss of this capacity (Seiler et al., 2008). Overexpression of GPX4 suppressed the iron-dependent lipid peroxidation in membrane, resulting in inhibition of ferroptosis induced by erastin (Imai et al., 2017). It is suggested that inhibition of GPX4 eventually leads to excessive lipid peroxidation, and then erastin promote pulmonary fibrosis by increasing lipid peroxidation.
Fer-1 inhibits ferroptosis by preventing lipid peroxidation as a radical-trapping antioxidant (Dixon, et al., 2012; Zilka et al., 2017). We found that Fer-1 inhibited the rise of ROS, MDA, α-SMA, and COL I and decrease of GPX4, which were induced by TGF-β1 and erastin, indicating that Fer-1 can inhibit the myofibroblast differentiation by suppressing lipid peroxidation and promoting GPX4 expression.
Conclusions
Our study showed that increase of ROS and lipid peroxidation and inhibition of GPX4 were common causes for pulmonary fibrosis and ferroptosis induced by erastin, but not sufficient conditions for ferroptosis. Fer-1 can improve the GPX4 expression and reduce lipid peroxidation, resulting in suppression of fibroblast-to-myofibroblast differentiation.
Footnotes
Acknowledgments
This work was supported by the Natural Science Foundation of Shandong (No. ZR2017PH069, ZR2011HM062), Medical and Health Science and Technology Development Project of Shandong (No. 2015WS0490), and Science and Technology Development Project of Binzhou Medical University (BY2015KYQD23). We appreciate Mingming Tian, Xuelian Bai, and Na Ni for their helpful discussions and comments during the study.
Disclosure Statement
The authors declared no conflicts of interest with respect to the authorship and/or publication of this article.