




Abstract
The biological functions of lipocalin-1 (LCN1) are involved in innate immune responses and act as a physiological scavenger of potentially harmful lipophilic molecules. However, the relevance of LCN1 with cancer is rarely concerned currently. The aim of this study is to address the relevance of LCN1 with BRCA by bioinformatics. In this study, we found that the expressions of LCN1 increased significantly in various cancerous tissues, including BRCA, compared with their adjacent normal tissues through the TIMER database. Furthermore, UALCAN database analysis showed that the expression of LCN1 increased gradually from stage 1 to stage 4 and was upregulated in BRCA patients with different races and subtypes compared with that in the normal. In addition, those patients with perimenopause and postmenopause status displayed higher LCN1 expression. Importantly, LCN1 genetic alterations, including copy number amplification, deep deletion, and missense mutation, could be found, and the alteration frequency showed difference in various invasive BRCA through cBioPortal database. Moreover, a positive correlation between LCN1 somatic copy number alterations and immune cell enrichments was revealed in basal like BRCA by GISTIC 2.0. Finally, analysis on prognostic value of LCN1 by Kaplan–Meier plotter showed that low LCN1 expression correlated with poor prognosis for relapse-free survival in all types of BRCA, overall survival in luminal B BRCA, distant metastasis free survival in human epithelial growth factor receptor-2 (HER2) positive BRCA, and postprogression survival (PPS) in luminal A BRCA. But high LCN1 expression also displayed poor prognosis for PPS in HER2 positive BRCA. The results together verified the significance of LCN1 in BRCA, suggesting that it may be a potential biomarker for BRCA diagnosis.
Introduction
Breast cancer (BRCA) is a highly prevalent disease and the most frequent cause of cancer death in women worldwide (Miller et al., 2016; Nagini, 2017). Survival rates of this disease largely depend on what stage the patients are diagnosed. Patients who are detected at an early stage have more superior survival rates. BRCA is regarded as a complex heterogeneous disease, which displays significant diversity based on histopathological features and therapeutic responses. The molecular classification of BRCA is classified into different subtypes based on the hormone receptor status and human epithelial growth factor receptor-2 (HER2) expression, namely luminal A, luminal B, HER2 enriched, and basal-like/triple negative breast cancer. Thus, the diagnostic approach and targeted therapy to breast cancer should be subtype oriented to achieve the optimal therapeutic efficiency.
Traditional diagnostic methods, such as mammography, although very effective, are limited for the fact that locoregional or distant metastasis may have already taken place before breast cancer diagnosis (O'Donoghue et al., 2014; Jafari et al., 2018). To achieve much ideal diagnostic efficiency, research groups have focused on biomarkers based on blood and saliva, which will facilitate detection of BRCA in its infancy before it has spread beyond the primary site (Duffy et al., 2015). Except for the traditional laboratory techniques, the DNA microarray technology has also been widely used to analyze gene expression among breast cancer patients.
Currently, the machine learning approaches have been utilized to help identify the genomic profiles among different breast cancer survivors who undergo varying treatment types (Cardoso et al., 2016; Tabl et al., 2018, 2019; Zeng et al., 2018). For example, Tabl et al. (2018) adopted improved learning approaches for breast cancer analysis. An unsupervised learning approach was implemented to find the separation between the treatment-survival groups of classes. And a newly hierarchical machine learning system was introduced to help predict the 5-year survivability of the patients undergoing although specific type of therapy (Tabl et al., 2019). Analyzing the genomic profiles of breast cancers contributes to a better understanding of the disease's progression and the body response to the treatment. Therefore, the bioinformatic analysis could provide clues to find biomarkers in breast cancer and help personalize the treatment based on the patients' gene expression.
Lipocalins (LCNs) are a family of proteins that are involved in the transport of steroids and lipids into cells. LCN2 is thought to be involved in multiple cellular processes, including maintenance of skin homeostasis, and suppression of invasiveness and metastasis (Lee et al., 2008; Venge et al., 2015; Xiao et al., 2017). Upregulation of LCN2 had been observed in multiple cancers, including breast cancer, cholangiocarcinoma, lung cancer, esophageal cancer, pancreatic cancer, prostate cancer, and some other cancers (Leng et al., 2011; Song et al., 2015; Chiang et al., 2016; Ding et al., 2016; Gomez-Chou et al., 2017; Meng et al., 2017; Celestino et al., 2018). Studies have indicated that LCN2 can be an important regulator of tumorigenesis and metastasis and regarded as a newly identified biomarker and a potential therapeutic target for BRCA (Leng et al., 2011; Oren et al., 2016). However, studies on function of LCN1, another member of the LCN superfamily, are relative less.
Researchers have suggested that LCN1 is produced exclusively by a number of exocrine glands and tissues, including lachrymal and lingual glands, prostate, secretory glands of the tracheobronchial tract, sweat gland, and pituitary gland (Holzfeind et al., 1997; Wojnar et al., 2002). Thus, LCN1 can be expressed in tears, lingual sweat, and lower airway glands, and it can be detected in bronchoalveolar lavage fluid and saliva. Taking these facts together, LCN1 might be a potential biomarker to indicate physiological or pathological disturbance. Some studies have proved that LCN1 can function as a physiological scavenger of potentially harmful lipophilic molecules, act as a cysteine proteinase inhibitor, and play antimicrobial activities (Redl et al., 1998; Redl, 2000; Lechner et al., 2001; Wojnar et al., 2002). However, researches on LCN1 were relatively rare, and the precise biological function of LCN1 has not been fully characterized.
Currently, the relevance of LCN1 function with the tumorigenesis is still unknown. In our previous study on biomarker screening, we found that LCN1 level was abnormally downregulated in salivary sample of subjects with breast cancer compared with the healthy controls through isobaric tags for relative and absolute quantitation. To further address the correlation of LCN1 with BRCA, bioinformatic analysis was performed in this study. LCN1 expression in BRCA was assessed through TIMER and UALCAN databases. Meanwhile, genetic alterations of LCN1 were analyzed by cBioPortal database, and the correlation between somatic copy number alterations (SCNAs) of LCN1 and immune cell enrichments in BRCA was also analyzed by GISTIC 2.0. In addition, affection of LCN1 expression on the survival for breast cancer patients was also predicted by Kaplan–Meier plotter. Thus, the purpose of this study was to evaluate the potential role of LCN1 to be a biomarker for BRCA diagnosis.
Materials and Methods
Differential expression of LCN1 by TIMER and UALCAN
TIMER database (Tumor Immune Estimation Resource)* is a comprehensive resource for systematical analysis of immune infiltrates across diverse cancer types. The differential expression of target gene between tumor and adjacent normal tissue could be explored by using of Diff Exp module across all the TCGA (The Cancer Genome Atlas) database tumors. To study the difference of LCN1 expression between different tumors and the adjacent normal tissues, the TIMER database was used. The distributions of LCN1 expression levels were shown with box plots, and the statistical significance of LCN1 expression was evaluated using Wilcoxon test. To analyze LCN1 expression in breast cancer patients with different conditions, including individual stage, further UALCAN database analysis** was performed as well (Chandrashekar et al., 2017). In the UALCAN analysis page, the TCGA dataset was defined as breast invasive carcinoma for LCN1 expression analysis. The LCN1 expression based on individual cancer stage, major subclasses, patient's race, and menopause status was analyzed, respectively.
Genomic alteration of LCN1 by cBioPortal database
To study the LCN1 mutation in breast cancer and comparative analysis of LCN1 mutations with other reported oncogenes, the cBioPortal database † was applied. Genomic alteration types, alteration frequency in breast cancer with different phenotypes, and protein change in amino acid were analyzed. The genomic alterations of LCN1 included copy number amplification, deep deletion, missense mutation with unknown significance, mRNA upregulation, and so on.
Immune infiltration in breast cancer with different SCNAs by GISTIC 2.0
SCNA analysis of LCN1 was conducted by GISTIC 2.0. The GISTIC module identifies regions of the LCN1 genome that are significantly amplified or deleted across a set of samples. Each aberration is assigned a G-score that considers the amplitude of the aberration, as well as the frequency of its occurrence across samples. In the genomic datasets, SCNAs of LCN1 in breast cancer were divided into five levels, including deep deletion (−2), arm-level deletion (−1), normal (0), arm-level gain (1), and high amplification (2). Box plots are presented to show the distributions of each immune subset at each copy number status in each subtype of breast cancer. The infiltration level for each SCNA category is compared with the normal using two-sided Wilcoxon rank sum test. False Discovery Rate q-values are calculated for the aberrant regions, and regions with q-values below a user-defined threshold are considered significant.
Survival analysis
Affection of LCN1 expression on the survival of breast cancer patients with distinct subtypes was evaluated through the Kaplan–Meier plotter analysis ‡ (Gyorffy et al., 2010). Available TCGA patient survival data were used for Kaplan–Meier survival analysis and to generate overall survival (OS) plots. The y-axis represented the impact of LCN1 expression on OS, distant metastasis-free (DMF) survival, postprogression survival (PPS), and relapse-free survival (RFS) separately, and the x-axis represented the observation time. The two group patient cohorts are compared by Kaplan–Meier curves, and the hazard ratios with their corresponding 95% confidence intervals and log-rank p value are calculated (Gyorffy et al., 2010). p < 0.05 was considered statistically significant.
Result
The differential expression of LCN1 was much higher in various tumors
Due to the fact that LCN1 has a potential role as a sensitive indicator in saliva, it might represent an important new target or biomarker for cancer diagnosis. To figure out whether LCN1 expression correlates with cancer, we evaluated LCN1 expression in different tumors and adjacent normal tissues through the TIMER database. As shown in Figure 1, LCN1 expression was found to be significantly higher in various cancerous tissues compared with adjacent normal tissues, such as BRCA, bladder urothelial carcinoma (BLCA), colon adenocarcinoma (COAD), esophageal carcinoma (ESCA), head and neck squamous cell carcinoma (HNSC), kidney renal clear cell carcinoma (KIRC), liver hepatocellular carcinoma (LIHC), prostate adenocarcinoma (PRAD), rectum adenocarcinoma (READ), stomach adenocarcinoma (STAD), and thyroid carcinoma (THCA). The expression profiling of LCN1 indicated that it might be acting as an oncogenic molecule in the development of various types of tumors.

The expression of LCN1 in the cancerous tissues and in adjacent normal tissues. The LCN1 expression was analyzed in various cancerous tissues and adjacent normal tissues through the TIMER database. *p < 0.05, **p < 0.01, ***p < 0.01. LCN1, lipocalin-1. Color images are available online.
The clinical significance of LCN1 was closely correlated with breast cancer
Since LCN1 expression was greatly upregulated in breast cancer samples than in adjacent normal tissues, we next concentrated on detection of LCN1 expression in breast cancer patients with different conditions by further UALCAN database analysis. The results showed that LCN1 expression was much higher in the primary breast cancer compared with that in the normal (Supplementary Fig. S1). While further analyzing LCN1 expression in breast cancer based on individual cancer stages, we found that LCN1 expression was closely associated with the cancer stages, and breast cancer in stage 4 exhibited the highest LCN1 expression (Fig. 2A). Another factor that we were concerned was influence of race difference on LCN1 expression. LCN1 expression was analyzed in breast cancer patients of Caucasian, African American, and Asian separately. The results indicated that LCN1 expressions in the above three races were all obviously increased compared with that in normal (Fig. 2B). In addition, LCN1 expressions in three distinct subtypes namely luminal, HER2 positive, and triple negative breast cancer were all dramatically upregulated than that in control (Fig. 2C). And also, LCN1 expression based on menopause status was analyzed as well. It was found that those breast cancer patients with perimenopause and postmenopause status suffered higher LCN1 expression (Fig. 2D). All these data together indicated that high LCN1 expression was widely correlated with breast cancer.
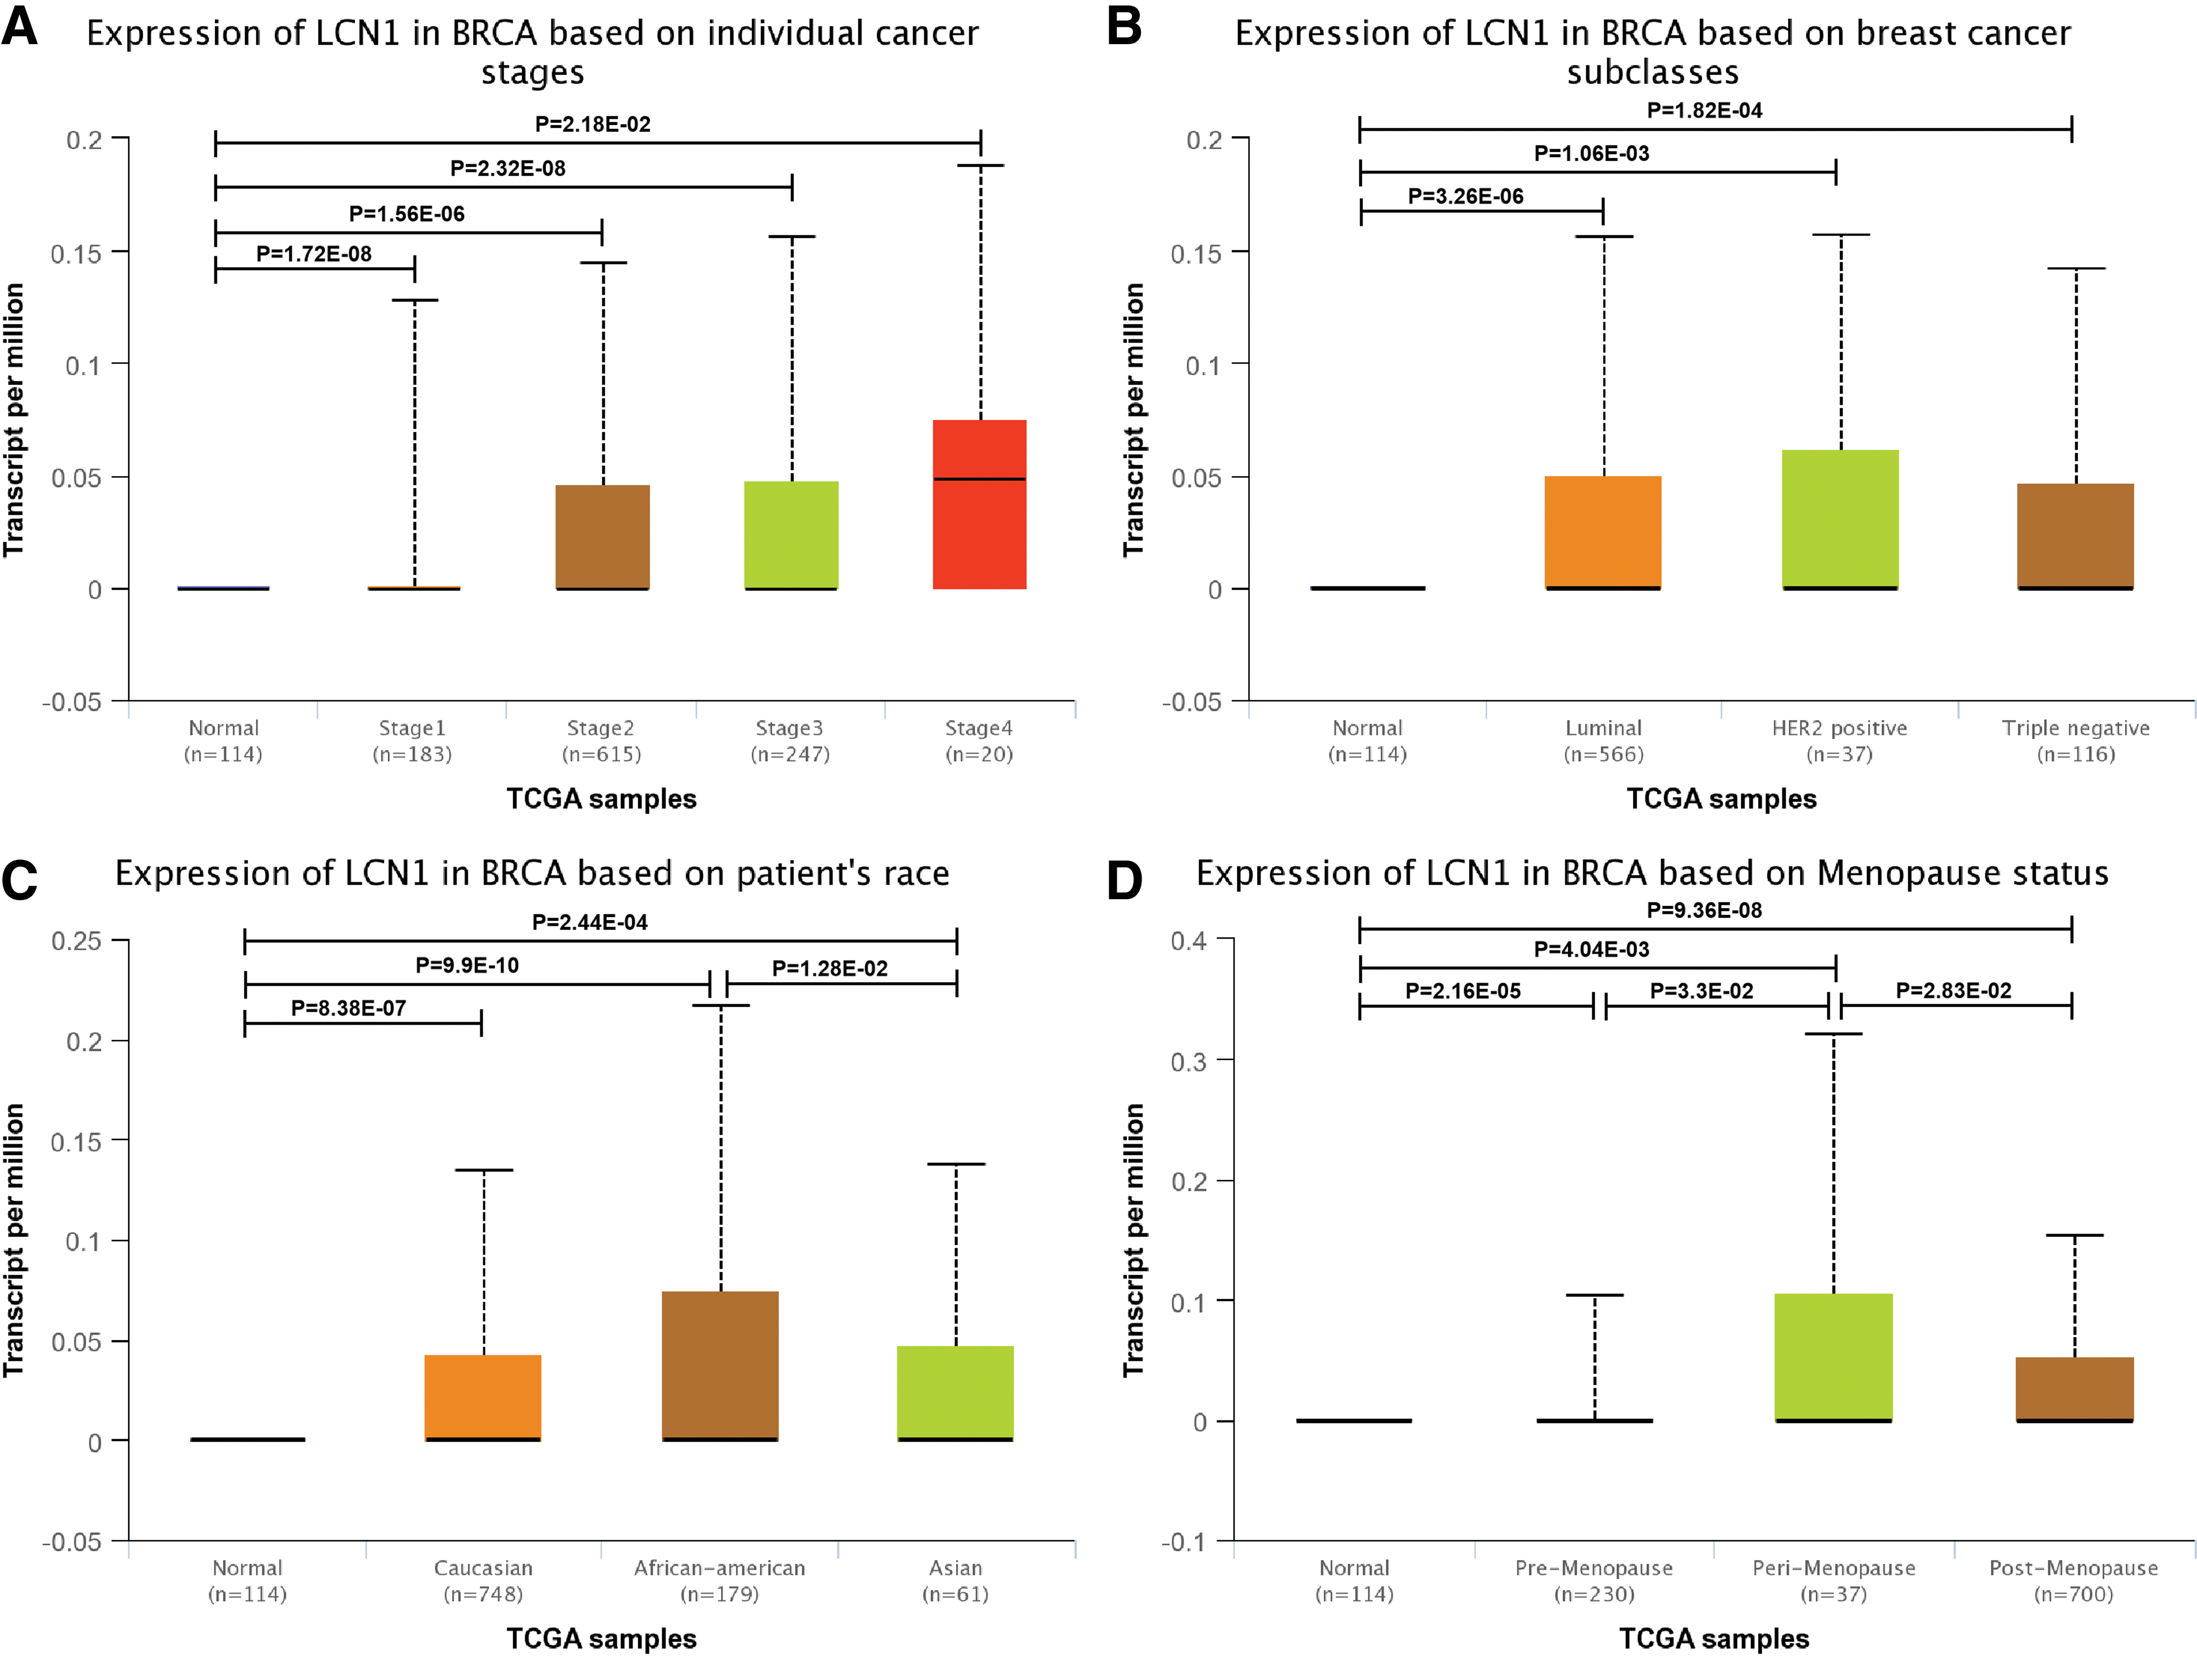
The relative expression of LCN1 in breast cancer. UALCAN database was used to assess the relative LCN1 level in
Genomic mutation of LCN1 was found by cBioPortal database analysis
It has been proved that genomic mutation is closely associated with tumorigenesis. To figure out genomic mutation of LCN1 in breast cancer, comparative analysis of LCN1, P53, BRCA1, and BRCA2 was performed. The results showed that there was about 2.8% of genetic alteration of LCN1 in breast cancer, including copy number amplification and deep deletion, missense mutation with unknown significance, and mRNA upregulation (Fig. 3A). And, genetic alteration type and frequency of LCN1 showed difference in various invasive breast cancers (Fig. 3B). In addition, missense mutation of LCN1 resulted in the amino acid change, including aspartic acid (D) 25 replaced by tyrosine (Y) and glutamic acid (E) 146 replaced by lysine (K) (Fig. 3C). The above results indicated that genetic alteration of LCN1 could be found in breast cancer, which might play an important role in tumorigenesis of breast cancer.
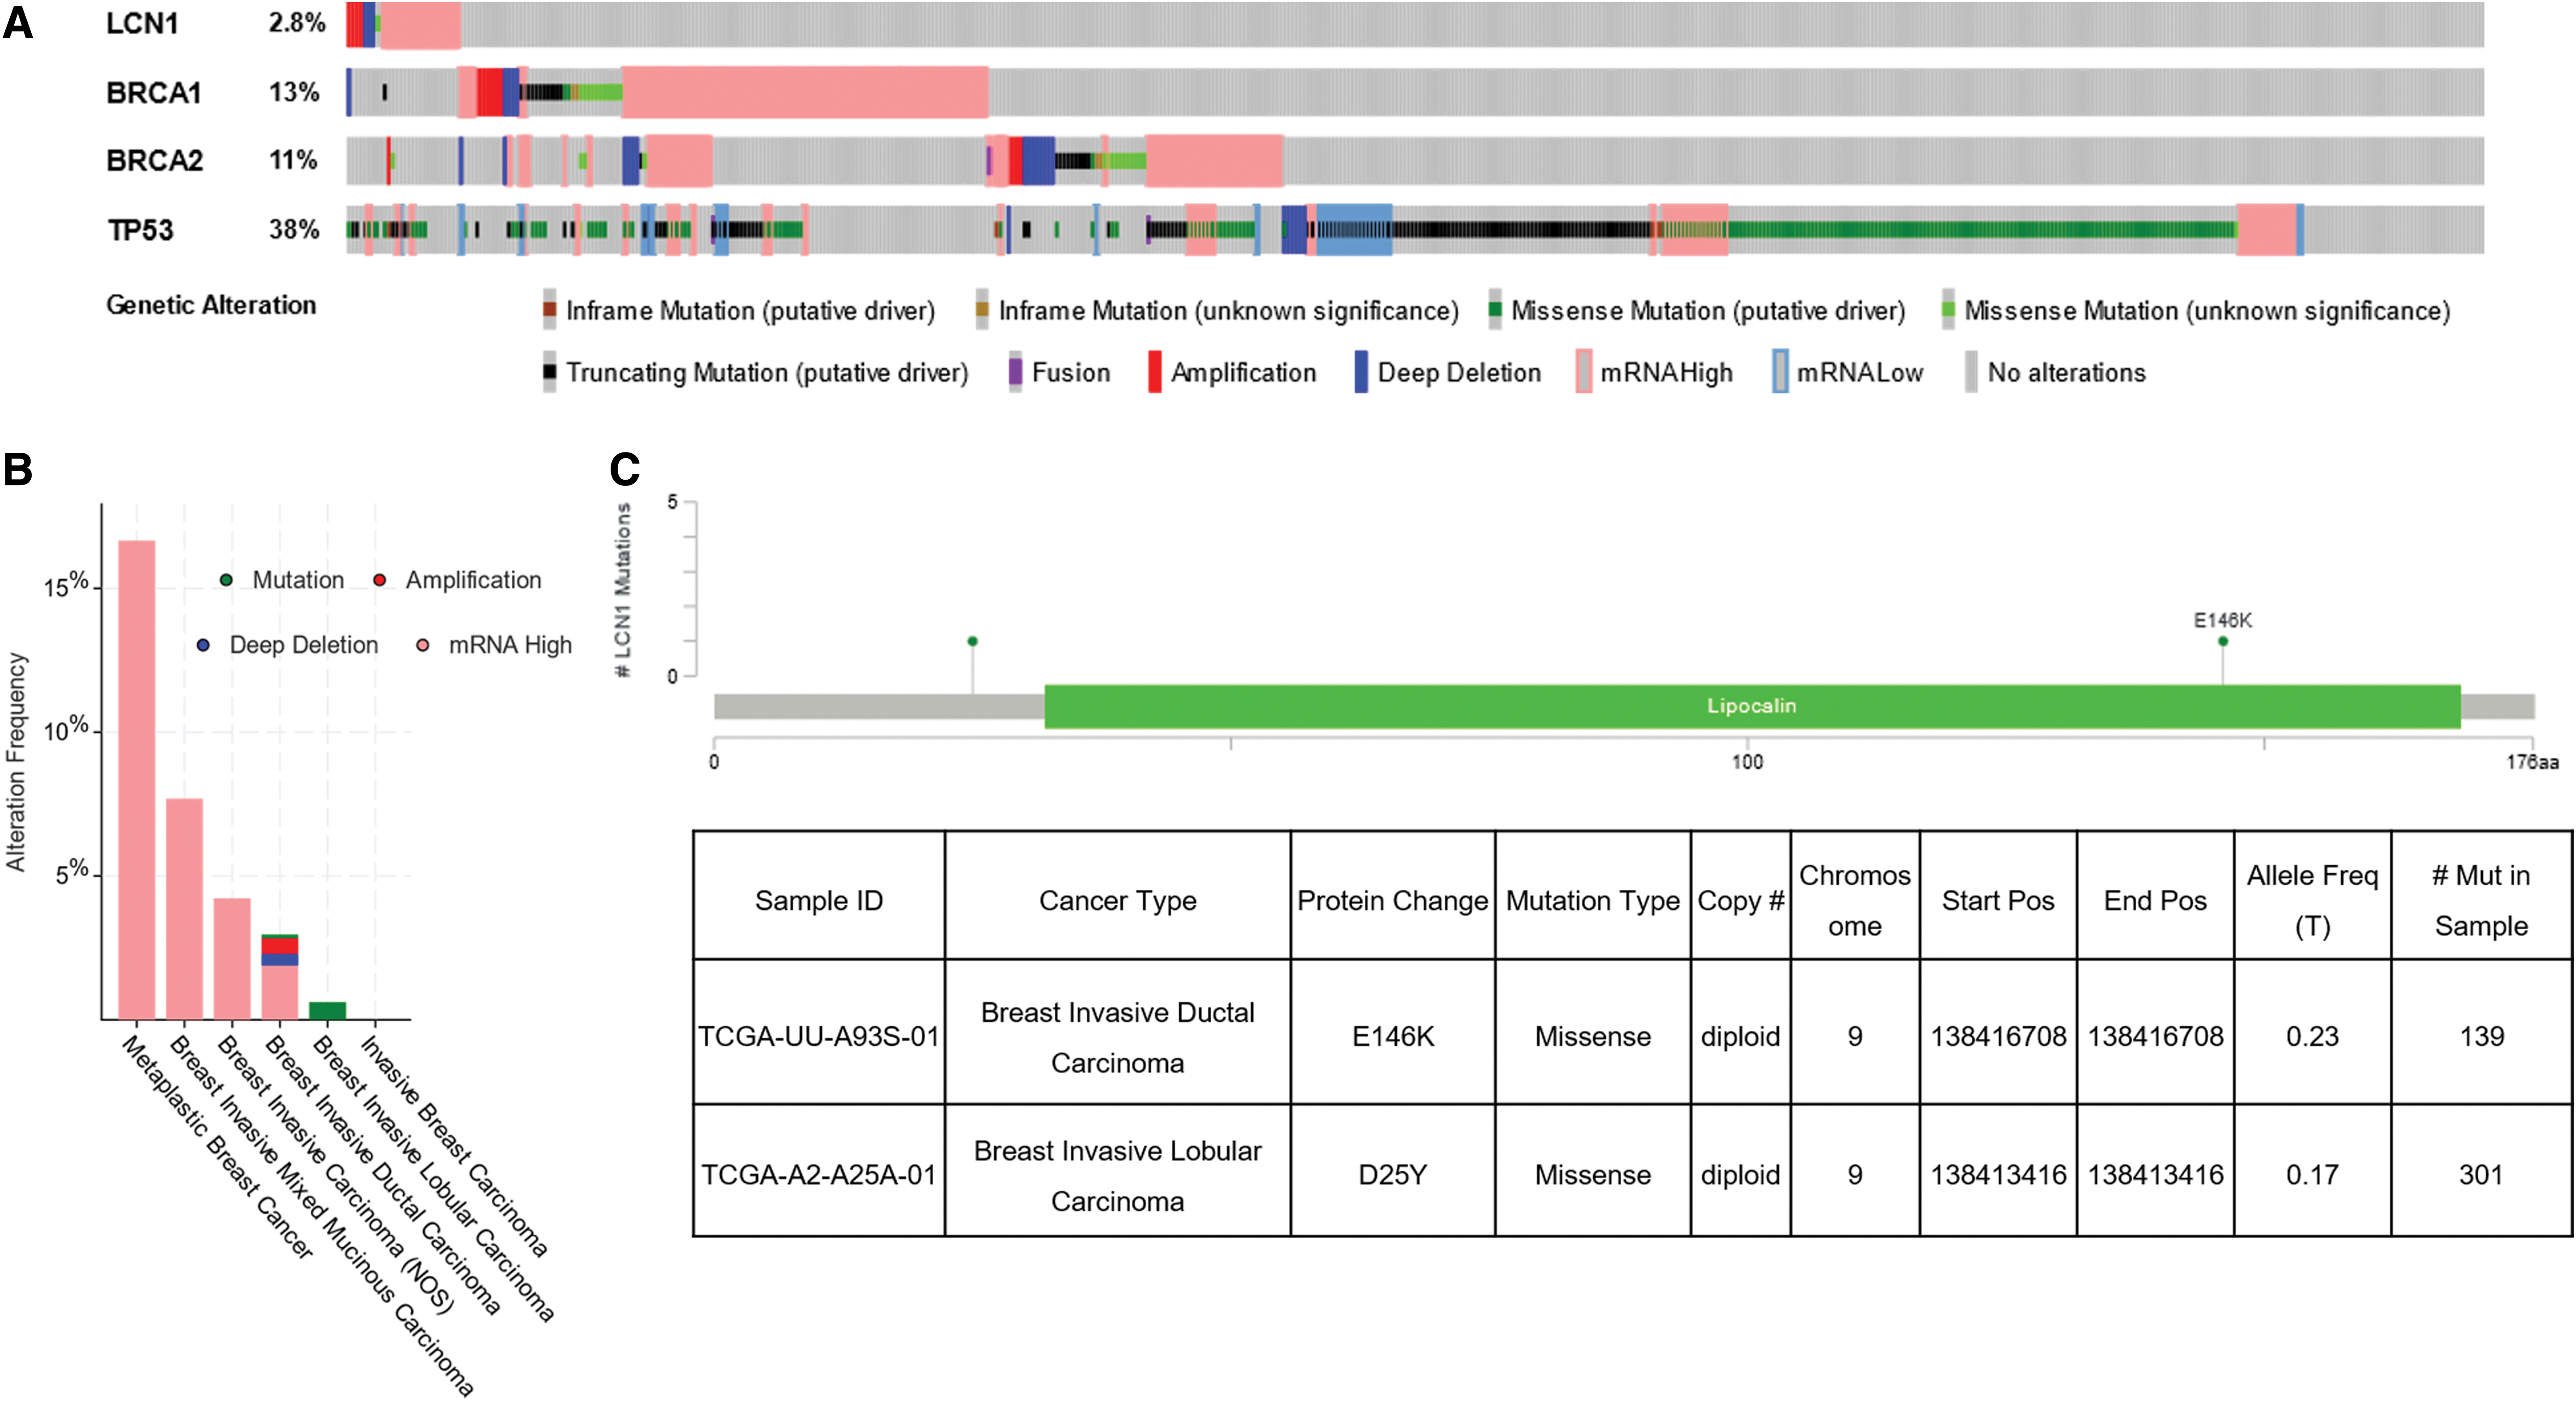
Genomic mutation of LCN1 in breast cancer. The cBioPortal database was applied to study the LCN1 mutation in breast cancer.
The association of SCNAs of LCN1 with immune infiltration was different in subtypes of breast cancer
The importance of immune surveillance in determining the prognosis of various types of cancers is widely accepted. To further examine the association between genomic metrics of LCN1 and the extent of immune infiltration in different subtypes of breast cancer, SCNAs were defined by GISTIC 2.0. In this study of genomic datasets, breast cancers with SCNAs were divided into five levels, including deep deletion, arm-level deletion, normal, arm-level gain, and high amplification. We assessed infiltration of six immune cell types, including B cell, CD4+T cell, CD 8+T cell, macrophage cell, neutrophil cell, and dendritic cell, in all breast cancers and the three different subtypes. The results showed that the immune cell enrichment was largely different in breast cancer with different LCN1 SCNAs (Fig. 4). The immune cell enrichment showed no difference in HER2 positive breast cancer with different SCNAs of LCN1. Conversely, enrichment of the above six immune cell types displayed significant downregulation in all breast cancer and basal-like breast cancer with SCNA of LCN1. In addition, decreasing of CD4+T cell and CD 8+T cell enrichments was also observed in luminal breast cancer with particular SCNA of LCN1. Therefore, the results suggested that genomic alterations of LCN1 were tightly correlated with the extent of immune infiltration in breast cancer.
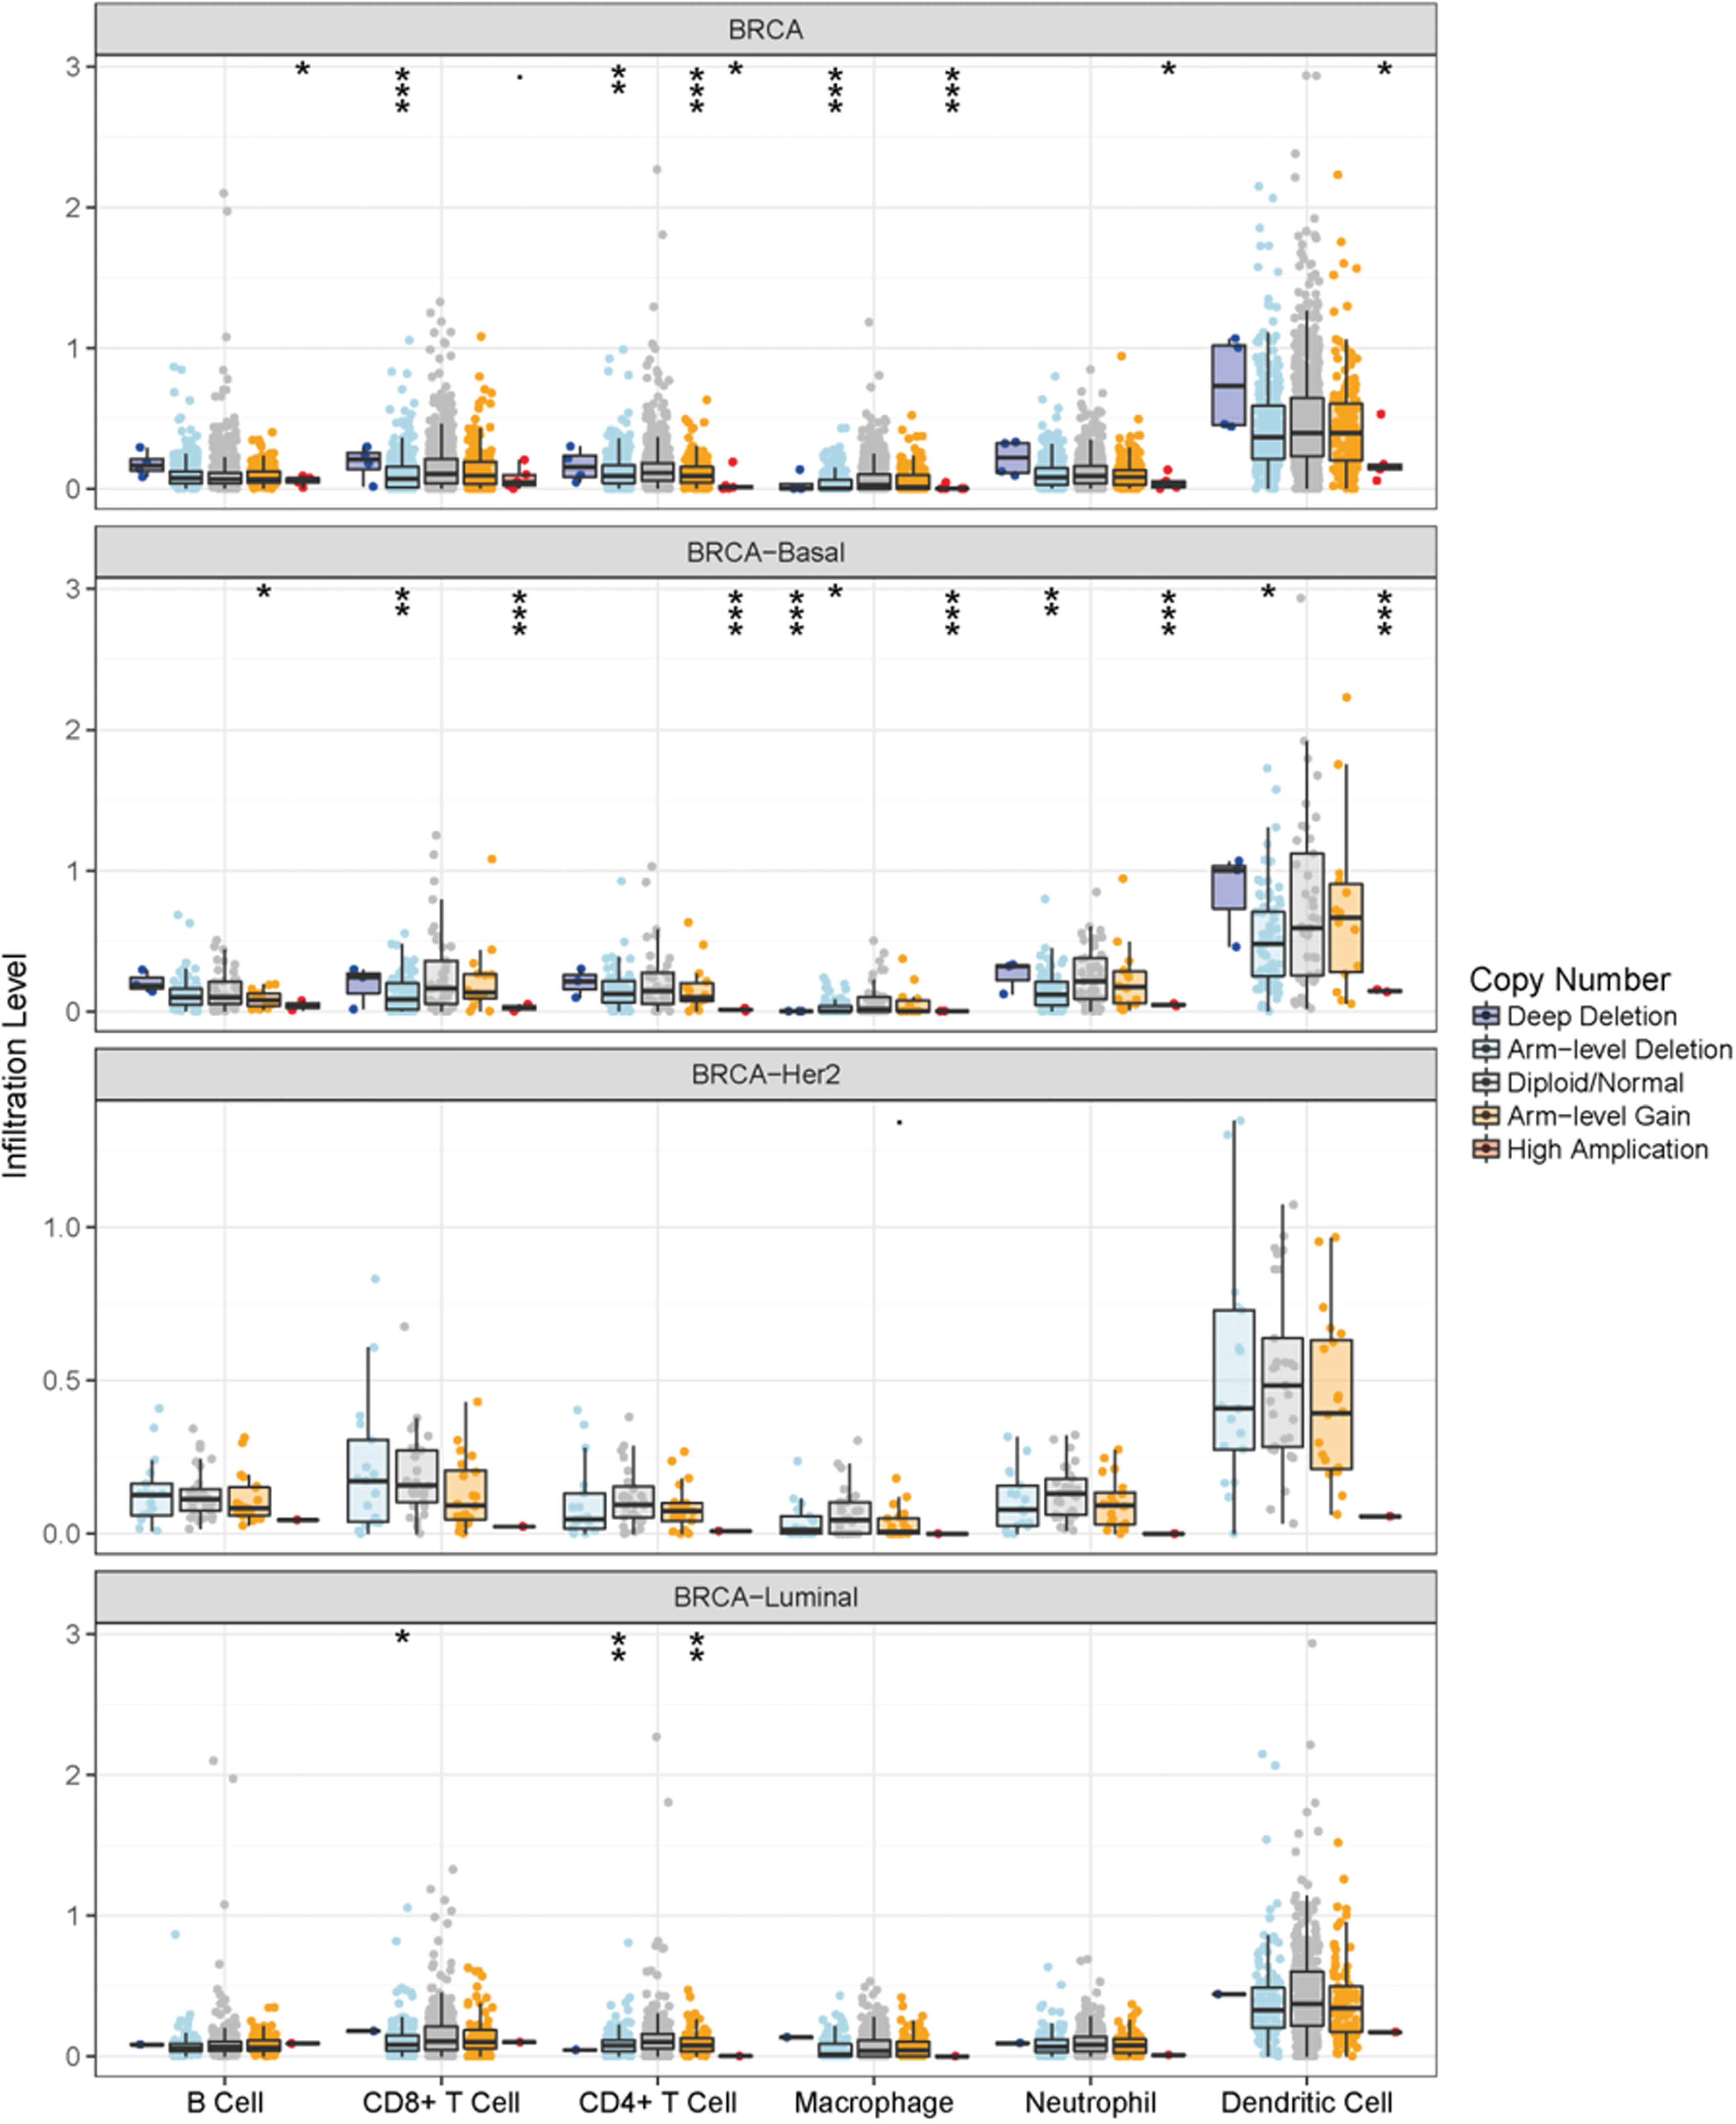
The association of SCNAs of LCN1 with immune infiltration in breast cancer. GISTIC 2.0 was adopted to examine the association between SCNAs of LCN1 and the extent of immune infiltration in different subtypes of breast cancer. In the genomic datasets, SCNAs of LCN1 were divided into five levels, including deep deletion, arm-level deletion, normal, arm-level gain, and high amplification. The infiltration of six immune cell types, including B cell, CD4+T cell, CD 8+T cell, macrophage cell, neutrophil cell, and dendritic cell, was analyzed in all breast cancer and the three different subtypes. SCNA, somatic copy number alteration. Color images are available online.
LCN1 expression was correlated with the survival of breast cancer
To evaluate the prognostic value of LCN1, Kaplan–Meier plotter was applied. OS, RFS, DMFS, and PPS for patients with all breast cancer, luminal A, luminal B, HER2+, and basal like, were obtained based on the low and high expression of LCN1. The results indicated that poor prognosis was only correlated to RFS in all types of breast cancer (Supplementary Fig. S2). Further analysis showed that low LCN1 mRNA expression was correlated to relatively low OS, but only luminal B breast cancer showed the significant difference (log rank p = 0.017) (Fig. 5). For RFS analysis, low LCN1 mRNA expression was correlated to poor prognosis in all subtypes of breast cancer (Fig. 6). However, low LCN1 mRNA expression was correlated to poor prognosis in HER2 positive breast cancer (log rank p = 0.044) but good prognosis in luminal A breast cancer for DMFS (log rank p = 0.01) (Fig. 7). Considering PPS, low LCN1 mRNA expression was correlated to poor prognosis in luminal A breast cancer but good prognosis in HER2 positive breast cancer (Fig. 8). The above data suggested that LCN1 expression level was a great factor affecting the survival of breast cancer.
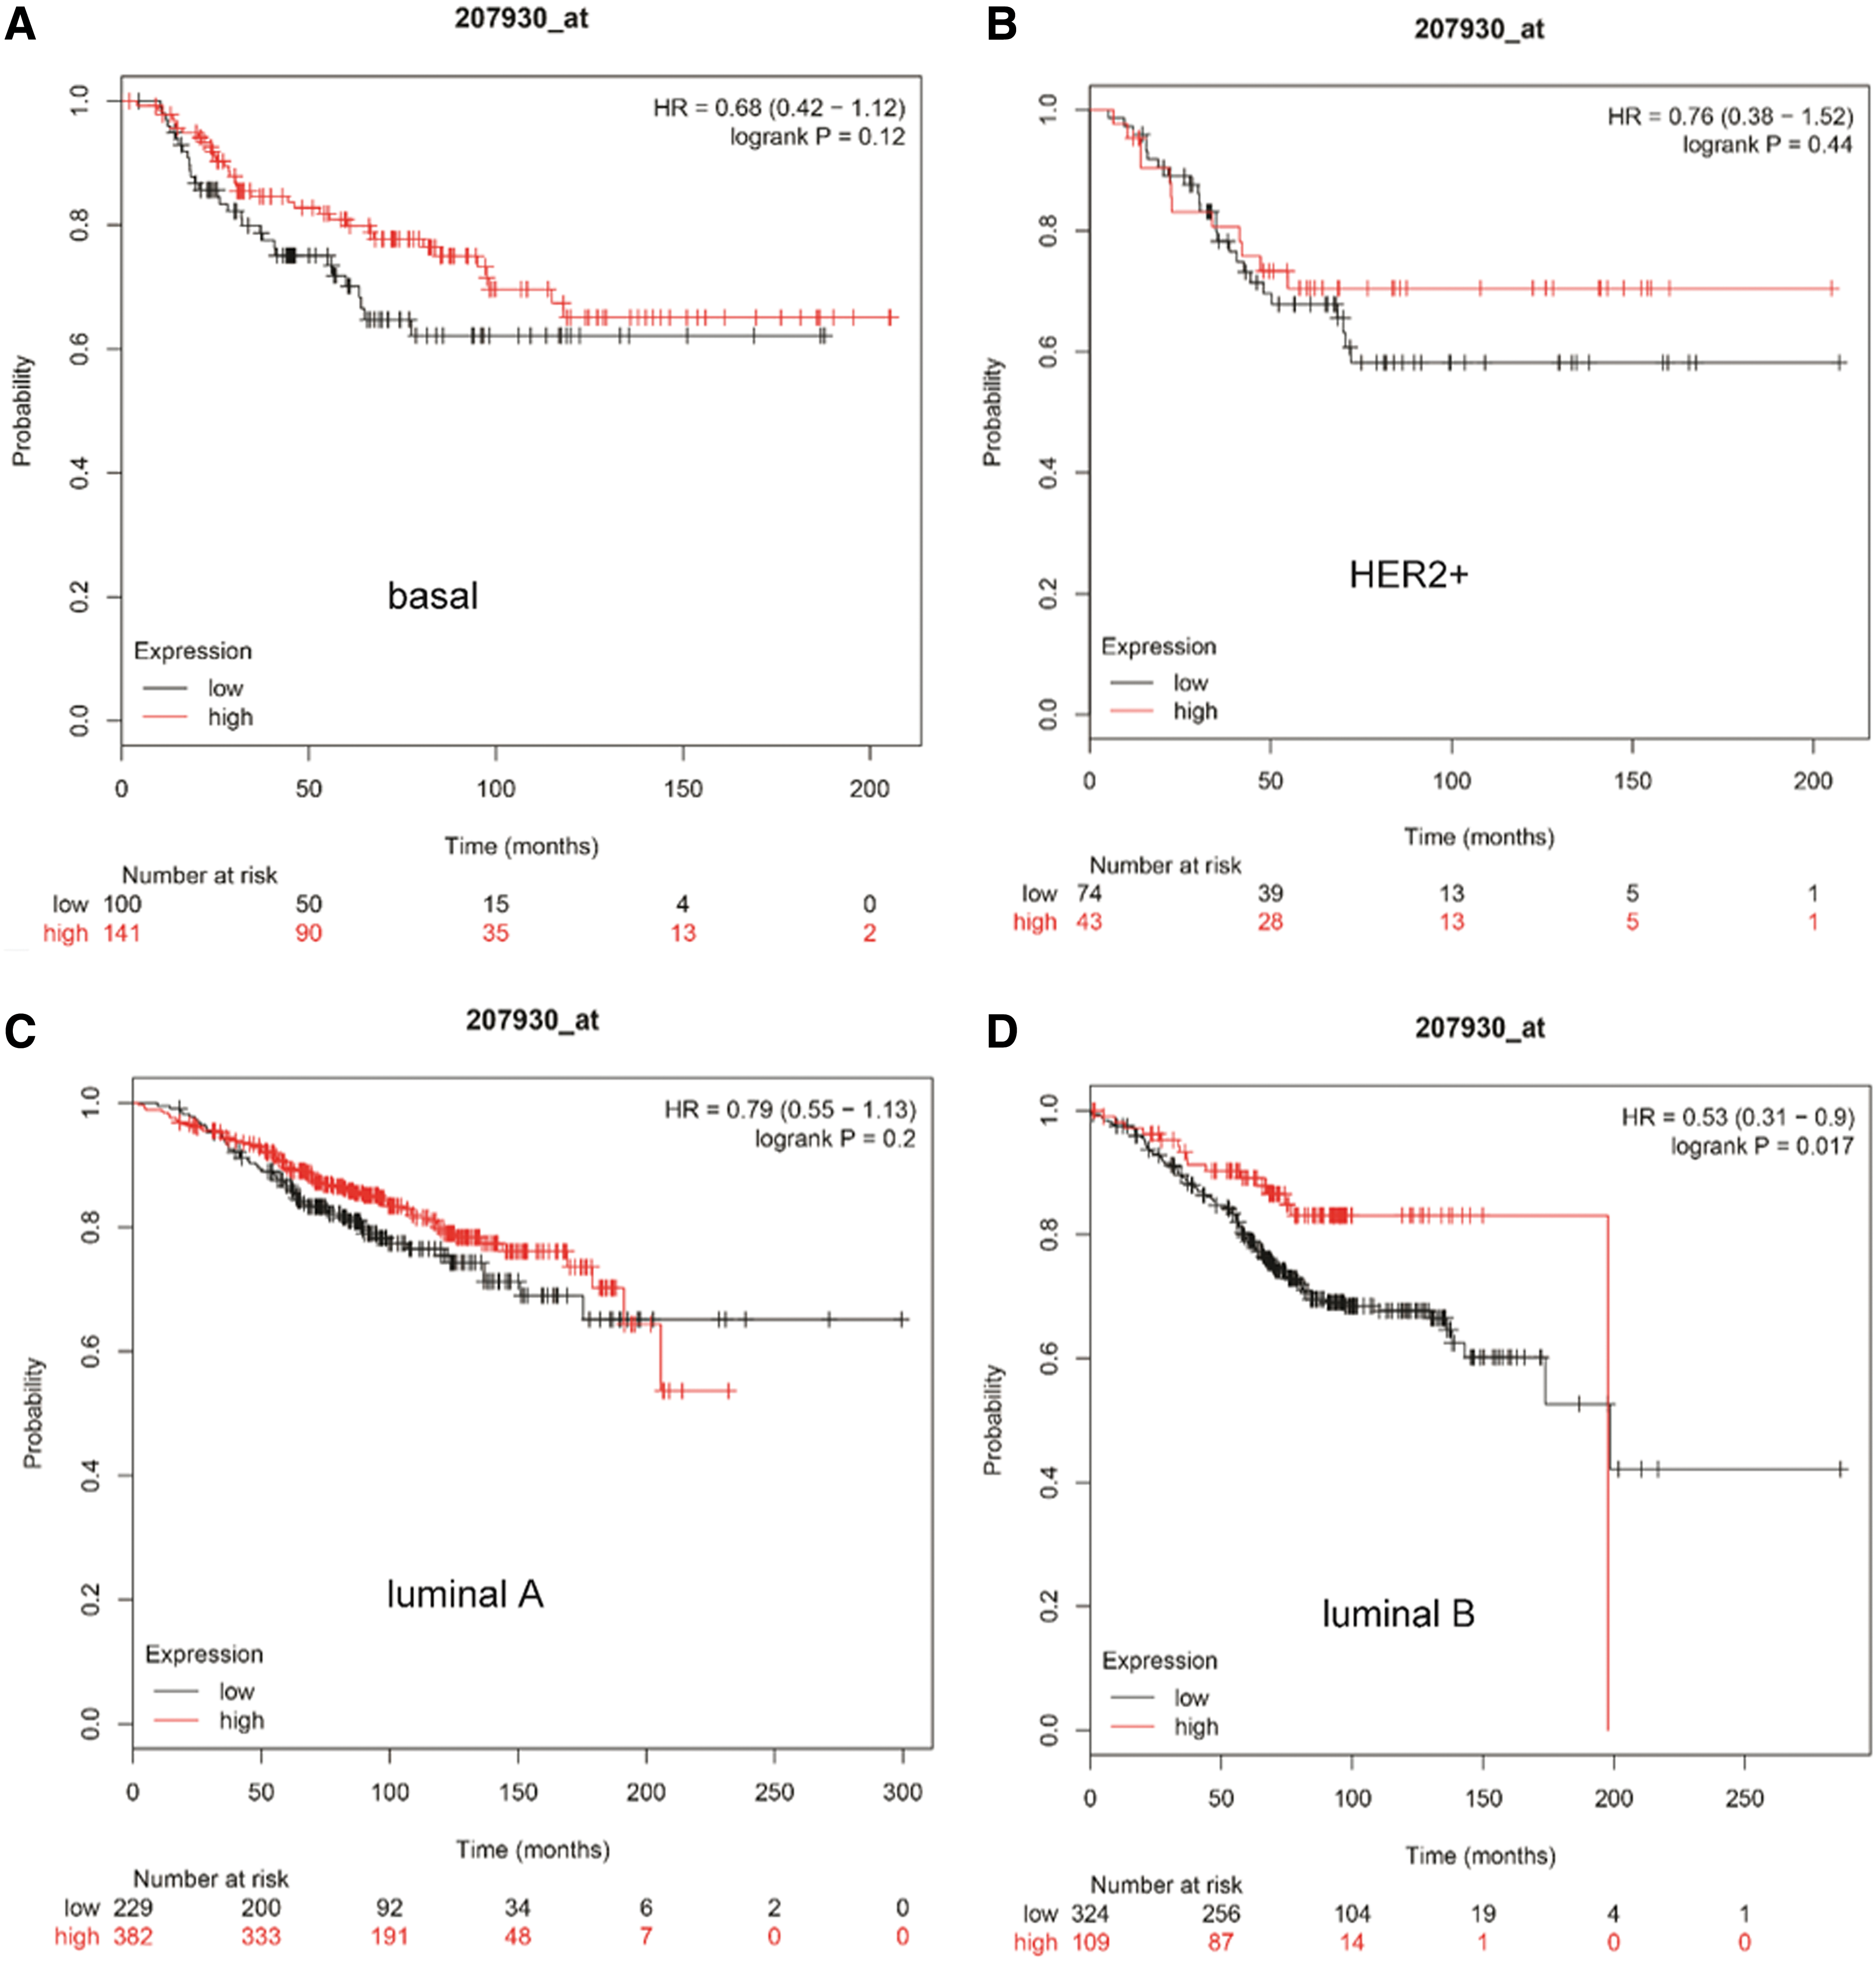
The correlation of LCN1 expression with OS analysis in breast cancer. Kaplan–Meier plotter was applied to evaluate the prognostic value of LCN1. OS analysis in patients within

The correlation of LCN1 expression with RFS analysis in breast cancer. Kaplan–Meier plotter was applied to evaluate the prognostic value of LCN1. RFS analysis in patients within
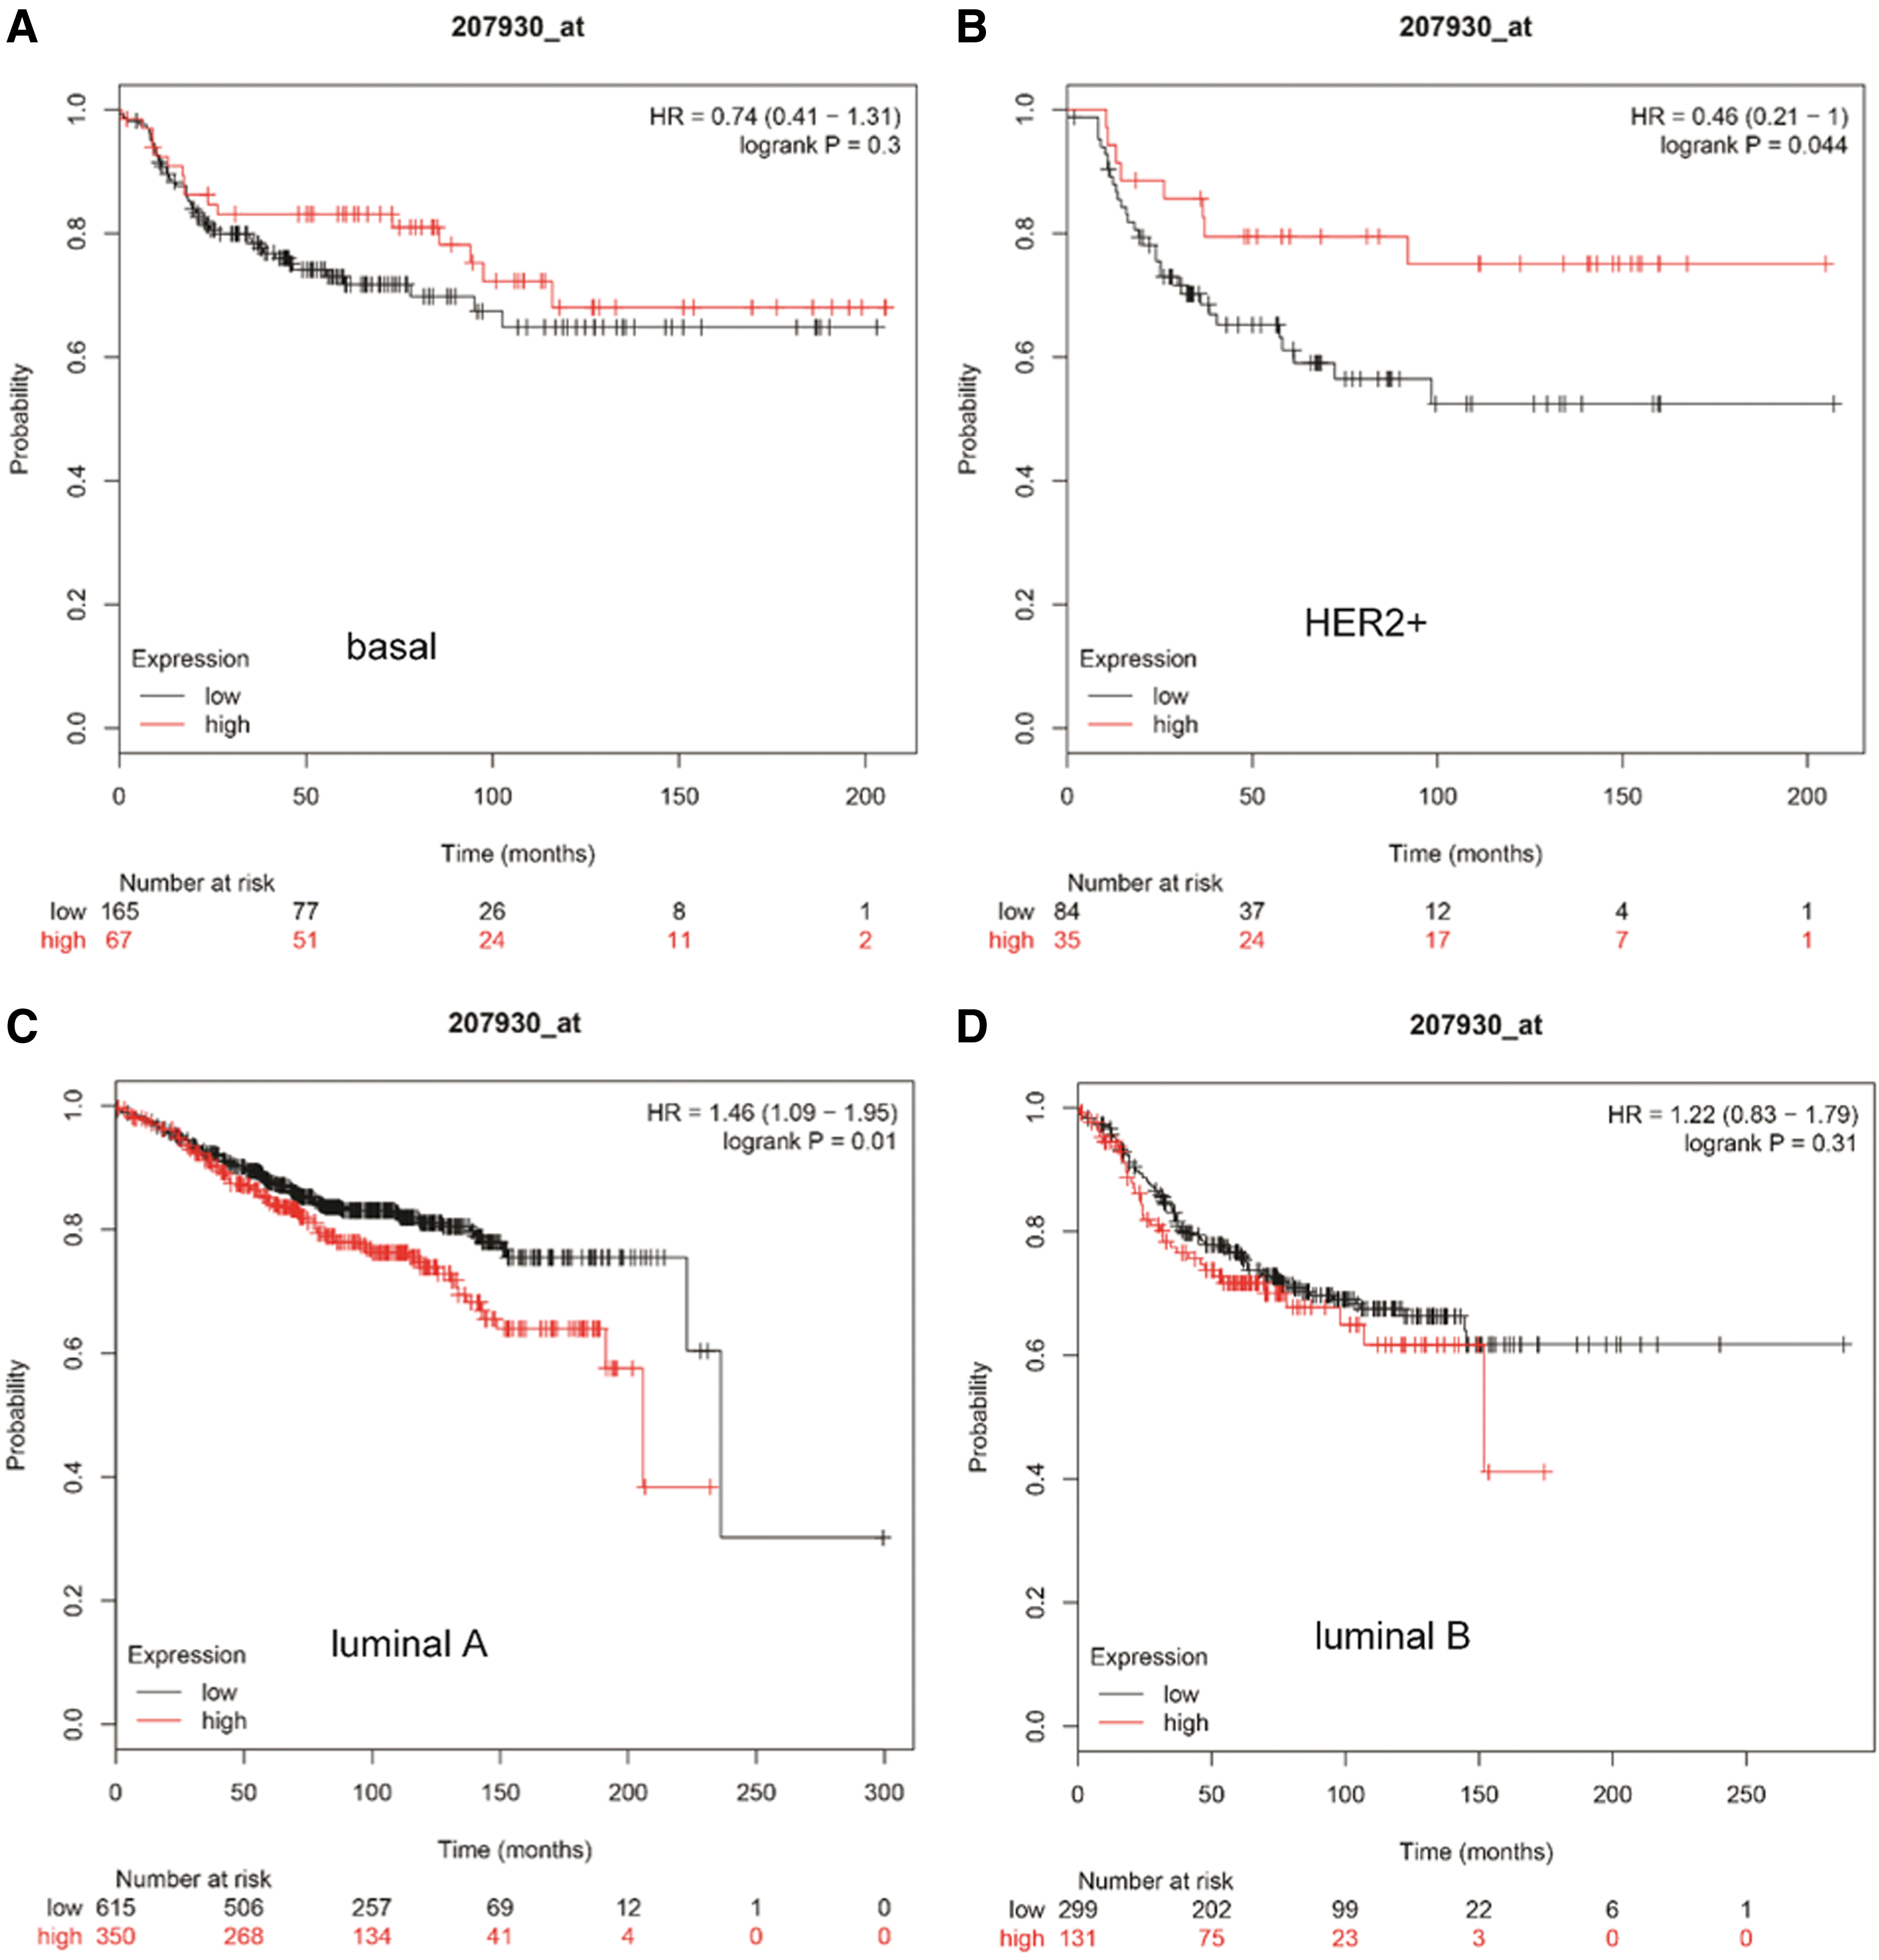
The correlation of LCN1 expression with DMFS analysis in breast cancer. Kaplan–Meier plotter was applied to evaluate the prognostic value of LCN1. DMFS analysis in patients within

The correlation of LCN1 expression with PPS analysis in breast cancer. Kaplan–Meier plotter was applied to evaluate the prognostic value of LCN1. PPS analysis in patients within
Discussion
The biological function of LCN1 has been proved to be involved in innate immune responses and acts as a protection factor for cells by preventing the oxidation reaction of lipid peroxidation products and eliminating of lipophilic molecules (Lechner et al., 2001; Wojnar et al., 2002). LCN2 has been regarded as an important regulator of tumorigenesis, invasiveness, and metastasis in breast cancer (Leng et al., 2011; Oren et al., 2016). However, the relevance of LCN1 with cancer is rarely of concern currently. There was only one new report which indicated that LCN1 expression in cholangiocarcinoma tissues was higher than adjacent normal tissues, and LCN1 expression was associated with tumor size, distant metastasis, and OS (Tian et al., 2018). The findings provide a novel role of LCN1 in cholangiocarcinoma tumorigenesis. In this study, the expression profiling of LCN1 analysis by TIMER database was found to be upregulated not only in breast cancer but also in various cancerous tissues, including BLCA, COAD, ESCA, HNSC, KIRC, LIHC, PRAD, READ, STAD, and THCA (Fig. 1). Therefore, our study is the first to evaluate the correlation of LCN1 expression with various tumors. Thus, our results indicated an oncogenic role of LCN1 in various types of tumors.
To achieve much optimal diagnostic efficiency, the biomarkers based on saliva or blood should be subtype oriented and help to facilitate detection of breast cancer in its infancy (Duffy et al., 2015). Analysis by UALCAN database in breast cancer suggested that LCN1 expression was closely associated with individual cancer stages. The results showed that LCN1 expression suffered a gradually increasing tendency in breast cancer from stage 1 to stage 4, and the highest LCN1 expression can be found in stage 4 (Fig. 2A). The above result indicated that LCN1 might be an ideal biomarker for diagnosis of breast cancer in its infancy. In addition, LCN1 expressions were all dramatically upregulated in breast cancer with different patients' race and different subtypes (Fig. 2B, C). The results reminded that LCN1 might be useful in diagnosis of breast cancer for all subtypes and different races.
Clinical studies have reported that breast cancers particularly the triple-negative breast cancer have high immune infiltration (Stanton et al., 2016; Song et al., 2017). One hypothesis for this is that cancers with greater genomic instability will have higher genomic diversity and higher mutational burden, resulting in more neoantigens and therefore greater immune infiltration (Karn et al., 2017; Safonov et al., 2017). Our results indicated that genetic alteration of LCN1 in breast cancer such as copy number amplification, deep deletion, and missense mutation could be found (Fig. 3A). The genetic alteration type and frequency of LCN1 also showed difference in various invasive breast cancers (Fig. 3B). In addition, missense mutation of LCN1 resulted in the amino acid change in two sites (Fig. 3C). Further examination of the association between genomic metrics of LCN1 and the extent of immune infiltration enrichment showed that immune infiltration mainly occurred in basal-like breast cancer (Fig. 4). Thus, the above results together suggested a positive correlation between LCN1 genomic alterations and immune cell enrichments in breast cancer especially the basal-like breast cancer. Considering all the above results, we thought that genetic alteration of LCN1 might play an important role in breast cancer.
While evaluating the prognostic value of LCN1 in breast cancer, OS, RFS, DMFS, and PPS for breast cancer with different subtypes were analyzed separately. It was found that low LCN1 expression was correlated to poor prognosis in all subtypes for RFS analysis (Fig. 6). Thus, the results indicated that LCN1 expression might be a predictor of poor prognosis breast cancer for RFS. However, the correlation between LCN1 expression level and poor prognosis was not consistent for OS, DMFS, and PPS analysis in different subtypes of breast cancer (Figs. 5, 7, and 8). Although the uncertainty of correlation between LCN1 expression level and poor prognosis exists, the data above suggested that LCN1 expression level might be an important factor needing to be considered for the survival of breast cancer.
In summary, the data in this study elucidate the close correlation of LCN1 with breast cancer. Although the bioinformatic analysis provided us some meaningful insights of LCN1 in breast cancer, biological experiments in vitro or in vivo are needed to verify our outcomes in future.
Footnotes
Disclosure Statement
No competing financial interests exist.
Funding Information
This study is supported by Shenzhen City Science and Technology Innovation International Cooperation Projects 2016 (grant no. GJHZ20160301164637011) and Scientific Research Foundation of Health and Family Planning commission system of Shenzhen Municipality (grant no. 201601023).
Supplementary Material
Supplementary Figure S1
Supplementary Figure S2
References
Supplementary Material
Please find the following supplemental material available below.
For Open Access articles published under a Creative Commons License, all supplemental material carries the same license as the article it is associated with.
For non-Open Access articles published, all supplemental material carries a non-exclusive license, and permission requests for re-use of supplemental material or any part of supplemental material shall be sent directly to the copyright owner as specified in the copyright notice associated with the article.
