
Abstract
Tumor antigen-induced lymphocyte transformation (LT) represents the antitumor cellular immunity, which might correlate with the cancer treatment outcome. Currently, there is no LT assay (LTA) routinely used in clinic. To establish a sensitive and convenient procedure for LTA, the same samples were used to simultaneously perform three assays: 5-ethynyl-2′-deoxyuridine (EdU) assay, 3-(4,5-dimethylthiazol-2-yl)-2,5-diphenyltetrazolium bromide (MTT) assay, and carboxyfluorescein succinimidyl ester (CFSE) assay, and then the three results were compared. Several conditions were optimized: the LT harvest time, sources of lymphocytes (blood, lymph nodes, or spleen), the added amount of stimulatory tumor antigen and in vivo immunization priming time for LTA. The results of side-by-side comparison showed that (1) the 72 h for coculture of lymphocytes with tumor antigens was optimal time to harvest cells for LTA; (2) 50 μg/mL of tumor antigens was the optimal concentration for activation LT from three sources; (3) EdU incorporation was the sensitive and convenient assay for LTA as compared with MTT and CFSE assays; (4) the day 21–28 after in vivo priming immunization was the testing time for LTA; and (5) peripheral blood LT could be a good representative of whole body's lymphocyte reaction and practically easy cell source for LTA. This comparison of the three LTA in mouse model suggests that the EdU incorporation assay might be useful to evaluate the antitumor immunity stimulated by specific tumor vaccine or different anticancer therapies.
Introduction
Tumor cells express neoantigens, which could be recognized by host immune system, leading to transform and activate lymphocytes as a major cellular immunity against tumor. A weakened cellular immunity results in the uncontrolled tumor growth (Durrant et al., 2011; Gubin et al., 2014; Polyakova et al., 2015; Schumacher and Schreiber, 2015; Mcgranahan et al., 2016).
Anticancer therapy, such as radiotherapy, targeted therapy, and chemotherapy, directly kill or induce apoptosis of tumor cells, which could release or upregulate neoantigens, triggering an enhanced cellular immunity for anticancer (Hallahan et al., 2001; Demaria et al., 2015; Esposito et al., 2015). To monitor the altered cellular immunity will provide valuable information for guiding the treatment and predicting the clinical outcome.
Tumor antigen-induced lymphocyte activation manifests as transformation of lymphocytes, which could be measured by several different assays: (1) staining method, which directly observes the morphological changes of transformed lymphoblasts (Hersh and Oppenheim, 1965; Millard, 1965; Fowler et al., 1966); (2) 3H-thymidine incorporation assay, a most sensitive assay for lymphocyte transformation assay (LTA), however, due to its use of isotope, it is environmentally unfriendly (Porebski et al., 2013; Cabañas et al., 2017); (3) 5-bromo-2′-deoxyuridine (BrdU) incorporation, replacing 3H-thymidine to incorporate into synthetic nucleotide with a relatively complicated process (Takeshita et al., 1989); (4) using 3-(4,5-dimethylthiazol-2-yl)-2,5-diphenyltetrazolium bromide (MTT) dye, which is catalyzed in mitochondria and converted into purple color, representing the proliferated viable cells (Mosmann, 1983; Denizot and Lang, 1986; Wu et al., 2014); (5) using carboxyfluorescein succinimidyl ester (CFSE) dye, which is stably incorporated into cellular protein at the beginning and split into daughter cells when lymphoblasts are dividing. The more cells divide, the less CFSE in each cell, a left-shift in flow cytometry analysis (Oostendorp et al., 2000; Wu et al., 2014).
In this study, we side by side compared 5-ethynyl-2′-deoxyuridine (EdU), MTT and CFSE assays, three nonisotope and easy performing assays, for their advantages and disadvantages in LTA. Institute of Cancer Research (ICR) mice were immunized with the lysate of H22 hepatoma cells as tumor antigen for obtaining the primed lymphocytes in vivo, which then were harvested and activated in vitro, followed by three assays to determine (1) which method is more sensitive for LTA; (2) optimal harvesting time for LTA; (3) any difference in sources of lymphocytes (blood, lymph nodes, or spleen); (4) optimal amount of antigen for LT activation; and (5) timing for LTA after immunization. The goal is to establish a rapid, effective, and feasible assay to measure the antitumor cellular immunity after treatments to rejustify the anticancer therapy.
Materials and Methods
Reagents and instruments
H22 hepatocellular cells were purchased from the Cell Culture Center of Institute of Basic Medical Sciences, Chinese Academy of Medical Sciences; fetal bovine serum (FBS) from Tianhang Biotechnology Co. (Zhejiang, China); RPMI-1640 and penicillin/streptomycin from Invitrogen (Carlsbad, CA); EdU kit from RiBoBio, Inc. (Guangzhou, China); MTT from Sigma-Aldrich (Oakville, ON, Canada); CFSE and carboxyfluorescein diacetate succinimidyl ester (CFDA, SE) dye from Molecular Probes (Invitrogen Co.); and red blood cells (RBC) lysis buffer from Shengong Biotech, Inc. (Shanghai, China).
iMark™ Microplate Reader (Bio-Rad) was used to measure purple catalyzed MTT at A490. BD Accuri C6 Flow Cytometer (BD) was used to measure the EdU or CFSE in lymphocytes. OLYMPUS DP71 microscopy (Olympus Corporation, Tokyo, Japan) was used to take the morphological pictures of cells.
Priming lymphocytes by immunization of ICR mice
For obtaining tumor antigen, the H22 cancer cells were injected into the abdominal cavity and let cells grow for 7 days, harvested, lysed, and quantified the H22 protein with BCA kit (Pierce).
Eight-week-old female ICR mice (22–25 g; Slaccas Experimental Animal LLC, Shanghai, China; license no. SCXK 2012-0002) were randomly divided into two groups and received different immunizations: (1) control group was subcutaneously (s.c.) injected with sterile phosphate-buffered saline (PBS) mixed with Freund's complete adjuvant; (2) immunized group was s.c. injected with 200 μg of H22 tumor antigens with Freund's complete adjuvant in 200 μL per mouse in eight spots of the back and four feet (Billiau and Matthys, 2001). On day 21 or 24 after first priming, the mice were boosted with second and third immunization with Freund's incomplete adjuvant. The lymphocytes from blood, lymph nodes, or spleen were harvested at different time depending on the experiment design.
All animal experiments were approved by Fujian Medical University Institutional Animal Ethical Committee. All applicable international, national, and/or institutional guidelines for the care and use of animals were followed.
Specimen collection and lymphocytes culture
According to different purposes, the mice were sacrificed on different days after initial immunization, and the peripheral blood, lymph nodes, and spleen were collected from two groups for lymphocytes and used in different experiments with the procedures shown in Figures 2A and 6A.
Lymph nodes (from omentum, groin, and armpit) and spleens were collected under sterile conditions. First, the tissues were placed on top of stainless steel mesh (mesh number 200) over 60 mm dish, grinded with steel small spoon washed down the cells with 1640 media, and then the cells were further filtered through 250 mesh nylon for single cell suspension. The blood was lysed with RBC lysis buffer and the lymphocytes were spun down at 1500 rpm for 5 min and resuspended in RPMI-1640 with 5% heat-inactivated FBS, 100 μg/mL streptomycin, and 100 IU/mL penicillin. Then, lymphocytes from each group and each source were divided equally into three parts and assessed for LT by EdU, MTT, and CFSE assays for side-by-side (Fig. 2A).
EdU incorporation assay
Lymphocytes from each group seeded in 96-well round bottom culture plates (1 × 10⁶/mL, 100 μL/well) were added with EdU at a final concentration of 5 μM and H22 antigen at 0, 20, 50, or 70 μg/mL, respectively. The cells were further cultured in 37°C incubator for 72 h for LT.
EdU incorporation assay was performed according to the manufacturer's protocol. In brief, after 72 h cocultured with EdU and H22 antigen, the lymphocytes were fixed with 4% paraformaldehyde for 30 min at room temperature, washed with glycine (2 mg/mL) for 5 min, permeabilized with 0.5% Triton X-100, and washed with PBS. Add 100 μL/well of click reaction buffer (100 mM Tris-HCl, pH 8.5, 0.5 mM CuSO4, 10 μM fluorescent Apollo 488 azide, and 50 mM ascorbic acid) for 10–30 min while protecting from light, then washed with 0.5% Triton X-100 for three times, finally resuspended in 150 μL PBS (Sun et al., 2012). The cells were analyzed with flow cytometry. H22 cancer cell antigens stimulated EdU+ transformed lymphocytes were determined by comparison with the negative control (cells cultured without cancer antigens).
MTT assay
Lymphocytes from each group were cocultured with 0, 20, 50, or 70 μg/mL H22 tumor antigens for 72 h as described earlier. Four hours before harvesting cells, MTT at a final concentration of 0.5 mg/mL was added into each well and incubated for another 4 h at 37°C. Then, the 96-well culture plates were centrifuged at 1500 rpm for 5 min and the medium was carefully removed. Dimethyl sulfoxide (DMSO; 100 μL/well) was added and incubated for 10 min. The purple formazan (catalyzed MTT) was read at A490. Medium without cells was used as control for background reading.
CFSE assay
Lymphocytes were prelabeled with 5 μM CFSE dye, incubated at 37°C for 15 min with vortex well every 5 min, stopped the reaction with the same volume of RPMI-1640-10% heat-inactivated FBS for 10 min at 4°C. After washed three times with PBS, CFSE-labeled lymphocytes in each group were cocultured with 0, 20, 50, or 70 μg/mL H22 tumor antigens for 72 h. The fluorescence intensity of CFSE was analyzed by flow cytometry. The cells without antigen stimulation were used as control.
Statistical analysis
The statistical software in GraphPad Prism 5 was used for analysis of differences. Measurement data are expressed as mean ± standard deviation (SD). Analysis of variance (ANOVA) was used in more than two group multiple comparisons and unpaired t-test was used for comparing between data of two groups. p < 0.05 was considered statistically significant (*p < 0.05; **p < 0.01; ***p < 0.001).
Results
Assess the lymphocytes viability at different culture times
To determine the best culture time for lymphocytes viability, the lymphocytes from blood, lymph node, and spleen were collected on day 28 after initial immunization and seeded into 96-well culture plates with RPMI-1640 with 5% heat-inactivated FBS, 100 μg/mL streptomycin, and 100 IU/mL penicillin in 37°C incubator for up to 120 h. The cells were monitored and pictured every 24 h under Olympus DP71 microscopy to assess the morphological alterations of lymphocytes (Fig. 1A–E).
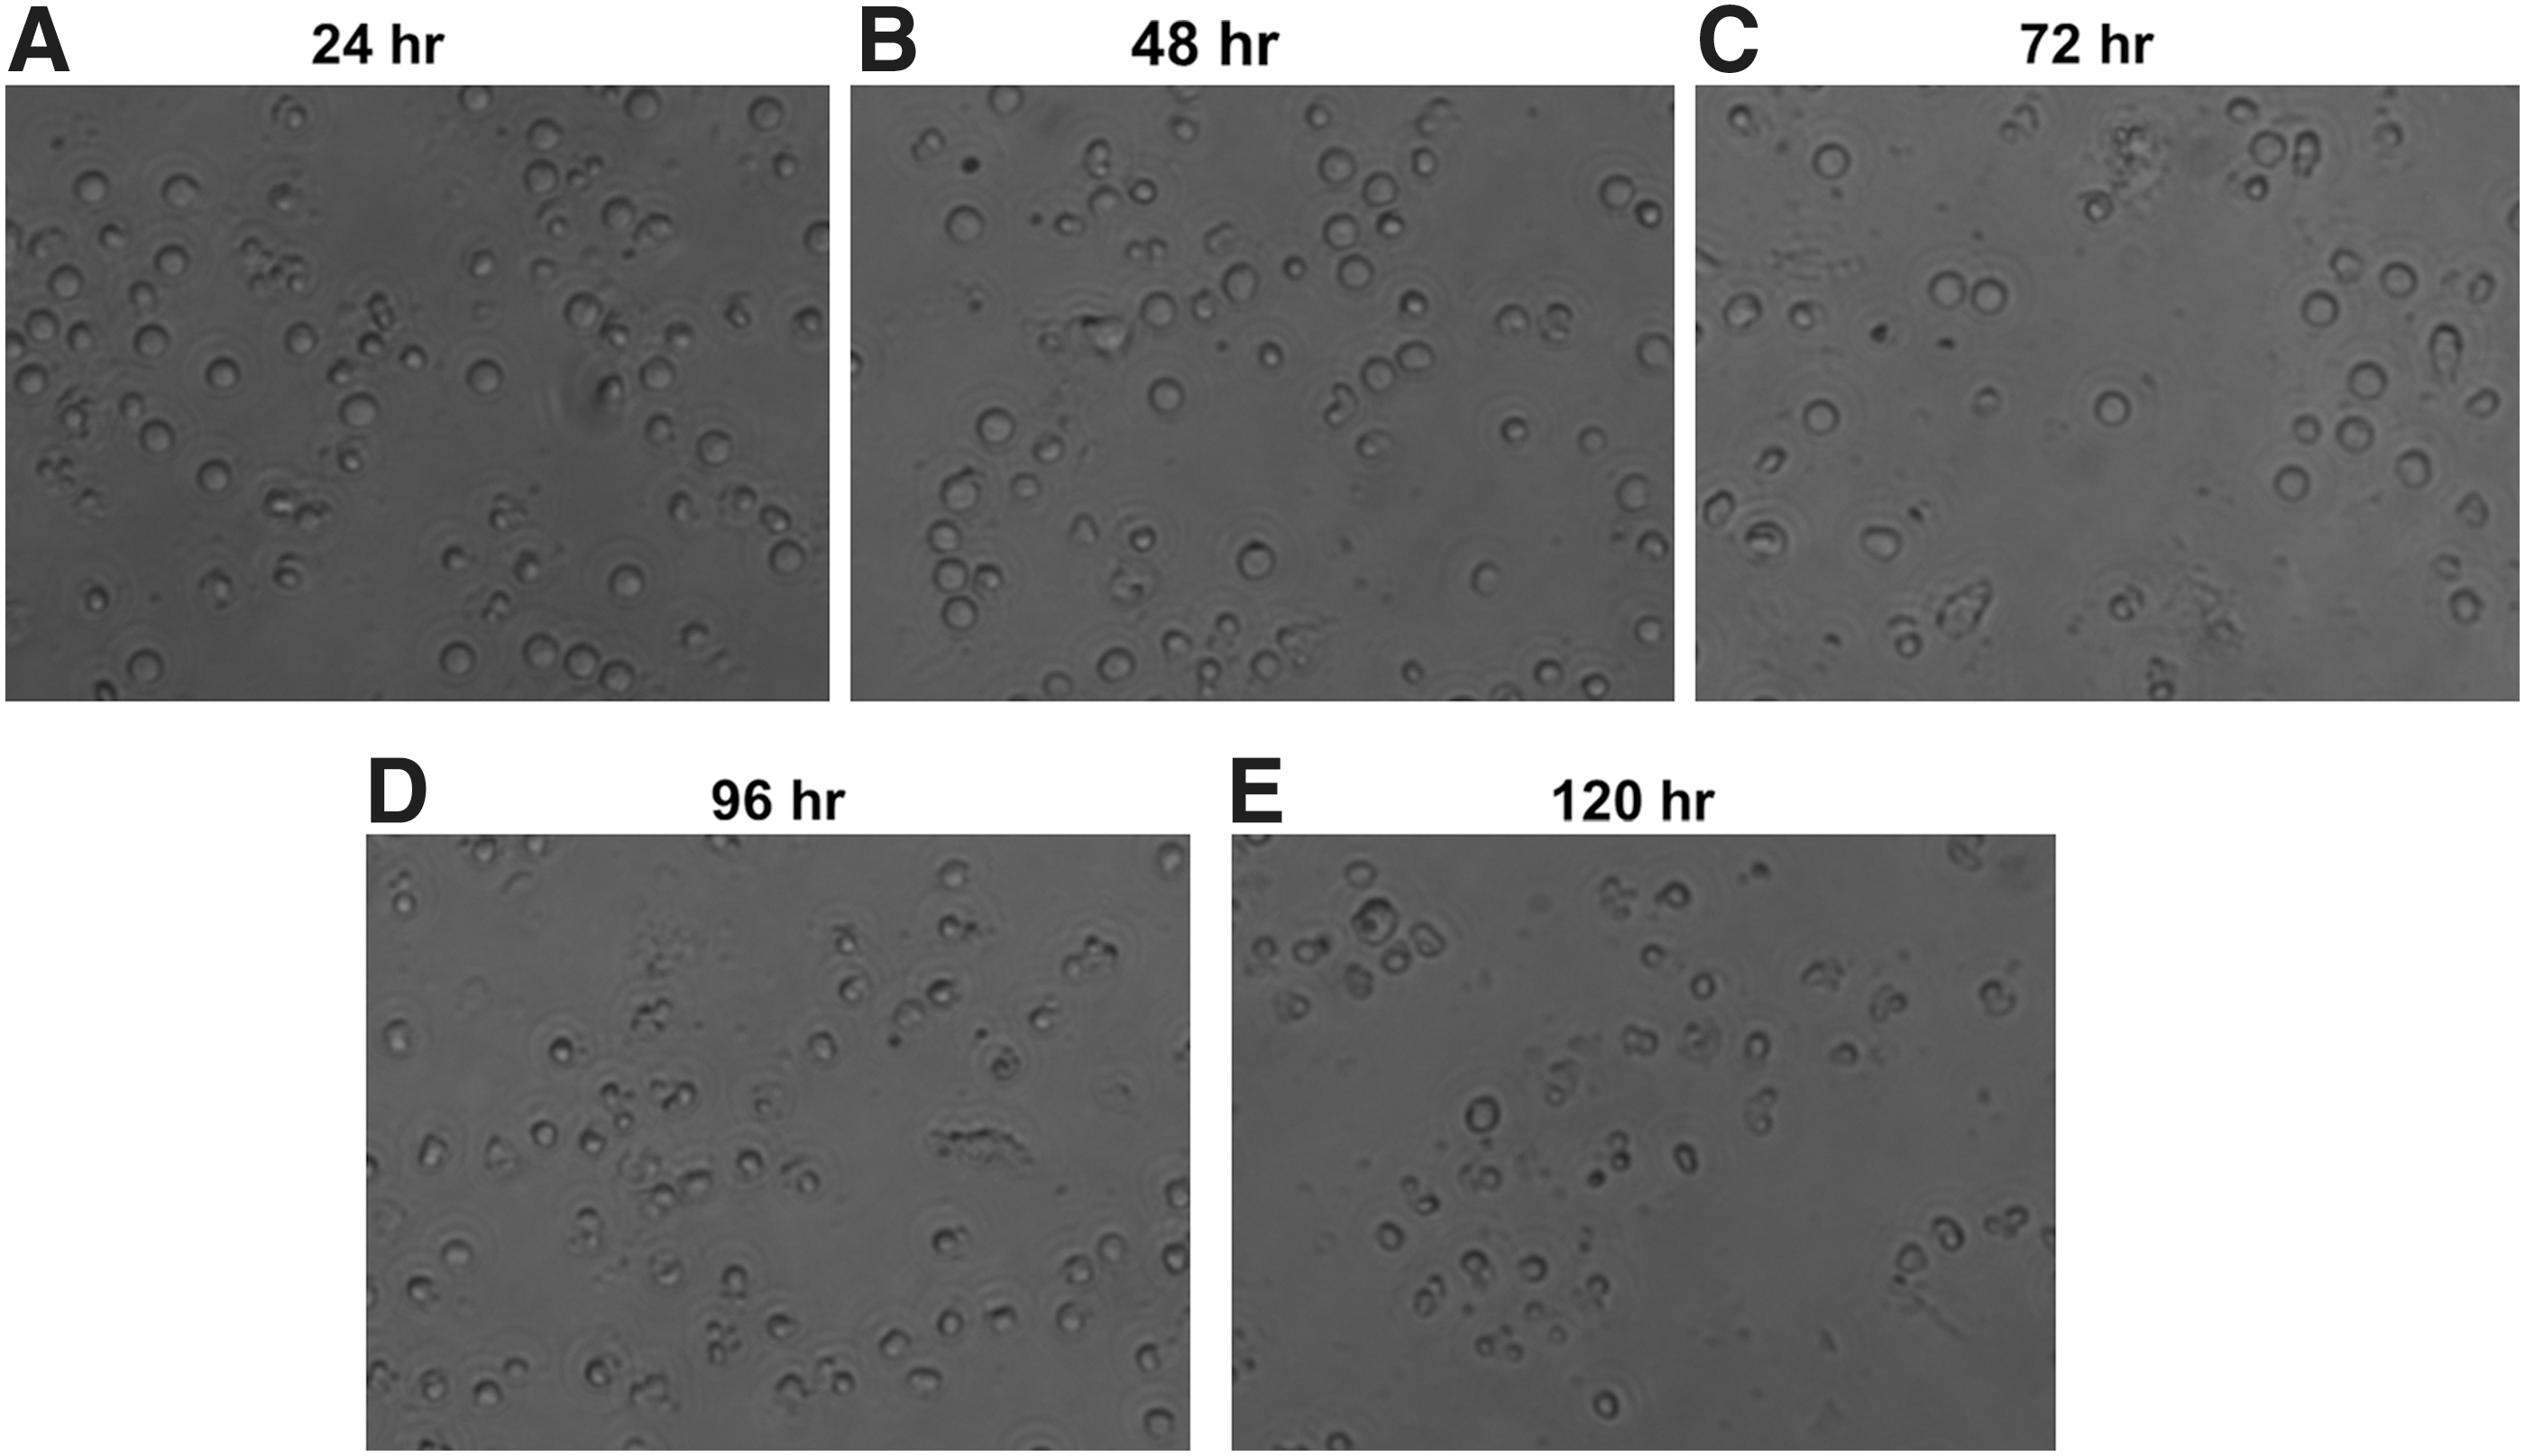
Lymphocytes viability was assessed by observing morphology under microscopy. Lymphocytes were cultured in RPMI-1640 with 5% heat-inactivated fetal bovine serum, 100 μg/mL streptomycin, and 100 IU/mL penicillin in 37°C incubator for 120 h, monitored and pictured every 24 h:
At 24, 48, and 72 h, the lymphocytes from lymph nodes were round and plump, and had high refractive index, suggesting these cells were of high viability (Fig. 1A–C). However, after 72 h, the lymphocytes became small, shriveled, and irregular, displaying illness (Fig. 1D). When cultured for 120 h, these cells obviously lost their bright refractive index, and many were dying and broken into fragments (Fig. 1E). Similar situation was observed in lymphocytes obtained from blood and spleens (data not shown). Thus, the LTA was chosen at 72 h so that the lymphocytes had enough time to be activated and transformed.
Observation of LT
One of major characteristics for transformed lymphocytes is its morphological alterations (Nowell, 1960; Mackinney et al., 1962). As shown in Figure 2B (rectangles indicated), the in vitro unstimulated (no antigens in coculture) primed (28 after initial immunization) lymphocytes were irregular in shape, low bright refractive, ill, or dying. However, when they were stimulated by its antigen for 72 h (starting when the lymphocytes were placed in the culture plate), they become regular circle, bright with high refractive index, enlarged (about two- to threefold the original size) with large nucleus, capable of dividing (Fig. 2C circles indicated). The data supported that specific tumor antigen could stimulate the primed lymphocytes to transform into lymphoblasts. Owing to the morphological LT assay is time- and manpower-consuming with man-made errors, it is necessary to establish a subjective, convenient and precision method to detect LT. Therefore, we compared the three different subjective assays for LT assessment.
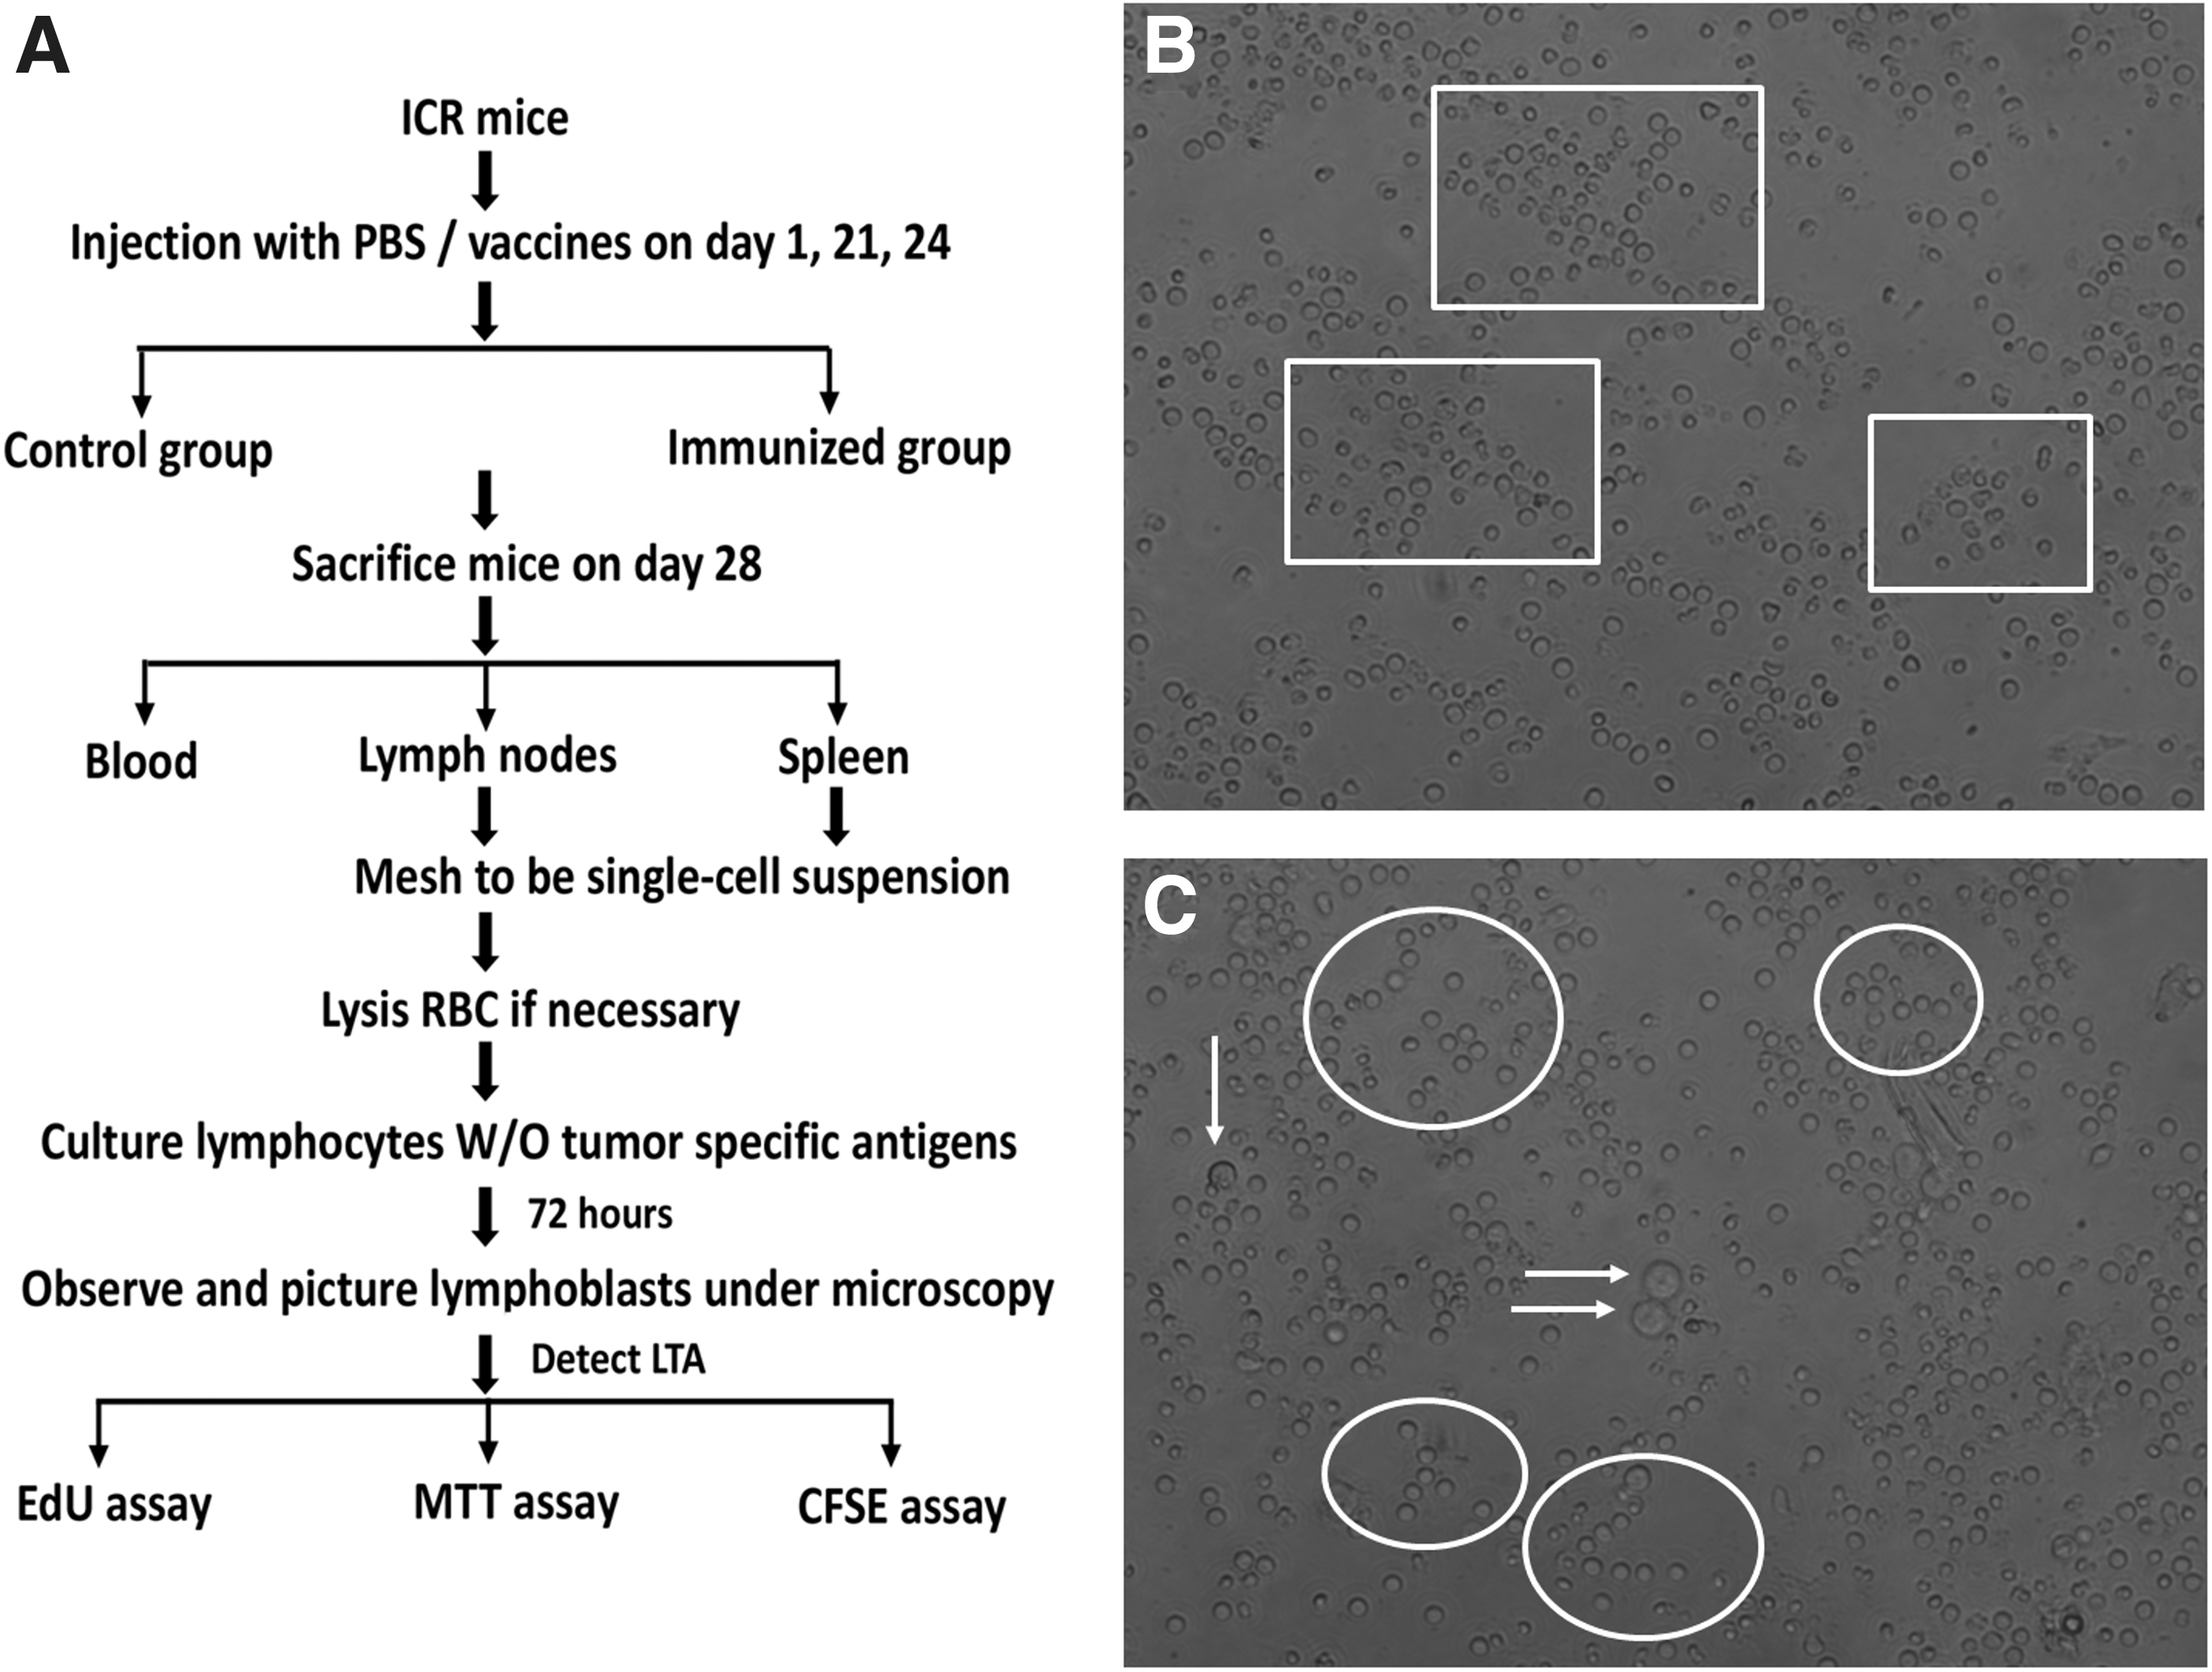
Schematic of experimental design and transformed lymphocytes under microscopy.
Detection of transformed lymphocytes with EdU assay
As shown in Figure 3, the antigen could not elicit the LT of lymphocytes from no-primed control mice, whereas the lymphocytes from three sources (blood, lymph nodes, and spleen) of primed mice did, indicating that the LT reflects antigen-specific cellular immunity. Indeed, there was a dose-dependent tendency from antigen 20 to 50 μg/mL and plateau at 70 μg/mL. To save the antigens, 50 μg/mL was used.
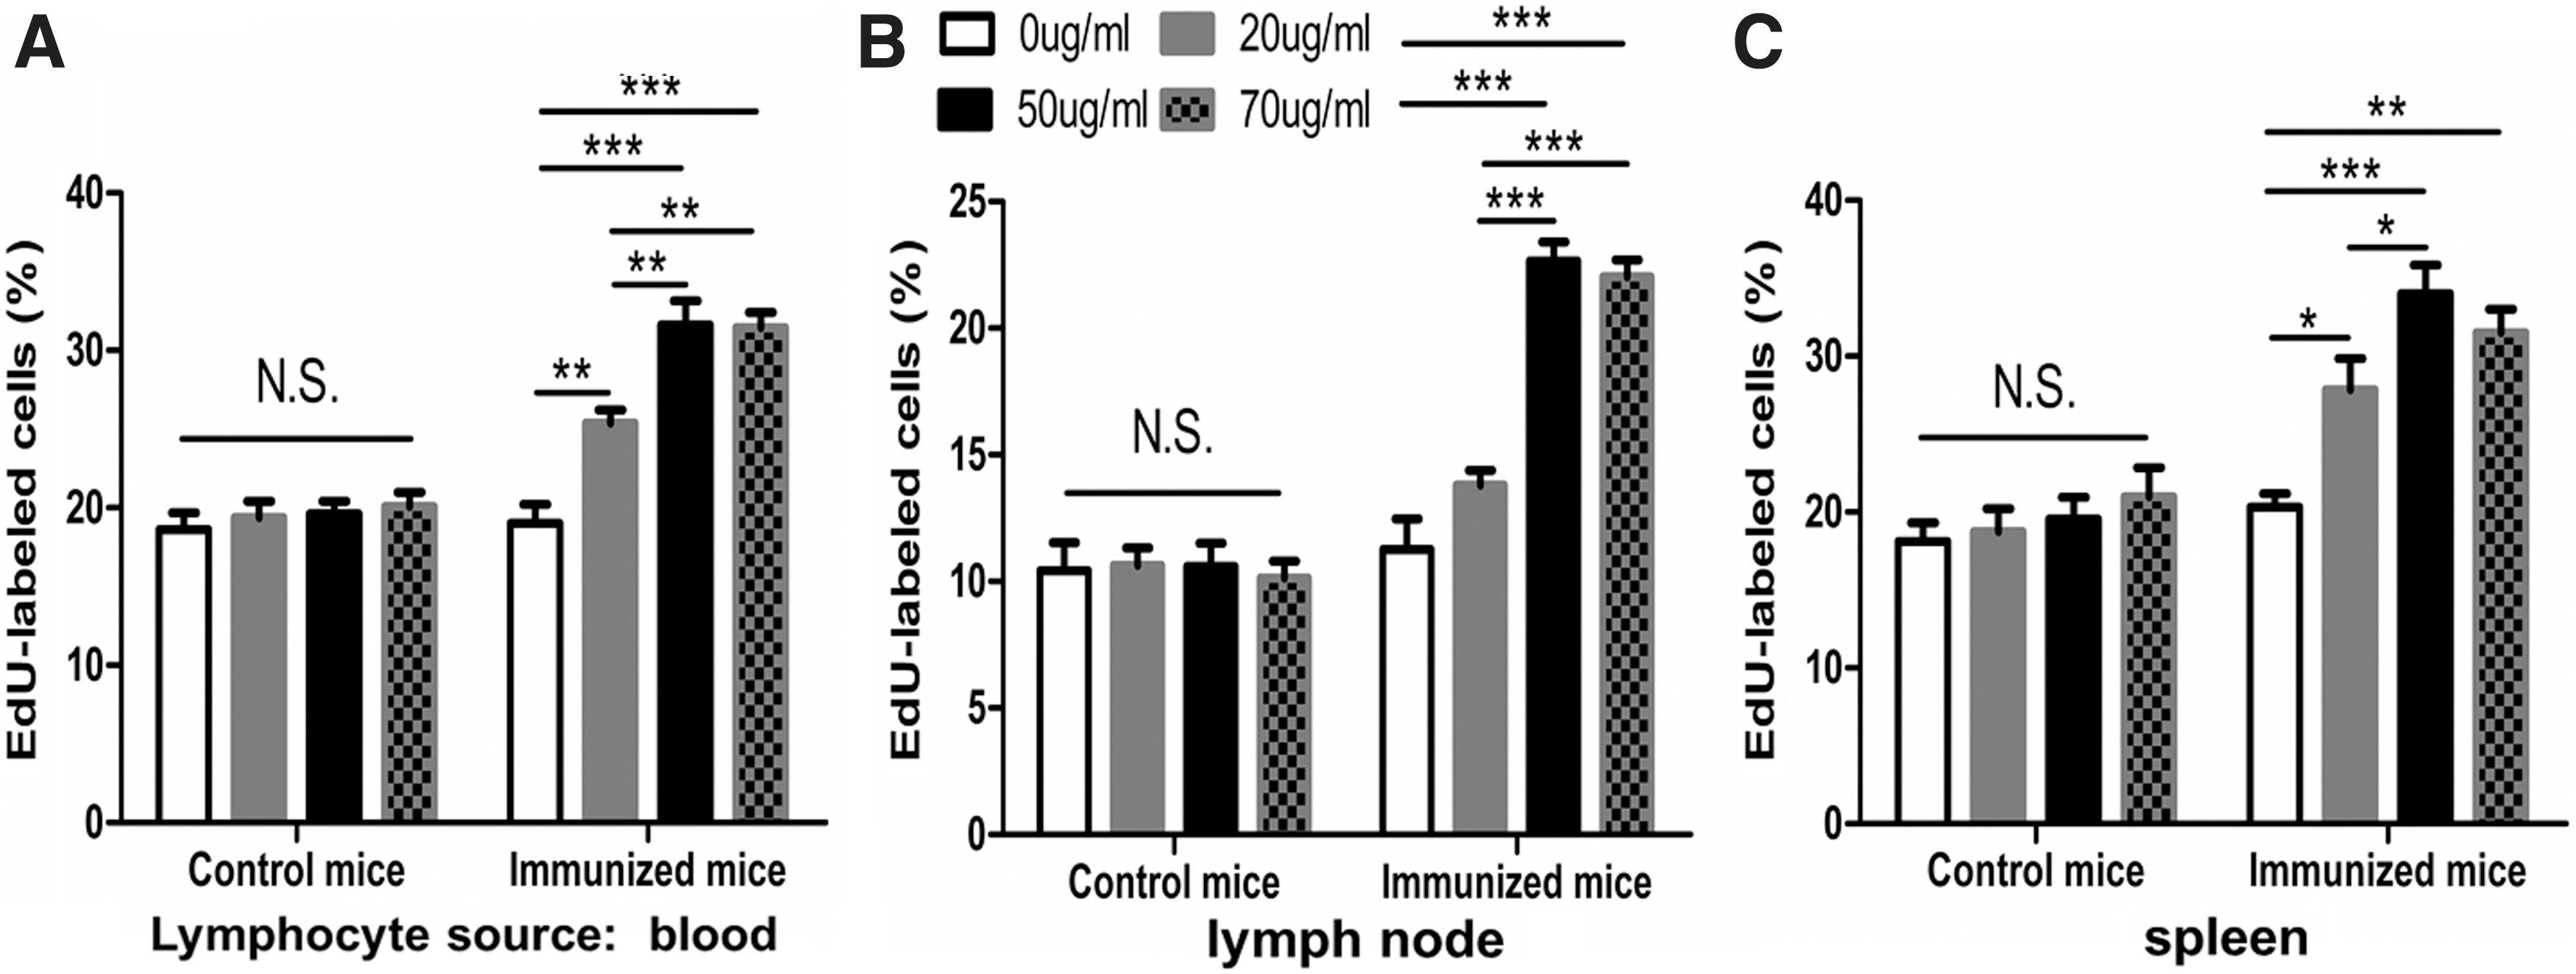
Antigen-induced LTA in lymphocytes from control mice and immunized mice were detected by EdU assay. Lymphocytes were incubated with 5 μM concentration of EdU and cultured for 72 h in the presence of 0, 20, 50, or 70 μg/mL antigens. The percentage of nuclear fluorescence represented the amount of cells incorporated with EdU, associated with LT.
Detection of transformed lymphocytes with MTT assay
As shown in Figure 4, similar to the results obtained from EdU assay, MTT assay (reflecting numbers and function of mitochondria in viable cells) could also reflect whether LT occurred upon the antigen met either the no-primed or primed lymphocytes. However, the magnitude of increased MTT was not as high as EdU did.
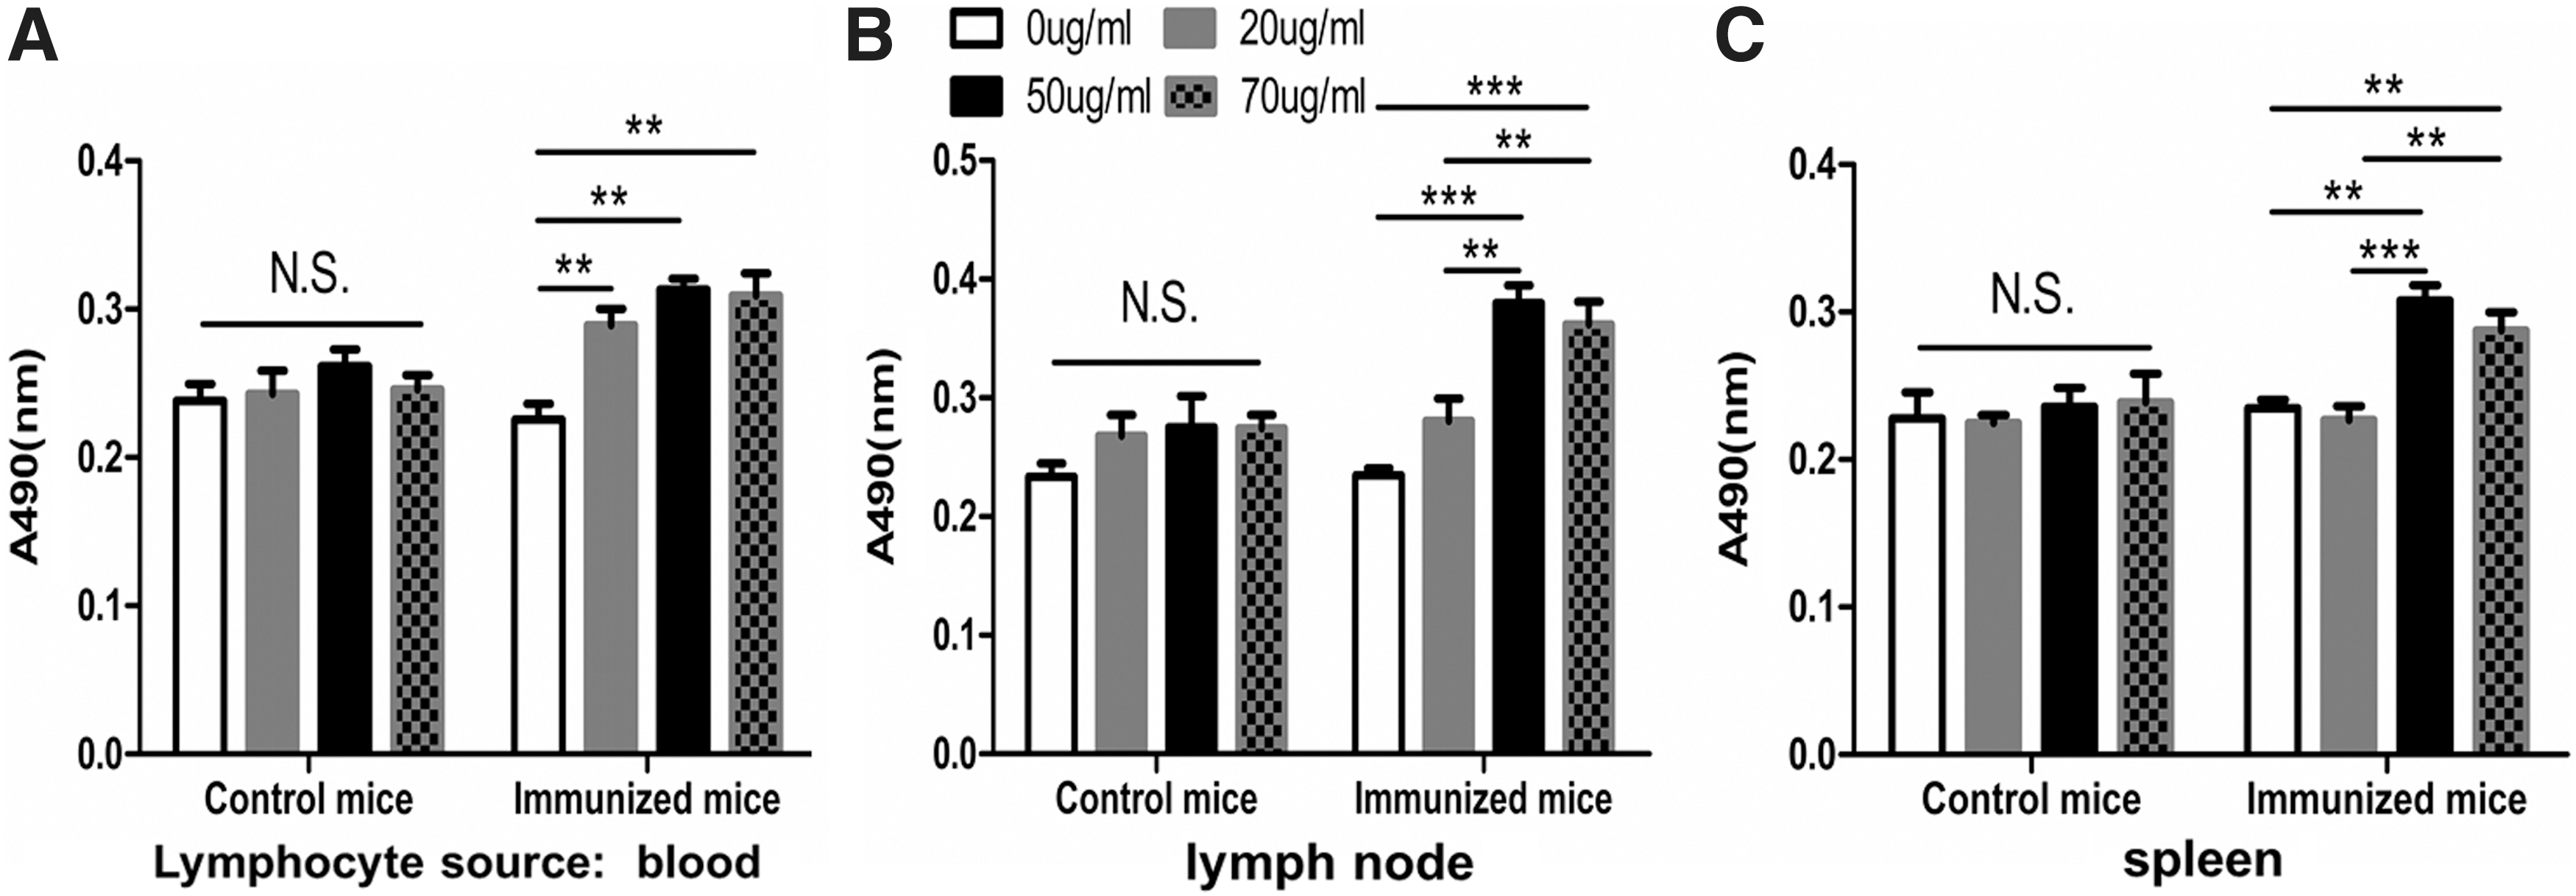
Cell viability of lymphocytes from control mice and immunized mice were detected by MTT assay. Absorbance (490 nm) of MTT was measured in
Detection of transformed lymphocytes with CFSE assay
As shown in Figure 5, there was LT in lymphocytes of blood, lymph nodes, and spleen from primed mice, but not in lymphocytes of blood and lymph nodes from the control mice. In addition, LT occurred in 70 μg/mL antigen-stimulated mice in control mice for splenocytes, demonstrating that CFSE assay is somehow useful to reflect the antigen-triggered specific cellular immune response, but not sensitive and specific compared with EdU assay.
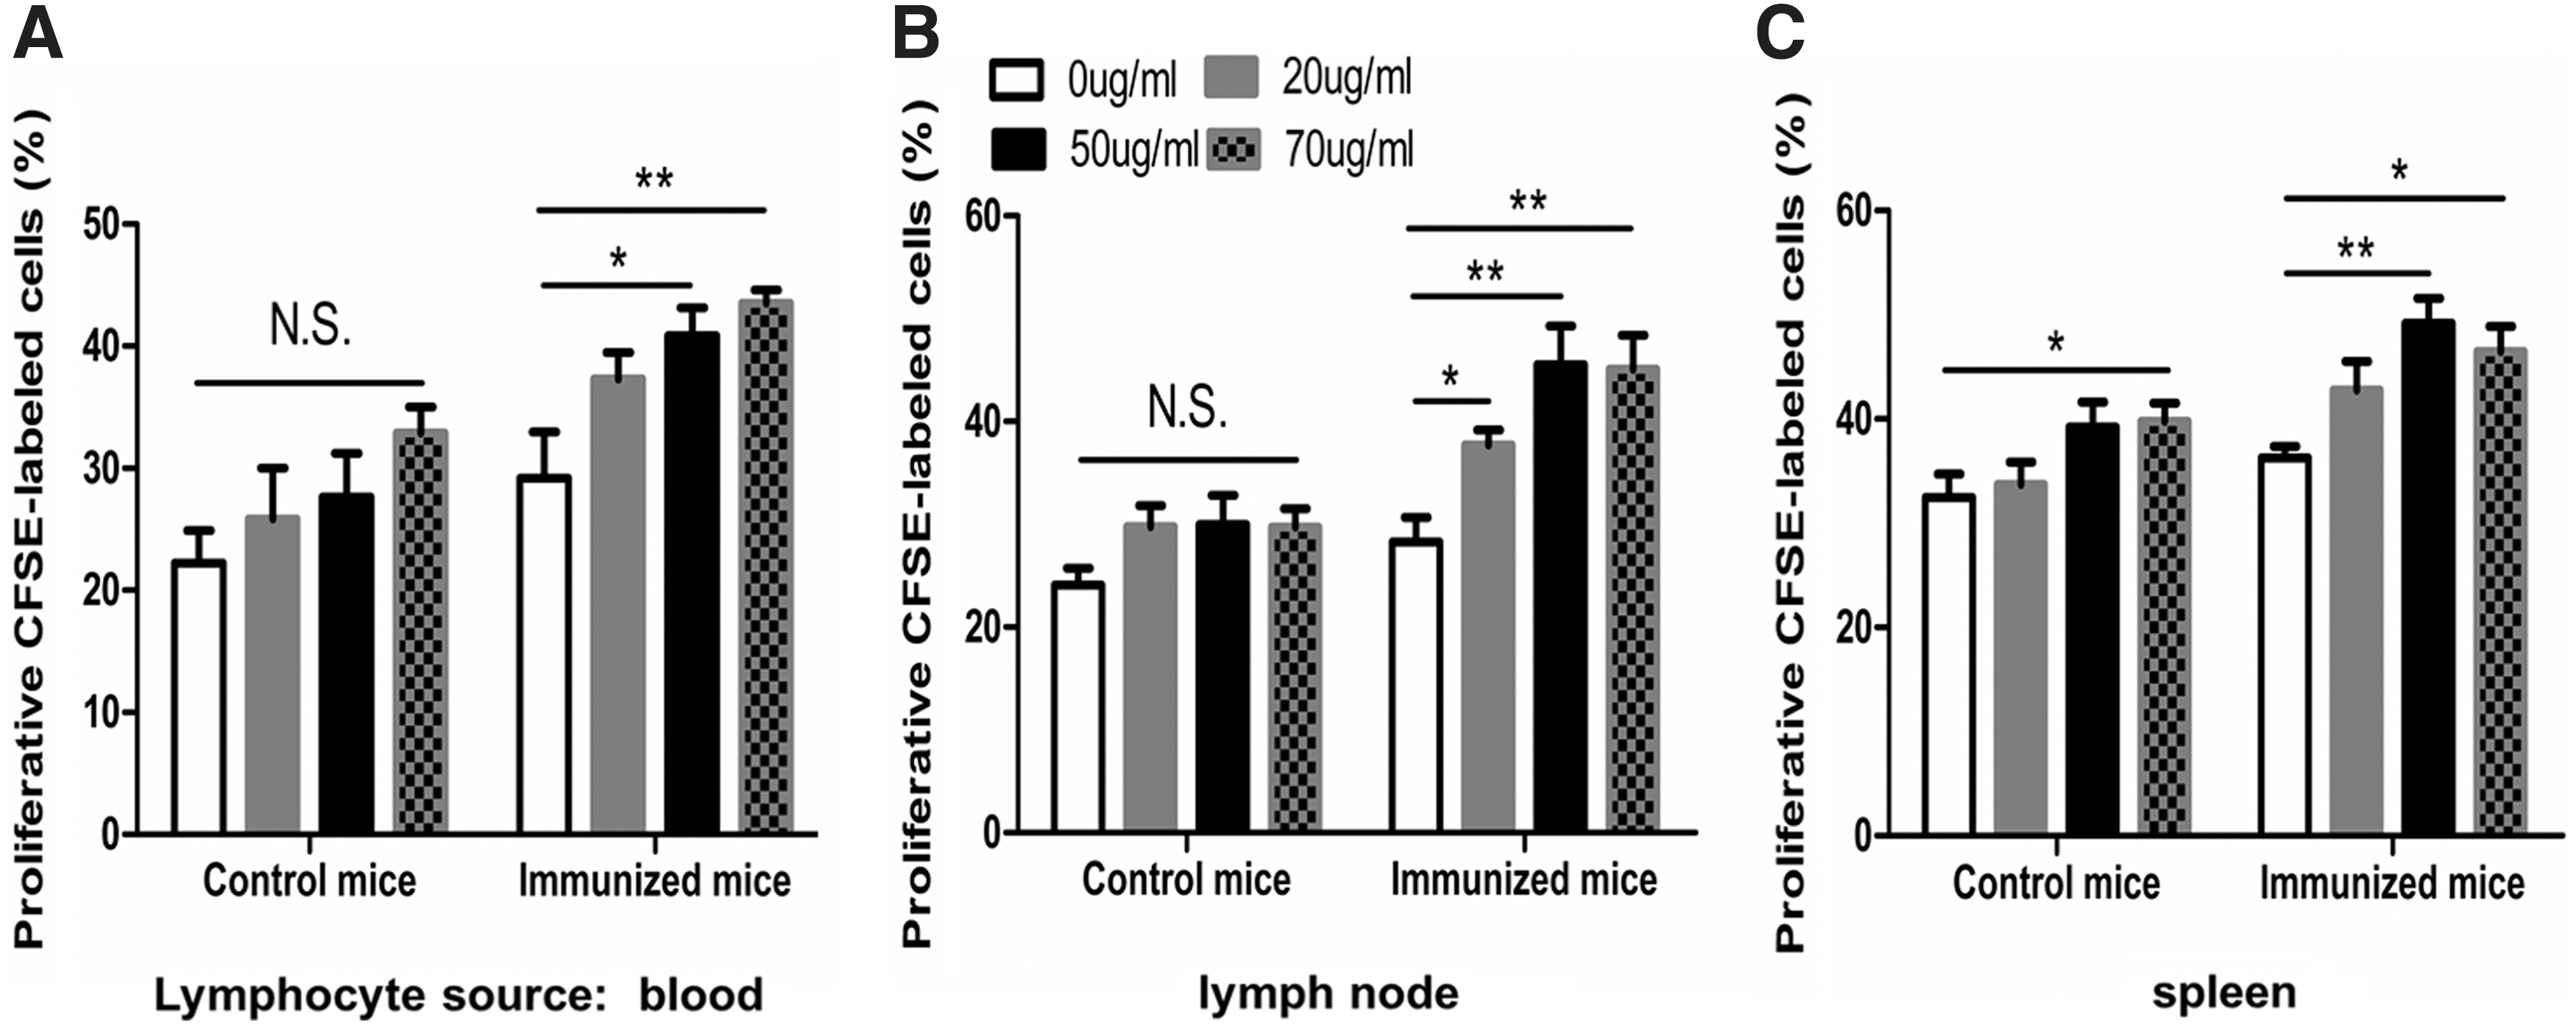
Cell proliferation of lymphocytes from control mice and immunized mice were detected by CFSE assay. Lymphocytes were labeled with 5 μM CFSE and cultured for 72 h in the presence of 0, 20, 50, or 70 μg/mL antigens and the percentages of proliferated cells labeled with CFSE of LT were measured in
Comparison of three assays for transformed lymphocytes
To determine which one out of three is the best assay, we compared the magnitudes of increased LT stimulated with different doses of antigens in lymphocytes from three sources measured simultaneously with three assays. The stimulation index (SI, increased LT from given antigen-stimulated group/background control group) was used as a reference (Cabañas et al., 2017). Table 1 showed that in most of cases, EdU used as DNA incorporation dye yielded a high SI in either lymphocytes from three sources or 20, 50, 70 μg/mL of antigen groups as compared with MTT and CFSE assays.
Compare Stimulation Index of the Three Assays
SI was calculated as the values of EdU/MTT/CFSE with 20, 50, 70 μg/mL antigens divided the values of EdU/MTT/CFSE without antigen.
p < 0.05; ** p < 0.01; *** p < 0.001.
CFSE, carboxyfluorescein succinimidyl ester; EdU, 5-ethynyl-2′-deoxyuridine; MTT, 3-(4,5-dimethylthiazol-2-yl)-2,5-diphenyltetrazolium bromide; SI, stimulation index.
In terms of amount of antigen needed for stimulation of LT, the 50 μg/mL had a similar SI as 70 μg/mL; in other words, the 70 μg/mL antigen did not increase the ration of LTA compared with 50 μg/mL, indicating that 50 μg/mL is sufficient for this LT assay.
In terms of sample sources, the lymphocytes from the lymph nodes were purer; therefore, lymphocytes from lymph nodes appear to be more responsive (highest SI) than lymphocytes from the blood and spleen. However, since the blood is the most convenient sample source, the blood-based LT assay is feasible for clinical use.
Optimal time for LT assay after priming
To determine which is the best time for carrying out the LT assay, the primed mice were sacrificed on day 7, 14, 21, or 28 after first immunization, and the LT assay with EdU was performed with lymphocytes from blood, lymph node, and spleen. The result (Fig. 6B–D) showed that on day 28, all LT tests were positive; on day 21, lymphocytes from blood and lymph node were LT positive, whereas on day 7 and 14, none positive. Thus, the optimal time for LT assay is >21 days after tumor antigen stimulation.

Schematic of experimental design and optimal time for LTA. The transformed lymphocytes from control mice and immunized mice were measured with EdU assay every other week (day 7, 14, 21 or 28) after mice were initially immunized with 50 μg/mL of H22 antigens.
Discussion
Although the LT stimulated by tumor antigens represents the cellular immunity after anticancer treatment, there is not tumor antigen-triggered LTA clinically available as a routine to monitor the alterations of cellular immunity of cancer patients. To fill this gap, this study was focused on defining a good assay to measure the LT for possible use in clinic. Our findings are as follows: (1) the optimal in vitro LT harvest time was 72 h after coculturing lymphocytes with tumor antigens; (2) EdU assay was better than MTT and CFSE assays in terms of sensitivity to reflect the LT magnitude; (3) the tumor antigen concentration for stimulation of primed lymphocytes was about 50 μg/mL; (4) the blood was the most feasible sample source for LT test; and (5) the LT test performing time was >3 weeks after tumor antigen stimulation.
In the past, the typical LT tests used the sensitive 3H-thymidine incorporation assay, which was environmentally unfriendly and labor consuming (Hughes et al., 1958; Porebski et al., 2013; Cabañas et al., 2017). Later on, 3H-thymidine was replaced by BrdU that had a similar biofunction as 3H-thymidine to incorporate into DNA during the S phase of cell proliferation. However, the detection of incorporated BrdU required denature to expose the BrdU to anti-BrdU for quantitative enzyme-linked immunosorbent assay (ELISA), a complicated procedure with low sensitivity (Gratzner, 1982). The MTT and CFSE assays are also utilized to represent the number of lymphocytes (Mosmann, 1983; Denizot and Lang, 1986; Oostendorp et al., 2000); however, they are less sensitive than EdU. Similar to BrdU, EdU incorporate into DNA during S-phase with the advantage of easy to be assessed by flow cytometry; therefore, EdU is a good substitute for 3H-thymidine and BrdU (Salic and Mitchison, 2008; Limsirichaikul et al., 2009; Sun et al., 2012; Mead and Lefebvre, 2014), and much better than MTT and CFSE assay (Table 1). The advantages of EdU assay are as follows: (1) EdU-incorporated DNA directly reflects the capacity of lymphocyte transformed into lymphoblast; thus, EdU assay is very specific and sensitive for LTA. Similar to Cabañas R's report that LTA with 3H-thymidine showed a high specificity and sensitivity in DRESS (drug reaction with eosinophilia and systemic symptoms), a severe delayed hypersensitivity drug reaction (Cabañas et al., 2017); (2) in contrast to the 3H-thymidine, EdU does not involve radioactivity, thus, it is a safe method for measuring newly synthesized DNA in S-phase during replication; (3) in addition, EdU neither requires denaturing DNA nor uses antibodies, which are the weak points of BrdU incorporation method. Therefore, the EdU incorporation is simple and convenient assay; (4) to reduce the possible toxicity of EdU to cells, we used 5 μM low dose. Although some lymphocytes start to apoptosis in 1st day of culture, EdU incorporation in activated cells needs 2–3 day culture as LT biological process. Unlike colony formation requires 7–14 days for cell doubling in numbers, EdU incorporation occurs in early state before cell mitosis, requiring 2–3 day culture time for most of LTA tests (Cabañas et al., 2017).
Our results showed that on day 7 and 14 after immunization, LT was undetectable, whereas 21 days later, the LT was positive (Fig. 6B–D), which is consistent with the factor that the cellular immunity requires >3 weeks to be fully activated (Abu et al., 2014; Espíndola et al., 2014; Hazama et al., 2014). Whether the cancer patients have a similar optimal window for LTA remains to be determined through a large scale of clinical trials.
Our conclusion is obtained from well-controlled mouse model, which might not fit well to cancer patients, since human situation is much complicated and differs from mice. For example, the immunized mice were healthy without any immune suppression/deficiency, while cancer patient might be treated simultaneously with more than one regiment, including chemotherapy that could suppress the host immunity and delay the LT timing. However, by comparison of the LT test results before and after treatment, it gives valuable information regarding the alterations of patient's cellular immunity, which might suggest an appropriate treatment to enhance the host immunity.
In terms of tumor antigen for triggering the LT, in mouse model, it is easy to obtain synergistic tumor cells with unlimited amounts and high purity. With Freund's adjuvant, the mutated tumor antigens in the tumor cell lysate could stimulate the lymphocyte activation. In humans, it is better to obtain from patient himself, such as his own tumor tissue from surgical resection, which should be plenty, or from biopsy, which will be very limited amount. Self-tumor antigens have not only his own specifically mutated oncoproteins, but also bring his own antigen-presenting molecules with no needs of human lymphocyte antigen typing and matching; thus, it is individualized best antigen for his own LT test (Lennerz et al., 2005; Schumacher and Schreiber, 2015; Türeci Ö et al., 2016; Ott et al., 2017; Sahin et al., 2017). It is best to set up tumor bank in hospital for collecting all patients' own surgically removed cancer samples to be used for patient's near future LT test and other related immune diagnosis, and even for individualized tumor vaccine for self-active immunotherapy. Since only 50 μg/mL of tumor antigen is needed for LT, in most of cases, it is feasible.
Taken together, this animal study demonstrated that the EdU assay is better to be used with 50 μg/mL of tumor antigen coculture for 72 h with blood lymphocytes obtained >3 weeks after treatment. The background control of LT assay is the lymphocyte without stimulation of tumor antigens. The higher EdU detected in the lymphocytes with tumor antigens is, the higher antitumor cellular immunity might be.
It is best to monitor the LTA before and after treatment. Since the treatment regiments for individual patients and his immunity are quite different from patient to patient, the self-comparison would be needed for precision evaluation of dynamical LT alterations after each treatment. It is expected that the transformed lymphoblast before treatment might be lower than those >3 weeks after treatment if patient's immunity response to tumor antigens released during the treatment. A continuously increased LT might present an enhanced cellular immunity, an indicator for treatment success and good prognosis of cancer. Such an LTA should be used for monitoring and rejustifying the cancer therapy.
The limitation of EdU assay for LT test is the man-operation that cannot meet the vast needs from patients. An improvement of LTA automation is needed.
In conclusion, this optimized EdU assay for LT test is needed for evaluation of cellular immunity after cancer treatment. It might provide useful information for the rejustifying treatment and the prediction of cancer outcome.
Footnotes
Acknowledgment
The authors thank Dr. Shimin Zhang for his valuable contribution to the idea, data analysis, and English editing.
Disclosure Statement
No competing financial interests exist.
Funding Information
The project was funded in part by the grants from Fujian Development and Reform Commission (FGW2014) to J.L.; Fujian Education Ministry (2013-58) and Fujian Association for international exchange of personnel funds (W13350000137) to L.Z.; Fujian Medical University funds (0000-081919) to J.L.; and Fujian Key Laboratory of Translational Cancer Medicine and Science and Technology Program of Fujian Province, China (no. 2018Y2003).