
Abstract
Immune cell infiltration is associated with the prognosis of cancer. This study focused on the immune infiltration profiling and their association with survival outcome in nonsmall cell lung cancer (NSCLC). Research data were obtained from the Gene Expression Omnibus and The Cancer Genome Atlas databases. CIBERSORT algorithm was applied to assess the relative proportions of 22 kinds of immune cells. Log-rank test was performed to compare the survival outcome of patients with different proportions of immune cells. The estimated hazard ratios were presented with forest plot. Multivariate Cox regression analysis was conducted to estimate the adjusted associations between different types of infiltrating immune cells and survival prognosis controlling for other clinical features and confounders. With the CIBERSORT approach, we assessed the proportions of 22 infiltrating immune cells of 2050 cases with NSCLC. By conducting survival analysis, we found different survival outcomes among cases with different proportions of certain types of infiltrating immune cells. Among the cell subsets investigated, plasma cells (hazard ratio [HR] = 0.775, 95% confidence interval [CI]: 0.669–0.898) and regulatory T cells (HR = 1.258, 95% CI: 1.091–1.451) were associated with survival outcome of NSCLC patients controlling for other covariates. Subgroup analysis suggested a good consistency and robustness of our results. Our findings might provide useful information for prognosis prediction and cellular study in NSCLC.
Introduction
Lung cancer (LC) is one of the most common human cancers in the world (Siegel et al., 2019). Approximately 80–85% of LC cases can be categorized into nonsmall cell lung cancer (NSCLC) (Liu et al., 2017). It was suggested that early diagnosis of NSCLC would prolong the overall survival of patients (Collins et al., 2007; Doria-Rose et al., 2010; Liu et al., 2017). However, the indolent nature of the NSCLC makes it very difficult to be detected at an early stage (Collins et al., 2007; Doria-Rose et al., 2010). Since the vast majority of NSCLC patients have reached advanced stage at the time of diagnosis, their 5-year survival rate is less than 25% (Abedi et al., 2019). Therefore, to improve the prognosis of NSCLC, the exploration of new early diagnostic markers, prognosis prediction approaches, and more effective treatment methods has never stopped.
Tumor-infiltrating immune cell (TIIC) plays an important role in anti-tumor immune surveillance in many solid tumors (Melichar et al., 2010; Mlecnik et al., 2016; Gnjatic et al., 2017). Several immune checkpoint blockers have been found and also shown significant effects in clinical practice (Brahmer et al., 2012; Topalian et al., 2012; Ansell et al., 2015; Nanda et al., 2016). In recent years, large numbers of studies have shown that the infiltration of immune cells in LC tissues is closely related to the progression and prognosis; however, the role of tumor-infiltrating lymphocytes in NSCLC is controversial (Mori et al., 2000; Woo et al., 2001; Hiraoka et al., 2006; Ikeda et al., 2006; Petersen et al., 2006; Ruffini et al., 2009).
Besides, most of the studies included only one or two cell types because of technical issues, and acknowledged that immune response is characterized by highly coordinated interactions of multi-immune cell types. Therefore, to obtain a better and comprehensive understanding of the nature of the immune response in NSCLC and the prognosis value of TIIC subtypes, it is necessary to investigate immune cells as a complex biological system.
In this study, we aim to obtain a better understanding of the immune cell infiltration pattern in NSCLC, and identify specific prognostic TIICs through the quantification of the cellular composition of immune response in NSCLC and their association to survival outcome. We applied the CIBERSORT algorithm (Newman et al., 2015), which is a systematic biological analytical tool that infers the relative proportions of 22 functional immune cell types based on gene expression data, to 2050 NSCLC cases with clinical phenotypes obtained from public databases.
Materials and Methods
Data profiling
Research data in this study were all obtained from the Genome Expression Omnibus (GEO) database and The Cancer Gene Atlas (TCGA) database. For the GEO database (
Those included datasets were all from studies focusing on the role of genes in the diagnosis, prognosis, and progression of LC (Tomida et al., 2004, 2009; Bild et al., 2006; Raponi et al., 2006; Zhu et al., 2010; Botling et al., 2013; Tang et al., 2013; Der et al., 2014; Mitchell et al., 2017). For the TCGA database (
The clinical variables included in the study were tumor pathology stage, age at diagnosis, survival status and time, histology type, and gender. Cases without those information were excluded in the analysis. The details of the sample and data selection are presented in Figure 1. The URLs for the accession of data involved in this study are presented in Supplementary Table S1.

Research flowchart of included cases and datasets in this study.
Evaluation of cancer immune cell infiltration
The relative proportion of 22 types of infiltrating immune cells was inferred with the CIBERSORT algorithm (Newman et al., 2015). Batch effect was removed with the “removeBatcheEffect” function in R package “limma” (version 3.38.3) nested in R (version 3.5.2). The datasets with normalized gene expression measurements were uploaded to the CIBERSORT web portal (
The validation of the results obtained with CIBERSORT algorithm was conducted based on the “Estimate the Proportion of Immune and Cancer cells” (EPIC) algorithm (Racle et al., 2017). This algorithm can be conducted through R package “EPIC” (version 1.1.5) with reference signature matrix (LM22 with 547 genes). The validity was measured through the Intraclass Correlation Coefficient (ICC).
Statistical analysis
All statistical analyses were conducted with packages nested in R (version 3.5.2). Bar plots generated with R packages “ggplot2” (version 3.1.0) and “RColorBrewer” (version 1.1-2) were used to demonstrate the estimated proportions of immune cells and CIBERSORT p-values in each dataset. The association between inferred immune cells was measured with Pearson correlation coefficient and presented with heat map through R package “pheatmap” (version 1.0.12). Hierarchical clustering approach was used to identify patients with different TIIC characteristics with R packages “factoextra” (version 1.0.5) and “cluster” (version 2.0.7-1). The optimized number of clusters was obtained through the Gap statistics.
Survival analysis was performed with R packages “survival” (version 2.43-3) and “rms” (version 5.1-3). Log-rank test (with chi-square statistic) was used to compare average survival times. Multivariate Cox regression analysis was conducted to estimate adjusted hazard ratio (HR). R function “cox.zph()” in the R packages “survival” (version 2.43-3) was used to test whether the data satisfy the proportional hazard hypothesis, which was required for the application of Cox regression model. Clinical variables and dataset identifiers were regarded as potential confounders in multivariate analysis. A dataset identifier was also included in multivariate Cox regression model as confounder to control the possible heterogeneity. The performance of the multivariate Cox regression model was evaluated by the C-index.
Forest plot generated through R packages “forestplot” (version 1.7.2) was used to present the estimated HR, corresponding p-value, and adjusted p-value. BH method (Benjamini and Hochberg, 1995) was applied to estimate the adjusted p-value obtained in selection of potential prognostic TIICs through R function “p.adjusted(),” considering the multitesting issue. To evaluate the consistency of our main results across histology types (squamous carcinoma and adenocarcinoma), cohorts, and gene expression profiling platforms, subgroup analysis was conducted. Level of statistical significance was set to be 0.05.
Results
Overall profiling across included datasets
The average number of gene signatures represented was 413 (66–529), while the number of genes composing the reference signature matrix was 547. The clinical phenotypes of included cases across dataset were presented in Table 1. The medium follow-up time for the cases included in the study was 67.200 (0.030–227.070) months. During the follow-up, 803 (out of 2050) cases deceased.
Clinical Features for the Nonsmall Cell Lung Cancer Cases Included in This Study
GEO, Genome Expression Omnibus; TCGA, The Cancer Gene Atlas.
The relative proportions of 22 distinct TIICs for NSCLC cases were estimated with CIBERSORT algorithm. The average ICC obtained in validation analysis based on EPIC algorithm was 0.904 (0.748–1.000), and indicated good validity and robustness of the estimated TIIC proportions.
The summary of the included 11 datasets containing 2050 cases of NSCLC is presented in Figure 2. Figure 2A presented the proportions of 22 inferred immune cells across datasets. Figure 2B demonstrated the CIBERSORT Person correlation coefficients between the inferred immune cells. These results suggested that the proportions of TIICs in each dataset vary, which indicated heterogeneity between included datasets.

Relative proportions of 22 distinct TIICs inferred with CIBERSORT algorithm.
Figure 3 depicted the CIBERSORT p-values across datasets and their association with survival outcome. A higher p-value would suggest a higher proportion of nonimmune cells (Newman et al., 2015). The proportions of cases with different p-values in each dataset are proposed in Figure 3A; the association between thresholds of p-value and survival outcome was investigated with log-rank test and presented in a survival plot as in Figure 3B.

CIBERSORT p-values.
As presented in Figure 3B, the survival outcomes were statistically different between cases with different CIBERSORT p-values (log-rank chi-square = 7.341, and p-value = 0.025). To be specific, we found that patients with p-value <0.01, which also suggests a higher proportion of immune cells, had the best survival prognosis (average survival time = 70.800 months). For cases with p-value ≥0.05, the average survival time is 52.167 months; the average survival time for patients with 0.01 < p-value <0.05 is 59.930 months.
Association between immune clusters and survival
As the variation of immune cell proportions changed at individual level and might be associated with the prognosis, it might be useful to investigate whether patterns of immune infiltration associated with prognosis of NSCLC. Clustering analysis was conducted based on the estimated TIIC proportions. The optimized number of clusters selected was 4 (based on Gap statistic). The identified cluster and corresponding TIIC proportions are presented in Table 2 and Figure 4A and B. These results suggested that the distribution of TIIC proportions was different across clusters.

Clustering analysis for the inferred TIIC proportions:
Average Proportion of Inferred Immune Cells for Whole Sample and Identified Clusters
Tregs, T cells regulatory.
We found that most cases in datasets GSE102287, GSE13213, GSE14814, GSE42127, GSE4573, LUAD, and LUSC were clustered into Cluster 1 and Cluster 4; cases in datasets GSE3141 and GSE37745 were mainly clustered into Cluster 1 and Cluster 3; and cases in GSE4716 were in Cluster 1 and Cluster 2, while cases in GSE50081 were mostly clustered into Cluster 1, Cluster 2, and Cluster 3. Detailed clustering results for cases in each dataset are presented in Table 3. Log-rank test suggested that the survival time for cases in different clusters was statistically different (log-rank chi-square = 25.070, p < 0.001); as shown in Figure 4C, the average survival time for cases in each cluster is presented in Table 4.
Summary for Clustering Results
Survival Time (Months) Across Clusters
CI, confidence interval; SE, standard error.
Relationship between distinct TIIC proportions
The relationship (measured by Pearson correlation coefficients) between 22 distinct TIIC proportions are presented with a heat map in Figure 4D. As shown in Figure 4D, the result indicated that the proportion of distinct immune cells was lightly to moderately associated (0 < |r| < 0.5).
Survival analysis
To identify the association between TIIC and survival outcome on NSCLC patients, multivariate Cox regression analysis was conducted. To obtain a better interpretation of the HRs, the proportions of 22 infiltrating immune cells were categorized into two classes using their medians, and then incorporated into univariate Cox regression analysis and log-rank test separately. All 2050 cases were included in univariate analysis.
To control the false positive rate, we applied BH method to obtain the adjusted p-value. As a result, plasma cells (HR = 0.796, 95% confidence interval [CI]: 0.685–0.925; adjusted p = 0.029), regulatory T cells (HR = 1.247, 95% CI: 1.072–1.451; adjusted p = 0.029), and eosinophils (HR = 1.287, 95% CI: 1.089–1.520; adjusted p = 0.029) were identified to be potentially associated with the survival outcome of NSCLC patients. The results are presented in Figure 5. The corresponding survival plot for the selected immune cells is presented in Figure 6.
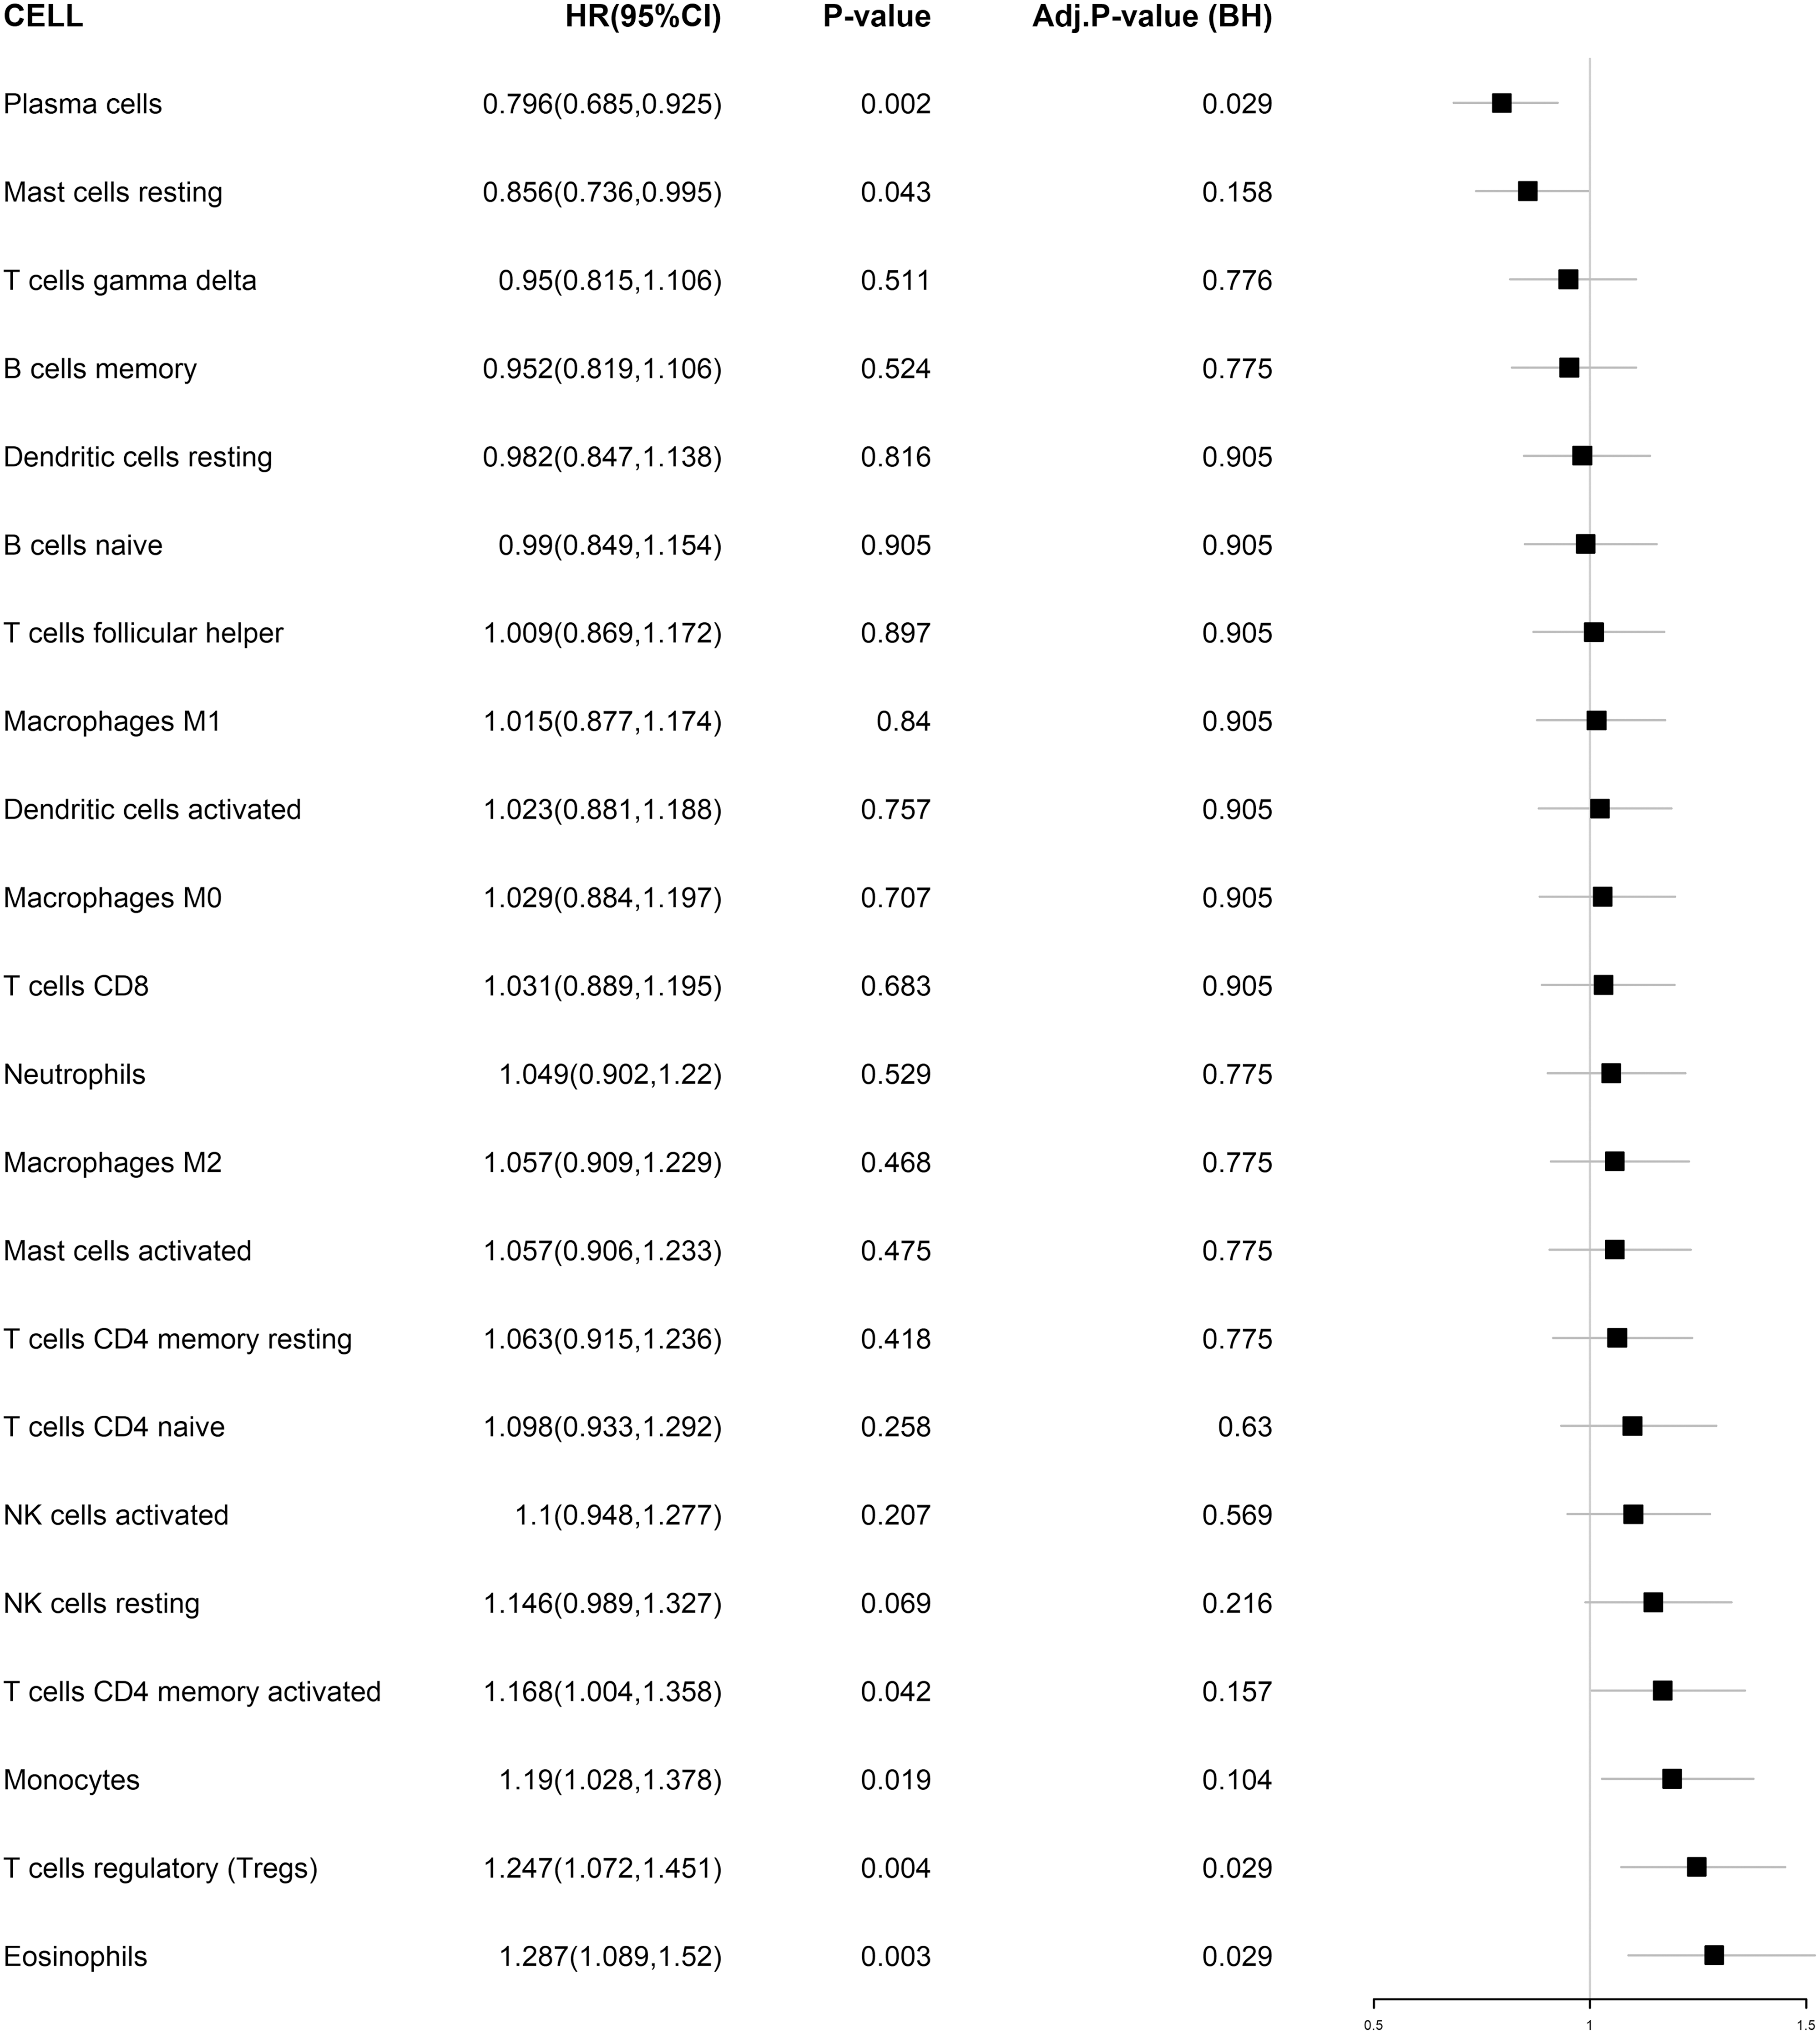
Forest plot for the HRs for the 22 TIIC proportions obtained with univariate Cox regression analysis and the corresponding adjusted p-values obtained with BH methods. HR, hazard ratio.

Survival plots for selected TIIC proportions.
Then, the identified infiltrating immune cells were then incorporated together into multivariate Cox regression analysis with pathology stage, gender, age at diagnosis, histology types, and dataset identifiers as covariates. For the samples included in the multivariate Cox regression, 742 (out of 1850) cases deceased; the average follow-up time was 68.287 (0.070–227.070) months.
The p-value obtained in the test for proportional hazard was 0.157, indicating that the data satisfied the proportional hazard hypothesis. As a result, plasma cells (HR = 0.775, 95% CI: 0.669–0.898) were found to associate with favor survival prognosis and regulatory T cells (HR = 1.258, 95% CI: 1.091–1.451) were associated with poor survival outcome of NSCLC patients, controlling for other covariates, as presented in Table 5. The C-index for the multivariate Cox regression model was 0.847, indicating a good performance.
Multivariate Cox Regression for Selected Infiltrating Immune Cells and Clinical Features
Histology types and gender were removed from the final model due to a lack of statistical significance.
Dataset identifier was included as potential confounder, but no HR was estimated (considering the interpretation of HR).
HR, hazard ratio.
Subgroup analysis
Subgroup analysis for the association between the selected TIIC proportions and the survival outcome of cases from different cohorts is presented in Table 6. As a result, higher proportion of plasma cells (for GEO cohort: HR = 0.785, 95% CI: 0.649–0.951; for GEO cohort: HR = 0.809, 95% CI: 0.711–0.920) was identified to be associated with better survival prognosis for NSCLC cases in both cohorts. Higher proportion of regulatory T cells was identified to be associated with worse survival outcomes of NSCLC cases in the GEO cohort (HR = 1.280, 95% CI: 1.076–1.523), while for cases in the TCGA cohort (HR = 1.152, 95% CI: 0.883–1.380), no statistical significance was obtained.
Subgroup Analysis for Estimation of Adjusted Hazard Ratios for Selected Infiltrating Immune Cells and Clinical Features Across Cohorts
Adjusted for pathology stage, age at diagnosis, and dataset identifier; histology types and gender were removed from the final model due to a lack of statistical significance.
The association between the selected TIIC proportions and the survival outcome of cases with different histology types is presented in Table 7. Higher proportion of plasma cells was identified to be associated with better survival outcomes of cases with adenocarcinoma (HR = 0.723, 95% CI: 0.590–0.886), while for cases with squamous carcinoma (HR = 0.869, 95% CI: 0.686–1.103), no statistical significance was obtained. Higher proportion of regulatory T cells (for cases with adenocarcinoma: HR = 1.357, 95% CI: 1.110–1.661; and for cases with squamous carcinoma: HR = 1.193, 95% CI: 1.037–1.520) was identified to be associated with worse survival prognosis for NSCLC cases in both cohorts.
Subgroup Analysis for Estimation of Adjusted Hazard Ratios for Selected Infiltrating Immune Cells and Clinical Features for Cases with Adenocarcinoma and Squamous Carcinoma
Adjusted for pathology stage, age at diagnosis, and dataset identifier; gender was removed from the final model due to lack of statistical significance.
For the association between identified TIIC (plasma cells and regulatory T cells) proportions and survival outcomes across gene expression profiling platforms, the association in platform subgroups was consistent with that obtained based on whole sample, as presented in Table 8. However, in some platform subgroups (GPL6480 and GPL3694), no statistical significance was obtained. For platform GPL96 and GPL6884, no statistical significance was obtained for the proportion of regulatory T cells. Detailed results are shown in Table 8.
Subgroup Analysis for Estimation of Adjusted Hazard Ratios for Selected Infiltrating Immune Cells and Clinical Features Across Gene Expression Profiling Platforms
Adjusted for pathology stage, age at diagnosis, and dataset identifier; gender was removed from the final model due to a lack of statistical significance.
Discussion
Breakthrough achievements have been made in immunotherapy of human cancers in recent years; many immunotherapies have been clinically approved for treatment of several cancers (Dyck and Mills, 2017). Published literatures (Mlecnik et al., 2016; Gnjatic et al., 2017) also suggested that the types and distributions of TIIC might be potential indicators of cancer prognosis. Researchers have paid more attention to the role of immune cell infiltration in the development, progression, and prognosis of NSCLC than before (Yu et al., 2019).
In this study, based on the RNA sequencing and clinical phenotypes of NSCLC patients obtained from the TCGA and GEO cohorts, we observed considerable distinct patterns of immune cell infiltrations and associations with clinical outcome for different subsets of immune cells in NSCLC. Our results suggested that regulatory T cells and plasma might associate with the survival in NSCLC.
In the analysis, we found that the distribution of TIIC proportions varies across datasets, as shown in Figure 1. Cluster analysis indicated that the cases included in this study could be clustered into four distinct clusters based on the estimated TIIC proportions as shown in Figure 4B and Tables 2 and 3. Because of the clustering approach, cases in the same clusters would share similar TIIC proportions. Then, we found the survival prognosis was statistically different among the four clusters as shown in Figure 4C. These results suggested that the pattern of TIIC proportions would be associated with the survival outcome of NSCLC patients.
Published studies have shown that tumor-related immune responses were the accumulation of the interaction of a variety of different immune cells (Gajewski et al., 2006; Elinav et al., 2013); an effective antineoplastic response requires the interaction of several immune processes. The prognostic effect of CD8+ cells was significantly higher with the presence of CD20+ B cells; it also suggested a cooperative interaction between these immune cells subsets (Nielsen et al., 2012). In this study, we found the proportion of distinct immune cells was lightly to moderately associated (0 < |r| < 0.5) as shown in Figure 4D. This result also indicated that the immune cell subsets did not operate in isolation in NSCLC. Our result was consistent with published studies.
The CIBERSORT p-values obtained in this study reflected the relative proportions of immune and nonimmune cells in each dataset. The association between survival outcome and the p-value thresholds indicated that the prognosis of NSCLC may be associated with the quantity of certain types of immune cells as shown in Figure 3B. Tumor microenvironment is composed of tumor cells, immune cells, microvascular system, fibroblasts, other stromal cells, and extracellular matrix (McCarthy, 2014). Studies have confirmed that the inflammation state in tumor microenvironment plays a key role in the occurrence, progress, and metastasis of most solid tumors (Lokody, 2014; McCarthy, 2014). Our results suggested that the quantity of TIIC proportions was associated with the survival prognosis of NSCLC patients, which was consistent with published studies.
In the analysis, we also found that the distribution of TIIC proportions was heterogeneous across datasets. This heterogeneity could be partly caused by the different gene expression profiling platforms used in different substudies or the heterogeneity across datasets and histology types. These might affect the estimation of the association between TIIC proportions and survival outcome. Thus, a dataset identifier was used as a potential confounder in multivariate Cox regression analysis and subgroup analysis was conducted across gene expression platforms and histology types to access the robustness of our findings.
In subgroup analysis for different cohorts and histology types, the consistency and robustness of our main results were evaluated. For different cohorts, we obtained the similar association between the proportion of plasma cells and survival outcome, while for regulatory T cells, the trends were consistent, but no statistical significance was obtained for the TCGA cohort.
For different histology types, the association between regulatory T cells and survival outcome in whole study sample was consistent with that in histology subgroups. All analysis suggested that higher proportion of regulatory T cells would predict worse survival outcome. The association between plasma cells and survival outcome in whole sample was consistent with that in cases with adenocarcinoma, while for squamous carcinoma, the same trend was observed, but no statistical significance was obtained.
For subgroup analysis across platforms, results suggested that the trends of the association between the identified prognostic TIIC (plasma cells and regulatory T cells) and the survival outcome were consistent across different platforms, different cohorts, and histology types (squamous carcinoma and adenocarcinoma). Although in some subgroups, no statistical significance was obtained, the trend of the estimated adjusted HRs remains consistent. The results of subgroup analysis indicated that our main findings were robust.
The association between immune cell infiltration and clinical phenotype has been analyzed through multivariate survival analysis. We found that certain immune cells, including plasma and regulatory T cells, were associated with the survival prognosis. Among all immune cells that constitute the tumor microenvironment, regulatory T cells, or known as the suppressor T cells, mainly play an immunosuppressive role (Barbi et al., 2014). It can inactivate tumor immunity by inhibiting the function of effector T cells and NK cells by secreting immunosuppressive cytokines such as IL-10 and TGF-β (Barbi et al., 2014).
Numerous studies have shown that high levels of regulatory T cells in peripheral blood and tumor microenvironment can inhibit the antitumor immune response and predict worse cancer prognosis (Curiel et al., 2004; Baxevanis et al., 2013). Based on this, several antineoplastic immunotherapies targeting the deleting and managing of regulatory T cells have been proposed (Nair et al., 2007; Nitcheu-Tefit et al., 2007; Powell et al., 2007; Piconese et al., 2008).
In this analysis, we also found that regulatory T cells were associated with poor survival outcome in NSCLC. Plasma cells are white blood cells that secrete large volumes of antibodies. Recent study has suggested that plasma cells are an integral component of CD8+ tumor-infiltrating lymphocyte responses (Kroeger et al., 2016) and thus promote cancer survival. The IGKC gene, which is expressed in plasma cells, has also been identified to be associated with better prognosis in breast cancer (Chen et al., 2012). It has been found to associate with better survival prognosis in several solid tumors (Gentles et al., 2015). In this study, we also found that plasma was related to the favor survival outcome for general NSCLC.
Systematic and computational biology has developed rapidly in the past two decades. The CIBERSORT algorithm proposed by Newman et al. was a gene expression-based deconvolution tool inferring the relative proportion of TIICs (Hiraoka et al., 2006). Recently, it has been applied to the research of TIIC patterns of several human cancers, including breast cancer, ovarian cancer, hematology cancer, and lung cancer (Ali et al., 2016; Liu et al., 2017; Rohr-Udilova et al., 2018).
Several tumor-related TIICs have also been found through the CIBERSORT approach and the TCGA and GEO database (Ali et al., 2016; Raza et al., 2016; Liu et al., 2017; Rohr-Udilova et al., 2018; Timothy et al., 2018). The results obtained by the CIBERSOT method have also been verified through cellular experiments (Ali et al., 2016; Raza et al., 2016; Liu et al., 2017; Rohr-Udilova et al., 2018; Timothy et al., 2018). These all suggested the reliability of the CIBERSORT approach, and the reliability of the TCGA and GEO databases.
The type and proportion of infiltrated immune cells in solid tumors reflect the characteristics of tumors and predict the prognosis of cancer patients (Bremnes et al., 2016; Yu et al., 2019). Recently, a number of studies focusing on the role of TIICs in the prognosis of NSCLC have been reported (Yu et al., 2019). Higher level of cytotoxic CD8+ lymphocyte predicts better prognosis for NSCLC patients (Mazzaschi et al., 2018). An elevated BAFFR expression level was found to be associated with worse survival outcome, while a higher level of CD40 might predict better survival for NSCLC patients (Dimitrakopoulos et al., 2019).
Based on the findings on the role of infiltrating immune cells in solid tumor, several new therapies/drugs targeting immune checkpoints have been presented (Ansell et al., 2015) such as the checkpoint blockade immunotherapy PD-1 (Moon et al., 2017) and others. A recent finding on the role of CD8+CD103+ tissue-resident memory T cells in NSCLC also supported the use of anti-PD-1 blocking Ab in reversing the tumor-induced T cell exhaustion in NSCLC patients and prolonged survival (Djenidi et al., 2015). All these findings suggest that the understanding of the role and mechanism of tumor-infiltrating immune cells will have a profound impact on the clinical outcome prediction and therapy management of NSCLC.
This work also has some limitations. First, the CIBERSORT algorithm can only estimate the relative abundance of immune cells, not absolute densities. It made it unable to investigate the association between clinical outcome and the density of specific immune cells. This may cause a loss of information in the analysis. Then, to obtain reliable results, we collected data from different cohorts and studies, which would cause unavoidable heterogeneity. As presented in Figure 2, TIIC proportions vary across datasets. Similarly, this study included NSCLC patients with different pathological types, which would cause a potential heterogeneity between different histology types. Those may have an influence on the estimation of association between specific TIIC proportions and clinical outcomes.
To minimize its impact, we have included the dataset identifier as confounder in multivariate Cox regression analysis. Subgroup analysis for different histology types, gene expression profiling platforms, and cohorts was conducted and the results also suggested good consistency and robustness of our results.
Conclusion
In this study, we demonstrated the distribution of 22 immune cell subsets and their association with survival outcome in NSCLC. Our findings suggested a significant difference in the cellular composition of infiltrating immune cells in NSCLC and the difference might be associated with different prognosis for NSCLC patients. Our results also suggested that regulatory T cells and plasma might be associated with the survival in NSCLC.
Footnotes
Disclosure Statement
No competing financial interests exist.
Funding Information
This study has been supported by the National Natural Science Foundation of China (grant no.: 81703325) and the National Key R&D Program of China (grant nos.: 2017YFC0907200 and 2017YFC0907201).
Supplementary Material
Supplementary Table S1
References
Supplementary Material
Please find the following supplemental material available below.
For Open Access articles published under a Creative Commons License, all supplemental material carries the same license as the article it is associated with.
For non-Open Access articles published, all supplemental material carries a non-exclusive license, and permission requests for re-use of supplemental material or any part of supplemental material shall be sent directly to the copyright owner as specified in the copyright notice associated with the article.