
Abstract
This study aimed to construct a long noncoding RNA (lncRNA)-based prognostic signature to improve the survival prediction for endometrial cancer (EC) patients and guide individualized treatments. mRNA and miRNA sequencing and clinical data of 526 patients with EC (randomized to training or validation set, n = 263) were collected from The Cancer Genome Atlas database. Differentially expressed genes (DEGs), differentially expressed lncRNAs (DELs), and differentially expressed miRNAs (DEMs) were identified between 263 EC samples and 33 normal controls. Univariate and multivariate Cox regression analyses identified five DELs (LINC00475, LINC01352, MIR503HG, KCNMB2-AS1, and LINC01143) that were overall survival related. The Kaplan–Meier curve showed that the risk score model established by these five DELs can significantly distinguish the survival ratio of patients at high risk from those at low risk. The receiver operating characteristic curve indicated that this risk score exhibited good survival prediction performance, with the area under the curve of 0.978. In addition, this risk score was independent of other clinical factors. Stratification analysis based on two independent prognostic clinical factors (histologic grade and recurrence status) demonstrated that the high-risk score was still a poor prognostic factor for patients with histologic grade 3, recurrence or nonrecurrence status. In nomogram model, the risk score was one of the main contributions to survival rates, and its Harrell's concordance index was higher than the other two independent clinical factors, although all lower than the combined. Furthermore, mechanism analyses showed that these lncRNAs functioned by coexpressing with DEGs (i.e., LINC00475-PTGDR, LINC01352/MIR503HG-BACH2, KCNMB2-AS1-PCSK9, LINC01143-NUF2/PTTG1) or as a competing endogenous RNA of DEMs to regulate DEGs (LINC00475-miR-4728-PTGDR, MIR503HG-miR-3170-BACH2). In conclusion, our novel risk score system may be a promising prognostic biomarker to guide personalized treatment for EC patients and it can add prognostic value for current clinical system.
Introduction
Endometrial cancer (EC) is the second most common gynecological malignancy. In the United States, it was estimated that there were 63,230 new cases, and 11,350 died from this disease in 2018 (Siegel et al., 2018). In China, 63,400 new cases and 21,800 deaths were reported in 2015 (Chen et al., 2016). Treatment approaches for EC include surgery intervention, chemotherapy, radiotherapy, and hormone therapy in clinic, which should be chosen dependent on clinical staging of patients (i.e., surgery alone for early stage; combined with others for advanced stage). However, studies showed that some patients in the early stage also had higher metastasis and recurrence risks and their prognosis would be poor if only surgery was performed (Abdullah et al., 2014; Hirayama et al., 2019); patients with the same advanced stage also exhibited different responses to the same treatment (Khouri et al., 2003; Matei et al., 2019). Therefore, there is an urgent need to explore more reliable prognostic biomarkers for distinguishing high- or low-risk patients and then guiding the schedule of individualized treatments.
Increasing evidence has demonstrated that long noncoding RNAs (lncRNAs) are critical regulators for the expression of physiological and pathological-related genes and, consequentially, lead to the development of EC (Cui et al., 2018; Liu et al., 2019). For example, Chen et al. found that lncRNA TDRG1 was significantly overexpressed in EC tissues. Overexpression of TDRG1 promoted survival, invasion, and migration and inhibited apoptosis of EC cells, while opposite effects were obtained during knockdown of TDRG1. RNA binding protein immunoprecipitation (RIP) assays confirmed that TDRG1 may increase tumorigenicity by directly binding to vascular endothelial growth factor (VEGF)-A protein and upregulating it (i.e., coexpression theory) (Chen et al., 2018). Pan et al. detected that LINC01016 was upregulated in EC tissues. LINC01016 could competitively “sponging” miR-302a-3p and miR-3130-3p and then rescued the expression of miRNA downstream gene nuclear factor YA, which subsequently promoted the transcription of special AT-rich sequence-binding protein 1 (SATB1), ultimately contributing to the malignant behavior of EC cells [i.e., competing endogenous RNA (ceRNA) theory] (Pan et al., 2018). These findings suggest that lncRNAs may be potential prognostic biomarkers for EC patients. This hypothesis has been confirmed by studies on single lncRNA (Chen et al., 2017; Kong and Ren, 2018). In addition, several authors also screened and confirmed an lncRNA signature for prognosis prediction for EC based on the sequencing data in The Cancer Genome Atlas (TCGA) database: Ouyang et al. (2019) identified 7 lncRNAs as potential prognostic factors; Sun et al. (2017) selected 5 lncRNAs as optimal predictive lncRNA biomarkers of EC progression; Zhou et al. (2018) discovered a 11-lncRNA signature for survival prediction; a 4-lncRNA signature was demonstrated to have a remarkable prognostic power by Xia et al. (2019); and Xu et al. (2018) developed a nine-lncRNA signature-based risk score in the patients with EC . However, none of them has been applied in clinic because the predictive accuracy was still lower and their function was unclear.
The aim of the present study was to identify a more robust lncRNA prognostic signature for EC patients and predict their underlying functions. Compared with the studies on Sun et al. (2017) (300), Zhou et al. (2018) (301) , and Xu et al. (2018)(408) , the sample size (526) of our study was larger. Only coexpression (Ouyang et al., 2019) or ceRNA network (Xia et al., 2019) was considered to reveal the function of lncRNAs, and the survival association of interacted mRNAs or miRNAs was not given attention previously, which was all overcome in our study. Therefore, our study may provide a more effective, function-clear lncRNA prognostic signature for EC patients.
Materials and Methods
Patient datasets
The mRNA (including lncRNA)- and miRNA-sequencing data and corresponding clinical data of EC were obtained from TCGA database portal on May 25, 2019. The RNA sequencing platform was the Illumina HiSeq 2000 RNA Sequencing. The downloaded RNA and miRNA sequencing dataset contained 583 and 575 samples, respectively. After comparison of the ID and clinical data, 559 mRNA- and miRNA- matched samples (including 526 EC and 33 normal tissues) with prognostic information were selected. These 526 patients were randomly assigned to a training set (n = 263) and a validation set (n = 263). Their clinical characteristics are shown in Table 1.
The Clinical Features of Endometrial Cancer Patients
SD, standard deviation.
Differential expression analyses
The lncRNA and mRNA genes in RNA-sequencing data were annotated according to the HUGO Gene Nomenclature Committee (HGNC), which includes 4,313 lncRNAs, 19,197 protein coding genes, and 1,914 miRNAs (Povey et al., 2001). Analysis of differentially expressed genes (DEGs), lncRNAs (DELs), and miRNAs (DEMs) between tumor tissues of training set and normal tissues was performed using the Linear Models for Microarray Data (LIMMA) method (version 3.34.7) (Ritchie et al., 2015) in the Bioconductor R package (version 3.4.1). Thresholds of DEGs, DELs, and DEMs were set as false discovery rate <0.05 and |logFC (fold change)| > 1. A hierarchical clustering heatmap was created for all differentially expressed RNAs using pheatmap R package (version: 1.0.8;
Association of DEGs, DELs, and DEMs with patient prognosis
Univariate Cox regression analysis implemented in “survival” package (version 2.41-1) was performed to screen overall survival (OS)-related DEGs, DELs, and DEMs in the training set using the survival package (version 2.41-1;
Construction of a prognostic lncRNA signature
A multivariate Cox hazard model analysis was carried out for lncRNAs significantly associated with OS in univariate Cox regression analysis to further identify independent lncRNAs with the best prognostic efficacy. Then, an lncRNA-based prognostic risk model was established according to the following formula:
Where ExplncRNA indicated the expression value of DELs, and βlncRNA indicated the regression coefficient for the DELs in multivariate Cox hazard model analysis.
Assessment of predictive performance of risk score model
Using the median risk score value as the cutoff point, the EC patients were divided into high-risk and low-risk groups. The OS differences between high- and low-risk groups were determined using K-M survival curves. Furthermore, the predictive accuracy of the lncRNA prognostic signature score was also evaluated by drawing the receiver operating characteristic curve and calculating the area under the curve (AUC). These analyses were performed for the training, validation, and entire datasets.
Verification of independence of risk score model
To verify that lncRNA signature was an independent prognostic factor, univariate Cox regression and multivariate Cox regression were performed along with several clinical variables, such as age, neoplasm histologic grade, hypertension, pregnancy history, Horm_therapy, Radiation therapy, targeted molecular therapy, and tumor recurrence in each dataset. In addition, the independent prognostic clinical factors obtained in all datasets after multivariate Cox regression analysis were also stratified into low- and high-risk groups based on the risk score, and K-M curves were plotted for each subgroup.
Nomogram development
To precisely predict the 3- and 5-year OS of EC patients, a prognostic nomogram (Iasonos et al., 2008) was developed using the “rms” package (version 5.1–2) in R based on all independent prognostic factors selected by the multivariable Cox regression analysis. Calibration curves were used to compare the concordance between nomogram-predicted survival and actually observed survival by K-M analysis, with the 45° line as the best prediction. Furthermore, the prognostic capacity of the nomogram was assessed by calculating the Harrell's concordance index (C-index). The value of the C-index ranged from 0.5 (random chance) to 1.0 (perfect predictive accuracy). Generally, C-index >0.7 indicated acceptable discrimination accuracy for prognosis.
Establishment of lncRNA coexpression and ceRNA networks
To identify the survival-associated coexpression or ceRNA network, the DEGs or DEMs that were demonstrated to be significantly related with OS in univariate Cox regression analysis were used for the following analyses. All the networks were visualized using Cytoscape (version 3.6.1;
The coexpression relationships between signature DELs and DEGs were evaluated by Pearson correlation coefficients (PCCs), which were calculated using tcor.test function in R. Only the lncRNA-mRNA coexpression pairs with |PCC| > 0.4 were used for establishing the coexpression network.
The ceRNA network was established based on the interactions between DELs and DEMs, which were retrieved from DIANA-LncBase (version 2.0) (Paraskevopoulou et al., 2013) database and the interactions between DEMs and DEGs, which were predicted from the starBase database (version 2.0) (Yang et al., 2011). Only the DEL-DEM and DEM-DEG interactors that exhibited opposite expression trend were included to the ceRNA network.
Function enrichment analysis
Gene ontology (GO) biological process (BP) terms and Kyoto Encyclopedia of Genes and Genomes (KEGG) pathway enrichment analyses were performed using Enrichr online tool (Kuleshov et al., 2016) and the Database for Annotation, Visualization and Integrated Discovery (DAVID) (version 6.8) (Huang et al., 2009) to explore the underlying functions of DEGs. A p-value <0.05 was considered statistically significant.
Results
Differential expression analysis
A total of 14,601 mRNAs, 650 lncRNAs, and 460 miRNAs were annotated based on HGNC. Using the LIMMA method and corresponding threshold, 963 differentially expressed RNAs were identified between the EC tissues and normal controls in the training set (Fig. 1A), among which 841 were DEGs (367 downregulated; 474 upregulated), 52 were DELs (22 downregulated; 30 upregulated), and 70 were DEMs (5 downregulated; 65 upregulated) (Fig. 1B) (Supplementary Table S1). The heat map showed that these differentially expressed RNAs can obviously classify the samples into two groups (Fig. 1C).
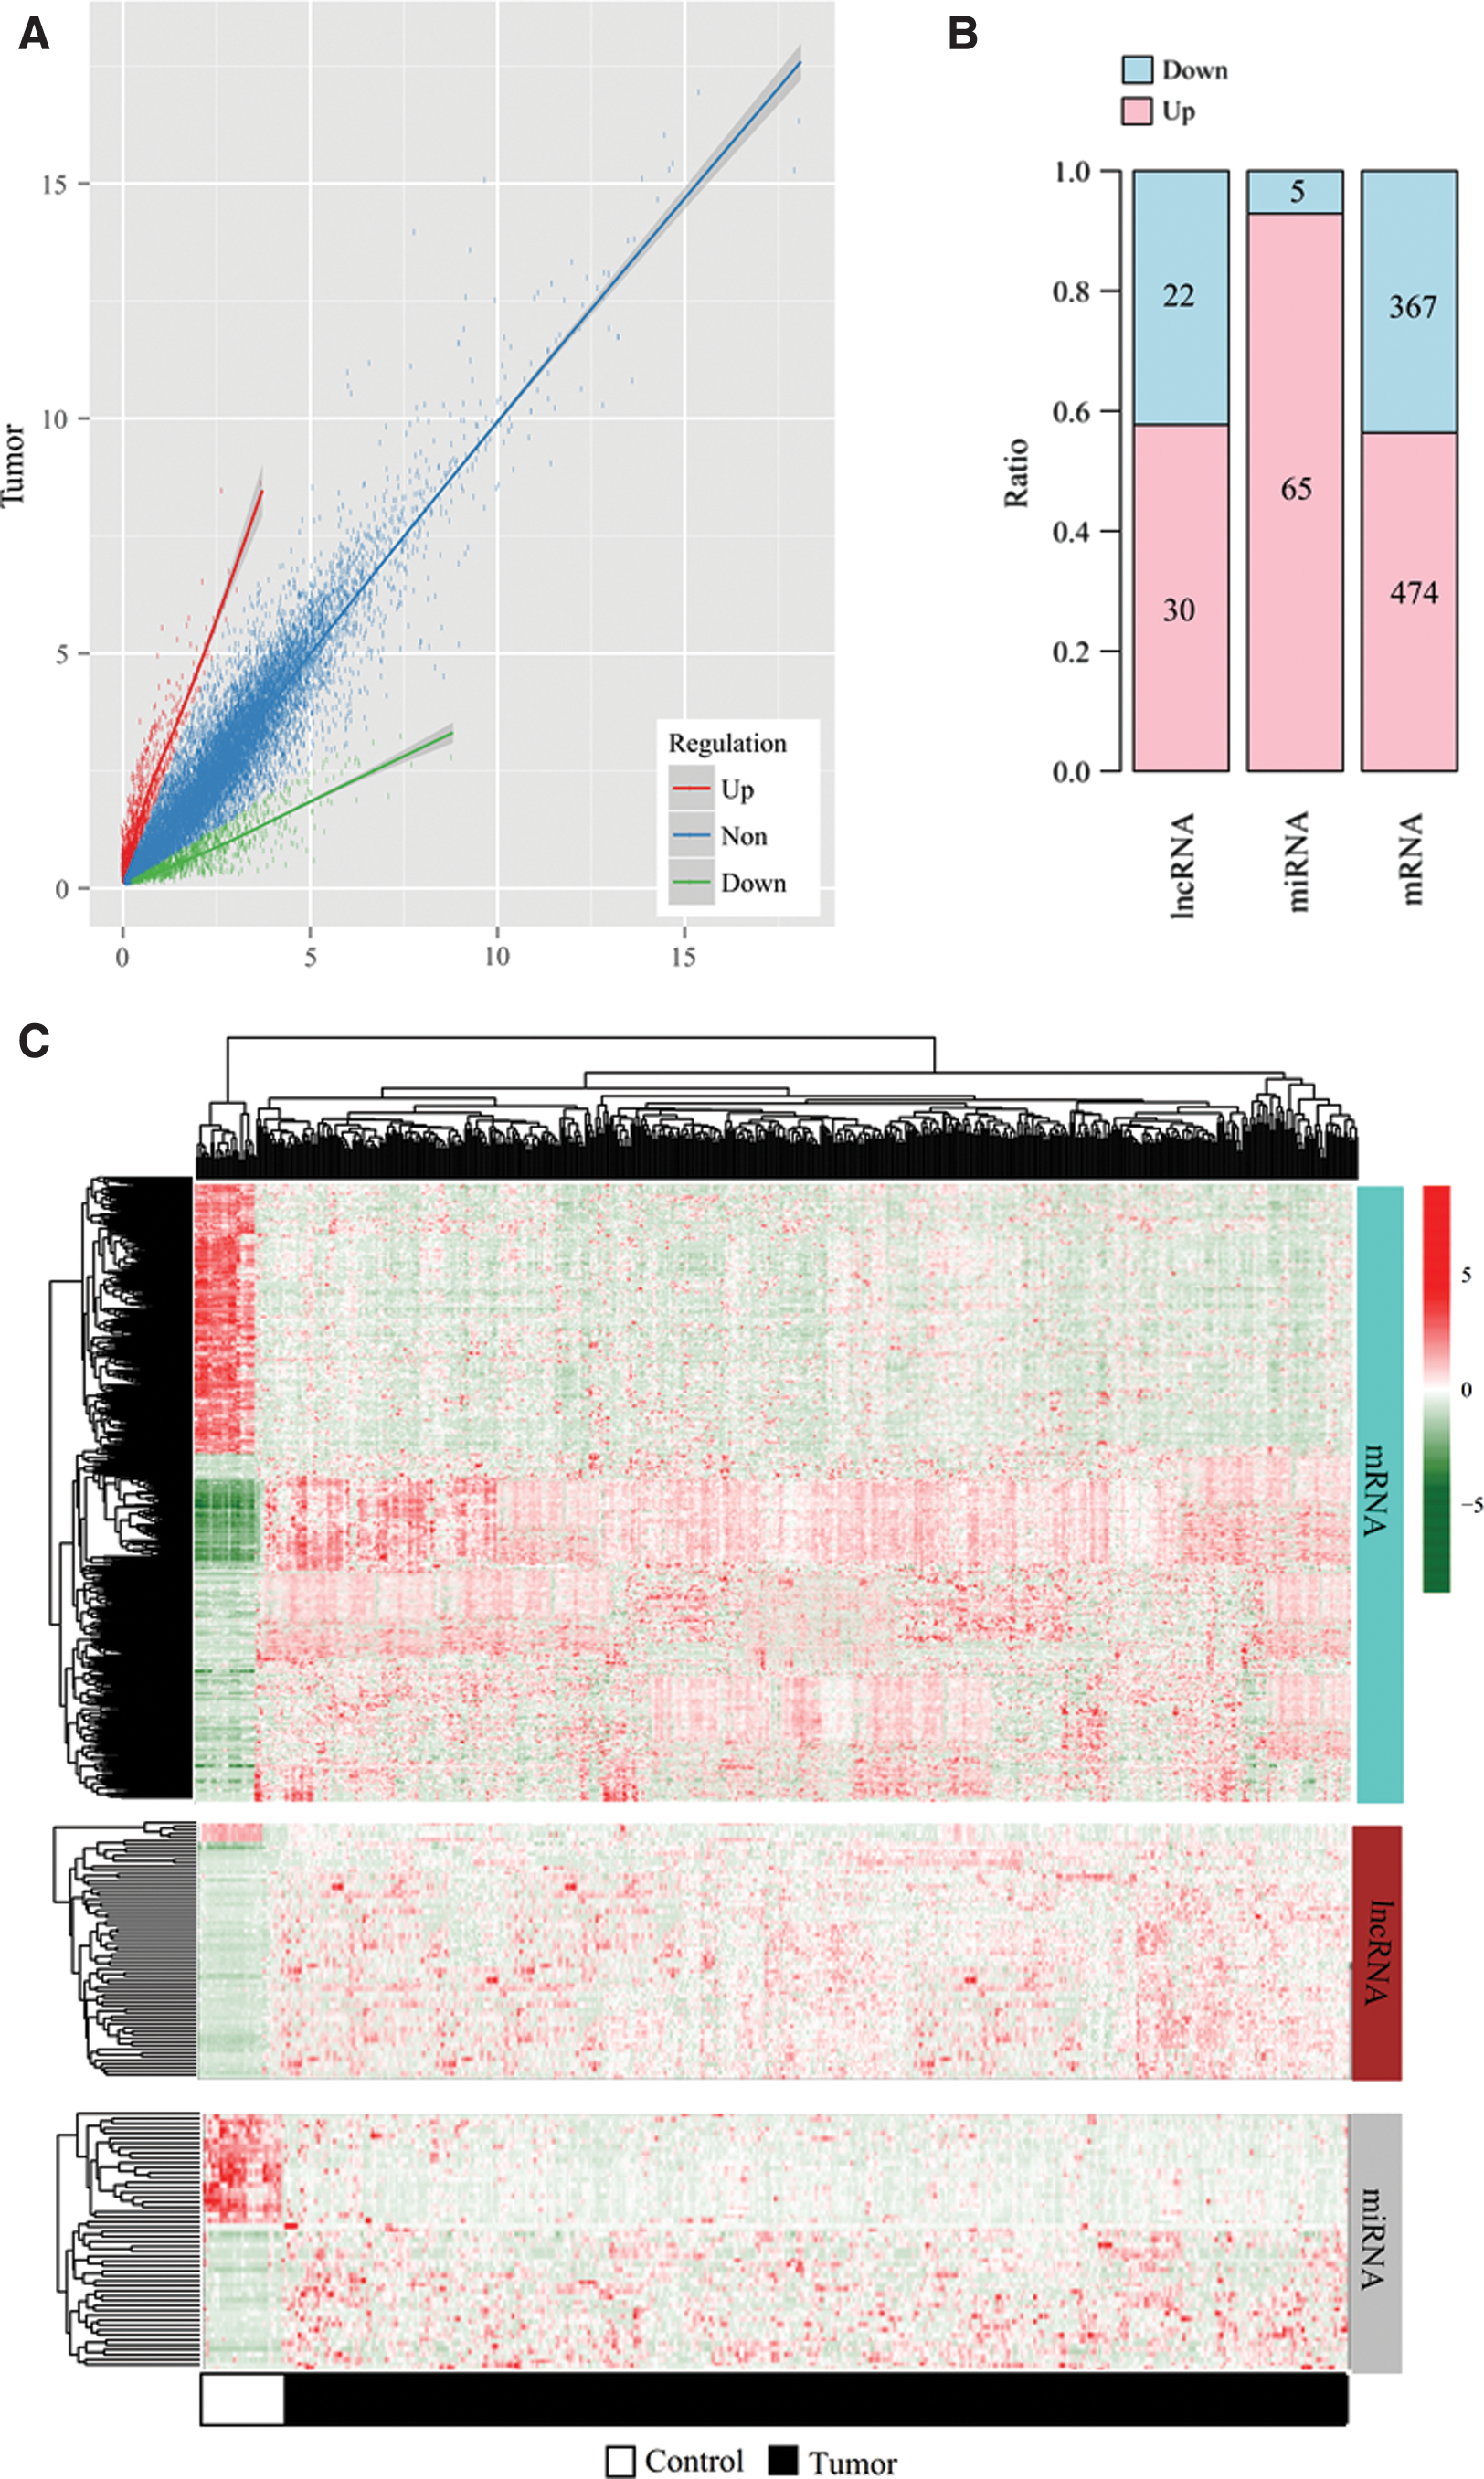
Differentially expressed RNAs.
Construction of lncRNA prognostic signature for OS
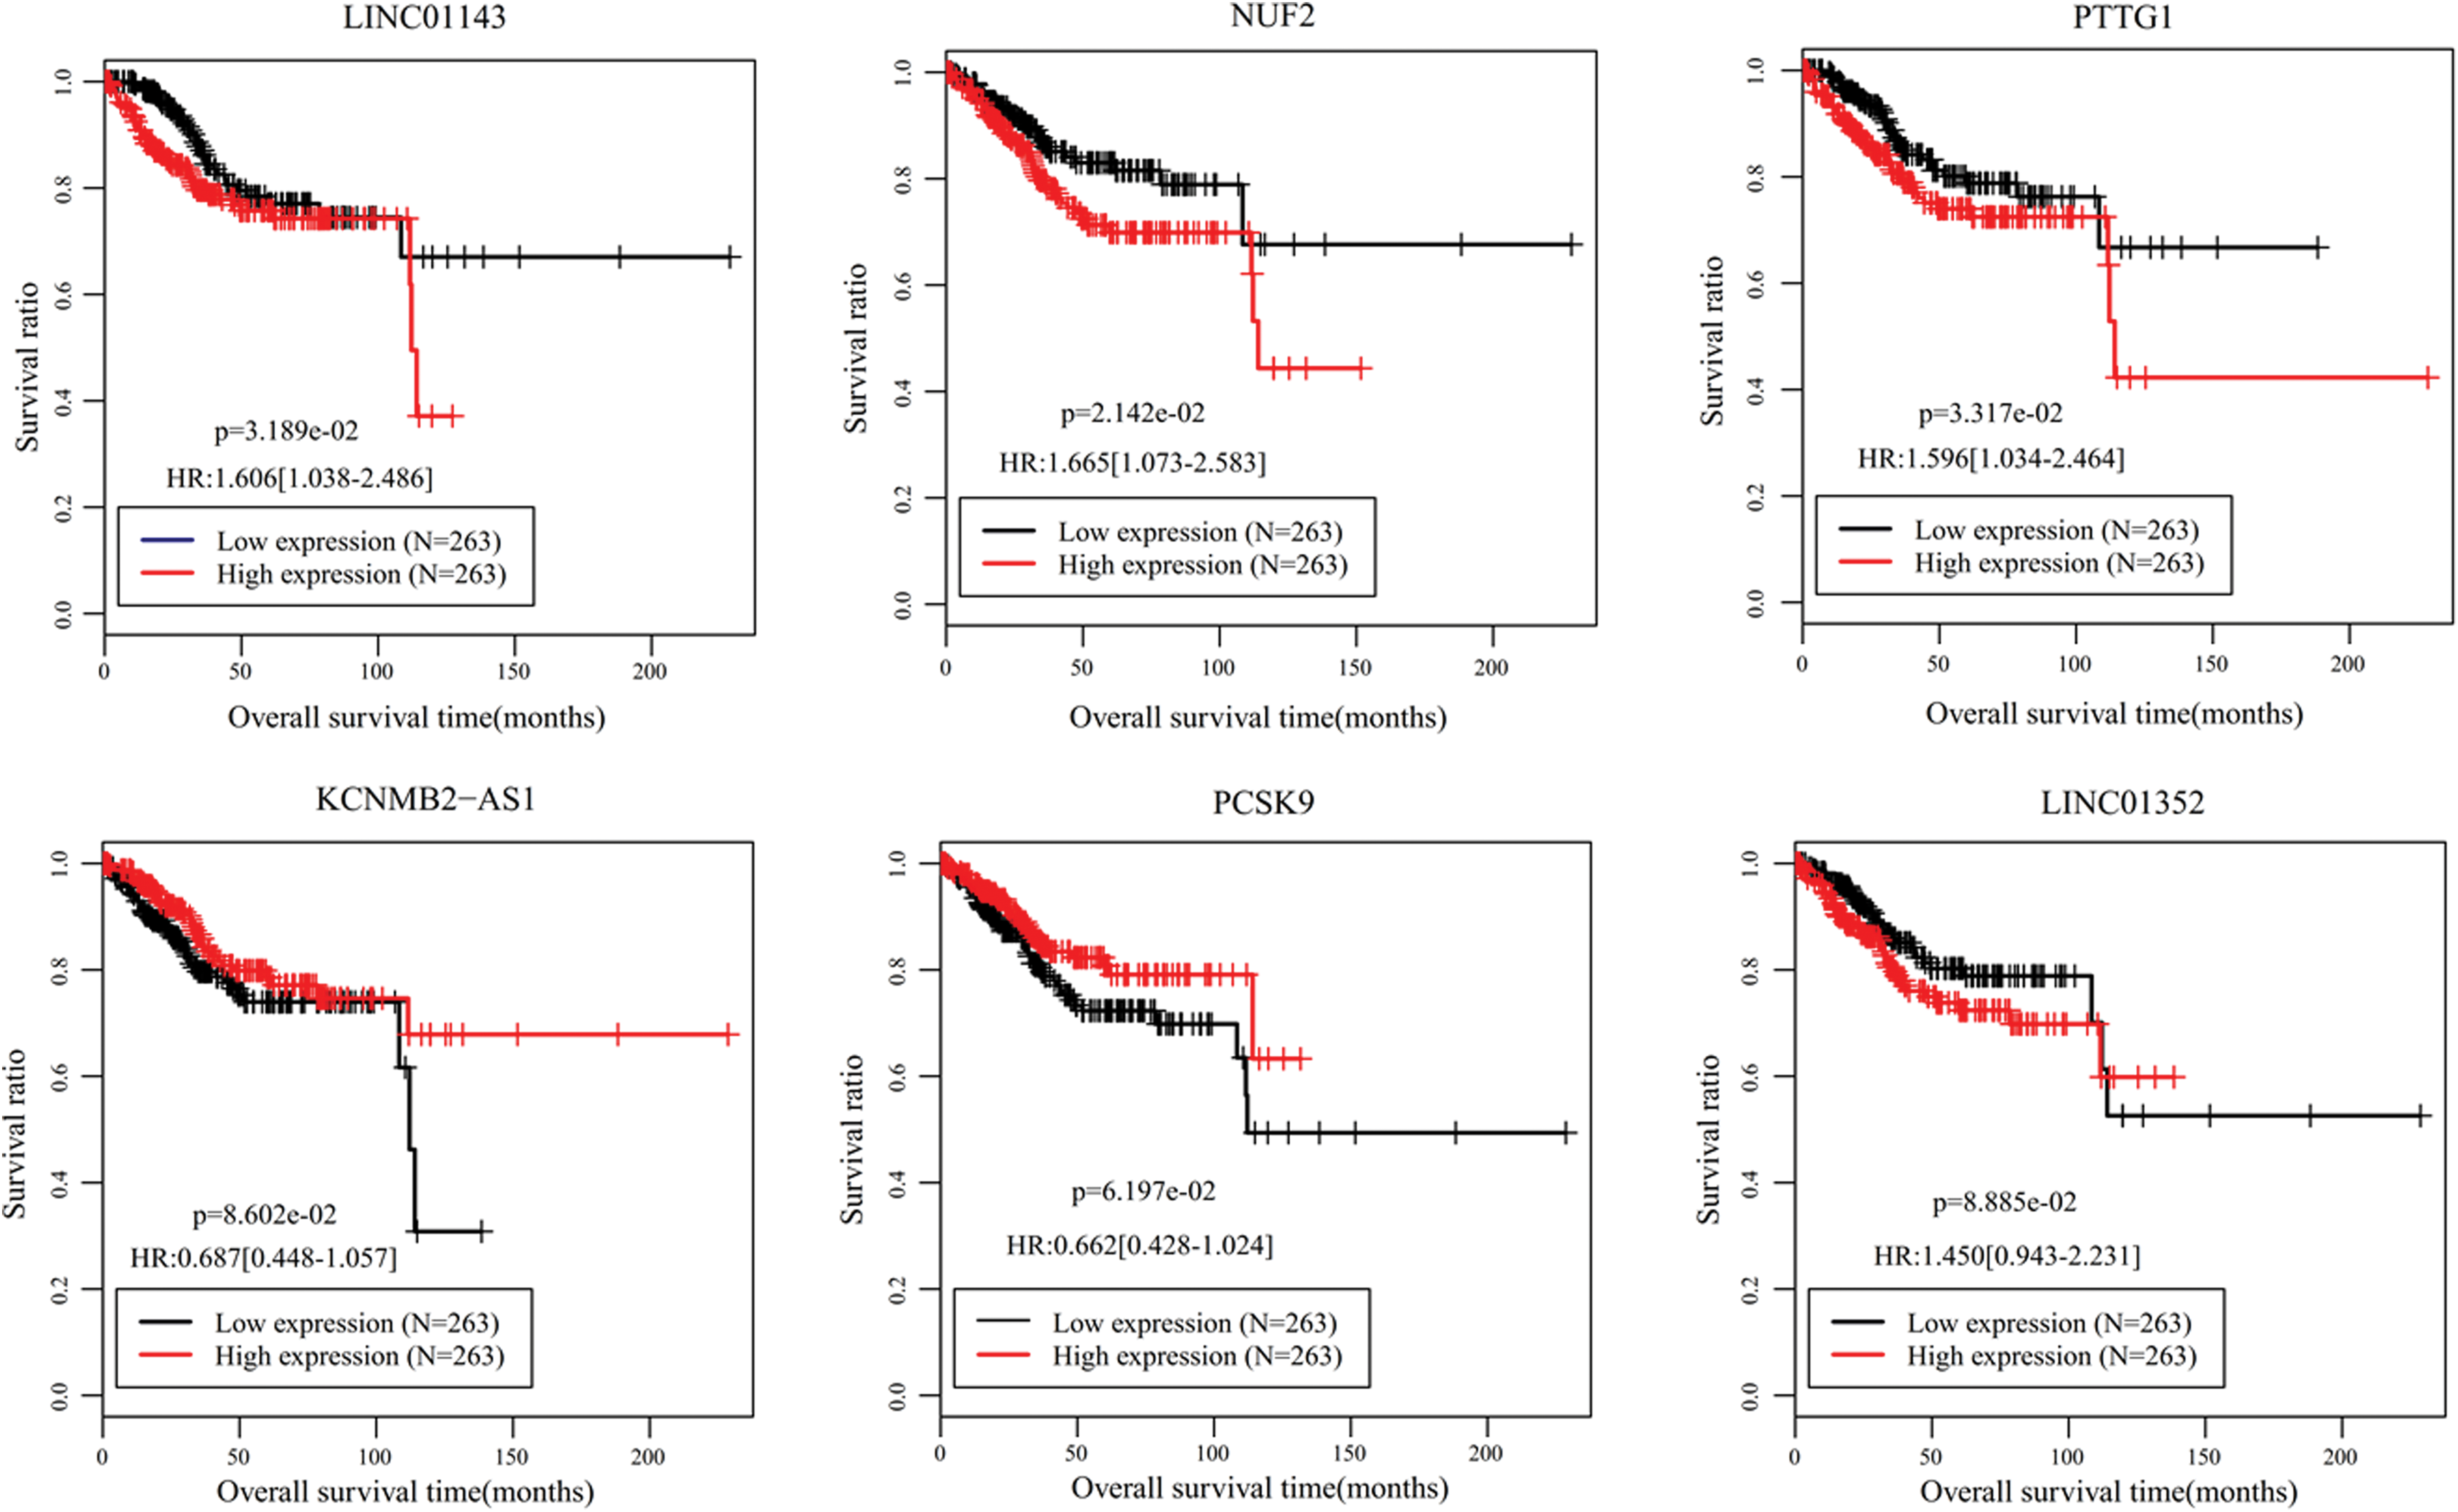
Univariate Cox regression analysis identified 24 DELs that were significantly associated with OS (Supplementary Table S2). Subsequently, multivariate Cox regression analysis was performed using these 24 DELs to further screen independent predictive biomarkers. As a result, five of them (downregulated: LINC00475, LINC01352, MIR503HG; upregulated: KCNMB2-AS1 and LINC01143) were extracted. As shown in Table 2, LINC01352, MIR503HG, and LINC01143 had positive coefficients and hazard ratio (HR) >1, which indicated that higher expression levels of these lncRNAs were associated with shorter OS, while LINC00475 and KCNMB2-AS1 may be protective factors due to negative coefficients and HR <1 (i.e., higher expression level of these lncRNAs predicted better OS). In addition, the multivariate results were in line with the univariate results (Table 2) and K-M analysis (Fig. 2).

K-M survival curves for five OS-associated lncRNAs and their coexpression or competing endogenous RNA-related miRNAs and mRNAs. K-M, Kaplan–Meier; OS, overall survival. Color images are available online.
Five Prognostic Long Noncoding RNAs in Univariate and Multivariable Cox Regression Analyses
CI, confidence interval; HR, hazard ratio.
Based on their expression values and regression coefficients, a five-lncRNA signature model was established: risk score = (−5.3620) × ExpLINC00475 + (3.0209) × ExpLINC01352 + (0.4535) × ExpMIR503HG + (−0.3773) × ExpKCNMB2-AS1 + (0.6281) × ExpLINC01143.
Validation of the prognostic prediction of this five-lncRNA signature
The patients were divided into high-risk and low-risk groups according to the median risk score. The K-M survival curve results showed that the survival ratio was significantly separated between the high-risk and low-risk groups in the training (HR = 3.12, 95% confidence interval [CI] = 1.60–6.09) (Fig. 3A), validation (HR = 2.20, 95% CI = 1.16–4.19) (Fig. 3B), and entire set (HR = 2.63, 95% CI = 1.66–4.18) (Fig. 3C), showing that EC patients with high-risk scores had significantly poorer OS compared with patients with lower risk scores. The AUC of this five-lncRNA signature was 0.984 (Fig. 3D), 0.970 (Fig. 3E), and 0.978 (Fig. 3F) for the training, validation, and entire set, respectively. These findings robustly supported that this five-lncRNA signature could have a promising power for predicting the prognosis of EC.

Prognosis performance assessment of a five-lncRNA signature.
Independence of six-lncRNA signature for survival prediction
Univariate and multivariate Cox regression analyses were performed to evaluate whether this five-lncRNA prognostic model was an independent predictive factor after adjustment for other clinical characteristics. The results showed that this five-lncRNA signature risk score was significant in the univariate and multivariate Cox regression analysis results regardless of any dataset (Table 3). Furthermore, in the multivariate analysis, neoplasm histologic grade and tumor recurrence were also independent prognostic factors in three datasets, with higher grade and recurrence status having poor prognosis (Table 3; Fig. 4). To confirm whether the risk score adds prognostic value to the clinical system, stratification analysis was also performed for these two significant variables using the entire set. K-M survival analysis indicated that for patients with histologic grade 3, significant longer OS was still observed in low-risk group compared with that in the high-risk group (p = 4.454E-03) (Fig. 5A); but for patients with histologic grade 1 and 2, no significant difference was present (p = 1.776E-01), although the OS time of patients in the high risk group was slightly shorter compared with patients in the low risk group (Fig. 5B), which may be due to the small sample size. The K-M survival analysis stratified by recurrence showed that the risk factor can distinguish the OS time between high and low risk groups both in recurrence (p = 2.734E-02) (Fig. 5C) and nonrecurrence status (p = 1.255E-02) (Fig. 5D).
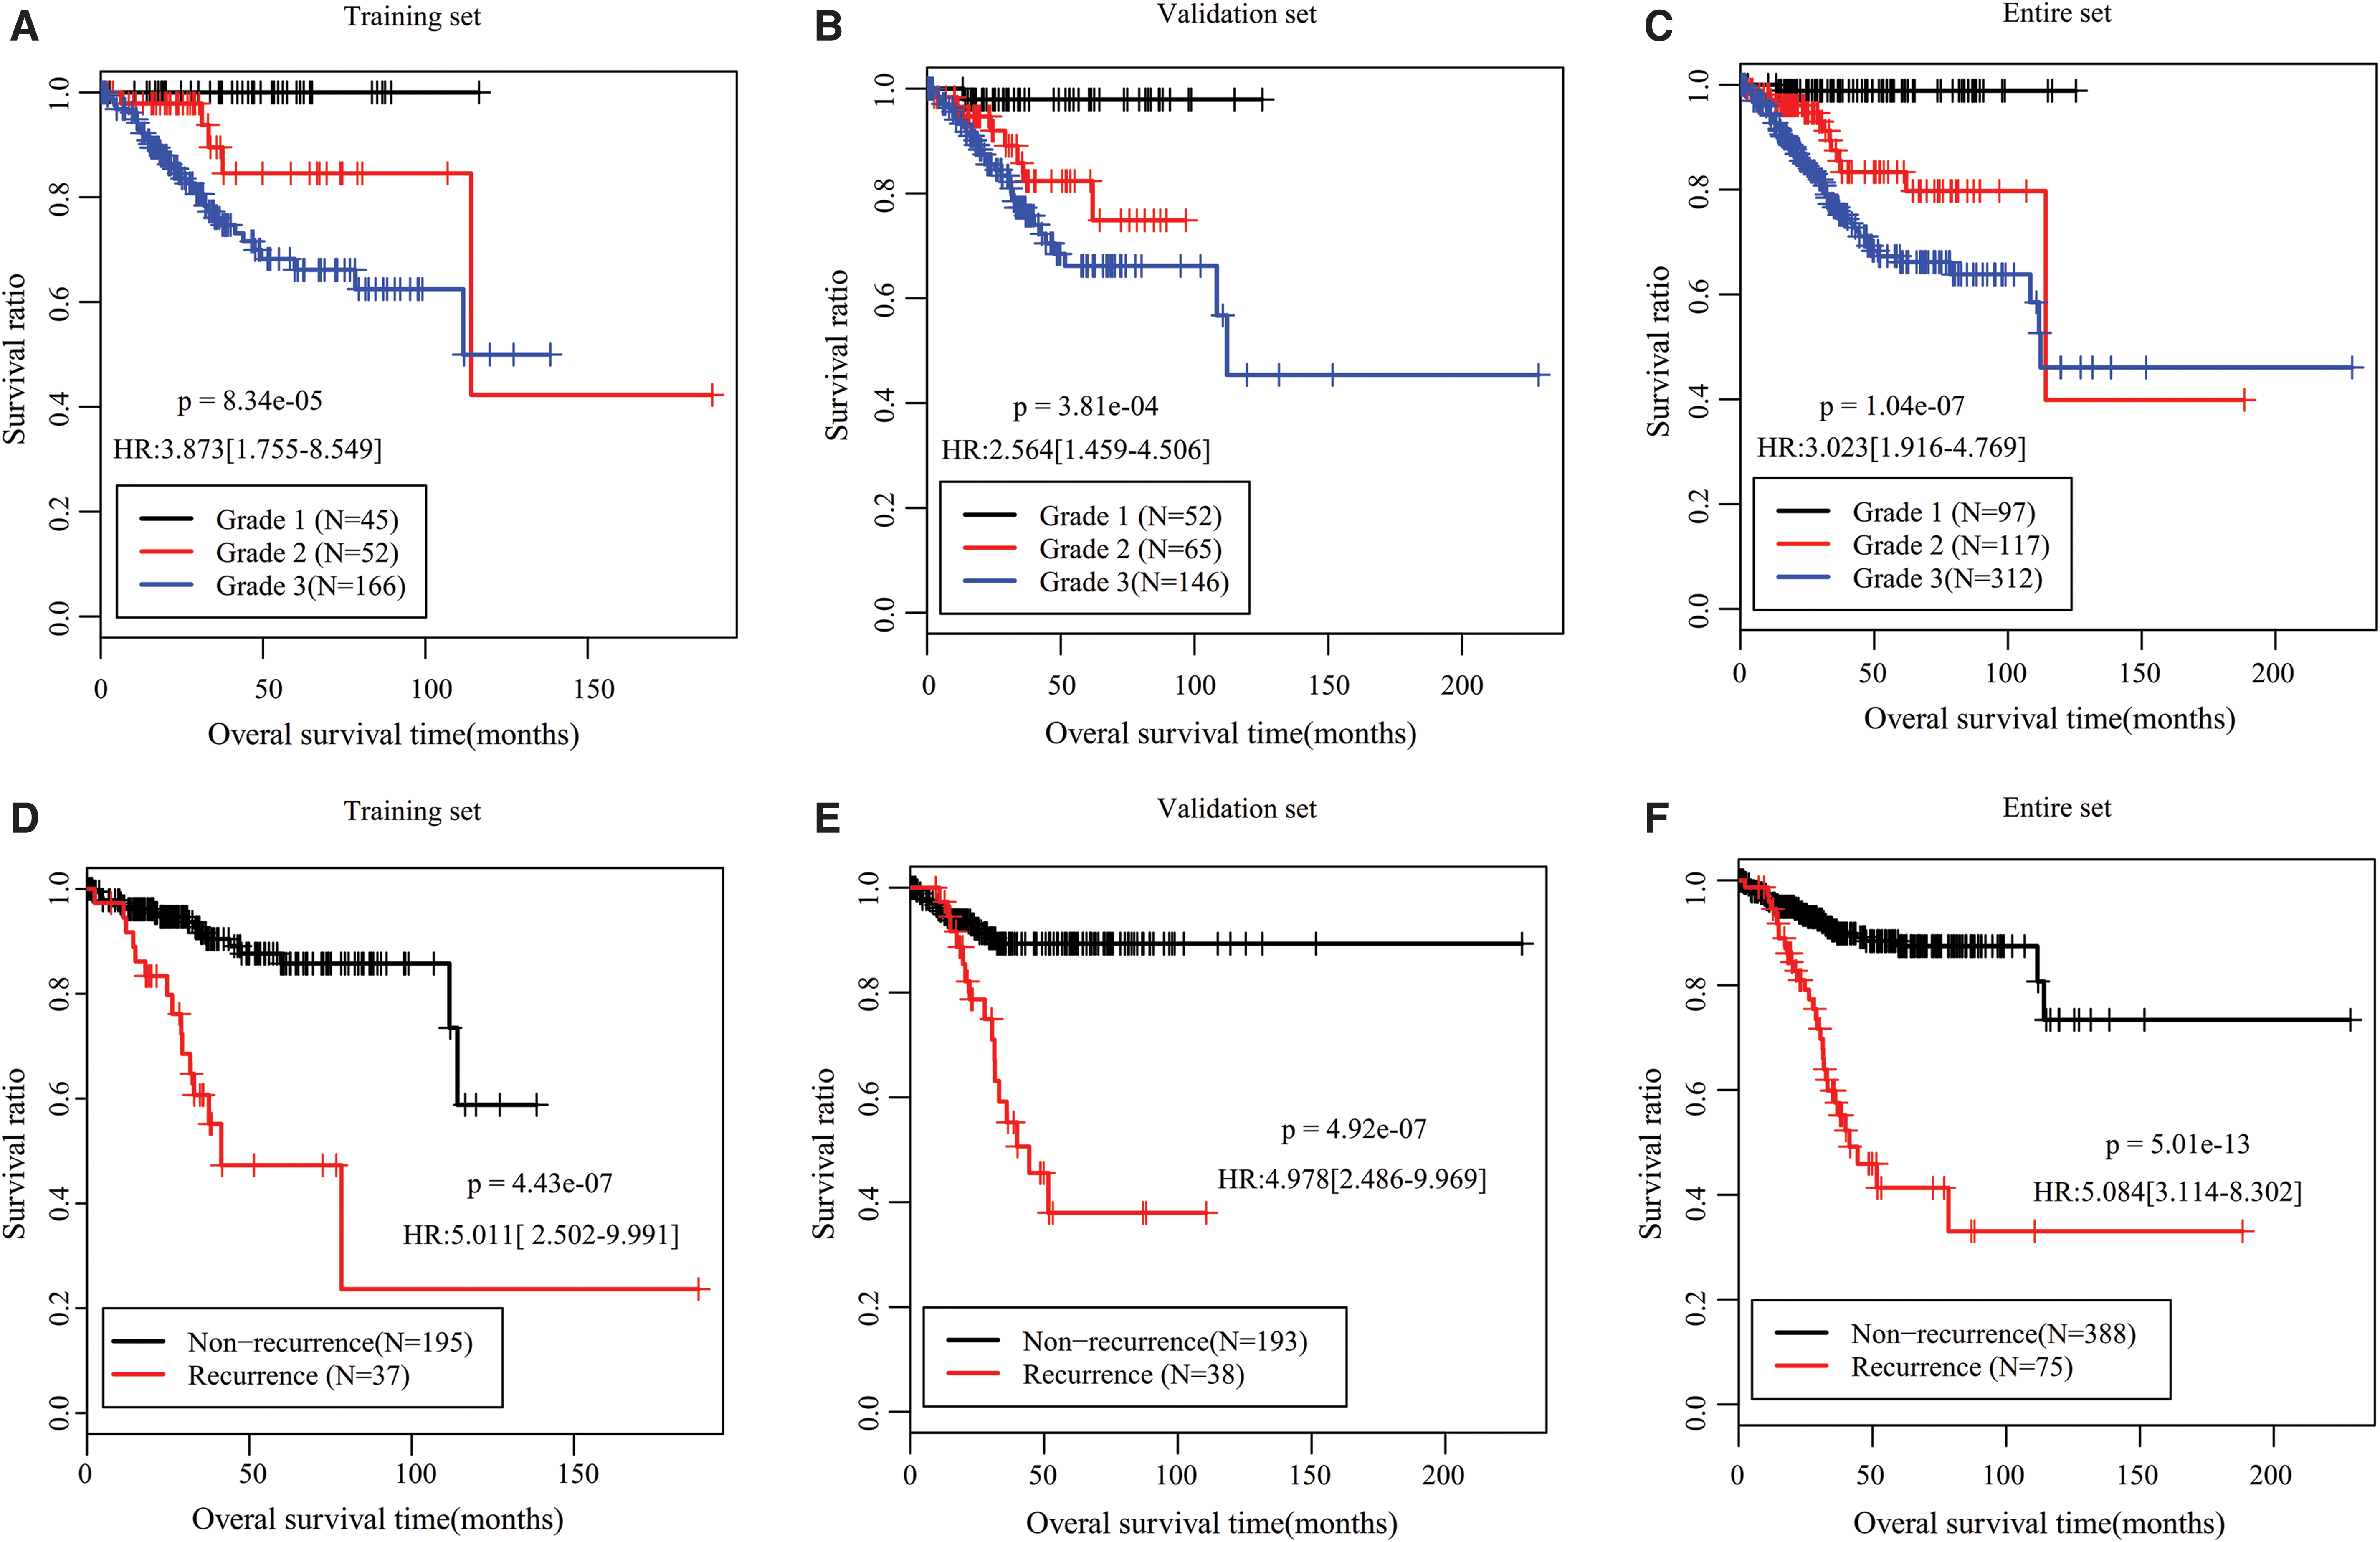
K-M survival curves for OS of patients with different tumor grade (G1, G2, or G3) or recurrence status (yes or no) in the training

Stratification analysis according to histologic grade and tumor recurrence status.
Univariate and Multivariable Cox Regression Analyses
Bold indicates statistical significance (p < 0.05).
Nomogram analysis
To construct a more sensitive predictive tool in clinical practice, a nomogram model was built by integrating the risk score of this five-lncRNA and two independent clinical risk factors (histologic grade and tumor recurrence). Figure 6A revealed that the five-miRNA signature and histologic grade may be the main contributions to 3- and 5-year survival rates, followed by recurrence. According to the calibration plot, the prediction on 3- or 5-year survival probability of patients with EC provided by the nomogram was consistent with the actual observation (Fig. 6B). The Harrell's C-index for 3- and 5-year OS prediction of the nomogram was, respectively, 0.768 and 0.751, which further indicated favorable discrimination performance. More importantly, the C-index of risk score alone was also relatively higher compared with histologic grade (3 year: 0.695 vs. 0.613; 5 year: 0.676 vs. 0.632) or tumor recurrence (3 year: 0.695 vs. 0.592; 5 year: 0.676 vs. 0.605), all of which were lower than the combined C-index.
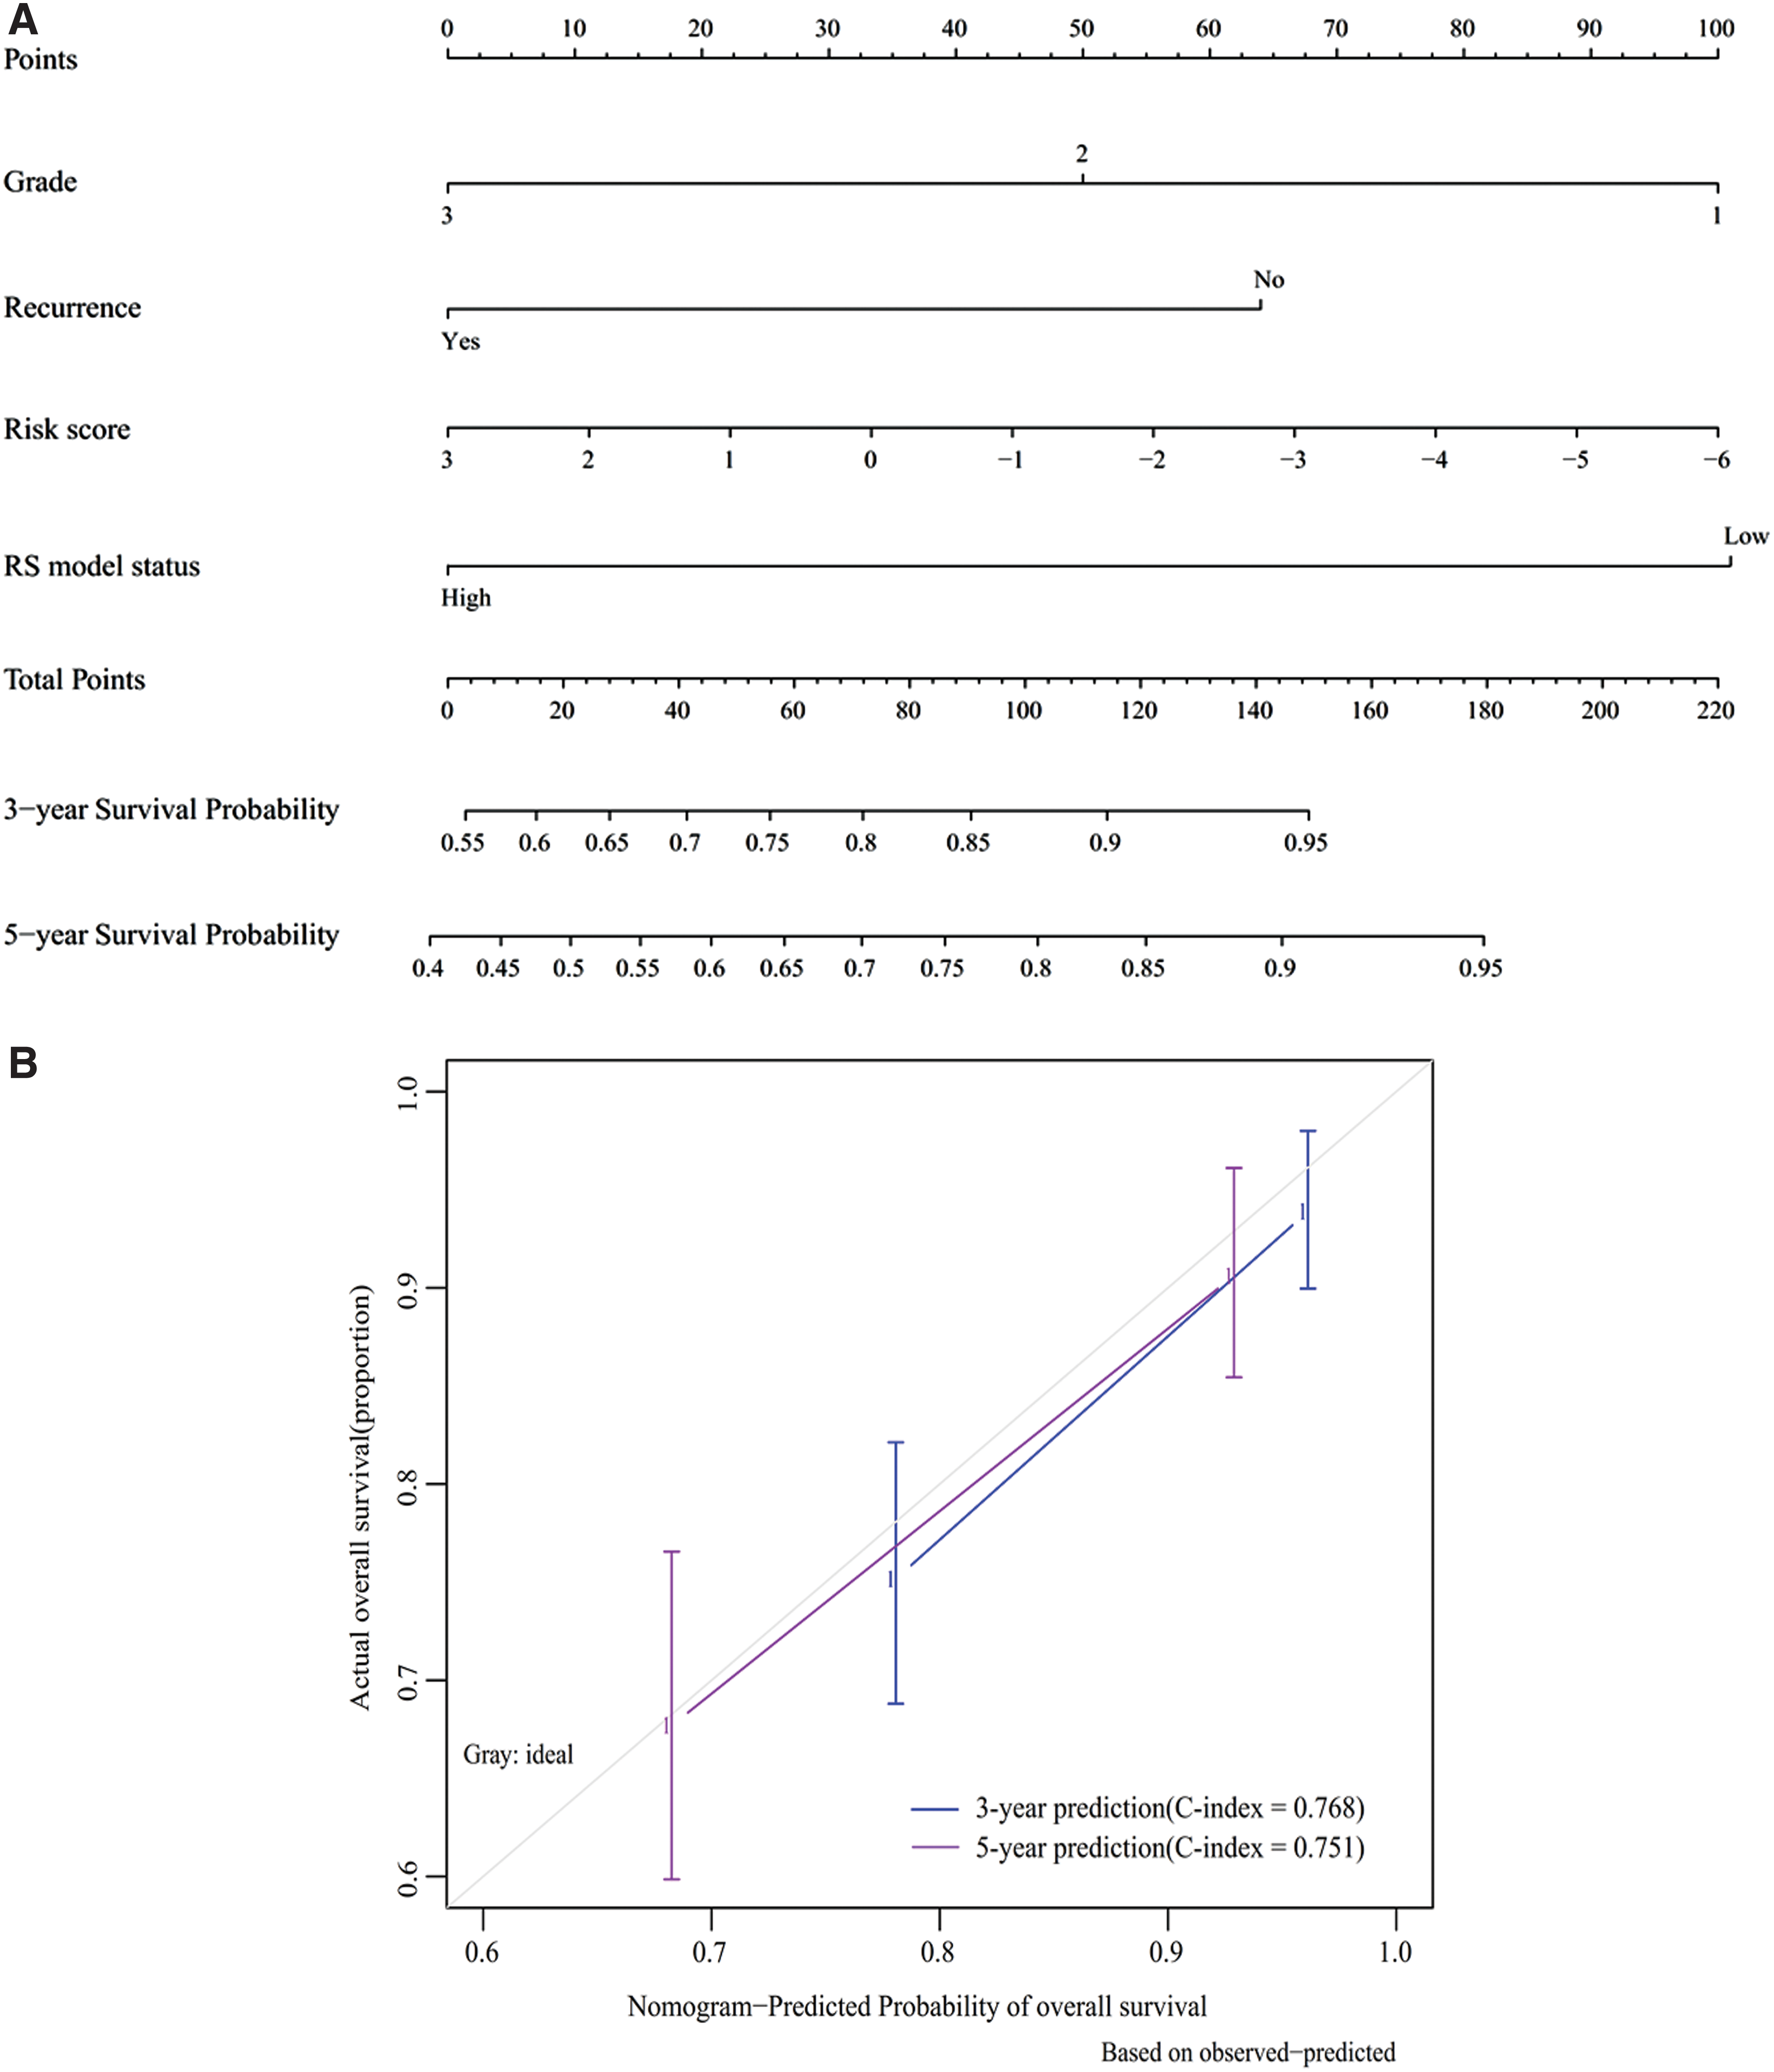
Nomogram development.
Functional analysis for lncRNA prognostic signature
To explore the underlying molecular mechanisms of these five lncRNAs, lncRNA-mRNA coexpression and lncRNA-miRNA-mRNA ceRNA networks were constructed. The interacted mRNA and miRNAs were selected from 147 DEGs and 18 DEMs that were significant prognostic factors by univariate Cox regression analysis (Supplementary Table S2).
According to the threshold value of |PCC| > 0.4, 5 signature DELs were predicted to coexpress with 145 DEGs, including 3 downregulated lncRNAs-64 downregulated DEGs (such as LINC00475-PTGDR [prostaglandin D2 receptor], PCC = 0.59; LINC01352/MIR503HG-BACH2 [BTB domain and CNC homolog 2]/TGFBR3 [tumor growth factor-β receptor 3], all PCC >0.5), as well as 2 upregulated lncRNAs-84 upregulated DEGs (such as KCNMB2-AS1-PCSK9 [Proprotein convertase subtilisin/kexin type 9] [PCC = 0.43]; LINC01143-NUF2 [NUF2 component of NDC80 kinetochore complex]/PTTG1 [Pituitary tumor transforming gene 1], all PCC >0.6). These genes constituted 442 interaction relationships and were used to construct the coexpression network (Supplementary Table S3; Fig. 7). Furthermore, 3 downregulated signature DELs (LINC00475, LINC01352, MIR503HG) were predicted to interact with 12 upregulated DEMs (hsa-miR-2277, hsa-miR-3074, hsa-miR-3136, hsa-miR-3170, hsa-miR-3619, hsa-miR-3652, hsa-miR-3664, hsa-miR-4638, hsa-miR-4728, hsa-miR-4766, hsa-miR-891a, hsa-miR-934) by the DIANA-LncBase database, which constituted 16 interaction pairs, while these 12 upregulated DEMs were also predicted to interact with 44 downregulated DEGs by starBase database to form 251 interaction pairs. These interaction pairs were integrated to construct the lncRNA ceRNA network (such as LINC00475-hsa-miR-4728-PTGDR; MIR503HG-hsa-miR-3170-BACH2) (Supplementary Table S4; Fig. 8). The crucial coexpression or ceRNA relationship pairs in these two networks were selected in consideration of the consistent prognosis trend between lncRNAs and mRNAs, but opposite between lncRNAs and miRNAs, which can be seen from Figure 2.
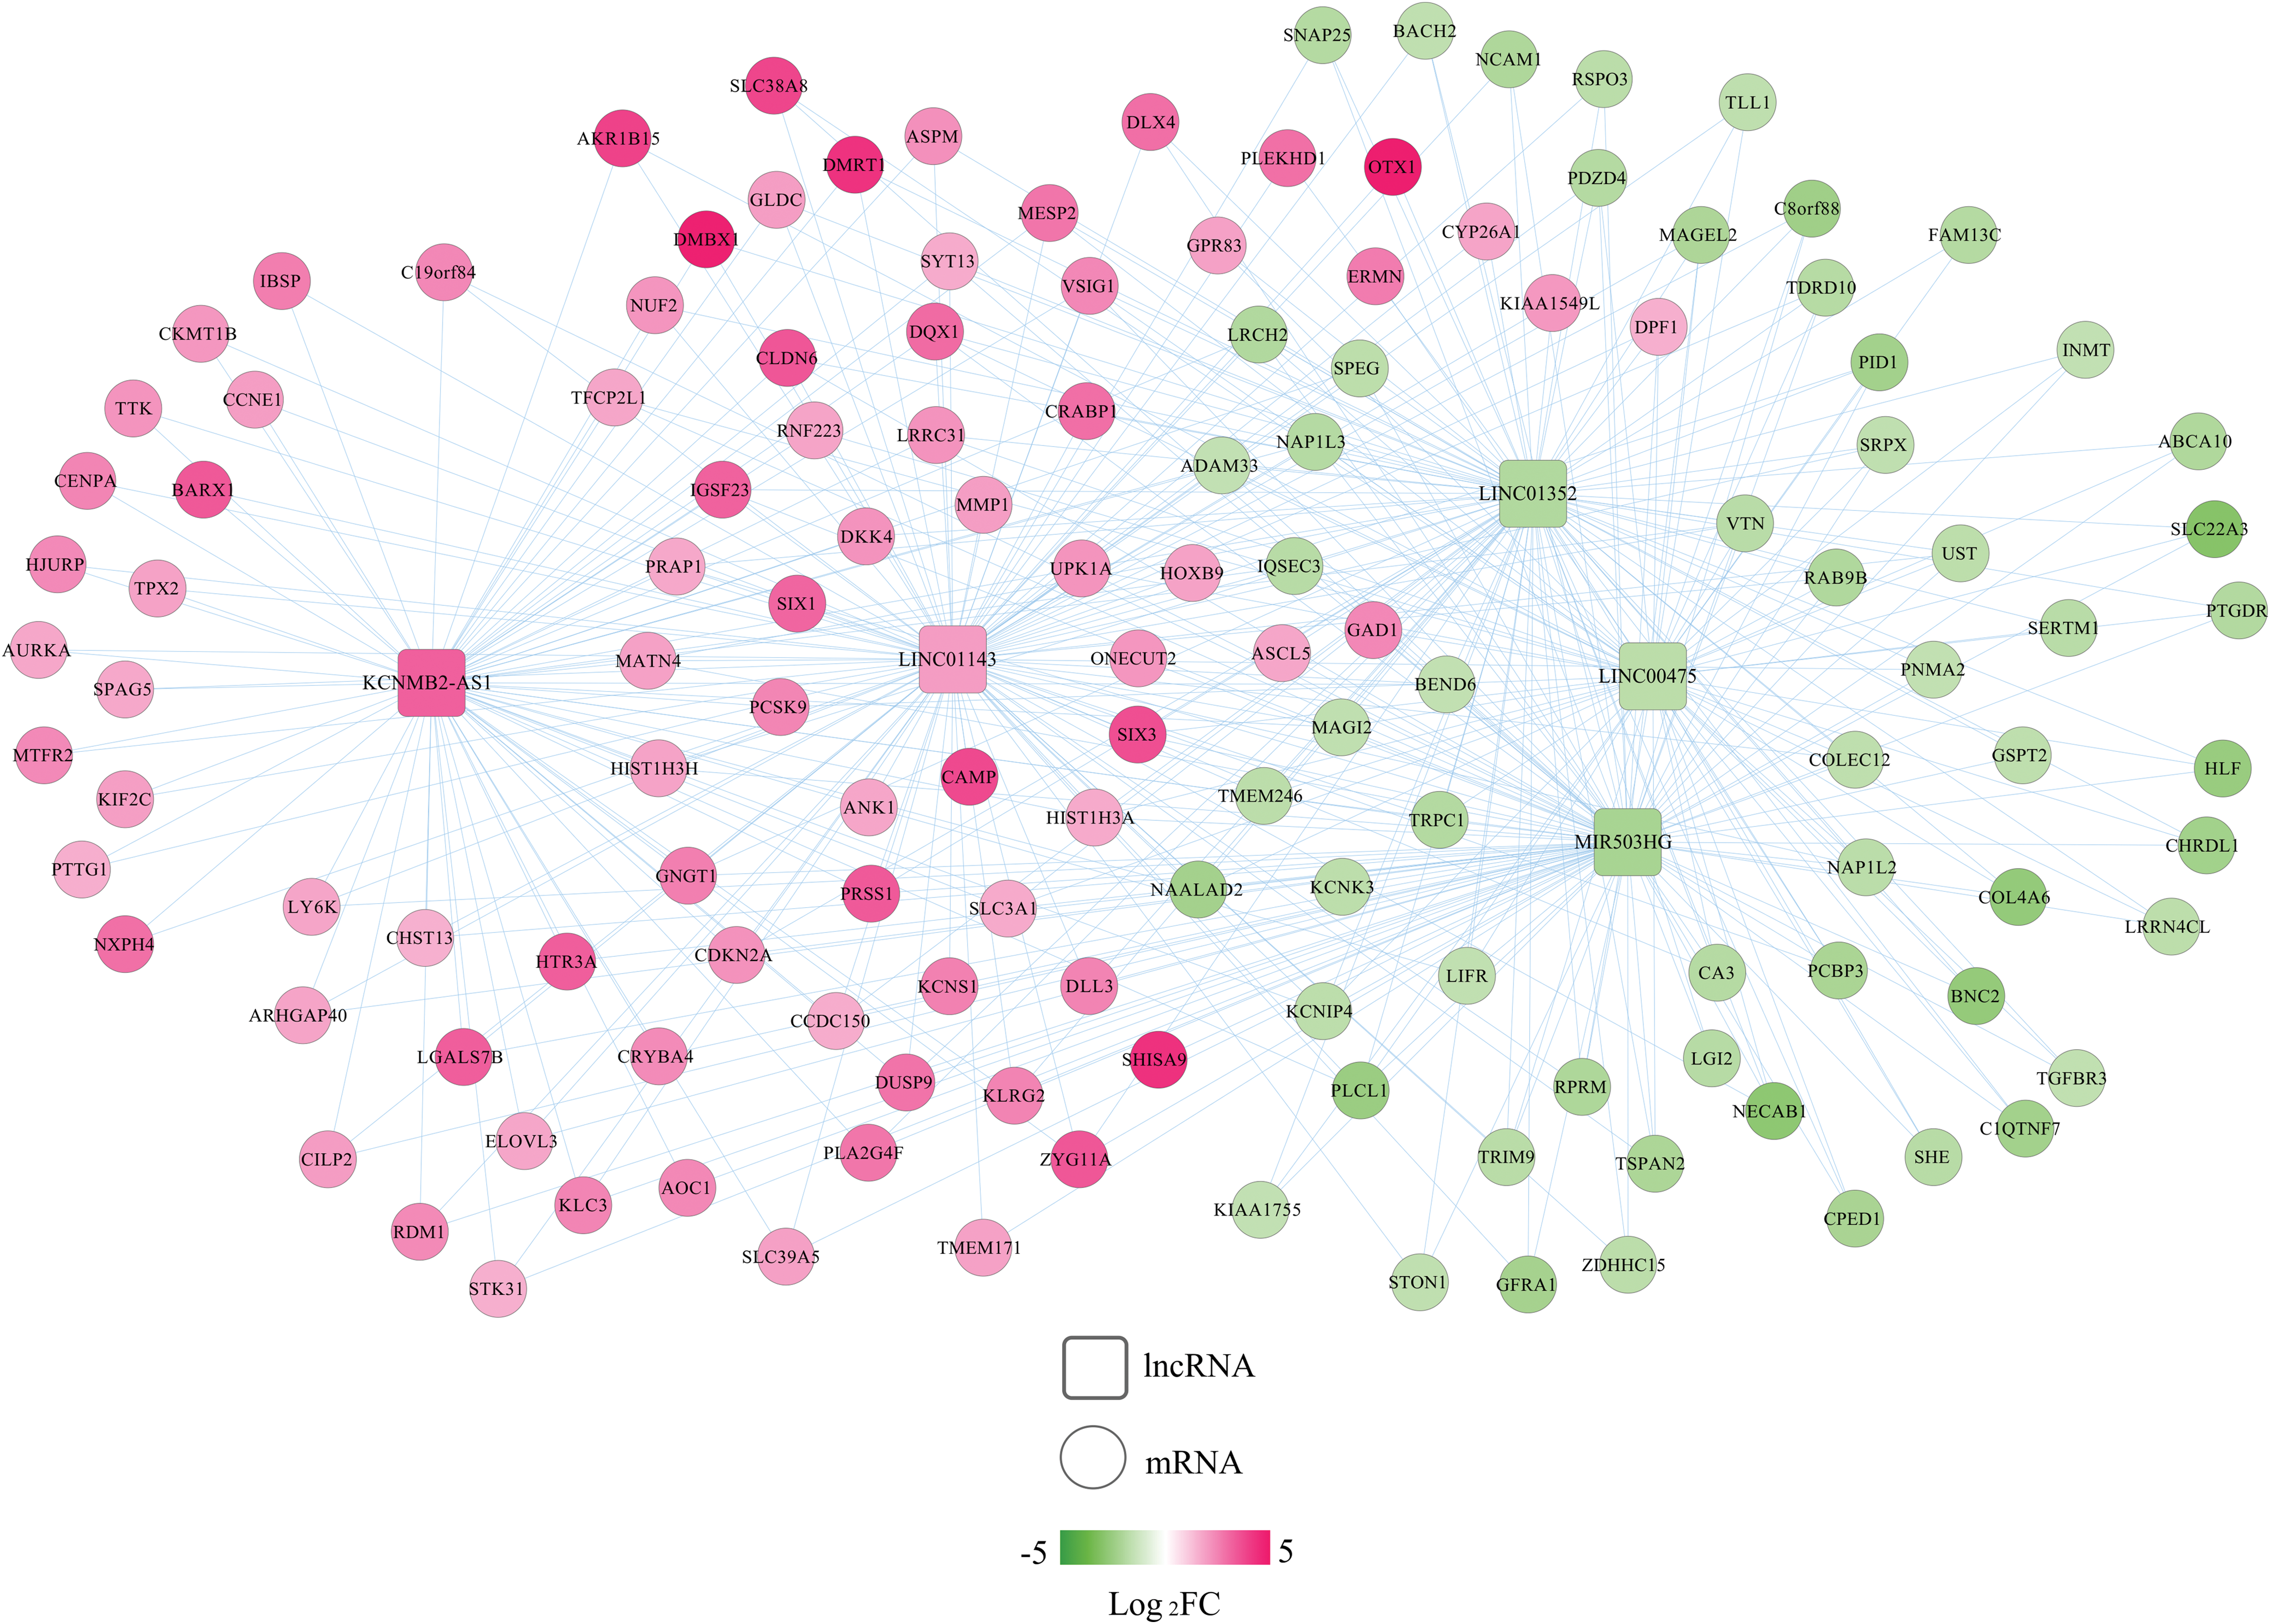
A coexpression network between DELs and DEGs. Red, upregulated; green, downregulated. Circular, DEGs; square, DELs. FC, fold change. Color images are available online.
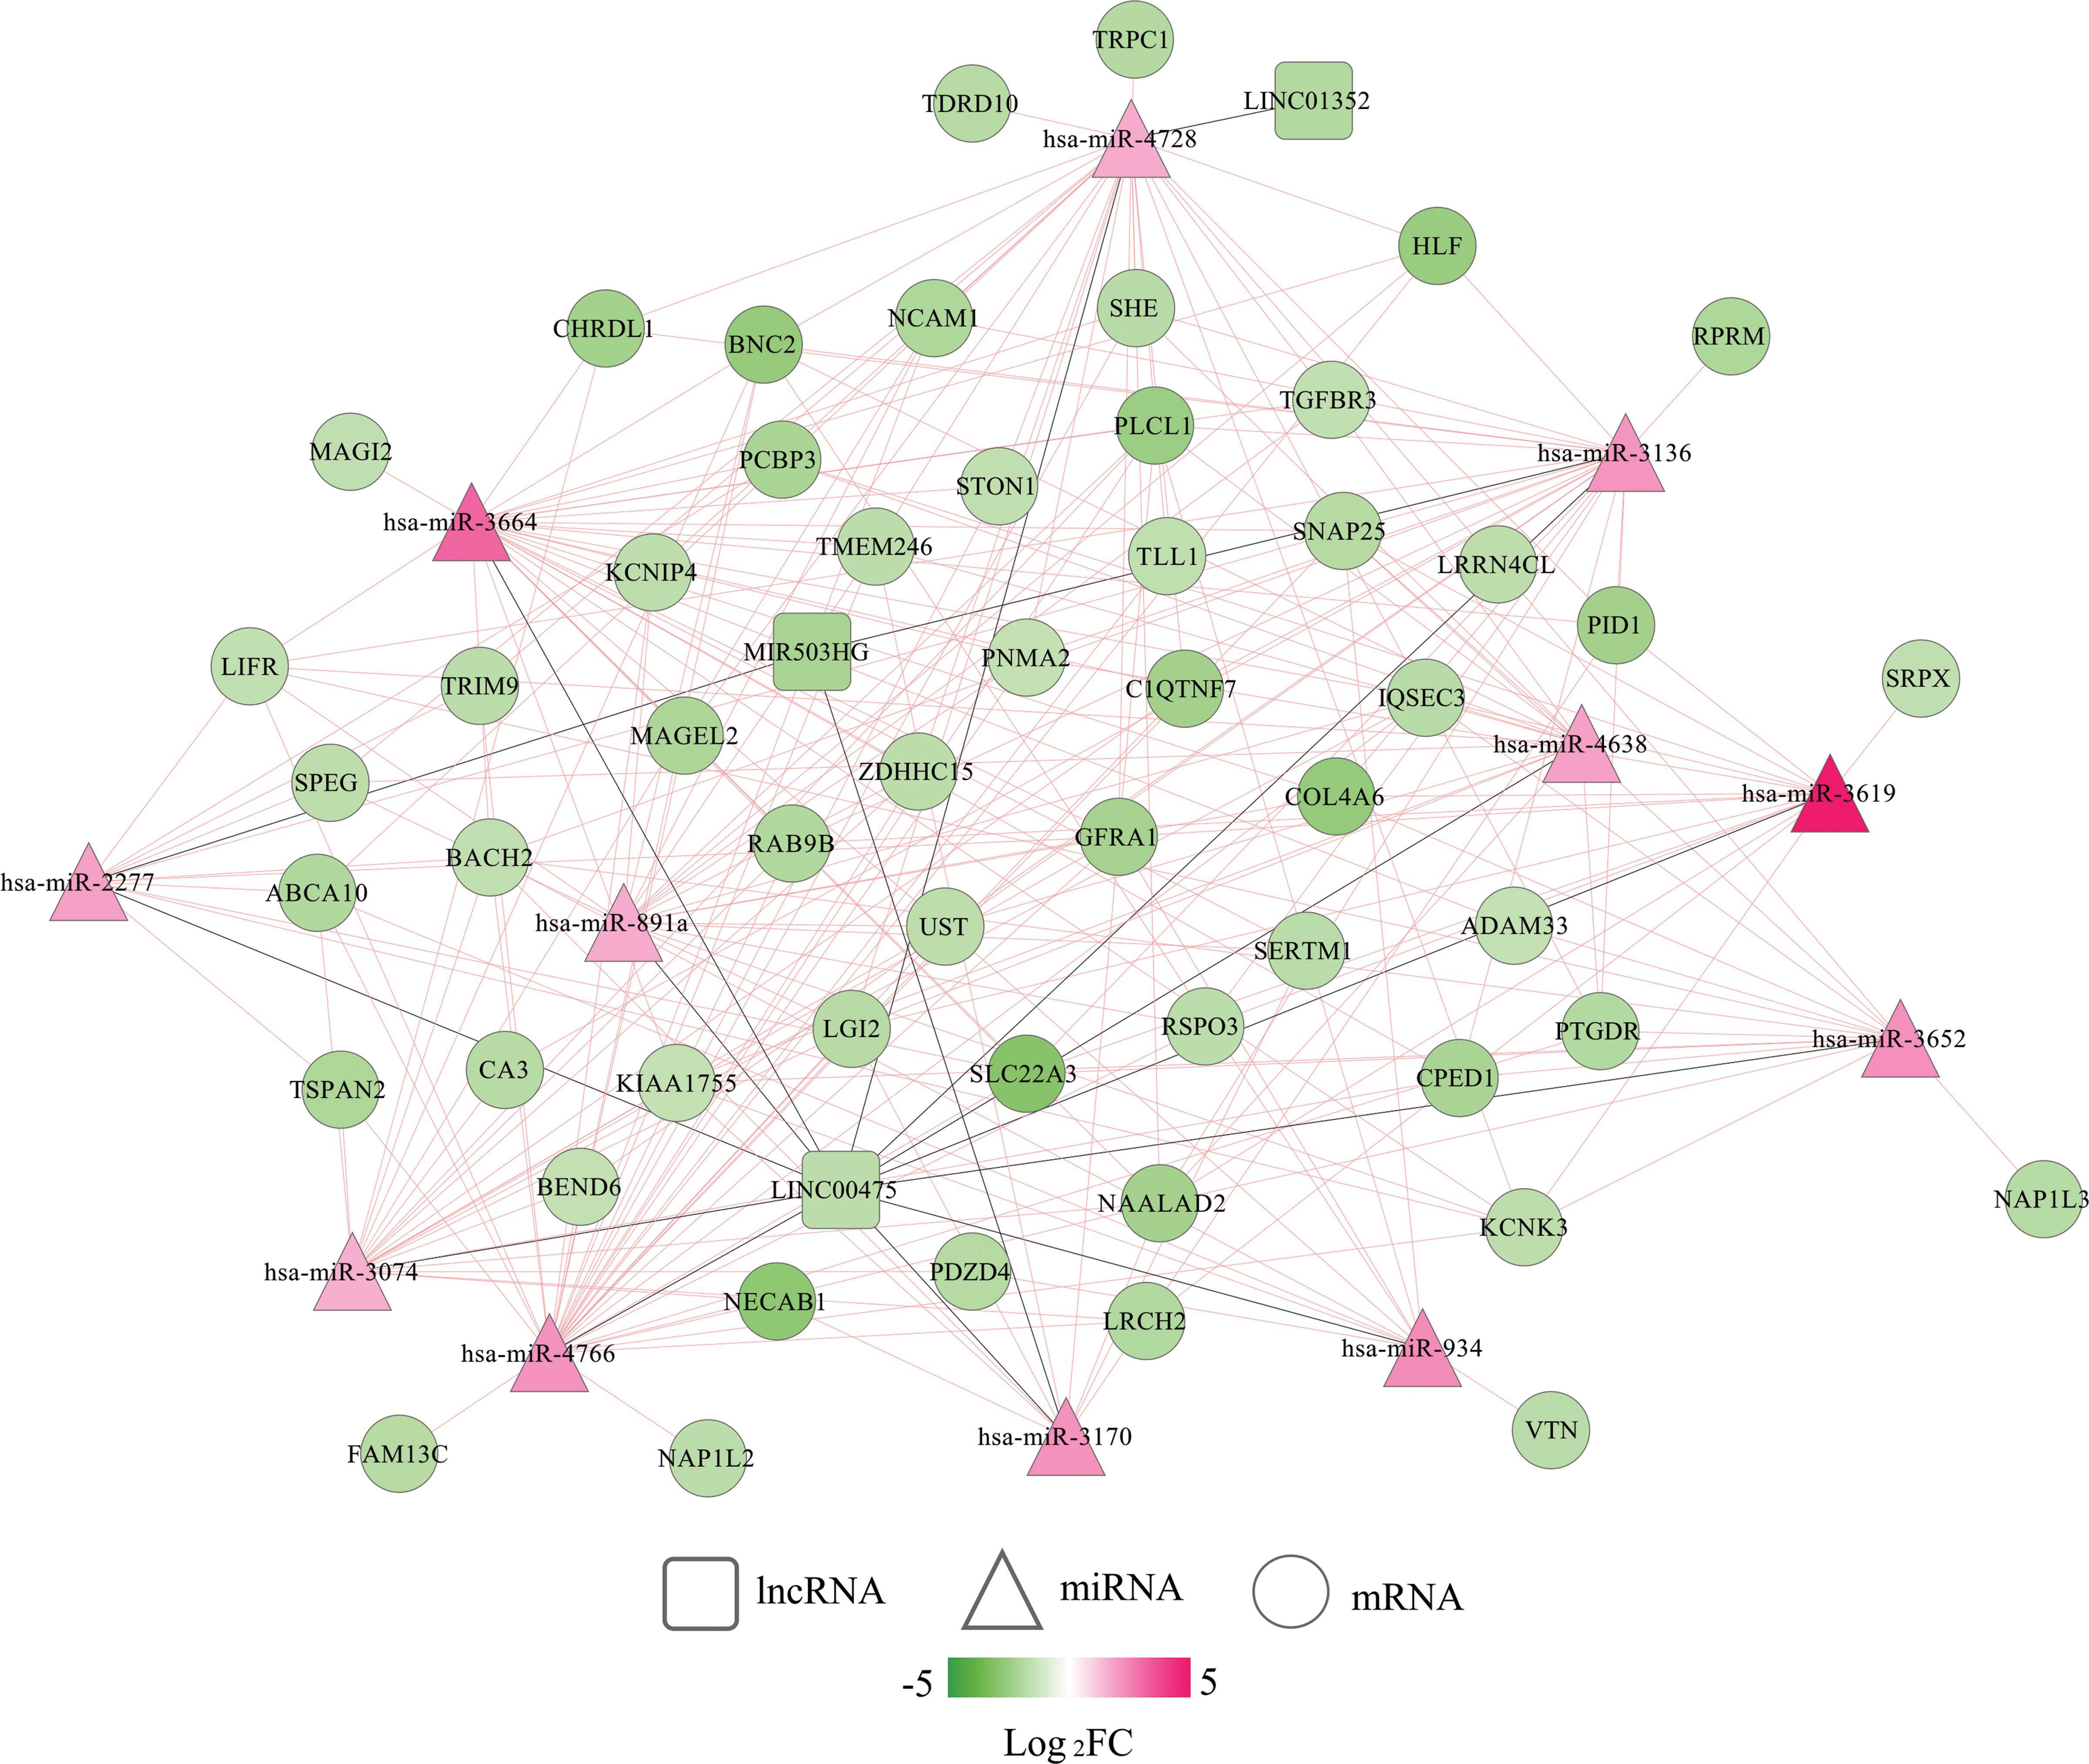
A competing endogenous RNA network among DELs, DEMs, and DEGs. Red, upregulated; green, downregulated. Circular, genes; square, lncRNAs; triangle, miRNAs. Color images are available online.
The GO biological process and KEGG signaling pathway analyses were performed to analyze the underlying functions of the DEGs in these two networks. As a result, 18 GO biological process terms and 10 KEGG pathways were enriched using Enrichr online tool (Table 4), including mitotic spindle organization (GO:0007052) (NUF2), positive regulation of receptor-mediated endocytosis (GO:0048260) (PCSK9), BMP signaling pathway (GO:0030509) (TGFBR3), and Cell cycle (PTTG1). Furthermore, DAVID database was also used to predict functions of all DEGs identified in EC to supplement the function enrichment results for crucial DEGs in networks. A total of 22 KEGG pathways and 227 GO BP terms (Supplementary Table S5; Table 5) were obtained. Most of above crucial genes in the ceRNA axes or coexpression interactors were enriched, including hsa04110: cell cycle (PTTG1), hsa04080: neuroactive ligand-receptor interaction (PTGDR), GO:0007067—mitotic nuclear division (NUF2; PTTG1), GO:0000122—negative regulation of transcription from RNA polymerase II promoter (BACH2), and GO:0001822—kidney development (PCSK9).
GO and KEGG Pathway Enrichment Results for the Genes in the Networks
BP, biological process; GO, gene ontology; KEGG, Kyoto Encyclopedia of Genes and Genomes.
GO and KEGG Pathway Enrichment Results for All Differentially Expressed Genes
GO or pathways enriched by crucial genes are displayed.
Discussion
Using the 326 miRNA-mRNA matched sequencing data from TCGA database updated in May 2019, we identified a five-lncRNA signature (LINC00475, LINC01352, MIR503HG, KCNMB2-AS1, and LINC01143) as a prognostic biomarker for EC. This five-lncRNA signature provided a higher prediction accuracy of OS (AUC = 0.984 for the training set; AUC = 0.970 for the validation set; AUC = 0.978 for the entire set) for patients with EC according to the K-M curve analysis. The AUC of our risk score model seemed to be higher compared with other lncRNA signatures identified previously, including Ouyang et al. (2019) (7-lncRNA, AUC = 0.721 for 1 year; AUC = 0.797 for 3 years; AUC = 0.768 for 5 years), Sun et al. (2017) (5-lncRNA, AUC = 0.695), Zhou et al. (2018) (11-lncRNA signature, AUC = 0.887), Xia et al. (2018) (4-lncRNA, AUC = 0.753), and Xu et al. (2018) (11-lncRNA, AUC = 0.8488). Furthermore, this risk score status was demonstrated to be independent of other clinical factors for prognosis prediction by multivariate analysis; stratification analysis showed that the risk score can also distinguish the OS of patients with the same histologic grade 3 or recurrence status; in nomogram model, C-index of the risk score was higher compared with two independent clinical factors (histologic grade and tumor recurrence), but could improve the prognosis accuracy when it was integrated with the other two. More importantly, clinical stage was not statistically significant in multivariate analysis of training set. Therefore, these findings suggest that our identified lncRNA signature may be a promising prognosis predictor to guide patient-tailored treatment in clinic.
None of these five lncRNAs was investigated in EC samples previously. In addition, only LINC00475 (Mo et al., 2019) and MIR503HG (Fu et al., 2019; Qiu, 2019) were reported to be involved in cancer. These findings indicate that these five lncRNAs may be novel biomarkers and therapeutic targets for cancer, including EC. Moreover, Mo et al. (2019) identified that LINC00475 was upregulated more than sixfold in gastric cancer tissues using an lncRNA microarray technique. Survival analysis of Hou et al. (2019) revealed that LINC00475 was correlated with the OS time of clear cell renal cell carcinoma. Two in vitro studies showed that silencing of LINC00475 suppressed cell proliferation, migration, and invasion in renal cell carcinoma (Chen et al., 2018) and glioma cells (Zhang et al., 2019). These results indicate that LINC00475 may be a cancer-promoting gene. However, unfortunately, we did not detect the upregulation of LINC00475 in EC, but significantly downregulated, indicating the expression specificity of lncRNA in different tissues and the necessity to specifically focus on the function mechanisms of LINC00475 in EC. In this study, we, for the first time, integrated the miRNA, lncRNA, and mRNA datasets of EC and predicted that LINC00475 may directly coexpress with PTGDR or regulate PTGDR by sponging miR-4728 to promote the development of EC. The studies on the PTGDR and miR-4728 in cancer may provide indirect evidence for possible interactions between them. For example, PTGDR was identified to be significantly hypermethylated in EC (Chang et al., 2018), which may lead to its decreased expression at the mRNA level (Kalmár et al., 2015). PTGDR can be bound with its ligand to prostaglandin D2 to exert tumor suppression effects (Tippin et al., 2014), the mechanisms of which may be related with inhibition of STAT3 phosphorylation and expression of cancer stem cell markers (Sall4 and Lgr5) (Zhang et al., 2018). Furthermore, PTGDR deficiency was also reported to enhance tumor progression through accelerating vascular leakage and angiogenesis (Takahisa et al., 2008). The expression of miR-4728-3p and miR-4728-5p was found to be significantly upregulated in HER2-positive gastric cancer and breast cancer tissues compared with adjacent normal tissues, indicating that it may be a marker of HER2 status (Li et al., 2015). Aggressive EC was also proved to be HER2-high expressed (Halle et al., 2017). Thus, miR-4728 may also be upregulated in EC, which was confirmed in our study.
The role of MIR503HG was also inconsistent in different types of cancer. Some showed that MIR503HG functioned as a tumor suppressor to inhibit cell proliferation, metastasis, and invasion (Fu et al., 2019; Qiu et al., 2019), while the others supported that MIR503HG was significantly upregulated in tumors and its overexpression enhanced tumor cell growth (Huang et al., 2018). In line with the study of Huang et al. (2018), we also observed that MIR503HG was a risk factor for EC prognosis (i.e., high expression predicted poor OS), although its expression was downregulated in EC tissues compared with controls. The difference in prognosis trend and expression may be attributed to the individual difference in expression, which was also the reason to perform our study to stratify them. Furthermore, Huang et al. (2018) showed that highly expressed MIR503HG mediated cancer cell proliferation by stabilization of TGFBR through induction of miR-503 and suppression of Smurf2. In line with this study, we also found that MIR503HG could coexpress with TGFBR3, and highly expressed TGFBR3 was associated with worse prognosis. However, the oncogenic mechanisms of MIR503HG remained rarely investigated. In our study, we also speculated that MIR503HG may function as a ceRNA for miR-3170 to regulate BACH2. The similar prognosis trend between MIR503HG and BACH2, as well as the opposite prognosis trend between miR-3170 and BACH2, as we detected or previously described may indirectly demonstrate our hypothesis: univariate analysis by Wang et al. (2018) showed that miR-3170 was a protective factor for OS in patients with EC, with HR of 0.774. Satoshi et al. (2014) found that the 3-year OS rate was significantly shorter in diffuse large B cell lymphoma cases with high BACH2 expression than that with low expression (71.7% vs. 91.3%, p = 0.0256), implying its risk roles for prognosis.
The roles of LINC01143, KCNMB2-AS1, and LINC01352 were, for the first time, surveyed in this study. We predicted that highly expressed LINC01143 promoted the development and progression of EC by coexpression with NUF2 and PTTG1 (Pituitary tumor transforming gene 1) and then upregulating their transcription; KCNMB2-AS1 may exert protective roles by coexpressing with PCSK9; and LINC01352 may exert risk roles by coexpressing with BACH2. The prognosis potential of these coexpressed genes seemed to be in line with our results. For example, Hu et al. (2015) found that overexpression of NUF2 could be related to poor prognosis in pancreatic cancer patients. NUF2 silencing reduced the proliferation and colony formation ability of cancer cells in vitro and alleviated tumorigenesis in vivo. The univariate and multivariate analyses by Ren and Jin suggested that PTTG1 overexpression was an independent poor prognostic factor for colorectal cancer patients. The in vitro experiments showed that knocking down PTTG1 inhibited colorectal cancer growth and metastasis (Ren and Jin, 2017). PCSK9 siRNA was reported to enhance cancer cell viability depressed by ionizing radiation, indicating that high expression of PCSK9 may promote apoptosis and predicted excellent survival (Gan et al., 2017).
Conclusion
In present study, we identified a novel, robust five-lncRNA signature for prognosis prediction in patients with EC based on RNA-Seq data. These signature lncRNAs may be involved in EC by coexpressing with mRNAs (LINC00475-PTGDR, LINC01352/MIR503HG-BACH2, KCNMB2-AS1-PCSK9, LINC01143-NUF2/PTTG1) or functioning as a ceRNA (LINC00475-hsa-miR-4728-PTGDR; MIR503HG-hsa-miR-3170-BACH2) to regulate neuroactive ligand–receptor interaction, endocytosis, cell cycle, or transcription processes. However, further quantitative PCR experiments should be performed with larger clinical samples to validate the prognosis accuracy of our lncRNA signature. Furthermore, in vitro and in vivo experiments are also required to verify the ceRNA or coexpression mechanisms of our identified lncRNAs.
Footnotes
Disclosure Statement
No competing financial interests exist.
Funding Information
No funding was received for this article.
Supplementary Material
Supplementary Table S1
Supplementary Table S2
Supplementary Table S3
Supplementary Table S4
Supplementary Table S5
References
Supplementary Material
Please find the following supplemental material available below.
For Open Access articles published under a Creative Commons License, all supplemental material carries the same license as the article it is associated with.
For non-Open Access articles published, all supplemental material carries a non-exclusive license, and permission requests for re-use of supplemental material or any part of supplemental material shall be sent directly to the copyright owner as specified in the copyright notice associated with the article.