




Abstract
We aimed to establish a novel immunoscore (IS) model based on the transcriptomes of tumor tissues to improve the relapse-free survival (RFS) prediction of colorectal cancer (CRC). CIBERSORT was used to estimate the immune cell fractions based on the Gene Expression Omnibus (GEO) database. Then, a least absolute shrinkage and selection operator regression was applied to construct the IS model based on the immune cell fractions. After screening, four GEO databases were included in the CIBERSORT transformation. A total of 13 types of immune cells were selected and constructed an IS model. In the training set (n = 613) and test set (n = 262), the patients in the high-immunoscore group showed a significant poor RFS than that in the low-immunoscore group. Stratified analysis also found similar results in patients with identical age, sex, adjunctive chemotherapy, or TNM stage I–II. Multivariate Cox regression further demonstrated that the IS model was an independent predictor of RFS in CRC. In addition, the IS was highly associated with the expression of several immune checkpoints, inflammatory mediators, cell cycle, and epithelial–mesenchymal transformation regulators in CRC. We proposed a novel IS model for estimating RFS in CRC patients.
Introduction
Human colorectal cancer (CRC) is the second leading cause of cancer-related death worldwide and the third incidence based on the Global Cancer Statistics 2018 (Bray et al., 2018). Most CRC patients without obviously and specifically clinical symptoms are usually difficult to diagnose in the early stage. Even 50–60% of CRC patients relapse in the first year after initial resection, although there are better diagnostic and treatment methods for CRC (Seo et al., 2013; Shang et al., 2018).
Currently, the TNM staging system is used as the gold standard for predicting recurrence rate in CRC (Kawaguchi et al., 2013). Higher TNM staging generally implicates a worse prognosis. However, CRC patients always show quite different prognosis with highly heterogeneous. For example, the American Joint Committee on Cancer (AJCC) sixth edition demonstrates that stage IIIa exhibit a better 5-year relapse rate (83.4%) than stage IIb (72.2%) (O'Connell et al., 2004). These data indicate insufficient clinical information provided by TNM staging. Therefore, it is urgently needed to explore and improve early biomarkers to predict relapse in CRC patients.
Increasingly, evidences showed that immune cell infiltration in the tumor immune microenvironment is closely associated with tumor relapse, metastasis, and prognosis (Galon et al., 2006; Angell and Galon, 2013; Song et al., 2019). Among these immune cells, T cells have been reported to be highly correlated with clinical outcomes in malignancies, including CRC, suggesting that they have an immunoediting role in controlling tumor development. For example, Pages et al. (2005) found that tumors without signs of early metastatic invasion had more numbers of CD8+ T cells and a higher expression of markers associated with the activation and differentiation of T cells, resulting better survival. In addition to T cells, other immune cells are also showed vary effects in the prognosis of CRC, such as tumor-associated macrophages (Dost Gunay et al., 2019; Feng et al., 2019). A recent study showed that higher CD206/CD68 ratios significantly correlated with poor overall survival (OS) and disease-free survival (Feng et al., 2019). Thus, a comprehensive analysis of immune cell infiltration in CRC is a valuable supplement to the prediction of relapse-free survival (RFS).
With the development of high-throughput technology, gene expression profiles are applied to explore more reliable molecular biomarkers. In addition, CIBERSORT is a newly proposed and developed computational algorithm to analyze immune cell fraction through RNA-sequencing data derived from tissue samples. This algorithm has outperformed other methods in terms of noise, unknown mixture content, and closely related cell types (Newman et al., 2015). In this study, we used the CIBERSORT algorithm to enumerate the cell fractions of 22 immune cell types in 875 CRC patients. Then, we constructed an immunoscore (IS) model for the prediction of RFS in CRC using least absolute shrinkage and selection operator (LASSO) Cox regression analysis, which is a powerful tool for predicting tumor prognosis (Friedman et al., 2010).
Materials and Methods
Details of search strategy
The search strategy was as following: (“survival” OR “prognosis” OR “prognostic” OR “outcome” OR “death” OR “relapse” OR “recurrence” OR “recurrence-free survival” OR “disease-free survival”) AND (“colorectal neoplasms” OR “colorectal tumor” OR “colorectal carcinoma” OR “colorectal cancer”) AND GPL570. In the initial search, 235 items were recognized and only the first 72 were independent chip series. In the 72 series, 36 contained mRNA expression profiles of CRC tissue, which were the following: GSE17538, GSE17537, GSE17536, GSE9348, GSE18105, GSE4526, GSE21510, GSE18088, GSE31595, GSE33113, GSE33114, GSE22598, GSE27157, GSE14333, GSE32323, GSE37892, GSE30540, GSE27854, GSE19860, GSE39582, GSE40967, GSE29621, GSE39084, GSE60697, GSE38832, GSE65857, GSE62932, GSE64258, GSE64256, GSE71222, GSE81986, GSE72968, GSE72969, GSE72970, GSE92921, and GSE110224.
Among the 36 datasets, eight were repeated: GSE17536, GSE17537, GSE29621, GSE33113, GSE39582, GSE64256, GSE72968, and GSE72969; 23 datasets without the survival data of RFS: GSE9348, GSE18105, GSE4526, GSE21510, GSE18088, GSE31595, GSE33114, GSE22598, GSE27157, GSE32323, GSE37892, GSE30540, GSE27854, GSE19860, GSE39084, GSE60697, GSE65857, GSE62932, GSE64258, GSE71222, GSE81986, GSE92921, and GSE110224; and GSE72970 included the survival data of progression-free survival. After removing the above datasets, we only obtain survival data from the following four items: GSE17538, GSE14333, GSE38832, and GSE40967, and the patients related to these four items were included in the subsequent CIBERSORT transformation.
CIBERSORT algorithm
To estimate the proportion of immune cells in the CRC tissues, the CIBERSORT method was used and the LM22 gene signature was considered as the reference (Newman et al., 2015). The CIBERSORT algorithm has been validated for immune cell derivation based on microarray data through using Monte Carlo sampling. After computing a p value of deconvolution for each sample, the results of the immune cell types with p < 0.05 were considered with high accuracy (Ali et al., 2016). In addition, the sum of the predicted immune cell type fractions was one within each sample in the final output of CIBERSORT. The LM22 signature was consisted of 547 genes, which discriminated 22 human hematopoietic cell phenotypes, such as T cells, dendritic cells, plasma cells, and natural killer cells. Thus, the samples with p < 0.05 were retained and then were directly combined to generate a matrix of immune cell fractions for further analysis.
IS model construction
Through the “createDataPartition” function in the “caret” package, all samples were randomly assigned to training and test sets with a ratio of 7:3 (Peng et al., 2019). First, we converted the immune cell fractions into binary variables in the training set, and the “survminer” package was used to obtain the optimum cutoff value to evaluate the association between the cell fractions and the RFS of CRC patients (Peng et al., 2019). Meanwhile, the CRC samples were divided into low-immunoscore (LIS) and high-immunoscore (HIS) groups by the optimal cutoff of the immune cell fractions calculated through time-dependent receiver operating characteristic (ROC) curve analysis using “survivalROC” R package (Lorent et al., 2014). Then, we build a LASSO Cox penalized regression model using “glmnet” R package (Friedman et al., 2010) and the lambda.1se, a penalty parameter for prevention of overfitting was selected using 10-fold cross validation (Goeman, 2010). Finally, immune cells with nonzero coefficient were selected to establish a prognostic signature.
Statistical analyses
In this study, statistical analyses were performed through R 3.6.1 software. χ2 test for categorical data were used to compare variables between training and test sets. To evaluate the prognostic accuracy of our IS model, time-dependent ROC curve was analyzed, and the area under the curve (AUC) was calculated using the “survivalROC” package. Kaplan–Meier survival analysis was performed using the “survival” package with the log-rank test. Furthermore, to evaluate the independence of predict factors for RFS, multivariate Cox regression analysis was conducted. In addition, the “survcomp” package was used to conduct stratified analyses with sex, age, TNM stage, and adjunctive chemotherapy (CT). The results indicated the prognostic ability of the IS model in subpopulations. The Harrell's concordance index (C-index) was computed to compare the IS model and TNM stage using the “survcomp” package. All results were considered to be statistically significant at p < 0.05.
Results
Characteristics of CRC studies
The flowchart of patient selection is shown in Figure 1. Finally, a total of 875 CRC patients with RFS information were enrolled for further analysis after applying data filter criteria. In general, 310 patients (35.4%) were deceased. The median age at diagnosis was ranged from 22 to 96 years and males accounted for 48.6% in the entire cohort. Other patient characteristics are summarized in Table 1, and no significant differences were found between training and test sets. After CIBERSORT analysis, the most abundant immune cell fractions in CRC tissues were plasma cells, resting memory CD4+ T cells, M0 macrophages, M1 macrophages, M2 macrophages, and activated mast cells (Fig. 2a). A forest plot showed the association between each of the immune cell fractions and RFS (Fig. 2b).
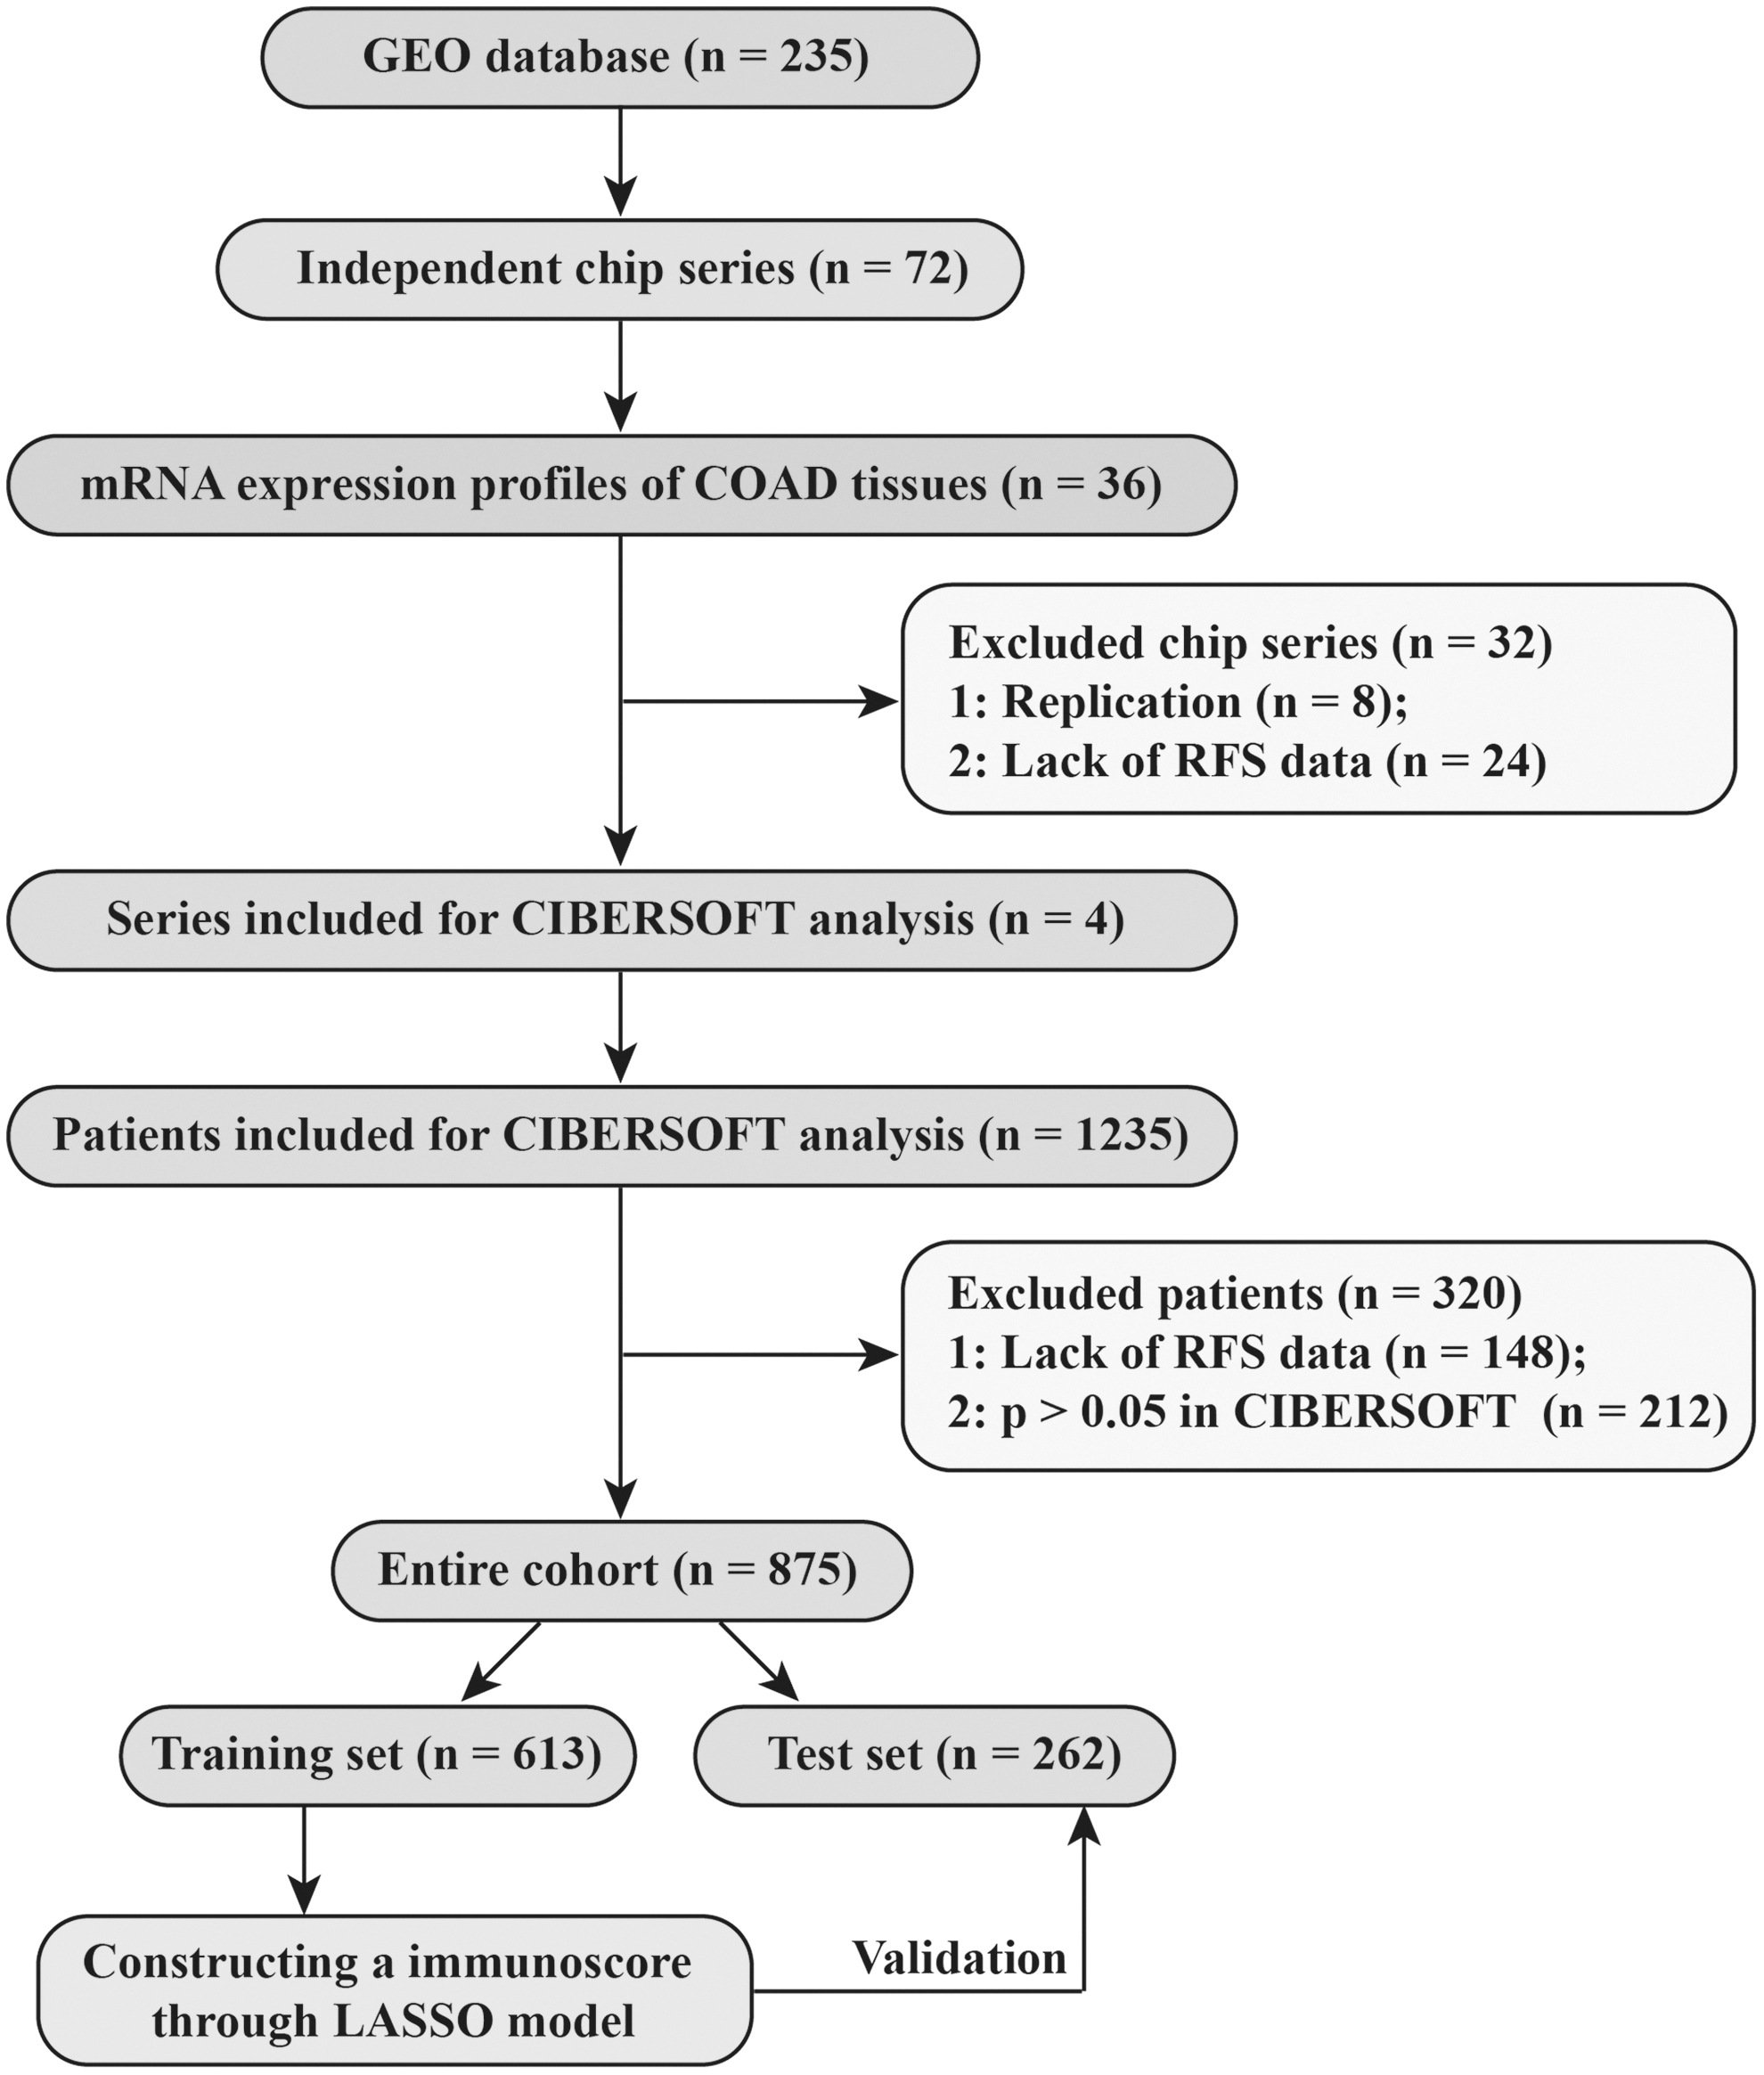
Flowchart of the whole procedures.
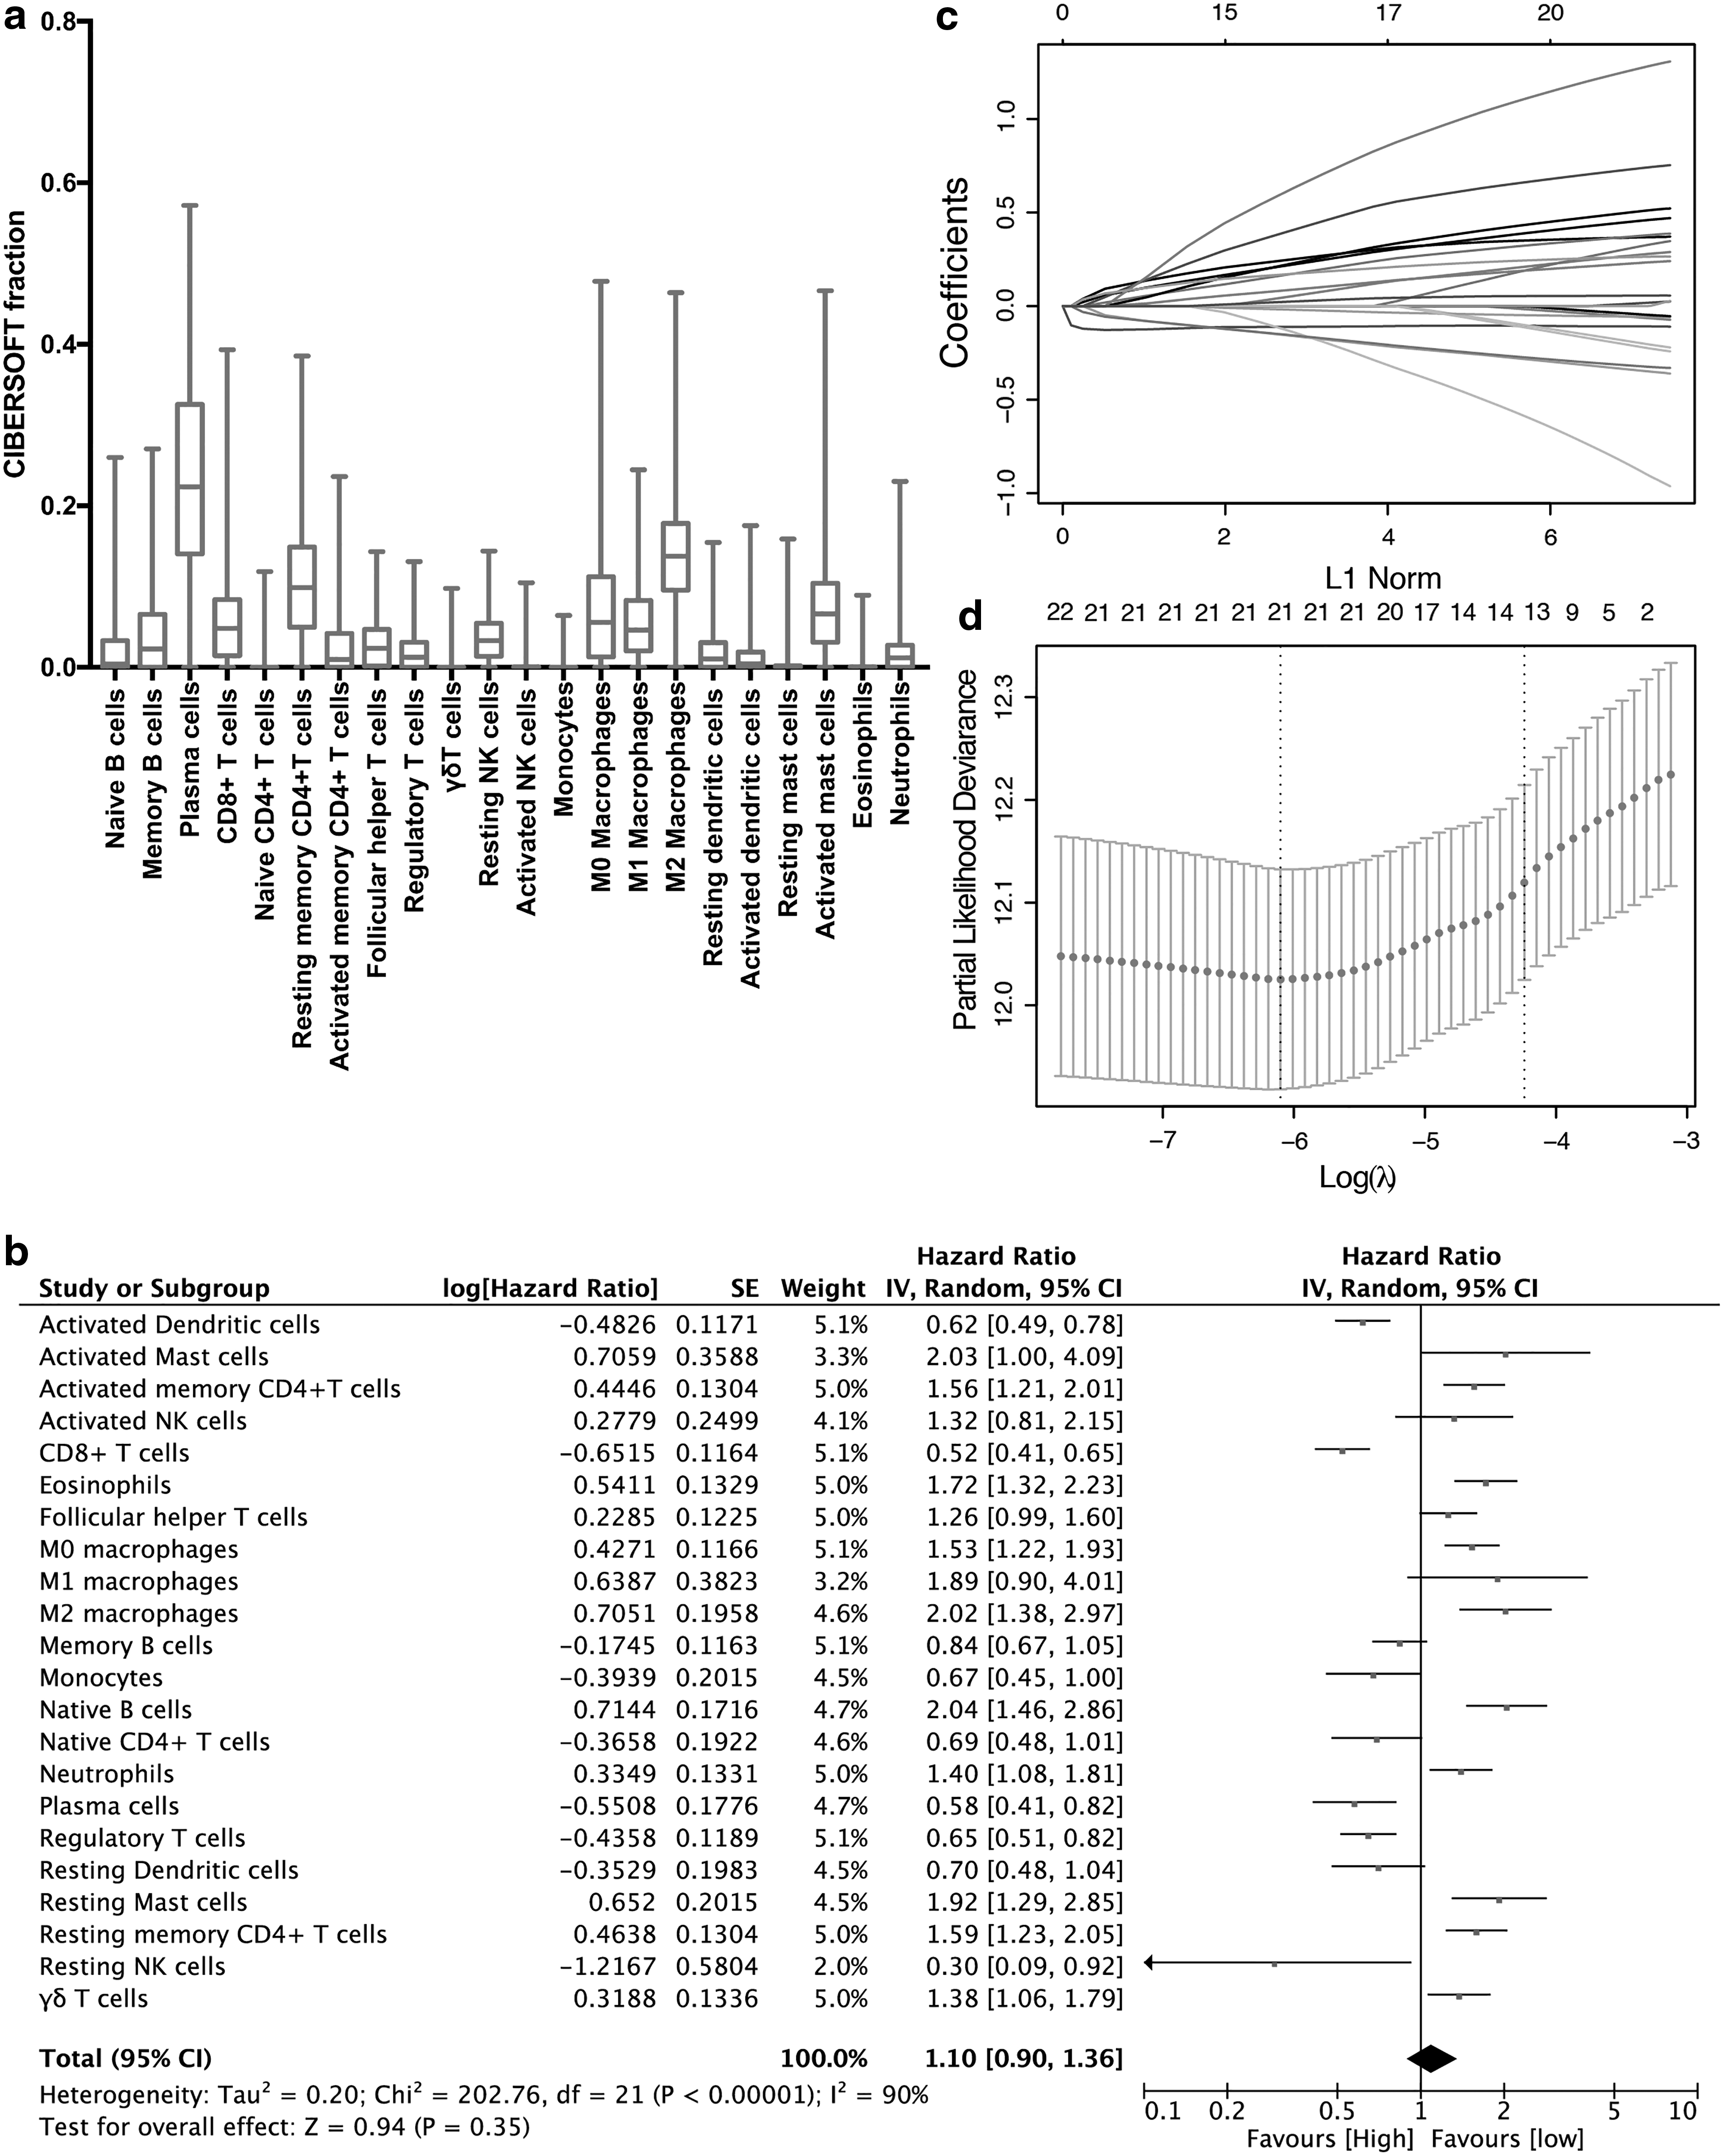
Construction of the IS model.
The Characteristics of Patients in the Training and Test Sets
CT, chemotherapy; NA, not available.
Derivation of an IS model
We used the “caret” package to randomly assign all the samples in the entire cohort for training and test with a ratio of 7:3. The “survminer” package was used to determine the best cutoff values of immune cell fractions to predict RFS (Supplementary Table S1). Thus, the immune cell fraction level was converted to 0 or 1 based on the cutoff values. When the level of one fraction type was higher than the corresponding cutoff value, a value of 1 was assigned, and 0 was assigned otherwise. Then, we applied the LASSO penalized Cox regression to develop the IS model in the training set (n = 613), and the parameter lambda.1se was set as 0.0143941 after 10-fold cross validation (Fig. 2c, d). The formula of the IS model was shown as follows: IS = (0.127 × fraction level of M0 macrophages) + (0.211 × fraction level of M2 macrophages) − (0.121 × fraction level of plasma cells) − (0.162 × fraction level of CD8+ T cells) − (0.096 × fraction level of Tregs) − (0.207 × fraction level of activated DCs) + (0.131 × fraction level of follicular helper T cells) + (0.217 × fraction level of CD4+ memory resting T cells) + (0.081 × fraction level of neutrophils) + (0.128 × fraction level of eosinophils) + (0.107 × fraction level of naïve B cells) − (0.038 × fraction level of memory B cells) + (0.186 × fraction level of CD4+ memory activated T cells).
Prognostic role of the IS model
Based on the cutoff (0.92538) derived from the “survminer” package, CRC samples in the training set were classified into the LIS and HIS group (Supplementary Fig. S1a). As shown in Figure 3a, CRC patients in the HIS group showed poorer RFS compared with those in the LIS group (hazard ratio [HR]: 2.457; 95% CI: 1.875–3.220). To further explore the prognostic accuracy of our model, we performed a time-dependent ROC analysis using IS as a continuous variable, and the AUC of the 3-, 5-, and 10-year ROC curves were 0.581, 0.714, and 0.773, respectively (Fig. 3b). These data demonstrated a good performance of our IS model in the training set. Furthermore, the association of IS and RFS was also significant in the univariable and multivariate Cox regression analysis (Table 2). Similarly, based on the same formula, the samples in the test set were assigned to LI and HI groups, respectively (Supplementary Fig. S1b). The RFS of CRC patients in the HIS group were also significantly worse than those in the LIS group (HR: 2.764; 95% CI: 1.772–4.311, Fig. 3c). The AUC of the ROC curve at time points of 3, 5, and 10 years was 0.599, 0.669, and 0.871, respectively (Fig. 3d). The multivariate Cox regression analysis also indicated that the IS value was also an independent predictor of RFS in the test set (Table 2).
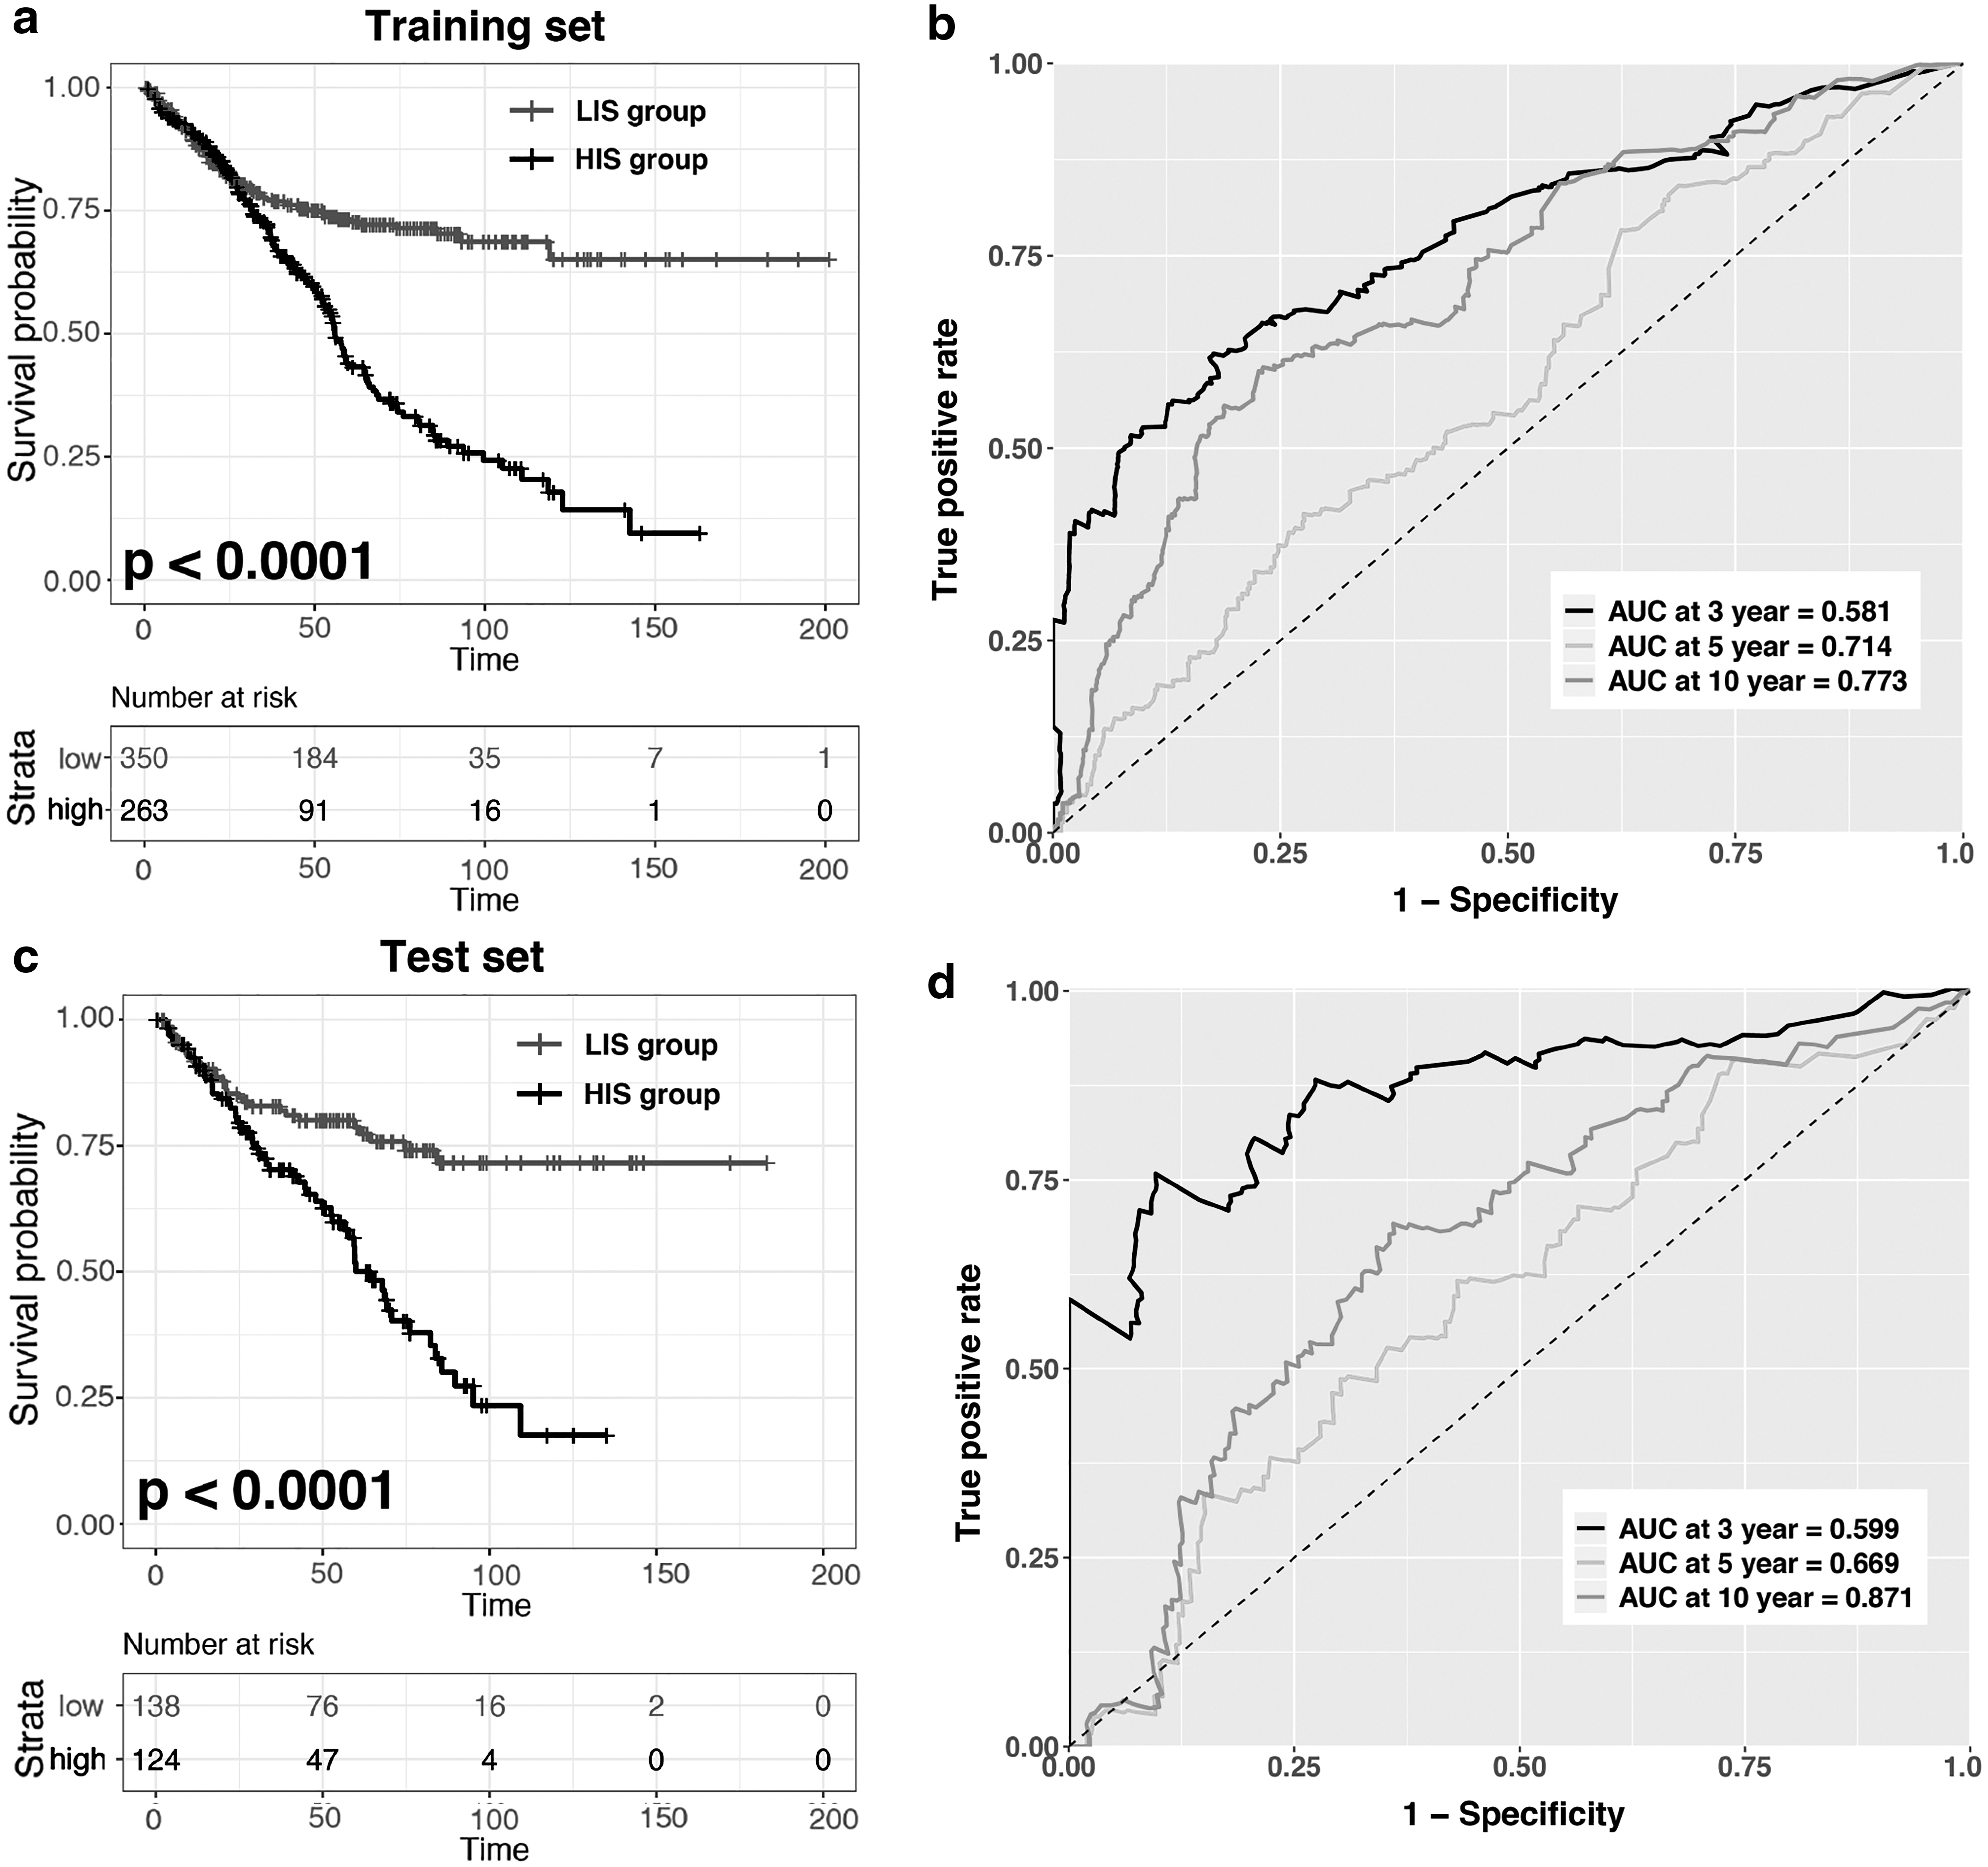
Validation of the IS model. Kaplan–Meier curves and time-dependent ROC analyses for RFS prediction based on the IS value in the training
Univariate and Multivariable Cox Proportional Hazards Regression Analysis on Relapse-Free Survival in the Training Set and Test Set
HR, hazard ratio; LCI, lower confidence interval; UCI, upper confidence interval.
Stratified analysis of the IS value
For further data mining, we performed the stratified analysis based on our IS model. The results showed that the IS model was a stable prognostic marker for HIS patients according to the independent of gender (male or female), age (≤65 or >65), and adjunctive CT (yes or no) in the training and test set, respectively (Fig. 4a–c). In the meantime, the IS model also had a significant prognostic value to identify the patients with two TNM stage subgroups (I–II and III–IV), although there was no significance for stage III–IV in the testing set (p = 0.061). Therefore, we compared the predictive accuracy between the TNM stage subgroup and IS value in the training and test set, respectively (Table 3). We found that for patients with stage I–IV and stage I–III, the predictive ability of the IS value was similar with TNM stage; for patients with stages I–II, however, the IS exhibited a better performance than TNM stage. Furthermore, an integration of IS value and TNM stage showed improved prognostic predictive ability than TNM stage alone in the training and test set (Table 3).

Stratified analyses of the IS model. Kaplan–Meier curves for RFS prediction based on the sex

The Harrell's Concordance Index for Immunoscore and TNM Stage
IS, immunoscore.
We also applied nomogram-based survival probability prediction model to assess the relationship between IS model and RFS. After integrating the total score of clinical factors and locating it on the total point scale, we draw a straight line to evaluate the probability of 5-, and 10-year survival at each time point in the training and test set, respectively (Fig. 5a, c). According to this nomogram model, patients in the low risk group showed a better survival probability. Moreover, the calibration curve for predicting patient survival found that the rate of predicted 5- and 10-year survival closely paralleled the actual observed rate of the training and test set, respectively (Fig. 5b, d), indicating a higher accuracy of this nomogram model.

Nomogram model for predicting IS signature combined with clinical traits in COAD patients.

Molecular subtypes analysis
We analyzed the molecular subtypes of IS values. In the training set, we found a significantly positive association between the IS value and some immune checkpoints, such as hepatitis A virus cellular receptor 2 (HAVCR2), programmed death-ligand 1 (PD-L1), and granzyme B (Fig. 6a). In addition, inflammatory chemokines and proinflammatory cytokines are highly correlated with the IS value (Fig. 6b). Several key regulators of epithelial–mesenchymal transition (EMT), such as vimentin, twist family bHLH transcription factor 1 (TWIST1), and transforming growth factor-beta 1 (TGF-β1), were also highly positively correlated with the IS value (Fig. 6c). Finally, we compared the correlation between immune fraction and cell proliferation. The results showed that cyclin-dependent kinase-like 1 (CDKL1) and CDKL2 were negatively correlated with the IS value, while cyclin D1 (CCND1) was highly positively correlated with immune fraction (Fig. 6d).

Correlation between IS model and molecular subtypes in the training set. Scatter plots showed the correlation between IS and mRNA expression of immune checkpoint modulators
Discussion
In this retrospective study, we first constructed a novel IS model to predict the RFS of CRC patients. Our IS model was composed of the fractions of 13 immune cells. The results showed a good performance in separating the RFS curves between patients with HIS and LIS group. Moreover, this model found that the RFS prediction effect was more significant in the patients with TNM staging of I and II, suggesting that the model may have a prognostic value in complementing TNM staging.
Currently, it is widely accepted that immune cell infiltration into tumors plays an important role in regulating the biological behavior of cancer. However, this view has not yet been translated into clinical significance well. In addition, tumor immunotherapy has harvested increasingly concerns in recent years, but many studies only focused on targeted therapy for immune-related genes (Peng et al., 2019), while ignoring the impact of the composition of immune cells on tumorigenesis and development. Therefore, many studies constructed several IS models to predict survival based on immunohistochemistry in patients with cancer (Thike et al., 2019). However, the limitation of these studies was that they only labeled a few types of immune cells, or small sample sizes, or both (Peng et al., 2019).
As a result, more and more tumor researchers used a well-developed algorithm, named CIBERSORT to evaluate the immune contexture (Newman et al., 2015; Zeng et al., 2018). As reported by Yang et al. in 2019, they identified and validated an immune infiltrating score to predict the OS of lung cancer with high prognostic power (Yang et al., 2019). Furthermore, Peng et al. also established an IS model based on the immune fractions of 17 immune cell types to predict the OS of CRC. However, these studies only focused on the relationship between immune score and OS, while neglecting the relationship with relapse and immune cell fractions.
Therefore, we applied the CIBERSORT algorithm to integrate the CRC transcriptome data into the Gene Expression Omnibus (GEO) database containing RFS and obtained the fractions of 22 immune cells. After LASSO analysis, an IS model of 13 immune cells highly associated with RFS was finally obtained. Apart from the T cell subsets and macrophages, our model also included B cells, plasma cells, dendritic cells, and neutrophils. Compared with the model constructed by Peng et al., our model removed four immune cell types, including mast cells, M1 macrophages, and natural killer cells. This result suggested that these three types of immune cells might not affect RFS of CRC, and more clinical samples are needed for verification.
Our model found that plasma cells accounted for the highest proportion in the immune microenvironment and exerted a favorable outcome in CRC (Fig. 2a, b). It was reported that lymphocytes with a higher proportion of IGKC+ or CD138+ (markers of plasma cells) improved 5-year OS of CRC (Berntsson et al., 2016). High density of plasma cells also predicted improved RFS in triple negative breast cancer (Yeong et al., 2018). Thus, it was reasonable to speculate that plasma cells had an immunomodulatory effect on the RFS of CRC. Another significantly infiltrating cell type was M2 macrophages. It is well known that M2 macrophages play a role in promoting tumorigenesis and development in the tumor immune microenvironment (Cassetta and Pollard, 2018). According to the latest meta-analysis, the result indicated that higher M2 macrophage infiltration in CRC was highly associated with shorter RFS (Zhao et al., 2019). Meanwhile, M0 macrophages were also included in our model. It was generally accepted that the tumor microenvironment can educate macrophages to promote their malignancy and progression (Pollard, 2004), and M0 macrophages were easily educated into M2 macrophages. Therefore, some tumor immunotherapy studies targeting macrophages emphasized that their treatment focused on the “re-education” of tumor associated macrophages for the M1 phenotype (Zhao et al., 2018; Governa et al., 2019). However, our model excluded M1 macrophages, although it was a good prognostic marker of CRC. It may be that the target treatment of macrophages was more effective for CRC patients with higher CD8+ T cell infiltration, high levels of microsatellite instability, or nonmucinous (Zhao et al., 2019).
In T cell subsets, we found that the fraction of CD8+ T cells was also high in the model. The CD8+ T cells played an important role in antitumor immunity through expressing cytolytic molecules such as perforin and granzyme (Kilinc et al., 2009; Johnson et al., 2015). For CD4+ T cells, different subsets secreted cytokines that affected the tumor immune microenvironment to play diverse roles in the prognosis of cancer (Bluestone et al., 2009). For example, high CD4+ and Foxp3+ (Treg marker) densities T cells improved RFS in CRC patients (Sinicrope et al., 2009; Kuwahara et al., 2019), while Treg cell infiltration was associated with poor RFS in other tumor types (deLeeuw et al., 2012; Lee et al., 2019). Meanwhile, Thike et al. (2019) found that higher density of total CD4+ T cells was highly associated with poor DFS in breast cancer. Therefore, the role of CD4+ T cells in CRC needs further validation in clinical samples.
It was worth noting that our model was closely related to TNM staging, especially in patients stage I–II. The C-index of these parts of patients was higher than that of TNM staging, and a combination of immune scoring and TNM staging showed the highest prognostic power than each alone. In addition, IS model can further distinguish stage I–II patients into LIS and HIS groups, and the patients in HIS group had shorter RFS. These data suggested that our model might potentially complement the RFS power of TNM staging in CRC. However, the model did not show a higher C-index than TNM staging after including stage III and IV, although the combination showed better prognostic power. Furthermore, Kaplan–Meier analysis revealed no significant difference to predict RFS in patients with stage III–IV. This might be caused by fewer patients with stage IV.
Moreover, our data found that only patients in the LIS group contributed to extend survival time. This might attribute to more functional immune cells in the LIS group and a significant correlation with immune checkpoints, such as HAVCR2 and PD-L1 (Peng et al., 2019). Although the correlation coefficient was relatively low, it might be caused by the large number of samples. Also, correlation analysis found that IL-6 was positively correlated with immune score, while inhibition of IL-6 can increase tumor chemodesensitization (Shi et al., 2012). The CXCR4-CXCL12 axis was also considered as a new potential drug target for CRC (Cabrero-de Las Heras and Martinez-Balibrea, 2018; De Mattia et al., 2019). More importantly, IS was positive associated with EMT regulators, which contributed to the chemoresistance of CRC (Findlay et al., 2014).
Conclusion
In conclusion, we first proposed an IS model to predict RFS in CRC patients and analyzed the correlation between immune cell infiltration and clinical information. This study may provide new insights into the relapse-free prognostic evaluation and risk stratification of CRC patients. In addition, we hope our IS signature will be a useful tool for clinicians to personally manage CRC patients.
Footnotes
Authors' Contributions
H.W. and Q.Z. designed the study. H.W. and F.X. contributed to the literature search. H.W., F.X., and M.Z. downloaded and analyzed the data. J.L. and F.W. prepared and reviewed the article. All authors read and approved the final article.
Data Availability Statement
The data sets used and/or analyzed during the current study are available from the corresponding author on reasonable request. The public data source: GEO database.
Disclosure Statement
No competing financial interests exist.
Funding Information
The work was supported by a research grant from the National Natural Science Foundation of China (81870390) and the Program of Excellent Doctoral (Postdoctoral) of Zhongnan Hospital of Wuhan University (grant no. ZNYB2019003).
Supplementary Material
Supplementary Table S1
Supplementary Figure S1
References
Supplementary Material
Please find the following supplemental material available below.
For Open Access articles published under a Creative Commons License, all supplemental material carries the same license as the article it is associated with.
For non-Open Access articles published, all supplemental material carries a non-exclusive license, and permission requests for re-use of supplemental material or any part of supplemental material shall be sent directly to the copyright owner as specified in the copyright notice associated with the article.
