
Abstract
Establishing epigenetic signature to improve the accuracy of survival prediction and optimize therapeutic strategies for laryngeal squamous cell carcinoma (LSCC) by a genome-wide integrated analysis of methylation and the transcriptome. LSCC DNA methylation datasets and RNA sequencing datasets were acquired from the Cancer Genome Atlas (TCGA). MethylMix was applied to detect DNA methylation-driven genes (MDGs), which developed an epigenetic signature. The predictive accuracy and clinical value of the epigenetic signature were evaluated by receiver operating characteristic and decision curve analysis, and compared with tumor-node-metastasis (TNM) stage system. In addition, prognostic value of the epigenetic signature was validated by external Gene Expression Omnibus (GEO) database. According to five MDGs of epigenetic signature, the candidate small molecules for LSCC were screen out by the CMap database. A total of 88 DNA MDGs were identified, five of which (MAGEB2, SUSD1, ZNF382, ZNF418, and ZNF732) were chosen to construct an epigenetic signature. The epigenetic signature can effectively divide patients into high-risk and low-risk group, with the area under curve (AUC) of 0.8 (5-year overall survival [OS]) and AUC of 0.745 (3-year OS). Stratification analysis affirmed that the epigenetic signature was still a significant statistical prognostic model in subsets of patients with different clinical variables. Multivariate Cox regression analysis indicated that the efficacy of epigenetic signature appears independent of other clinicopathological characteristics. In terms of predictive capacity and clinical usefulness, the epigenetic signature was superior to traditional TNM stage. In addition, the epigenetic signature was confirmed in external LSCC cohorts from GEO. Finally, CMap matched the 10 most significant small molecules as promising therapeutic drugs to reverse the LSCC gene expression. An epigenetic signature, with five DNA MDGs, was identified and validated in LSCC patients by integrating multidimensional genomic data, which may offer novel research directions and prospects for individualized treatment of patients with LSCC.
Background
As an aggressively malignant neoplasm, laryngeal squamous cell carcinoma (LSCC) is one of the most prevalent cancers in head and neck region, and represents 85–95% of all laryngeal cancer (Unsal et al., 2018). According to the American Cancer Society, the estimated respective new cases and new death are 13,150 and 3710 annually, with incidence and mortality rates of 4.0 and 1.1 per 100,000, respectively (Siegel and Miller, 2020). More than 50% of LSCC patients have progressed to the locally advanced stage or metastasis when they are diagnosed due to the absence of the early asymptomatic nature of this cancer, which affects the prognosis of patients (Cooper et al., 2004). Although treatments have improved during the past decades, long-term survival outcome remains unsatisfactory, with 5-year survival rate only around 60% in the United States (Hoffman et al., 2006). Thus, it is of great importance to ascertain novel biomarkers for valuable molecular targeted therapy and establish predictive models to optimize therapeutic strategies in LSCC patients.
LSCC is a heterogeneous disease in terms of therapeutic response and clinical prognosis. To a certain extent, clinical heterogeneity can be related to distinct molecular subtypes by gene expression patterns (Cui et al., 2019). RNA expression profiles usually exhibit relative stochastic and rapid variations, which can be directly related to important pathways in malignant cells. DNA methylation that serves as a major epigenetic modification that is involved in the transcriptional regulation of genes and maintains the stability of the genome is less variable and semistable, but shows large variations linked to the activity of cellular processes. Therefore, the combination of transcriptome and epigenetic status would be helpful to identify new markers and improve the accuracy of prognosis. Moreover, changes in DNA methylation with a high level of plasticity allows tumor cells to quickly adapt to changes in metabolic restrictions or physiology during the process of tumorigenesis (Stefansson et al., 2015; Teschendorff et al., 2016). Hence, it is reasonable to analyze the DNA methylation pattern in the tumor cells to find novel therapeutic targets and predictors for survival in LSCC patients.
The availability of high-throughput genomic assays such as RNA sequencing (RNA-seq) and DNA methylation-seq have opened the possibility for a comprehensive characterization of all molecular alterations of cancers, leading to the discovery of new biomarkers of clinical and therapeutic value (Bao et al., 2019). In the present study, we performed a genome-wide integrated analysis of methylation and the transcriptome to characterize the crosstalk between DNA methylation and RNA regulation for patients with LSCC in The Cancer Genome Atlas (TCGA) database. We identified methylation-driven genes (MDGs), then developed an epigenetic signature capable of predicting the overall survival, and further screen correlated small molecule target drugs. The proposed epigenetic signature was validated in external datasets from the Gene Expression Omnibus (GEO) database. In addition, we assessed the predictive ability and clinical application of the epigenetic signature and compared it to the tumor-node-metastasis (TNM) stage.
Materials and Methods
Sample selection and data processing
We downloaded DNA methylation (111 LSCC samples and 12 normal samples), RNA-seq profiles (117 LSCC samples and 16 normal samples) and clinical information data (Supplementary Data S1) of LSCC patients from TCGA, which recorded before February 14, 2020. Excluding the unavailability of DNA methylation or gene transcriptome datasets or overall survival (OS) time <1 month, as a result, a total of 109 LSCC patients were enrolled in this analysis. The GSE65858 microarray dataset includes 270 head and neck squamous cell carcinoma (HNSCC) specimens, 52 specimens of them is LSCC with gene expression profiles and the associated clinical characteristics (Supplementary Data S2). The clinical endpoint was OS, defined as the time from surgery to death. Besides, patients who were alive at last follow-up are considered as censored observations. All data were normalized in the R computing environment using the edgeR package or Limma package. Methylation data were in the form of β value, representing the ratio of the methylation probe data versus total probe intensities. Then, the average DNA methylation value for all CpG sites correlated with a gene was calculated and merged into a matrix with the function of TCGA-Assembler. Data were utilized according to the data access policy of TCGA and GEO. All analyses were conducted per relevant regulations and guidelines.
Another in-house dataset, including 50 LSCC tissues and paired adjacent normal tissues were collected from patients who underwent surgery at Affiliated Cancer Hospital & Institute of Guangzhou Medical University between April 2011 and December 2015. No recruited patients received any preoperative treatment. All tissue samples were blocked of formalin-fixed paraffin-embedded material and stored at 2–8°C with desiccation until use for later experiments. All patients were followed-up regularly from completion of surgical therapy to July 2020. The studies involving human tissue samples were reviewed and approved by the Research Ethics Committee of Affiliated Cancer Hospital & Institute of Guangzhou Medical University, and complied with the Declaration of Helsinki. All patients were aware of the present study and signed an informed consent agreement.
Identification of DNA methylation-driven genes
The MethylMix R package was used for analysis that integrated DNA methylation data for 117 LSCC samples and 16 normal samples and paired gene expression data for 111 LSCC samples to appraise DNA methylation events that have a significant impact on the expression of the corresponding gene, indicating that the gene is a DNA MDG. A total of three procedures of MethylMix analysis were described in previous studies (Long et al., 2019). In addition, the differential methylation value, where gene with a positive differential methylation value signifies hypermethylation and gene with a negative differential methylation value signifies hypomethylation, can be applied in subsequent analysis.
Functional enrichment and pathway analysis of MDGs
Gene ontology (GO) analysis, including the molecular function (MF), biological process (BP), and cellular component (CC), was performed on identified MDGs using the DAVID database, which provides integrative and systematic annotation tools for uncovering biological meaning of genes. Also, we used GOplot R package to visualize the result. In addition, pathway analysis was carried out for the MDGs with ConsensusPathDB, which is a functional molecular interaction database, integrating information on gene regulation, signal transduction, biochemical metabolism, protein interacting, and genetic interacting signaling in humans. Humancyc, Kegg, Reactome, Wikipathways, Smpdb, Biocarta, and Signalink were selected for subsequent analysis. p < 0.05 was set as the threshold value.
Construction and verification of an epigenetic signature
First, univariable Cox regression analysis is utilized to select prognostic-related MDGs with p < 0.05 as the threshold. After primary filtering, the prognostic-related MDGs were all assembled into multivariate Cox regression model, and then an epigenetic
The epigenetic signature risk score was generated through a linear combination of the expression levels of independent DNA MDGs using coefficients from multivariate Cox regression as the weights. On the basis of the median risk score, LSCC patients were classified into two cohorts (high-risk cohorts and low-risk cohorts). Survival differences between high-risk group and low-risk group were assessed by Kaplan–Meier survival analysis and then compared by the log-rank test. Time-dependent receiver operating characteristic (ROC) curves by means of the timeROC package were applied to evaluate predictive performance. Also, stratified analysis base on various clinical characteristics is conducted to evaluate the discrimination ability of epigenetic signature. Importantly, the GSE65858 dataset from the GEO database was applied to validate the predictive value of the epigenetic signature.
Gene set enrichment analysis
We downloaded gene set enrichment analysis (GSEA) software from the GSEA website. One hundred nine LSCC patients were categorized into high-risk cohorts and low-risk cohorts, which was served as the phenotypes. Gene sets related to biosignaling on MSigDB could be found on the GSEA home as reference gene sets. Each analysis was repeated 1000 times according to the default weighted enrichment statistical method. Statistically significant pathways were screened based on the false discovery rate (FDR) <0.25, |enriched score| > 0.35, and gene size ≥35 as the cutoff criteria.
Independence of the epigenetic signature from clinicopathological features
We carried out univariate and multivariate Cox regression analyses to adjudicate whether the predictive ability of the epigenetic signature may be independent of other clinicopathological characteristics (including smoke history, alcohol history, age, sex, number of positive lymph nodes (LNs), number of LNs, lymph node ratio, margin status, lymphovascular invasion, histologic grade, TNM stage, N status, T stage, mutation count, and fraction genome altered) of LSCC patients in TCGA database.
In addition, we validate whether the epigenetic signature remains independent of other clinical features in GSE65858 database (including smoke history, alcohol history, age, sex, pack years, HPV status, treatment modalities, TNM stage, N status, and T stage).
Comparison of predictive performance and clinical usefulness between epigenetic signature and TNM stage
ROC analysis by means of the survivalROC package was carried out to investigate and compare the discrimination ability of the epigenetic signature with traditional TNM staging in TCGA and GEO database. Decision curve analysis (DCA) by means of the stdca.R was used to evaluate the clinical usefulness and net benefit of the epigenetic signature, and compared to TNM stage in TCGA and GEO database (Vickers et al., 2016).
Joint survival analysis and methylated loci associated with OS
To further investigate the impact of prognostic-related MDGs on LSCC patients, we carried out joint survival analysis combined methylation and gene expression to identify hub genes associated with prognosis in patients with LSCC by the survival R package. In addition, we retrieved relevant loci for prognostic-related MDGs from downloaded LSCC methylation data. We merged the value of corresponding methylated sites into one matrix and conducted univariate Cox analysis to select potential prognosis methylated loci. p < 0.05 was regarded as statistically significant.
Identification of candidate small molecule agents
The CMap database, which collects more than 7000 gene expression profile changes induced by various small molecular drugs, was adopted to investigate candidate small molecule agents for treatment in LSCC patients. Five prognostic-related MDGs of epigenetic signature were divided into downregulated and upregulated groups, which were uploaded into CMap database to screen related active small molecule agents. Then, the enrichment scores were calculated, which signify that similarity rang from −1 to 1. A negative connectivity score (closer to −1) indicated higher similarity between the genes, which represents potential therapeutic value, whereas a positive connectivity score (closer to +1) demonstrates that the matched small molecule can induce the state of LSCC cells.
Immunohistochemistry and independent verification
Immunohistochemistry (IHC) was performed on 50 pairs of tumor and paracarcinoma tissues. The tissue core size is 0.6 mm, which was removed from fixed paraffin-embedded tissue blocks. Each tumor sample was punched in triplicate, along with a core of nontumoral mucosal tissue punched far away from the tumor (at least 2 mm distant from tumor areas). Sections of the array were cut at 5 μm and placed on glass slides. Negative control slides omitting primary antibody were created for all assays. Sections of human small intestine were used as internal positive controls. A traditional immunohistochemical staining protocol was used in this study. After being blocked with 10% goat serum for 30 min, the section was incubated with corresponding antibody (1:100 dilution; Abcam, MA, USA) overnight at 4°C, followed by a peroxidase-labeled secondary antibody.
Staining score given by the two independent investigators were averaged for further comparative evaluation of MAGEB2, SUSD1, ZNF382, ZNF418, and ZNF732 expression. Cell proportion was scored as follows: 0 (no positive tumor cells); 1 (<10% positive tumor cells); 2 (10–35% positive tumor cells); 3 (35–70% positive tumor cells) and 4 (>70% positive tumor cells). Staining intensity was graded according to the following criteria: 0 (no staining); 1 (weak staining, light yellow); 2 (moderate staining, yellow brown), and 3 (strong staining, brown). Staining score was calculated as the product of staining intensity score and the proportion of positive cells. Based on this method of assessment, MAGEB2, SUSD1, ZNF382, ZNF418, and ZNF732 expression in LSCC tissues and paired adjacent normal tissues was evaluated by the staining score, with scores of 0, 1, 2, 3, 4, 6, 8, 9, or 12. Score was compared by paired t-test in different two groups. In addition, the epigenetic signature (five MDGs) risk score was calculated via staining score of MDGs multiplied by coefficients from multivariate Cox regression as the weights. On the basis of the median risk score, LSCC patients were classified into two cohorts (high-risk cohorts and low-risk cohorts). Survival differences between high-risk group and low-risk group were assessed by Kaplan–Meier survival analysis and then compared by the log-rank test. Time-dependent ROC curves by means of the timeROC package were applied to evaluate predictive performance.
Statistical analysis
R software (R version 3.5.2) and SPSS statistics 22.0 were utilized to conduct the statistical analysis. A two-sided p < 0.05 would be recognized as statistically significant except for where a certain p value has been given.
Results
Identification of MDGs, functional enrichment, and pathway analyses
Based on three matrices and steps of MethylMix, in total, 88 genes, 77 hypermethylated genes, and 11 hypomethylated genes, were defined as the epigenetic drivers with Cor <−0.3, |logFC| > 0and p < 0.05 (Supplementary Data S3). The GO term enrichment analysis for MDGs shows the top six clusters of enriched sets with significant differences (p < 0.05) (Supplementary Fig. S1). As to MF, MDGs were mainly involved in nucleic acid binding, metal ion binding, and transcription factor activity, sequence-specific DNA binding. For BPs, MDGs were mainly enriched in regulation of transcription, DNA-templated and transcription, DNA-templated. As to CC, MDGs were mainly involved in (CC) intracellular. The results of pathway enrichment analysis indicated that MDGs were most involved in gene expression (transcription), RNA polymerase II transcription and generic transcription pathway (Supplementary Fig. S2).
Construction and verification of an epigenetic signature
Utilizing the univariate Cox regression analysis, we identified five genes, namely MAGEB2, SUSD1, ZNF382, ZNF418, and ZNF732, associated with OS with p < 0.05 from 88 MDGs (Supplementary Data S3). The methylation degree distributions of the five prognostic-related MDGs are displayed in Figure 1 by methylation β mixed model. Figure 2 visualizes that methylation degrees of MAGEB2, SUSD1, ZNF382, ZNF418, and ZNF732 were negatively correlated with respective expressions in LSCC. An epigenetic signature was constructed based on five prognostic-related MDGs, which were all embedded into multivariate Cox regression model. The epigenetic signature risk score was computed as follows: risk score = (0.0864 expression level of MAGEB2) + (0.4621 expression level of SUSD1) + (−0.2150 expression level of ZNF382) + (−0.0929 expression level of ZNF418) + (−0.0817 expression level of ZNF732). A median cutoff risk score was used to classify LSCC patients into a high-risk cohorts (n = 54) and a low-risk cohorts (n = 55) in TCGA database (Fig. 3A). Intuitively, in Figure 3B, the number of deaths was significantly lower in the low-risk cohorts compared with high-risk cohorts. The Kaplan–Meier analysis indicated that in low-risk cohorts, LSCC patients were more inclined to higher OS time than patients in high-risk cohorts (p < 0.001) (Fig. 3C). Time-dependent ROC curves showed that epigenetic signature had a superior prediction capacity, with area under curve (AUC) of 0.80 (5 years OS) and AUC of 0.745 (3 years OS) (Fig. 3D). In addition, stratification analysis was carried out in subsets of patients with different clinical variables (T1-T2 vs. T3-T4, N0 vs. N1-N3, I-II stage vs. III-IV stage, G1-G2 vs. G3-G4, positive margin status vs. negative margin status, and lymphovascular invasion vs. no lymphovascular invasion) for epigenetic signature. In T3-T4, N0 or N1-N3, III-IV stage, G1-G2 or G3-G4, negative margin status, and lymphovascular invasion or no lymphovascular invasion subgroup, the epigenetic signature was still a statistically and clinically prognostic model (Supplementary Figs. S3 and S4). However, in T1-T2, I-II stage and positive margin status subgroup did not reach significant statistics. Noteworthily, external GEO cohorts (GSE65858 database) were utilized to verify the predictive performance of the epigenetic signature. As was displayed in Figure 4, patients with low-risk score were more prone to survival and had higher OS time than patients with high-risk score, which was consistent with the results of the TCGA dataset. Furthermore, the AUC of epigenetic signature (AUC of 5-year OS: 0.756 and AUC 3-year OS: 0.812) confirmed that the predictive accuracy of the prognostic model was satisfactory.
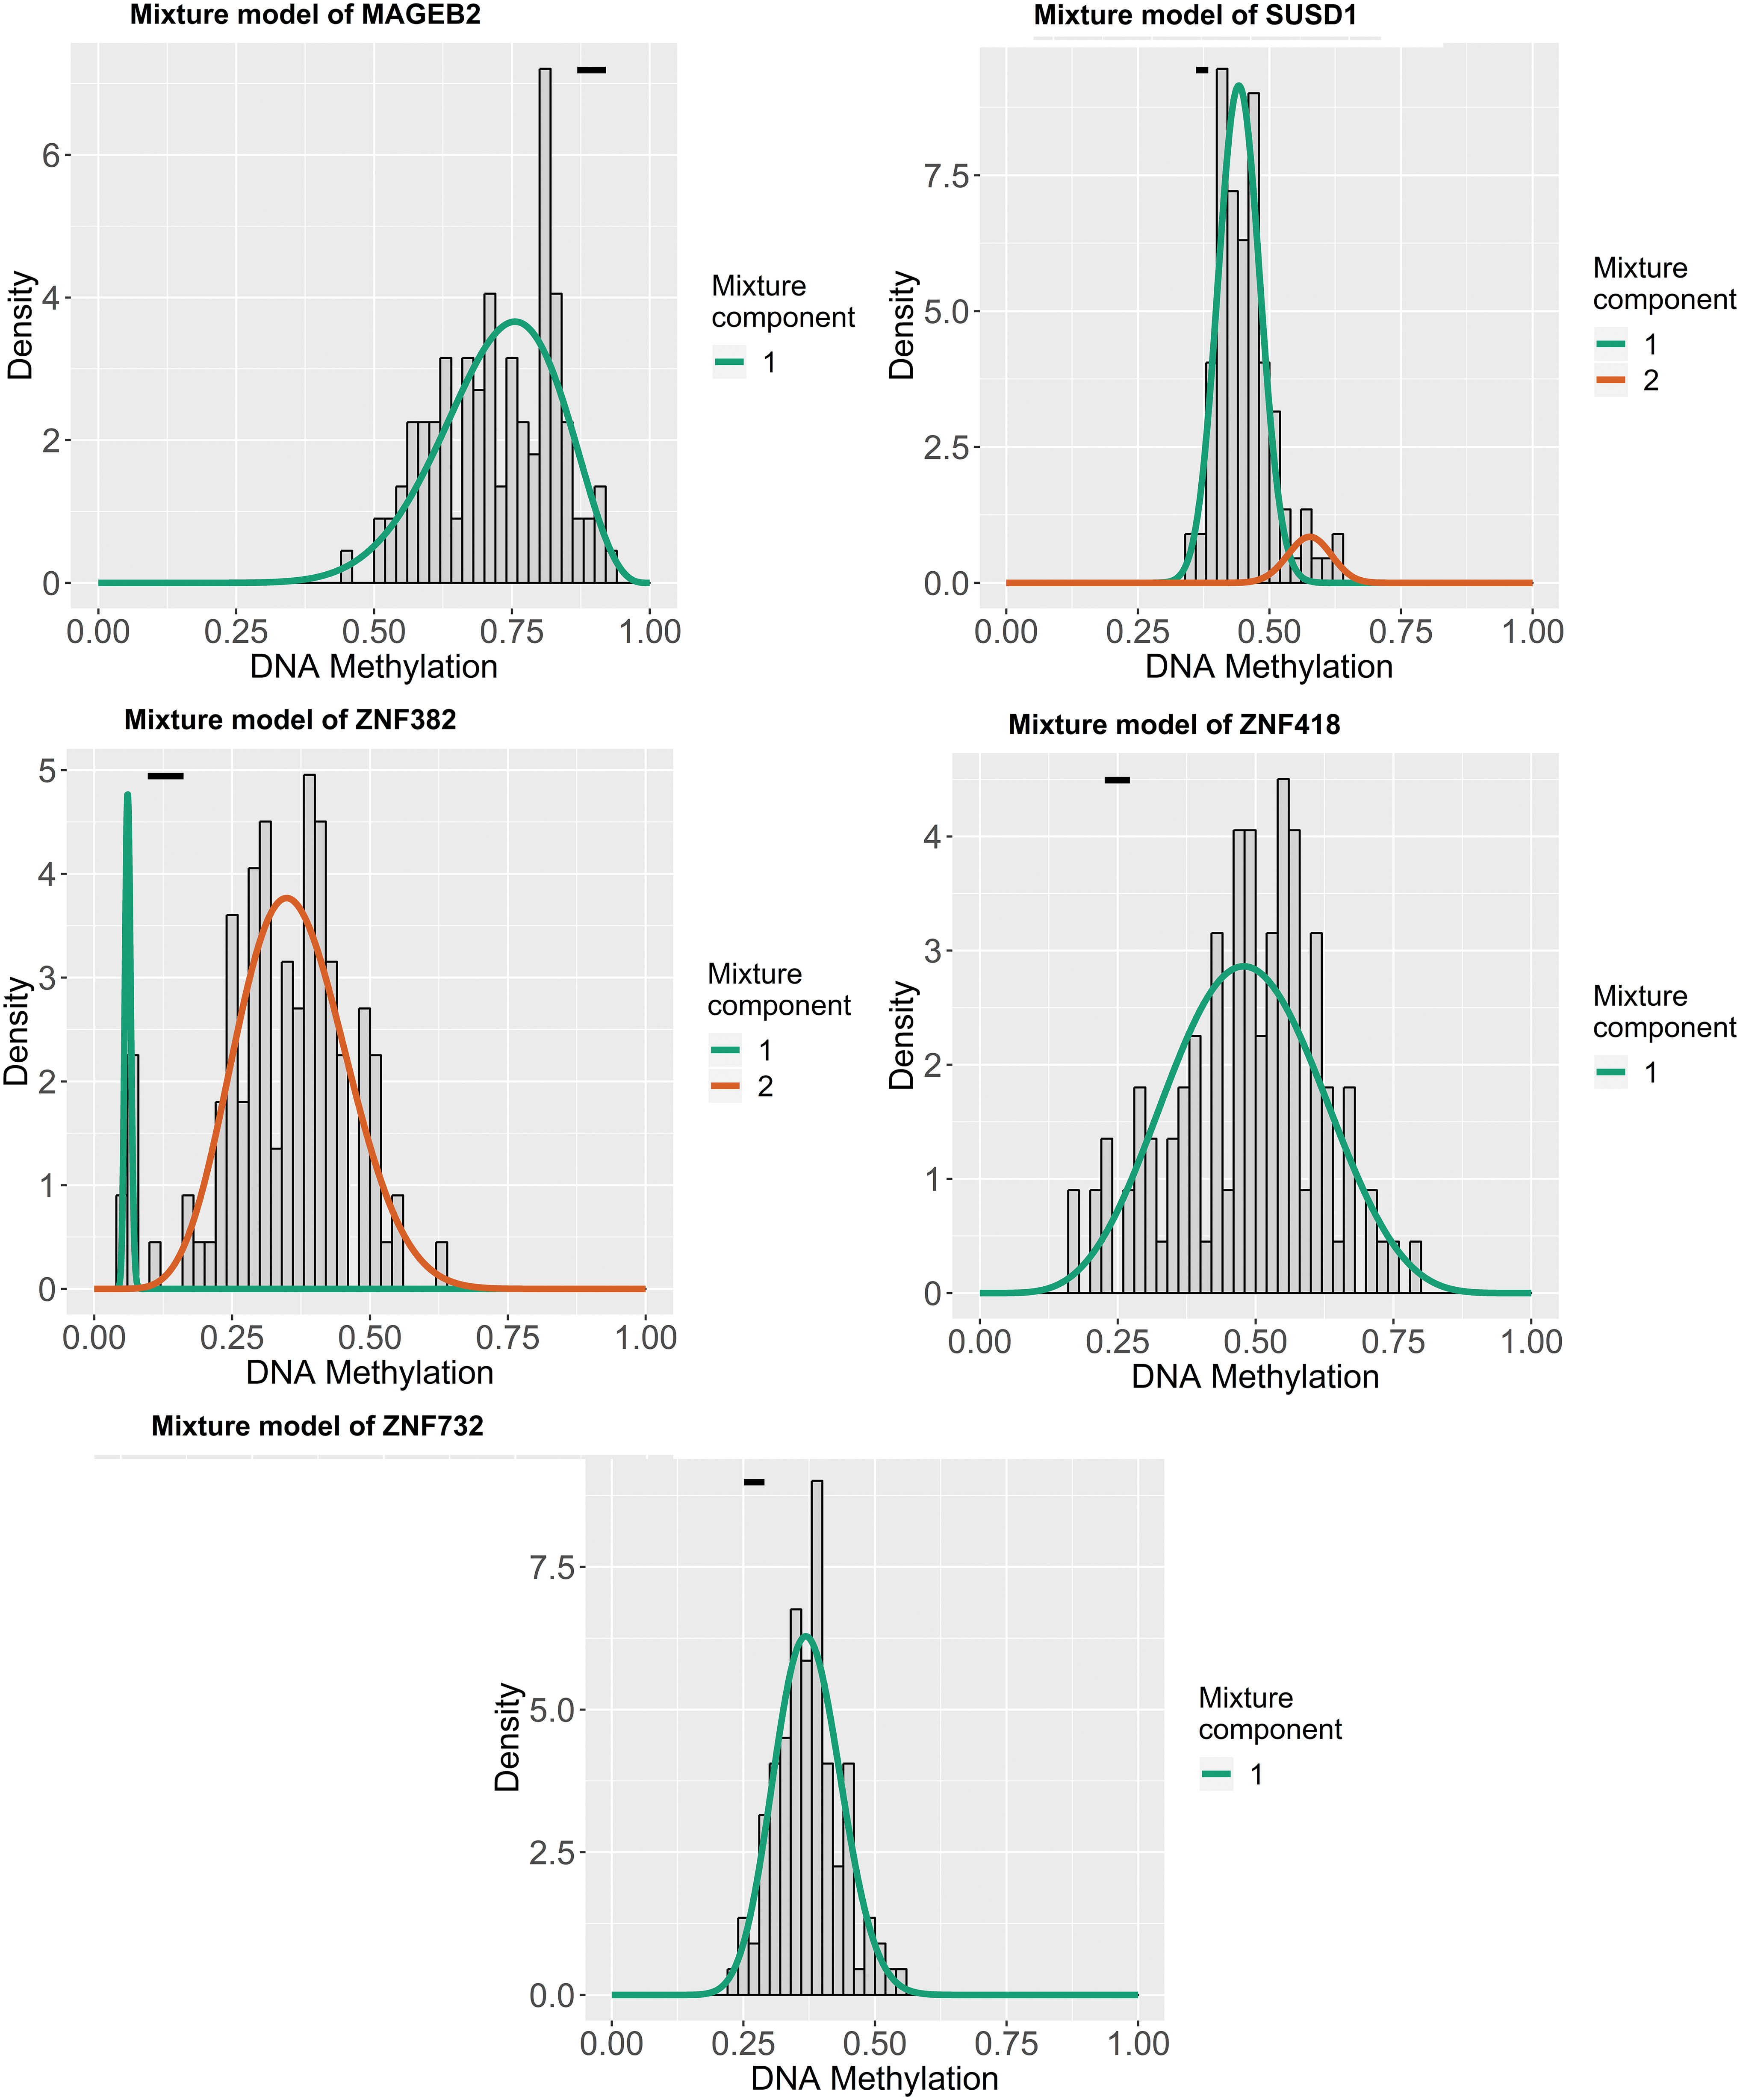
Distribution map of the methylation degree of the five MDGs in the epigenetic signature. The X-axis indicates the degree of methylation, the Y-axis indicates the number of methylated samples, and the histogram shows the subgroups of the methylation distribution in the cancer group. The black horizontal line indicates the methylation degree distribution of the normal samples. The simulated trend of methylation distribution in cancer tissues is represented by the curve. MDG, methylation-driven gene. Color images are available online.

Correlation between the methylation degree and expression of the five MDGs in the epigenetic signature. The X-axis indicates the gene methylation degree β value, and the Y-axis indicates the gene expression level. Color images are available online.
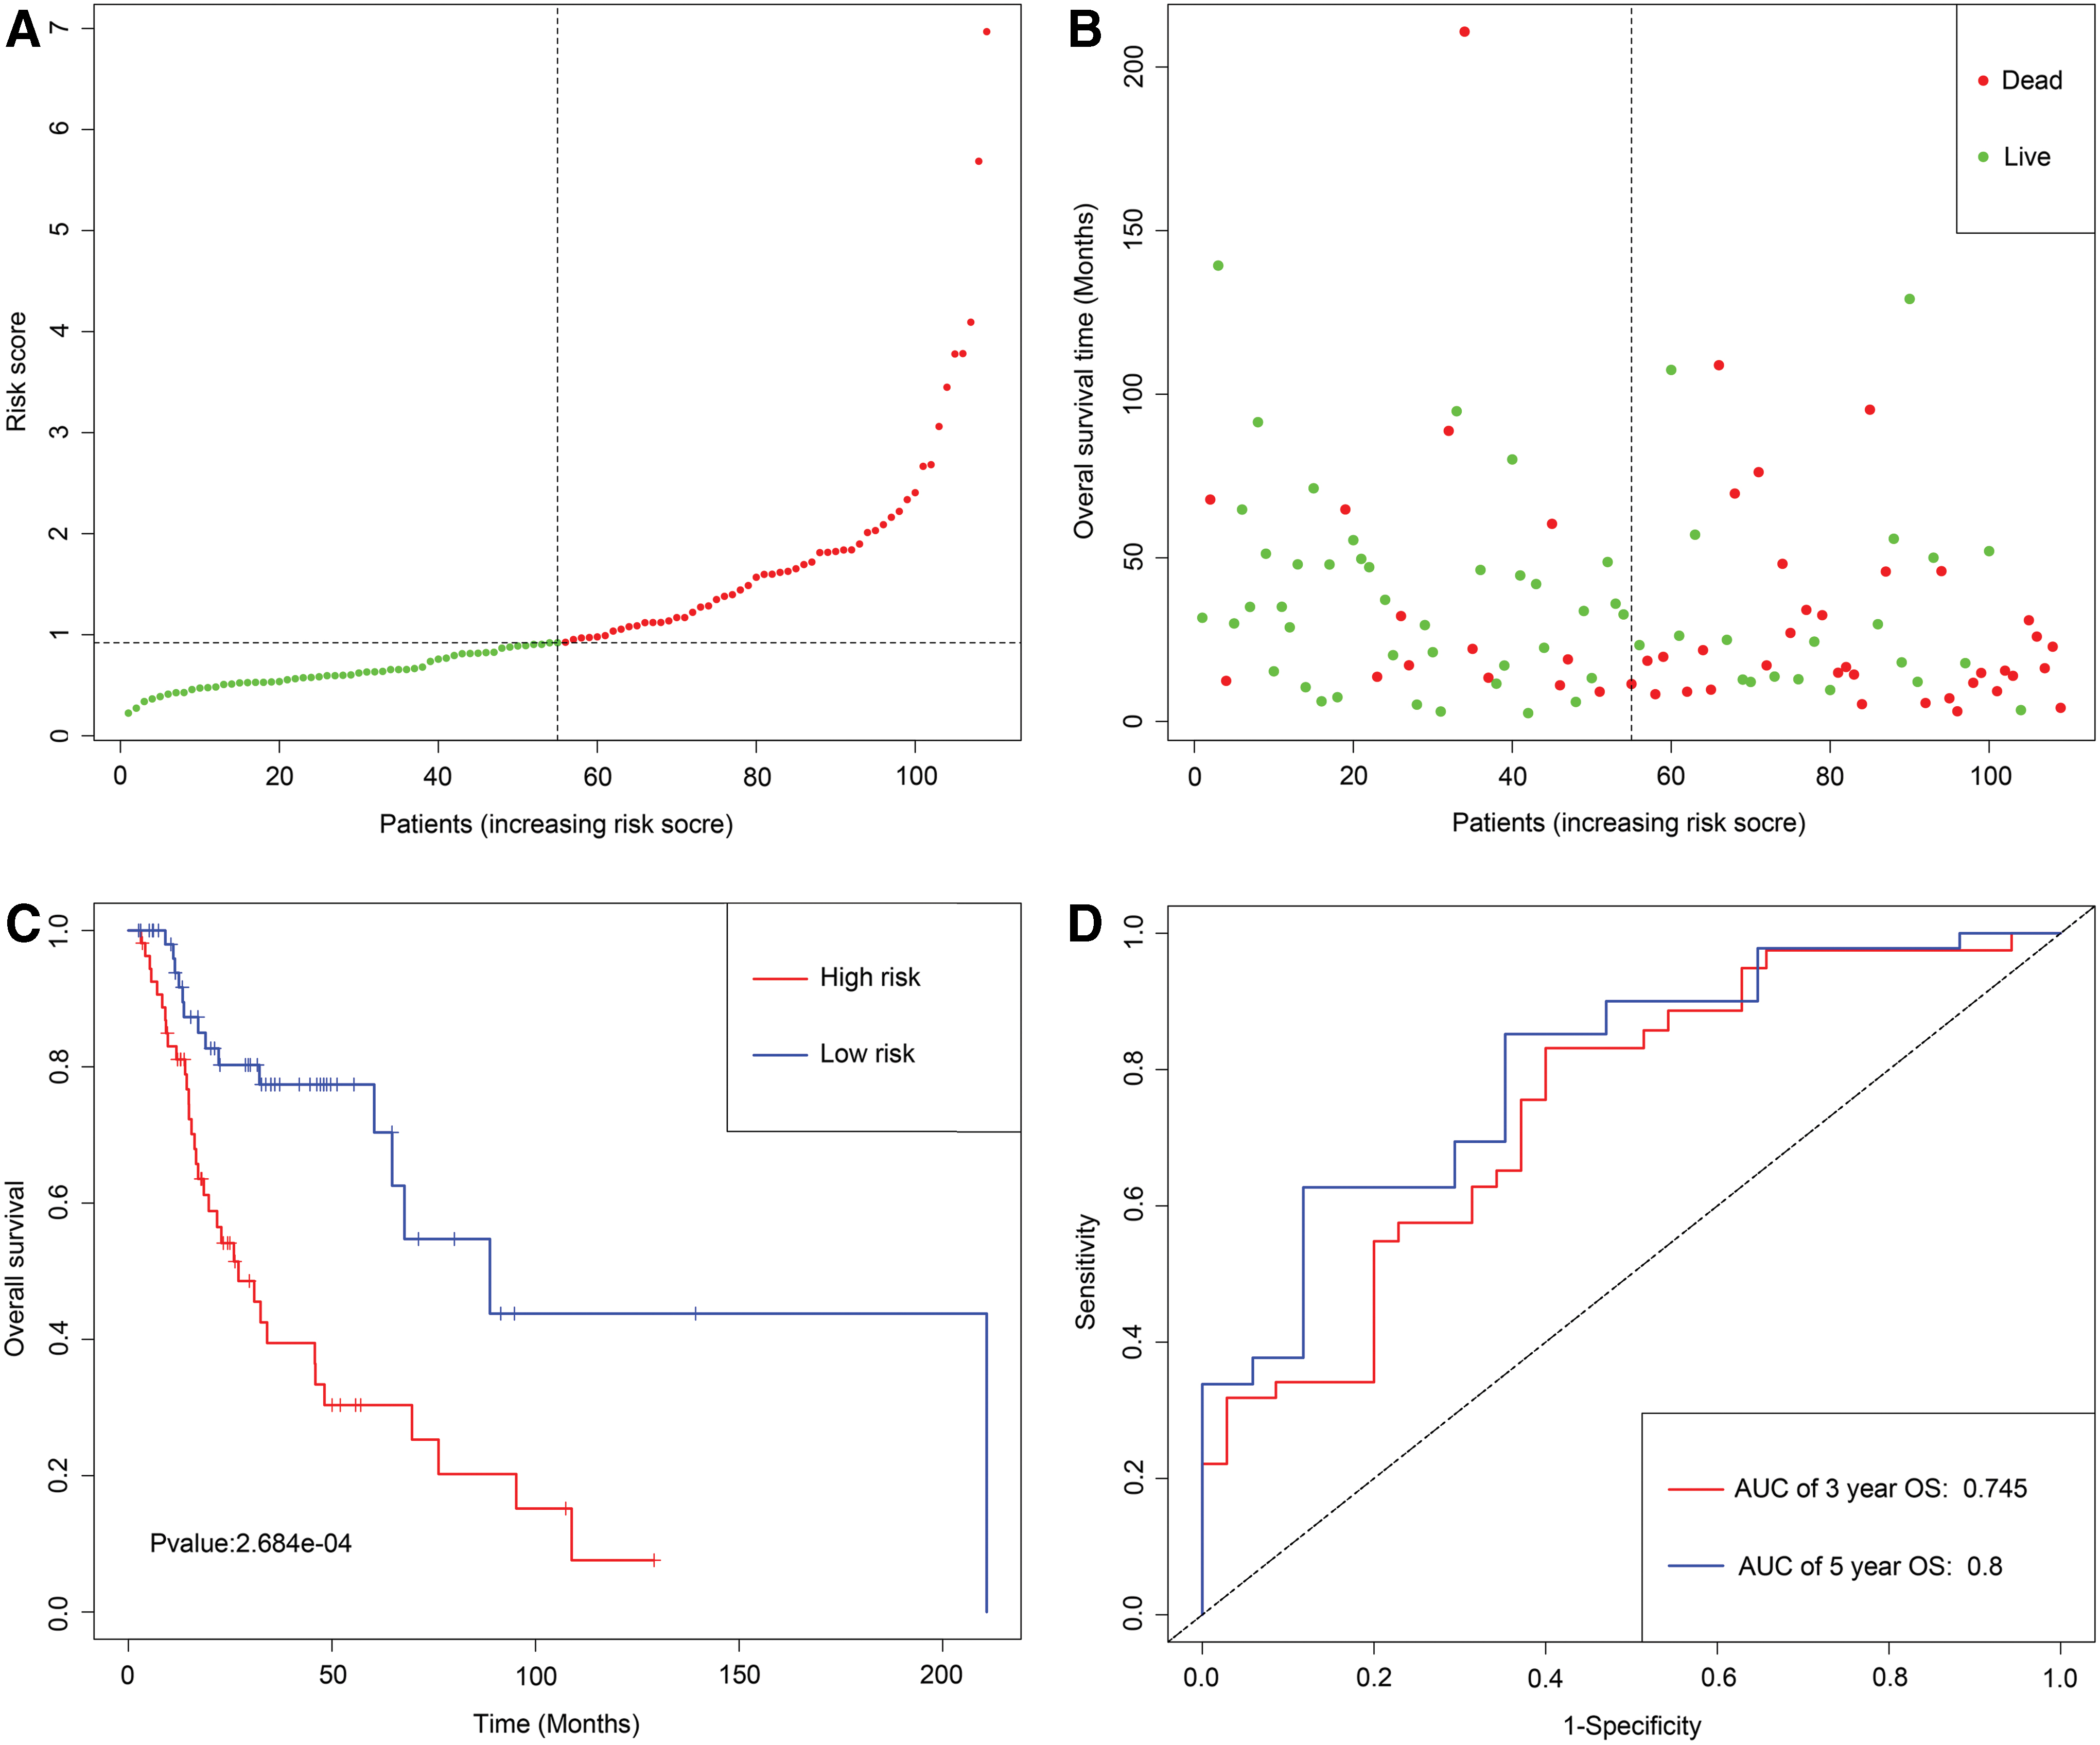
Development of epigenetic signature for prediction of survival in LSCC patients in TCGA database.
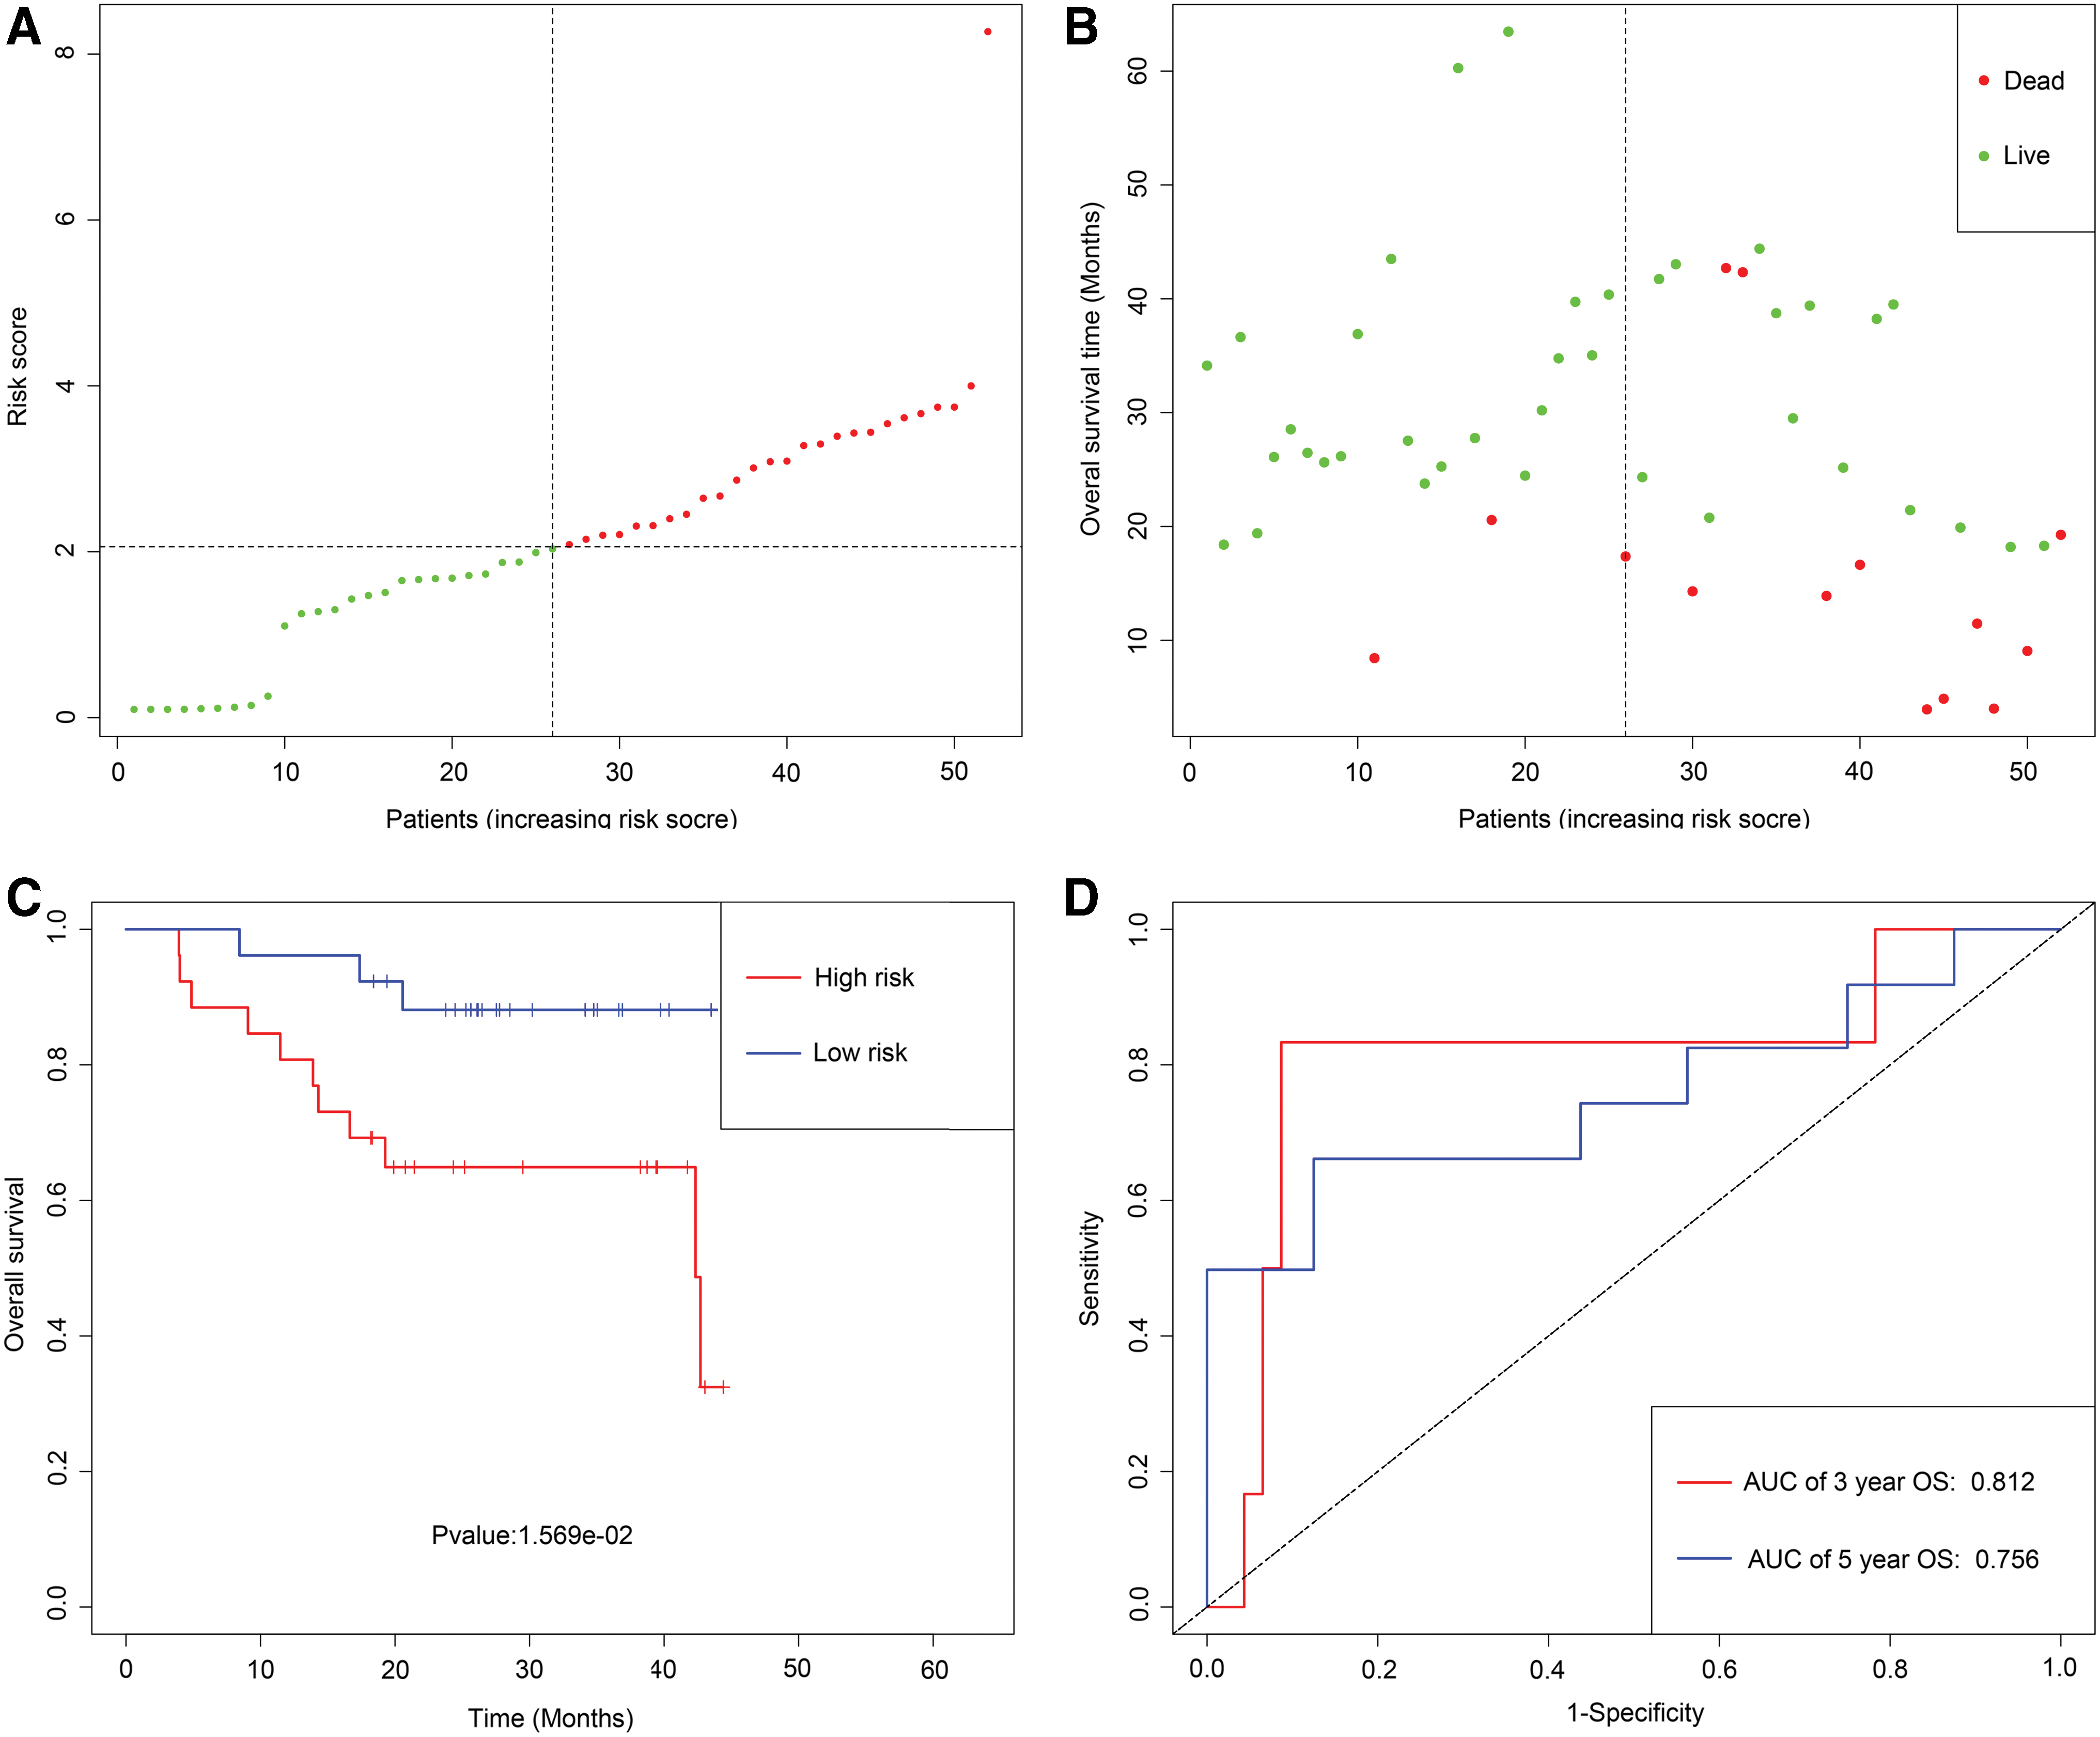
Development of epigenetic signature for prediction of survival in LSCC patients in GEO database.
Gene set enrichment analysis
To investigate potential biological pathways for five prognostic-related MDGs, we carried out the GSEA and revealed that a total of 56 items were significantly enriched with FDR <0.25. The level of risk score for epigenetic signature was considered as the phenotypes, and the findings uncovered that high-risk level of epigenetic signature may closely correlate with several important crosstalk, comprising of JAK-STAT signaling pathway, mismatch repair, P53 signaling pathway, T cell receptor signaling pathway, B cell receptor signaling pathway, basal transcription factors, cell cycle, and ErbB signaling pathway (Fig. 5).
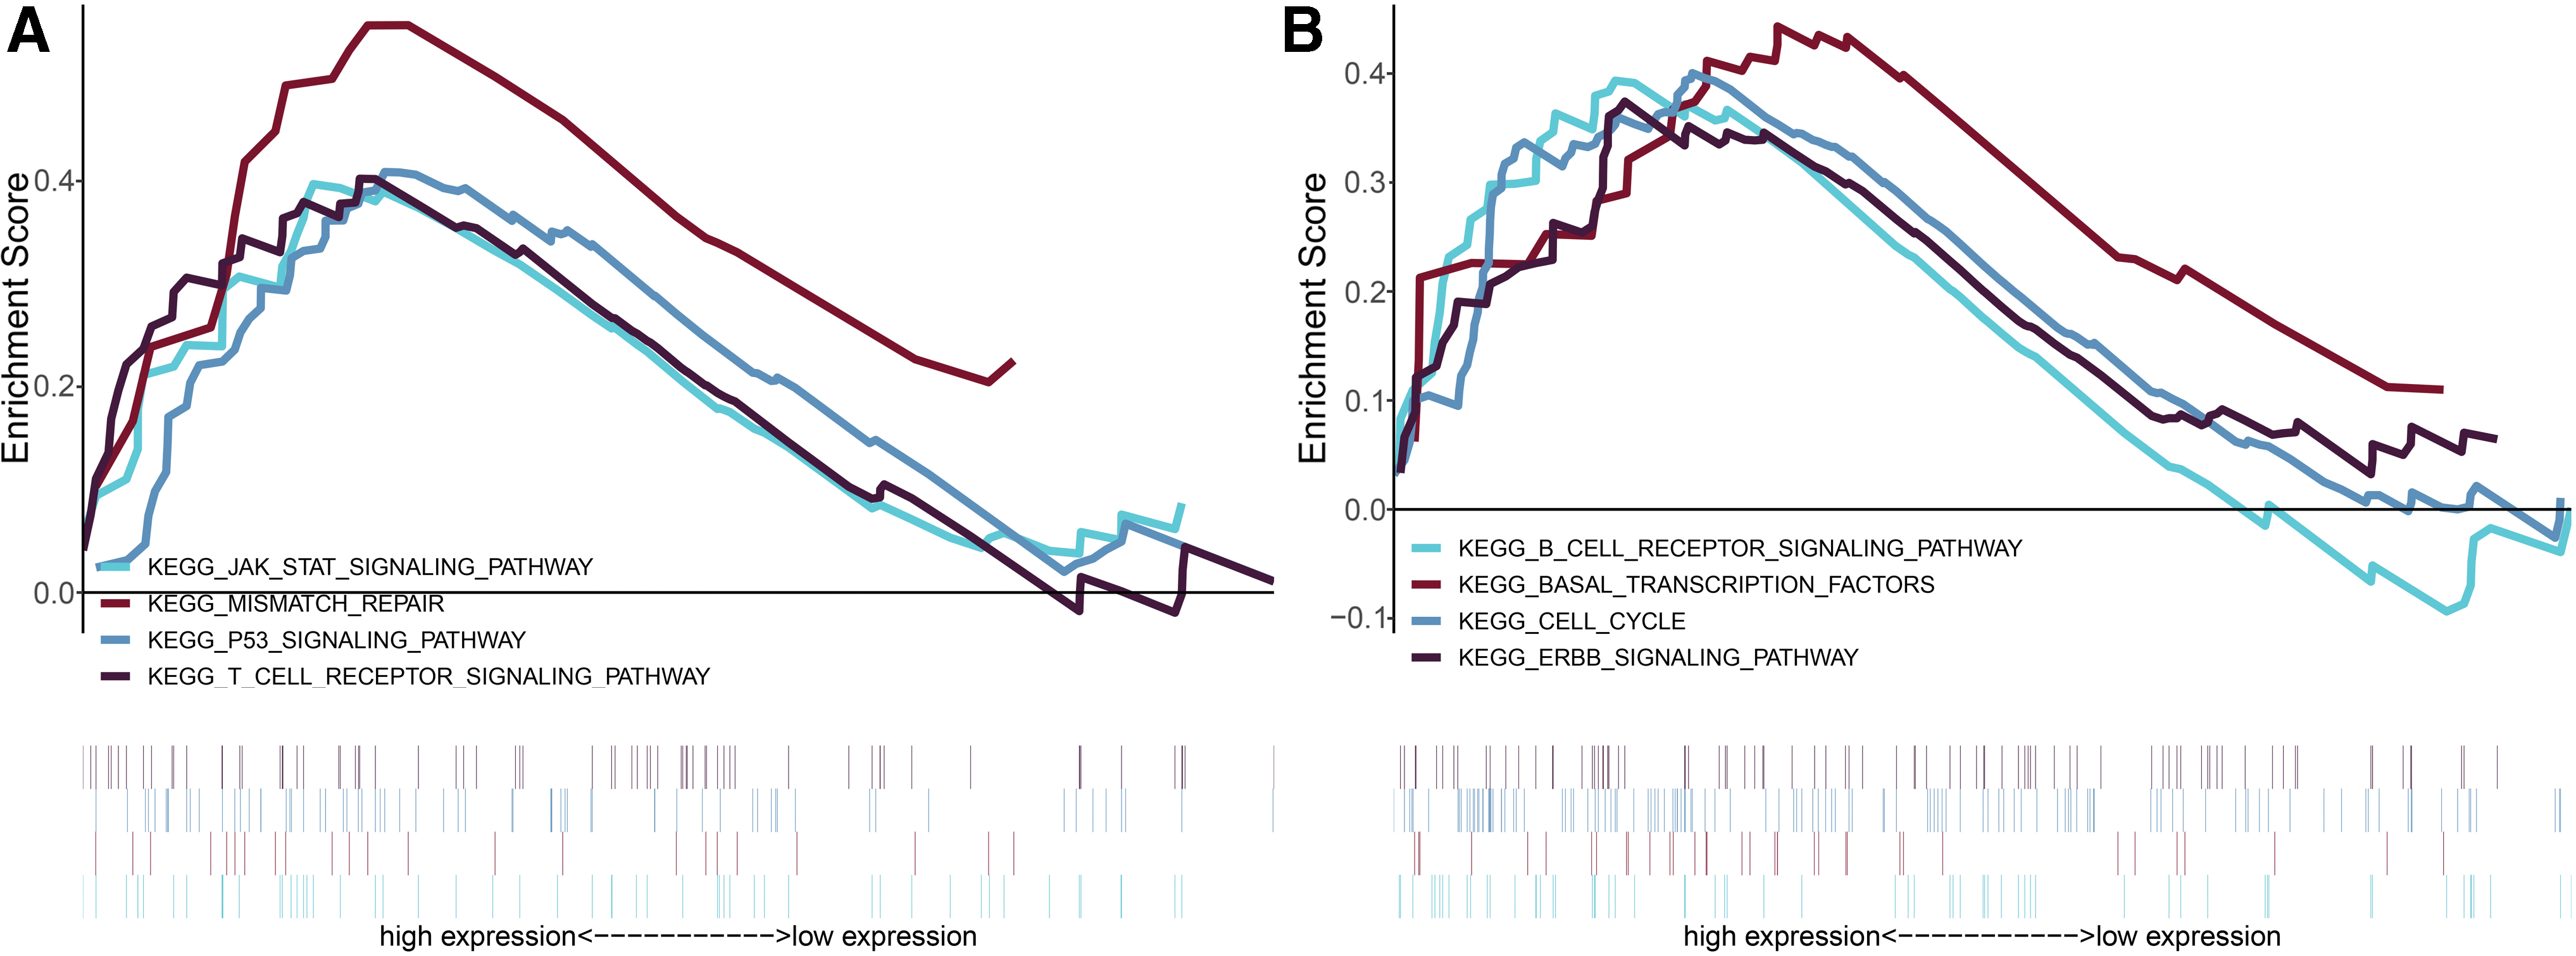
Gene set enrichment analysis for identification of the underlying pathways using risk score as the phenotype
Independence of the epigenetic signature from clinicopathological features
To investigate whether the epigenetic signature is independent of the clinicopathological characteristics in TCGA database, univariate Cox regression analysis found that female, the presence of lymphovascular invasion, positive margin status, and high epigenetic signature risk score were associated with shorter OS (Table 1). Multivariate Cox regression analysis continued to verify that epigenetic signature was an independent predictor of unfavorable OS (hazard ratio [HR]: 1.52, 95% confidence interval [CI]: 1.13–2.04, p = 0.006), after adjustment for other risk variables. In addition, external GEO cohorts (GSE65858 database) were utilized to validate whether the epigenetic signature is also independent of other clinical features. Univariate and multivariate Cox regression analyses were performed, which indicated that the epigenetic signature is a significant independent indicator for OS (HR: 1.88, 95% CI: 1.25–2.83, p = 0.002) by adjusting covariates (Table 2).
Univariable and Multivariable Cox Regression Analysis for Prediction of Overall Survival in The Cancer Genome Atlas Database
These variables were eliminated in the multivariate Cox regression model, so the HR and p values were not available. *p < 0.05.
HR, hazard ratio; CI, confidence intervals; NA, not available; OS, overall survival.
Univariable and Multivariable Cox Regression Analysis for Prediction of Overall Survival in Gene Expression Omnibus Database
These variables were eliminated in the multivariate Cox regression model, so the HR and p values were not available. *p < 0.05.
Comparison of predictive performance and clinical usefulness between epigenetic signature and TNM stage
To evaluate the predictive ability of epigenetic signature, we compared epigenetic signature to AJCC TNM stage model, ROC curve analysis was performed in TCGA database. As was displayed in Figure 6A and B, the AUC of epigenetic signature for predicting 5- and 3-year OS were 0.795 and 0.759, respectively, while that of TNM stage model were 0.543 and 0.541, respectively. Similar results were also found in the GEO cohorts. The AUC of epigenetic signature for predicting 5- and 3-year OS were 0.798 and 0.812, respectively, and the AUC of the TNM stage model were 0.621 and 0.649, respectively (Fig. 6C, D). Finally, the clinical usefulness of the epigenetic signature was measured by the DCA, an abstract statistical concept, which provided visualized information on the clinical value of a model. DCA graphically revealed that the epigenetic signature at diverse cutoff times (5- and 3-year OS) was superior to the traditional TNM staging based on the continuity of potential death threshold (x-axis) and the net benefit of risk stratification using the model (y-axis) in TCGA cohorts and GEO cohorts (Fig. 7).


Joint survival analysis and methylated loci associated with OS
Joint survival analysis, that is, the methylation and gene expression matched evaluation, was additionally conducted to exploit the prognostic value of MAGEB2, SUSD1, ZNF382, ZNF418, and ZNF732. The hypermethylation and low-expression of ZNF382 and ZNF418 exhibited a marked correlation with the poor prognosis of patients with LSCC (Fig. 8C, D); The hypomethylation and high-expression of MAGEB2 and SUSD1 exhibited a conspicuous association with the unfavorable prognosis of patients with LSCC (Fig. 8A, B). Nevertheless, the combination of methylation and expression of ZNF732 did not have a significant effect on the prognosis of LSCC patients (Supplementary Fig. S5). A total of 61 methylation sites (10 methylated sites in MAGEB2, 7 methylated sites in SUSD1, 13 methylated sites in ZNF382, 16 methylated sites in ZNF418, and 15 methylated sites in ZNF732) were screened out and the univariate Cox regression analysis uncovered that 4 key methylation loci (2 specific methylation sites in MAGEB2 and 2 specific methylation sites in ZNF382) were significantly associated with LSCC prognosis (Supplementary Table S1).

Kaplan–Meier survival curves for the joint survival analysis.
Identification of related active small molecules
Table 3 listed the 10 most significant small molecules agents corresponding to gene expression changes of LSCC. Among these small molecules agents, simvastatin (enrichment score = −0.853), thiocolchicoside (enrichment score = −0.888), and parthenolide (enrichment score = −0.846) were related to a highly significant negative fraction and possess potential to reverse the tumor status of LSCC.
List of the 10 Most Significant Small-Molecule Drugs That Can Reverse the Tumoral Status of Laryngeal Squamous Cell Carcinoma
IHC and independent verification
The expression of MAGEB2, SUSD1, ZNF382, ZNF418, and ZNF732 in 50 paraffin-embedded tissue samples of LSCC and adjacent nonneoplastic tissues was semiquantitatively examined by IHC (Fig. 9). Staining score analysis revealed that MAGEB2 and SUSD1 have significantly higher expression of LSCC compared to adjacent nonneoplastic tissues (Fig. 10A, B); ZNF382, ZNF418, and ZNF732 have significantly lower expression of LSCC compared to adjacent nonneoplastic tissues (Fig. 10C–E). In addition, based on epigenetic signature risk score, patients were divided into the high-risk group and low-risk group.

MAGEB2

IHC staining score analysis showed that MAGEB2 and SUSD1 are upregulated and downregulated in LSCC compared to expression in adjacent normal mucosa tissues
As is shown in Figure 11A, patients with the high-risk score were more likely to die and had shorter OS time than patients with a low-risk score (p < 0.001). Epigenetic signature had a superior prediction effect, with an AUC of 3-year OS and an AUC of 5-year OS (Fig. 11B).
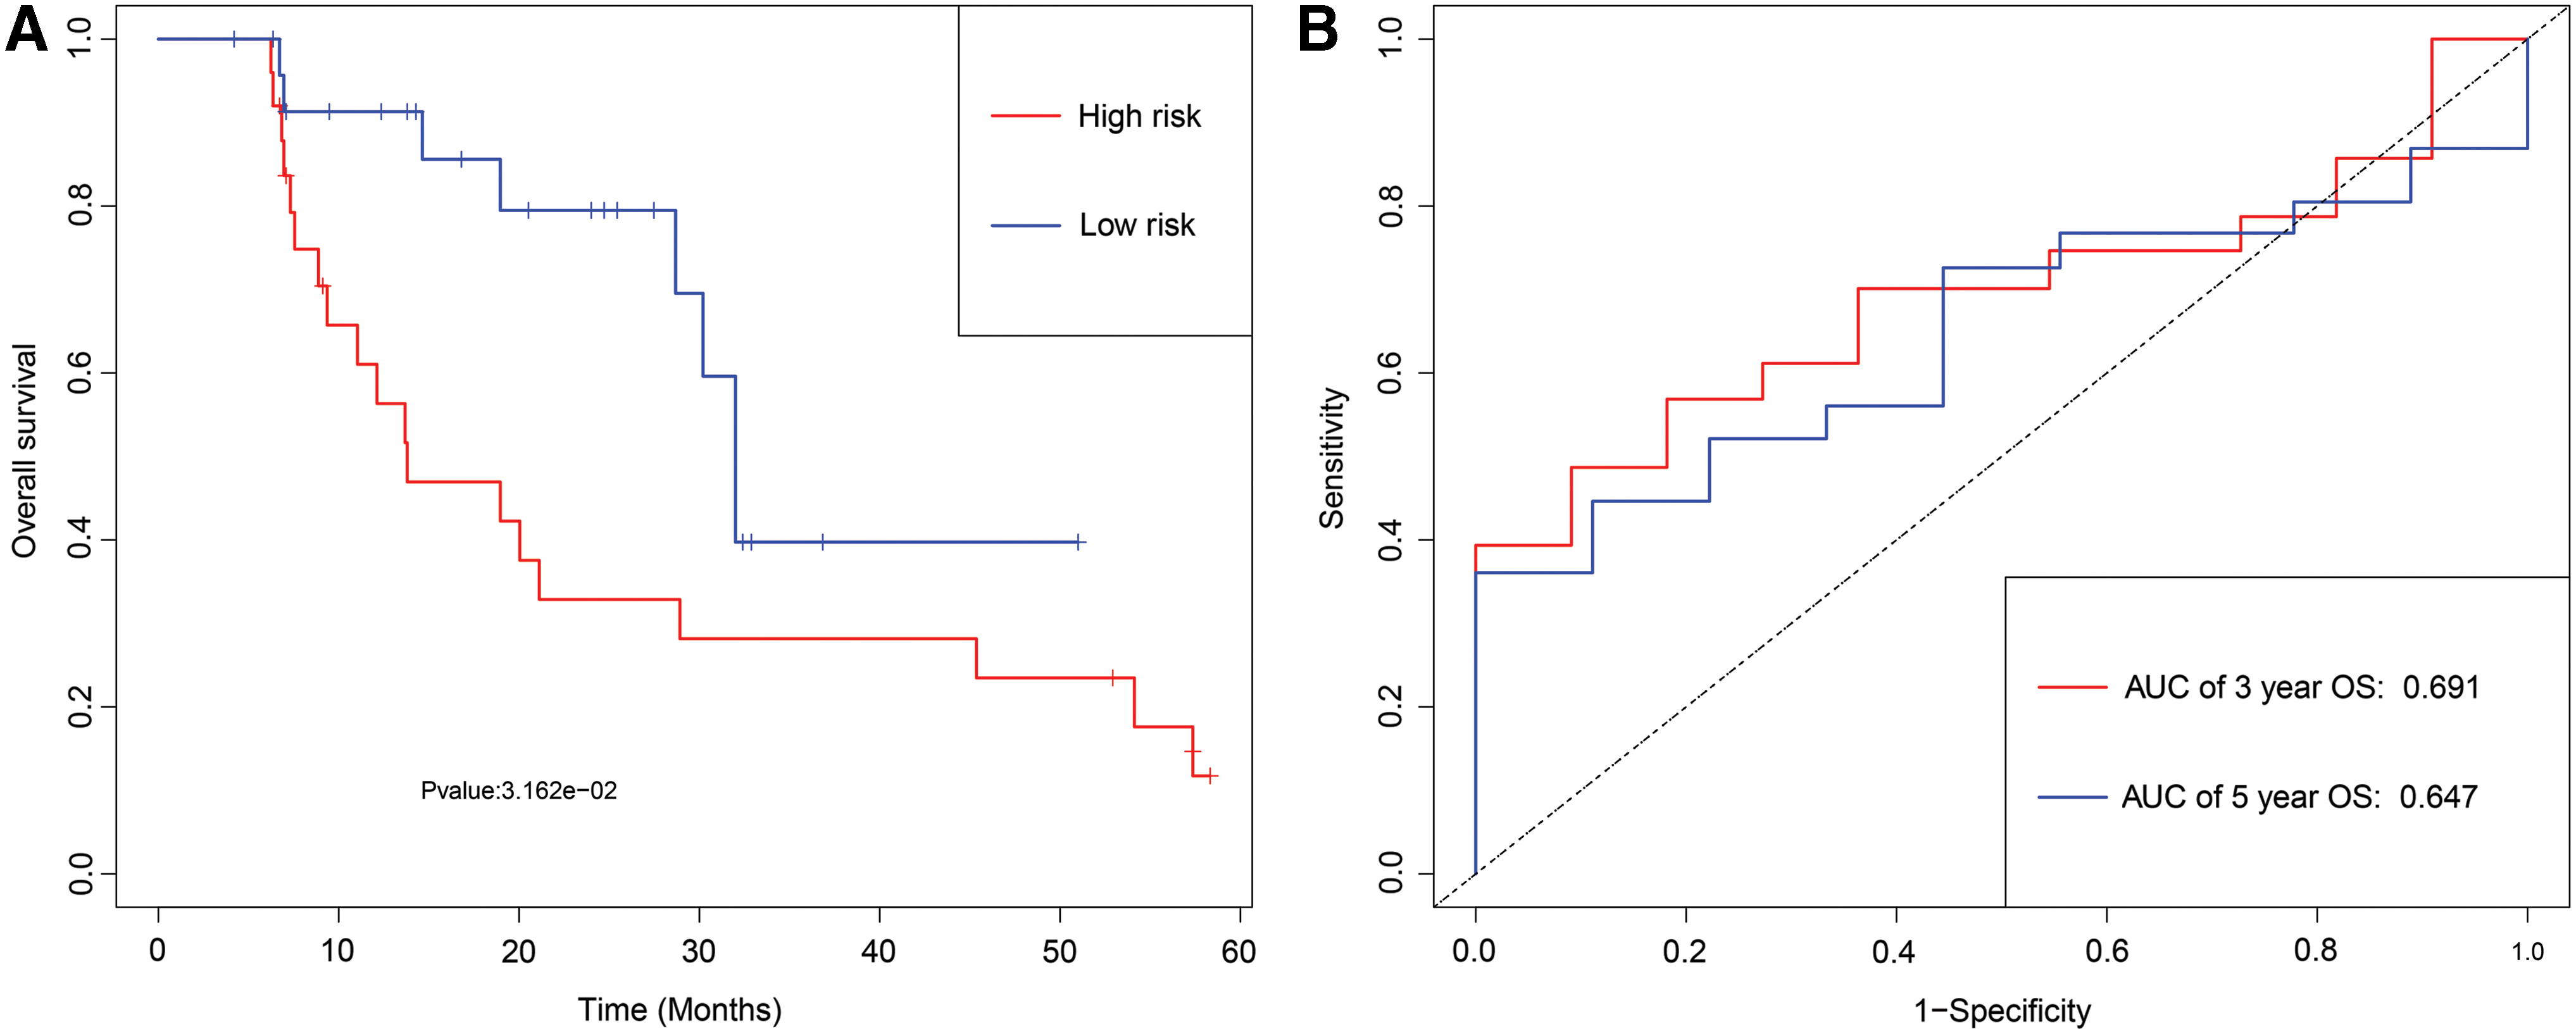
Development of epigenetic signature for prediction of survival in LSCC patients in an institution database.
Discussion
Integrating TCGA LSCC RNA-seq datasets with DNA methylation datasets by MethylMix tools, we identified 88 DNA MDGs. On the basis of these DNA MDGs, we developed an epigenetic signature, which could accurately categorize patients into high-risk status and low-risk status. Stratification analysis verified that the epigenetic signature remained a significant statistical prognostic model in subsets of patients with different clinical variables. Multivariate Cox regression analysis uncovered the efficacy of epigenetic signature appears independent of other clinicopathological characteristics. With respect to predictive capacity and clinical usefulness, the epigenetic signature was superior to traditional TNM stage. In addition, the epigenetic signature was validated in external LSCC cohorts from GEO. Finally, CMap matched the 10 most significant small molecules as promising therapeutic drugs to reverse the LSCC gene expression.
An increasing number of researches recognize that epigenetic changes such as the hypermethylation of tumor suppressor genes and hypomethylation of oncogenes in the diagnosis, progression, and prognosis of LSCC played a critical role (Yang et al., 2012; Shen et al., 2018; Weigel et al., 2019). By quantitative methylation-specific polymerase chain reaction assays in 96 LSCC patients, Shen et al. (2018) revealed that LZTS2 promoter hypermethylation is linked to risk, progression, and prognosis of LSCC, which can serve as a diagnostic and prognostic biomarker for LSCC. Analyzing the LSCC tissues and Hep-2 cells to investigate the methylation status of the CpG islands of MYCT1 and mRNA levels, Yang et al. (2012) identified that hypermethylation contributed to the transcriptional downregulation of MYCT1 and could inhibit cancer cell differentiation in LSCC. By interfering with its binding to c-Myc, DNA methylation of the CGCG site (−695 to −692) of MYCT1 altered the promoter activity in LSCC. Recently, Weigel et al. (2019) concluded a regulatory role of TREX2 DNA methylation for gene expression, which might be an indicative of incidence and survival in LSCC. TREX2 DNA methylation could be a potential predictor of treatment response and as a biomarker to understand carcinogenesis in stratified epithelia. In addition, protein levels of altered TREX2 could influence drug-induced DNA damage repair and offer novel tailored therapies in LSCC. These studies suggested the potential clinical implications of DNA methylation in providing novel biomarkers for valuable molecular targeted therapy and establish predictive models to optimize therapeutic strategies in LSCC patients. Nevertheless, almost all of the studies focused on the methylation status of one gene with limited statistical power in predictive values. Considering the heterogeneity of LSCC, entire molecular signatures derived from high-content genome screens seem to offer better prognostic value.
To our knowledge, this is the first study that carried out a genome-wide integrated analysis of methylation and the transcriptome from TCGA database to seek novel biomarker as potential molecular targeted therapy and to create an epigenetic signature for LSCC patients to optimize therapeutic strategies. When applying high-throughput methodology with 450,000 probes, it is necessary to distinguish the epigenetic changes (“driver”) that act as effectors of the malignant phenotype from alterations of “passenger” without any biologic function (Cedoz et al., 2018). Hence, a model-based tool (MethylMix) was applied to identify those genes with aberrant methylation and related these data to RNA-seq data affecting gene expression. Consequently, we identified a cohort of 88 MDGs in LSCC. The functional analysis indicated that MDGs have mainly attached oneself to gene expression (transcription), RNA polymerase II transcription, transcription factor activity, sequence-specific DNA binding, and so on. It was a hint that DNA methylation is involved in the dysregulation of genes with distinct functions and is functionally linked to outcomes in LSCC patients.
On the basis of univariate and multivariate Cox regression analyses, we selected five MDGs (MAGEB2, SUSD1, ZNF382, ZNF418, and ZNF732) to develop an epigenetic signature. It could effectively classify patients into high-risk group with shorter OS and low-risk group with longer OS in TCGA and GEO database. Remarkably, according to stratified analysis, the epigenetic signature was a statistically and clinically prognostic model in T3-T4, N0 or N1-N3, III-IV stage, G1-G2, or G3-G4, negative margin status, lymphovascular invasion or no lymphovascular invasion subgroup. Yet, in T1-T2, I-II stage and positive margin status subgroup did not reach significant statistics. One possible explanation that a small sample size of T1-T2 or I-II stage or positive margin status subgroup, consisting of less than 20 patients in the different subgroup, are not enough to generate an effect of significant statistics. Besides, univariate and multivariate Cox analysis affirmed that epigenetic signature was an independent predictor of unfavorable OS, regardless of other clinicopathologic variables in TCGA and GEO data set. To explore potential biological pathways for five prognostic-related MDGs, we carried out the GSEA and indicated that five MDGs of epigenetic signature was mainly scattered in cancer-related pathways (JAK-STAT signaling pathway, P53 signaling pathway) and immune-related BPs (T cell receptor signaling pathway, B cell receptor signaling pathway). It implied that five MDGs of epigenetic signature maybe involved in initiation, maintenance, development of LSCC, and associated with outcomes in LSCC patients.
Currently, in the context of the global trend toward organ-preserving treatment for LSCC patients (although total laryngectomy helps disease control and improves survival outcome, it has observed adverse effects on patients' quality of life because of permanent tracheostomy, the loss of voice, and issues with swallowing), pursuant to the newest National Comprehensive Cancer Network (NCCN) Guidelines, decision-making about larynx-preserving are highly relied on tumor TNM staging. In our research, via ROC curve analysis, epigenetic signature showed more precise predictive ability compared with TNM stage model in TCGA and GEO database, which could effectively identify low-risk patients prone to larynx-preserving treatment and avoid needless total laryngectomy. Interestingly, DCA results indicated that LSCC survival-related treatment decisions based on the epigenetic signature led to more net benefit than treatment decisions based on TNM stage, or treating either all patients or none in TCGA and GEO database. Taken together, the current epigenetic signature would be clinically useful for the clinicians in tailoring survival-associated treatment decisions.
One prominent finding in our study was that by combining methylation and RNA expression data with survival analysis, we identified four MDGs (MAGEB2, SUSD1, ZNF382, and ZNF418), which may serve as potential biomarkers or drug targets for early diagnosis and prognostic assessment. MAGEB2, as a member of the MAGEB family, which belongs to the cancer testicular antigens, is located in the last exon on chromosome X. The MAGEB2 gene has been reported to be overexpression in several types of tumors, such as esophageal cancer (Nagashima et al., 2001) and lung cancer (Jang et al., 2001), which has been implicated in carcinogenesis and considered as a potential cancer biomarker (Almstedt et al., 2010). Pattini et al. (2012) indicated that MAGEB2 is activated by promoter demethylation in HNSCC, which has growth-promoting effects on a minimally transformed oral keratinocyte cell line. SUSD1, which encodes the sushi domain-containing protein 1 precursor, acts as a common motif in protein–protein interaction (Komaromi et al., 2011). SUSD1 presented subthreshold associations with venous thromboembolism, which was detailed in a report by Tang et al. (2013). Nevertheless, information regarding the role of SUSD1 in cancer is lacking. ZNF382 (Zinc finger protein 382), a member of the Krüppel-associated box zinc finger protein family, plays critical role in regulating certain downstream gene expression as a transcription inhibitor. Due to the hypermethylation of promoter, ZNF382 is downregulated, thereby leading to inhibition of gene expression as found in multiple tumors (Cheng et al., 2010; Hudson and Buck-Koehntop, 2018). Functional researchers uncovered that ZNF382 was a potential tumor suppressor, via colony formation, inhibition of cell proliferation, invasion, migration, and acceleration of cell apoptosis as well as tumorigenic potential, in various cancers such as hepatocellular carcinoma (HCC), gastric cancer, and esophagus squamous cell carcinoma (Pei et al., 2018; Zhang et al., 2018; Dang et al., 2019). ZNF418 (zinc finger protein 418), a novel Krüppel-associated box/Cys2His2 zinc finger protein, which was involved in critical regulators for the initiation, maintenance, and development of tumor via cell differentiation, tumor suppression, proliferation, and apoptosis (Pu et al., 2017; Hui et al., 2018). Wang et al. (2019) revealed that ZNF418 was identified as a direct target of miR-1204 and mediated the function of miR-1204 in HCC cells, which inhibited HCC progression through MAPK and c-Jun signaling pathways and potentially serves as a new prognostic biomarker and therapeutic target for HCC. Thus, further characterization of molecules such as MAGEB2, SUSD1, ZNF382, and ZNF418 will provide a new perspective for the development and progress of LSCC, and aided to find potential therapeutic targets for LSCC patients.
Another prominent finding in our study was that we identified a set of potential small-molecule drugs that mimic the expression of normal cellular genes, analyzing the MDGs in CMap database. Small-molecule drugs with a highly significant negative enrichment value possessed the potential to alter the gene expression of LSCC and thus inhibiting the progression of tumors. Simvastatin, as a type of statin, specific inhibitors of 3-hydroxy-3-methylglutaryl coenzyme A (HMG-CoA) reductase, is frequently utilized to treat hypercholesterolemia and prevent cardiovascular diseases. A growing number of researches have reported simvastatin-related potentially beneficial effects in cancers, including prostate cancer, breast cancer, ovarian cancer, and adenocarcinoma (Ogunwobi and Beales, 2008; Liu et al., 2009; Parikh et al., 2010; Feldt et al., 2015). Recently, Ma et al. (2019) revealed that simvastatin induced cell cycle arrest in the G1 phase in C666-1 cells via decreasing the expression of cyclin-dependent kinase 4 (CKD4) and cyclin D1, and increasing p27 expression in C666-1 cells. Simvastatin treatment inhibited protein kinase B and extracellular signal-regulated kinase 1/2 activation, which is a potential chemotherapy agent for nasopharyngeal carcinoma. Thiocolchicoside, a semisynthetic colchicine derived from plant honeysuckle, is a muscle relaxant and utilized to treat orthopedic disorders and rheumatologic on account of its anti-inflammatory and analgesic mechanisms. Reuter et al. (2010) demonstrate that thiocolchicoside exerts an effect on anticancer via the nuclear factor kappa-B (NF-κB) pathway resulting in inhibition of cyclooxygenase-2 promoter activity and NF-κB reporter activity. However, efficacy and safety of those small-molecule drugs (including simvastatin and thiocolchicoside) on LSCC are still not investigated. Hence, it is urgently demanded to verify the effect of these candidate small-molecule drugs on treating LSCC in further studies.
Recently, a large number of studies show that noncoding RNAs (Cossu et al., 2019; Takeuchi et al., 2020) and miRNAs (Ricciardiello et al., 2017; Kawasaki et al., 2020) are involved in the initiation, progression, and prognosis of laryngeal cancer. In our current results, the expression level of the MDGs is similarly correlated with the initiation and prognosis of the patients with LSCC. IHC analysis in 50 LSCC tissues and paired adjacent normal tissues revealed that MAGEB2 and SUSD1 have significantly higher expression of LSCC compared to adjacent nonneoplastic tissues; ZNF382, ZNF418, and ZNF732 have significantly lower expression of LSCC compared to adjacent nonneoplastic tissues, which were in line with initiation of LSCC. In addition, epigenetic signature in single institution recruiting 50 LSCC patients is associated with OS by Kaplan–Meier survival analysis and ROC curves analysis, which strengthen the potential application value of MDGs.
Despite the remarkable sense, it is inevitable that limitations also existed in our study. First, we merely extract retrospectively target data (TCGA and GEO datasets) through biological algorithm approaches, the absence of fresh clinical samples to screen and verify our results. So, the application of our model remains to be validated in external and multicenter prospective cohorts with large sample sizes. Second, the MethylMix is an attractive investigative tool to integrate DNA methylation with RNA expression to identify MDGs in cancers. However, the MethylMix focuses on identifying cis-regulatory effects of DNA methylation on gene expression and does not currently model trans-regulatory effects. Further studies are needed to solve the multiple testing challenges on identifying trans-regulatory effects of DNA methylation on gene expression. Third, the five MDGs should be further studied and verified to investigate its specific regulatory function and mechanisms in LSCC.
Conclusion
An epigenetic signature, with five DNA MDGs, was identified and validated in LSCC patients by integrating multidimensional genomic data. Compared with TNM stage alone, it generates more accurate estimations of the survival probability and may help the development of personalized and precise medicine LSCC field.
Ethics Approval and Consent to Participate
All the data were obtained from TCGA and GEO, and the informed consent had been attained from the patients before our study. The studies involving human tissues samples were reviewed and approved by the Research Ethics Committee of Affiliated Cancer Hospital & Institute of Guangzhou Medical University and complied with the Declaration of Helsinki. All patients were aware of the present study and signed an informed consent agreement.
Availability of Data and Materials
The data that support the findings of this study are provided in Supplementary Data and are also made available in the TCGA and GEO.
Footnotes
Disclosure Statement
No competing financial interests exist.
Funding Information
No funding was received for this article.
Supplementary Material
Supplementary Data S1
Supplementary Data S2
Supplementary Data S3
Supplementary Figure S1
Supplementary Figure S2
Supplementary Figure S3
Supplementary Figure S4
Supplementary Figure S5
Supplementary Table S1
References
Supplementary Material
Please find the following supplemental material available below.
For Open Access articles published under a Creative Commons License, all supplemental material carries the same license as the article it is associated with.
For non-Open Access articles published, all supplemental material carries a non-exclusive license, and permission requests for re-use of supplemental material or any part of supplemental material shall be sent directly to the copyright owner as specified in the copyright notice associated with the article.