
Abstract
Recently, growing evidence has shed light on the competitive endogenous RNAs (ceRNAs) activity of long noncoding RNAs (lncRNAs) in carcinogenesis and tumor progression. To better elucidate the regulatory mechanisms of lncRNA in muscle-invasive bladder cancer (MIBC), we identified aberrantly expressed mRNAs, lncRNAs, and miRNAs in tumor tissues by using RNA sequence profiles from The Cancer Genome Atlas. The MIBC-specific ceRNA network, including 58 lncRNAs, 22 miRNAs, and 52 mRNAs, was constructed and visualized in Cytoscape. Further, using the univariate and multivariate Cox regression model, we screened 8 lncRNAs (AC078778.1, LINC00525, AC008676.1, AP000553.1, SACS-AS1, AC009065.1, AC127496.3, and MYO16-AS1) to construct an lncRNA signature for predicting the overall survival of MIBC patients. Kaplan–Meier analysis and a receiver operating characteristic curve were applied to evaluate the performance of the signature. Real-time quantitative PCR analysis was carried out to test expression levels of the 8 lncRNAs in MIBC patient tissues. Transwell assays demonstrated that overexpressing MYO16-AS1 can enhance UMUC2 migration and invasion. Our study offers a novel lncRNA-correlated ceRNA model to better understand the molecular mechanisms involved in MIBC. In addition, we developed an independent 8-lncRNAs biomarker for prognostic prediction and identified MYO16-AS1 as an oncogenic lncRNA in bladder cancer.
Introduction
Bladder cancer (BC) is the ninth most common cancer worldwide, accounting for 430,000 new cases and 165,000 deaths per year (Siegel et al., 2017). Overall, roughly 25% patients were initially diagnosed with muscle-invasive bladder cancer (MIBC), which typically results in a poor prognosis (Kamat et al., 2016). However, in recent years, some progress has been made in the early diagnosis and the treatment of MIBC; the mechanisms of tumorigenesis and the progression of MIBC remain unclear. Thus, it is imperative to improve the understanding of the molecular nature of MIBC to identify effective diagnostic and prognostic biomarkers for developing a new and precise therapy of MIBC.
Long noncoding RNA (lncRNA) is a category of ncRNA with more than 200 nucleotides, and extensive investigation of its broad functional repertoire suggests that it regulates gene expression both transcriptionally and post-transcriptionally (Mercer et al., 2009). Many lncRNAs exhibited specific expression profiles in particular cancers, and they played pivotal roles in the development of these cancers (Kretz et al., 2013). With appropriate treatment of the serum, lncRNAs can be stably expressed in the plasma (Bao and Su, 2017). Therefore, emerging evidence suggests that lncRNAs could potentially function as molecular biomarkers to assist cancer diagnosis and prognosis (Hung and Chang, 2010; Zhou et al., 2017).
It has been reported that several lncRNAs with altered expression patterns, such as (Ying et al., 2012), (Han et al., 2013), and MALAT1, TUG1, UCA1 (Yang et al., 2012), and these genes have the potential to serve as noninvasive biomarkers. However, without a large sample, correlations between these lncRNAs and survival rate or some other clinical characteristics tend to be inconsistent and statistically unreliable. The Cancer Genome Atlas (TCGA) is a large-scale database that provides publically accessible multidimensional molecular profiles for a large amount of patient samples. These datasets are ideal resources for data mining and improve the statistical accuracy and reliability of certain biomarker candidates.
Competing endogenous RNA (ceRNA) is a new discovered regulation mechanism proposed by Salmena et al. (2011). This hypothesis proposes that different RNA transcripts, including mRNAs, lncRNAs, and circRNAs, could interact with each other on the basis of their shared miRNA response elements (MREs) (Salmena et al., 2011). lncRNAs acting as ceRNAs are able to sponge miRNAs by using MRE, and inhibit miRNAs binding to the identical MRE on mRNAs, thus regulating mRNA degradation or translation (Salmena et al., 2011).
A ceRNA network has been established in many cancer types, such as breast cancer (Fan et al., 2018), gastric cancer (Li et al., 2016), and hepatocellular carcinoma (Bai et al., 2019), to elucidate the intricate interactions between lncRNAs and other genes, and their potential roles in cancer. It has also helped reveal potential biomarkers for cancer diagnosis and prognosis, and potential targets for cancer therapy (Qi et al., 2015). Nevertheless, a ceRNA network based on a large patient sample size in MIBC has not yet been explored.
In our study, we retrieved RNA sequence data of BC patients' samples from TCGA and used bioinformatic analysis to construct an lncRNA-related ceRNA network. Next, by analyzing the correlation between lncRNA expression in ceRNA and overall patient survival, we selected 8 lncRNAs to develop a novel model for predicting survival. We then tested the expression of these 8 lncRNAs in BC patient samples, and we identified MYO16-AS1 as an oncogenic lncRNA in BC. To our knowledge, this is the first attempt to identify an lncRNA prognostic signature based on a ceRNA network in MIBC.
Materials and Methods
Cell culture and cell transfection
A UMUC2 cell line was purchased from the American Type Culture Collection and cultured in DMEM with 10% FBS. The cells were incubated at 37°C in a 5% carbon dioxide atmosphere. On reaching 70–80% confluence in six-well plates, the UMUC2 cells were transfected with a 500 ng pcDNA3.1 vector plasmid and OE-MYO16-AS1 (Ribobio, Guangzhou, China) by using lipofectamine 3000 (Invitrogen, CA).
Cell proliferation assay and transwell assay
Cell Counting Kit-8 (Yeason, Hangzhou, China) was used to measure cell proliferation. Briefly, we seeded 5 × 10³ UMUC2 cells per well onto 96-well plates; then, we added 10 μL CCK-8 solution at days 1, 3, 5, and 7. After incubating at 37°C for 2 h, absorbance for each well was measured at 450 nm. Migration and invasion assays were conducted by using 8-μm pore filters (Millipore, Germany) coated with or without Matrigel (BD Biosciences, San Jose, CA). We seeded UMUC2 cells into the top chamber with serum-free DMEM and added 10% FBS DMEM to the lower chamber. After 24 h of incubation, we gently wiped off non-migrating or noninvasive cells on the upper chamber, and we fixed cells on the membrane bottom with 4% paraformaldehyde for 15 minutes. After fixation, cells were further stained with crystal violet for 20 minutes, and they were counted in three random chosen fields.
RNA extraction and real-time quantitative polymerase chain reaction
Total RNA was isolated with TRIzol (Cwbiotech, Peking, China) according to the manufacturer's instructions. Two micrograms of total RNA was used for cDNA synthesis by All-in-One cDNA Synthesis SuperMix (Bimake, Shanghai, China). Real-time quantitative polymerase chain reaction (RT-qPCR) reactions were performed by using a 2 × SYBR Green qPCR master mix (Bimake). The primer sequences are listed in Supplementary Table S1.
Data collection
Level-3 RNA sequence data (Illumina HiSeq RNA-Seq platform) of 404 BC patients were retrieved from the TCGA data portal. We used human genecode.v28 to define and annotate lncRNAs (antisense, lncRNAs, processed transcripts, sense overlapping, and sense intronic). Exclusion criteria were defined as follows: (1) histological diagnosis was unavailable or not MIBC; (2) clinical information was incomplete. Overall, there were 393 MIBC samples and 19 adjacent normal bladder tissues with mRNA, miRNA, and lncRNA expression profiles. In addition, clinical data of MIBC patients were also collected from TCGA (Table 2). An ethics committee was unnecessary, as all the information was downloaded from TCGA.
Patients and clinical samples
The BC specimens and matched adjacent normal tissues were obtained from 16 patients, who underwent curative surgical resections from 2018 to 2020 in the Department of Urology, Sir Run Run Shaw Hospital, Zhejiang University School of Medicine. The protocols for tissue sample collections were approved by the Ethics Committee of Sir Run Run Shaw Hospital (Institutional Review Board number: 20180226-70). Informed consent was obtained from all patients. The clinical data of patients are provided in Supplementary Table S2.
Differential gene expression analysis
To filter out all unexpressed RNAs, we deleted all rows with a mean read of less than or equal to one. We then performed trimmed mean of M-values for normalization and used the edgeR package of R (version 3.5.2) to identify significantly differentially expressed genes (DEmRNAs, DElncRNAs, and DEmiRNAs) between 19 adjacent-normal tissues and 393 MIBC tissues. We selected false discovery rate (FDR) <0.01 and |log2FC| >2 as the cutoff values. Heatmap and volcano plots were generated by using ggplot2 package in R.
ceRNA network construction
Construction of the ceRNA network was based on interactions among DEmRNAs, DEncRNAs, and DEmiRNAs in MIBC. First, miRcode was used to retrieve potential lncRNAs–miRNAs pairs. Second, the mRNAs targeted by miRNA were predicted by using miRDB, miRTarBase, and Targetscan. Next, the intersection between the predicted mRNAs of miRNAs and DEmRNAs was selected. Finally, 58 DElncRNAs, 22 DEmiRNAs, and 52 DEmRNAs were identified, and Cytoscape software (version 3.5.1) was applied to establish the lncRNA–miRNA–mRNA ceRNA network.
Gene ontology and pathway analysis
To better understand the putative function of mRNAs within the ceRNA network, we conducted gene ontology (GO) function analysis by using Database for Annotation Visualization and Integrated Discovery (DAVID) 6.8 and performed pathway enrichment analysis with Kyoto Encyclopedia of Genes and Genomes (KEGG).
Identification and construction of MIBC-specific lncRNA prognostic signatures
To identify selected lncRNAs whose expression was significantly correlated with overall survival (OS), we first carried out the univariate Cox proportional hazards regression by using the survival package in R. lncRNAs with p < 0.05 were then subjected to multivariate Cox proportional hazards regression with some other clinical characteristics, such as age, stage, grade, and so on, to identify independent prognostic factors for MIBC. In total, 8 DElncRNAs with p < 0.01 were found to be significantly correlated with OS. Next, we defined the prognostic risk score as follows:
(N, number of prognostic lncRNAs; Expi , expression of lncRNAi; Coei , coeffcient of lncRNAi from multivariate Cox proportional hazards regression) (Zeng et al., 2017), and we calculated the risk score of each patient. Using the median risk score as the optimal cutoff value, MIBC patients were stratified into low-risk groups and high-risk groups. The Kaplan–Meier survival method was used to compare the OS of the two groups, and time-dependent receiver operating characteristic (ROC) curves analysis with 3 and 5 years as the defining point were performed to examine the predictive power of the lncRNA signature.
Survival analysis
Kaplan–Meier survival curves were generated by using survival package. A significant difference was defined as p < 0.05 derived with the log-rank test.
Results
Differentially expressed mRNAs, lncRNAs, and miRNAs in MIBC patients from TCGA
We compared DEmRNAs, DElncRNAs, and DEmiRNAs between normal bladder tissues and MIBC tissues by using edgeR, with FDR <0.01 and log |FC| >2. In total, 1819 DEmRNAs (1030 upregulated, 789 downregulated; Fig. 1), 160 DEmiRNAs (139 upregulated, 21 downregulated; Supplementary Fig. S1), and 659 DElncRNAs (415 upregulated, 244 downregulated; Supplementary Fig. S2) were identified as pivotal genes involved in MIBC.
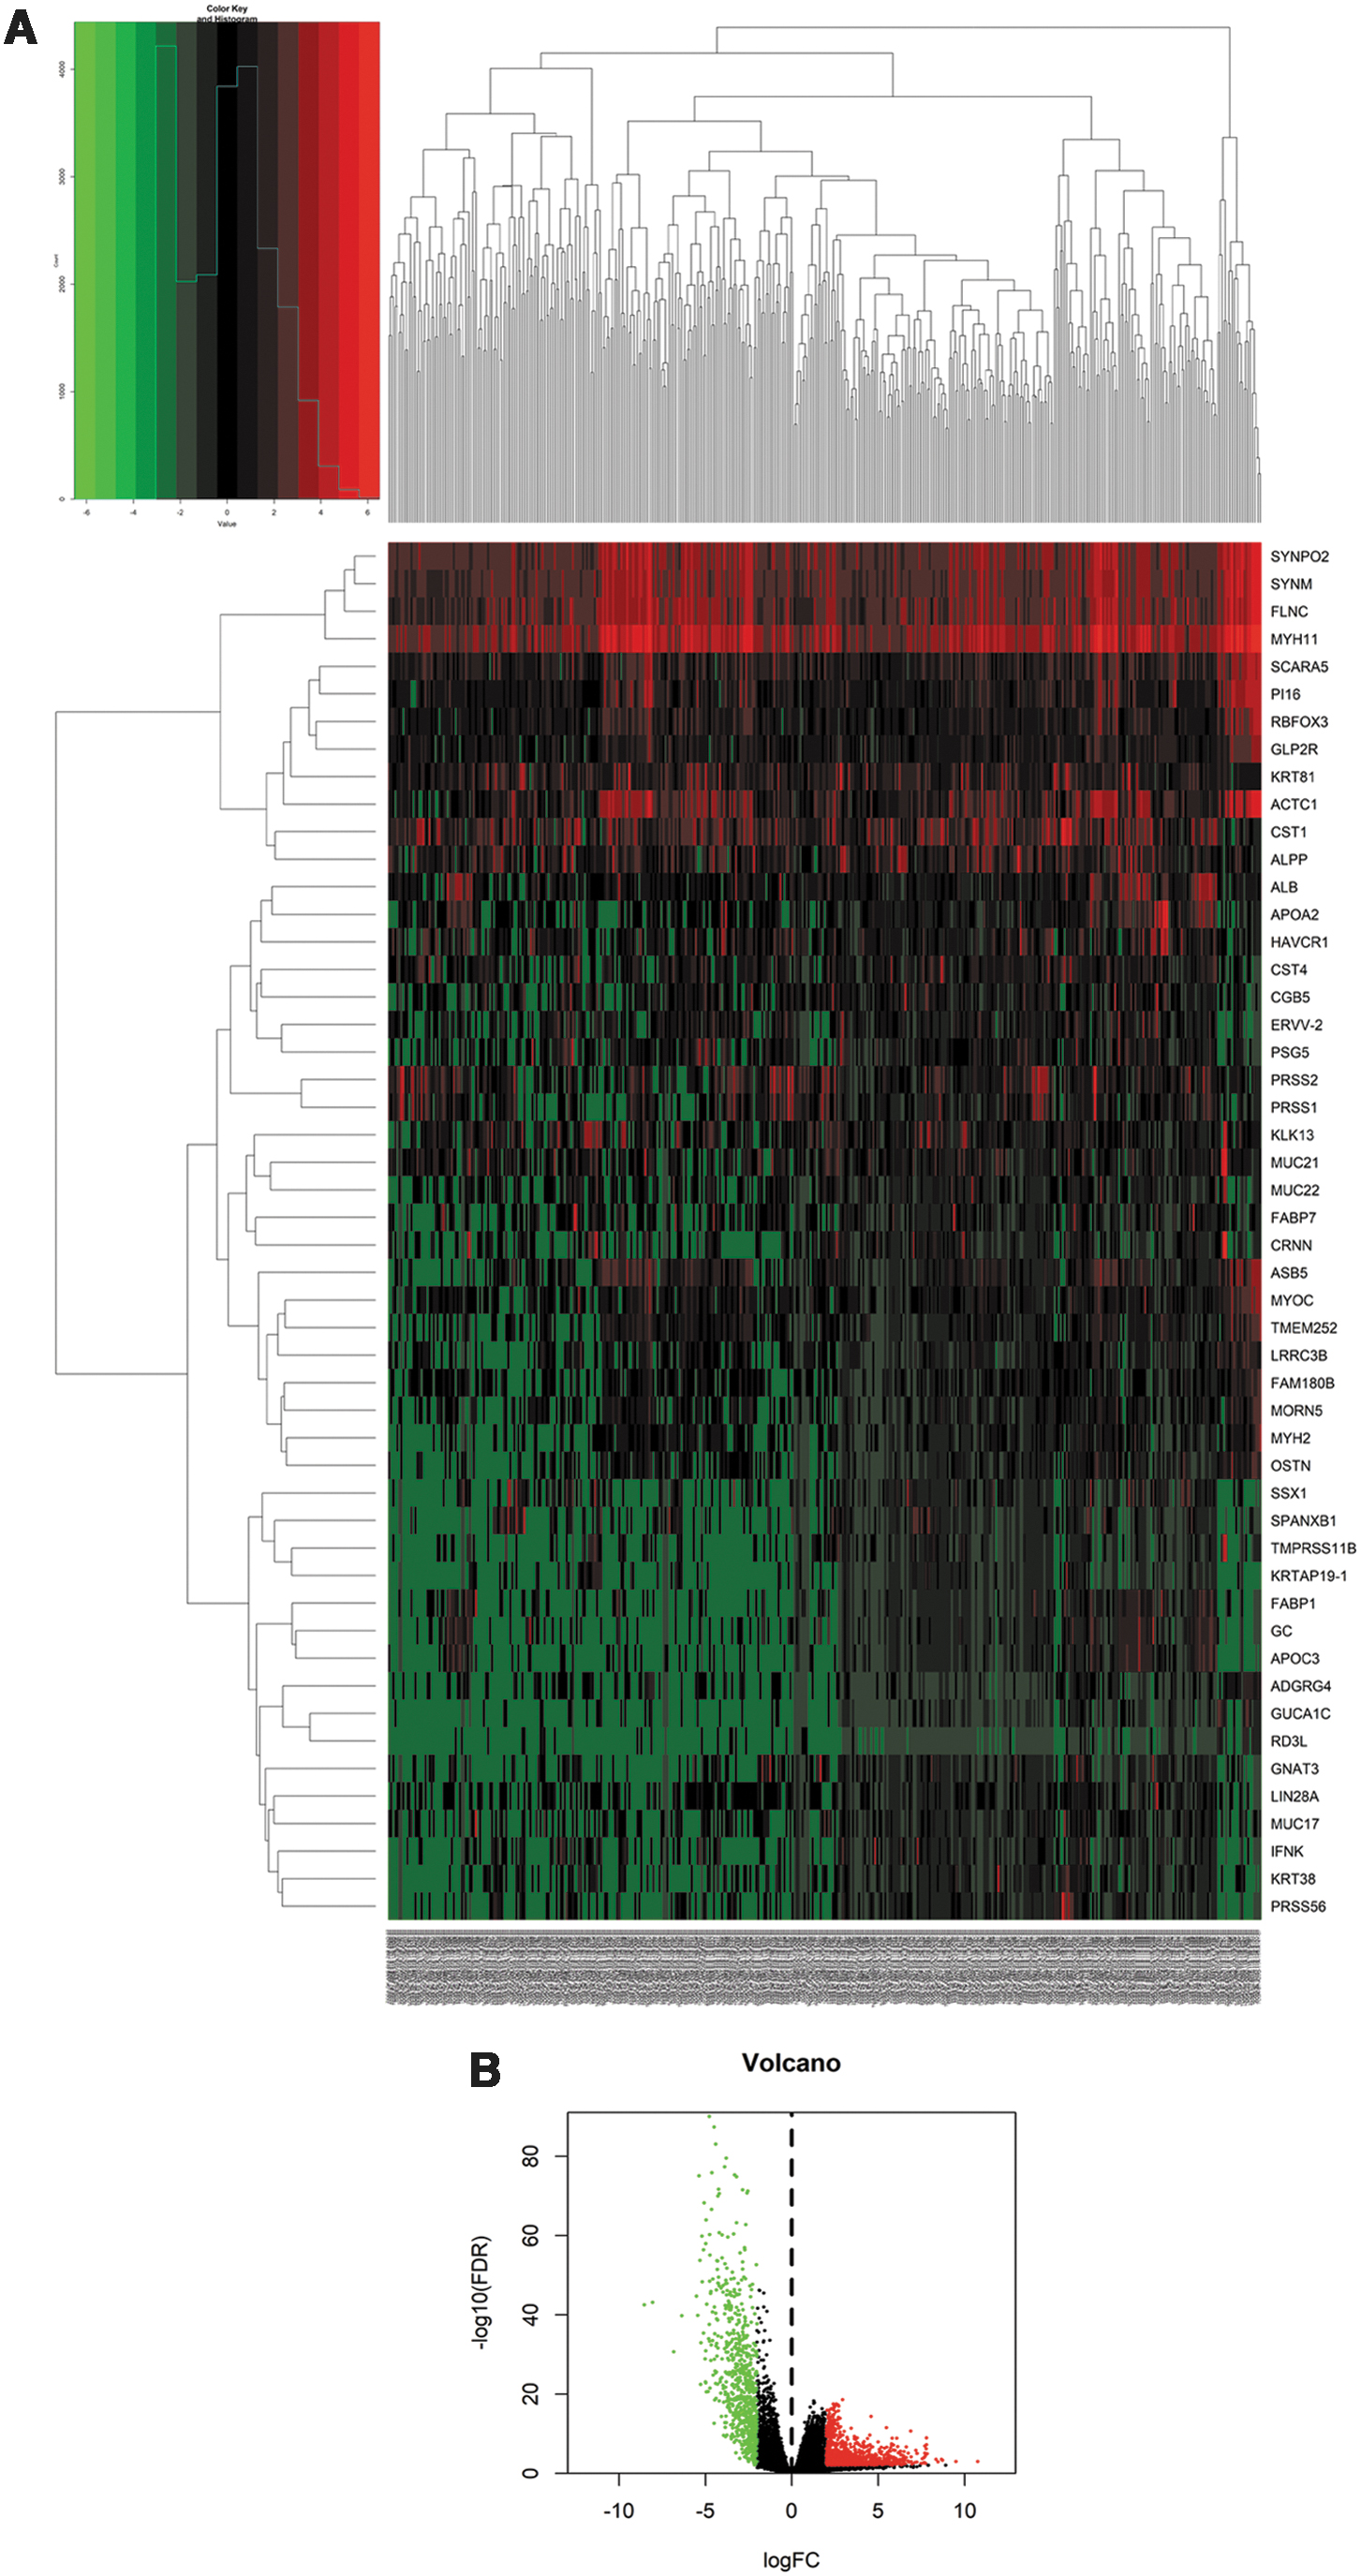
Heatmap
Prediction of lncRNAs and mRNAs targeted by miRNAs and construction of the ceRNA network
To elucidate the relationships of the differentially expressed genes, we established an lncRNA–miRNA–mRNA ceRNA network. First, we predicted the potential lncRNA targets of 160 DEmiRNAs by using miRcode and obtained 286 interaction pairs, including 58 lncRNAs (35 upregulated and 23 downregulated) and 22 miRNAs (18 upregulated and 4 downregulated) (Supplementary Table S3). We then identified 921 mRNA targets of the 22 miRNAs mentioned earlier by using miRDB, miRTarBase, and Targetscan database and further compared 921 candidate mRNA targets with 1819 DEmRNAs. In all, 70 interaction pairs consisting of 17 miRNAs and 52 mRNAs (16 upregulated and 36 downregulated) were eventually obtained (Supplementary Table S4; Supplementary Fig. S3A). The ceRNA network was visualized with Cytoscape software (Fig. 2).
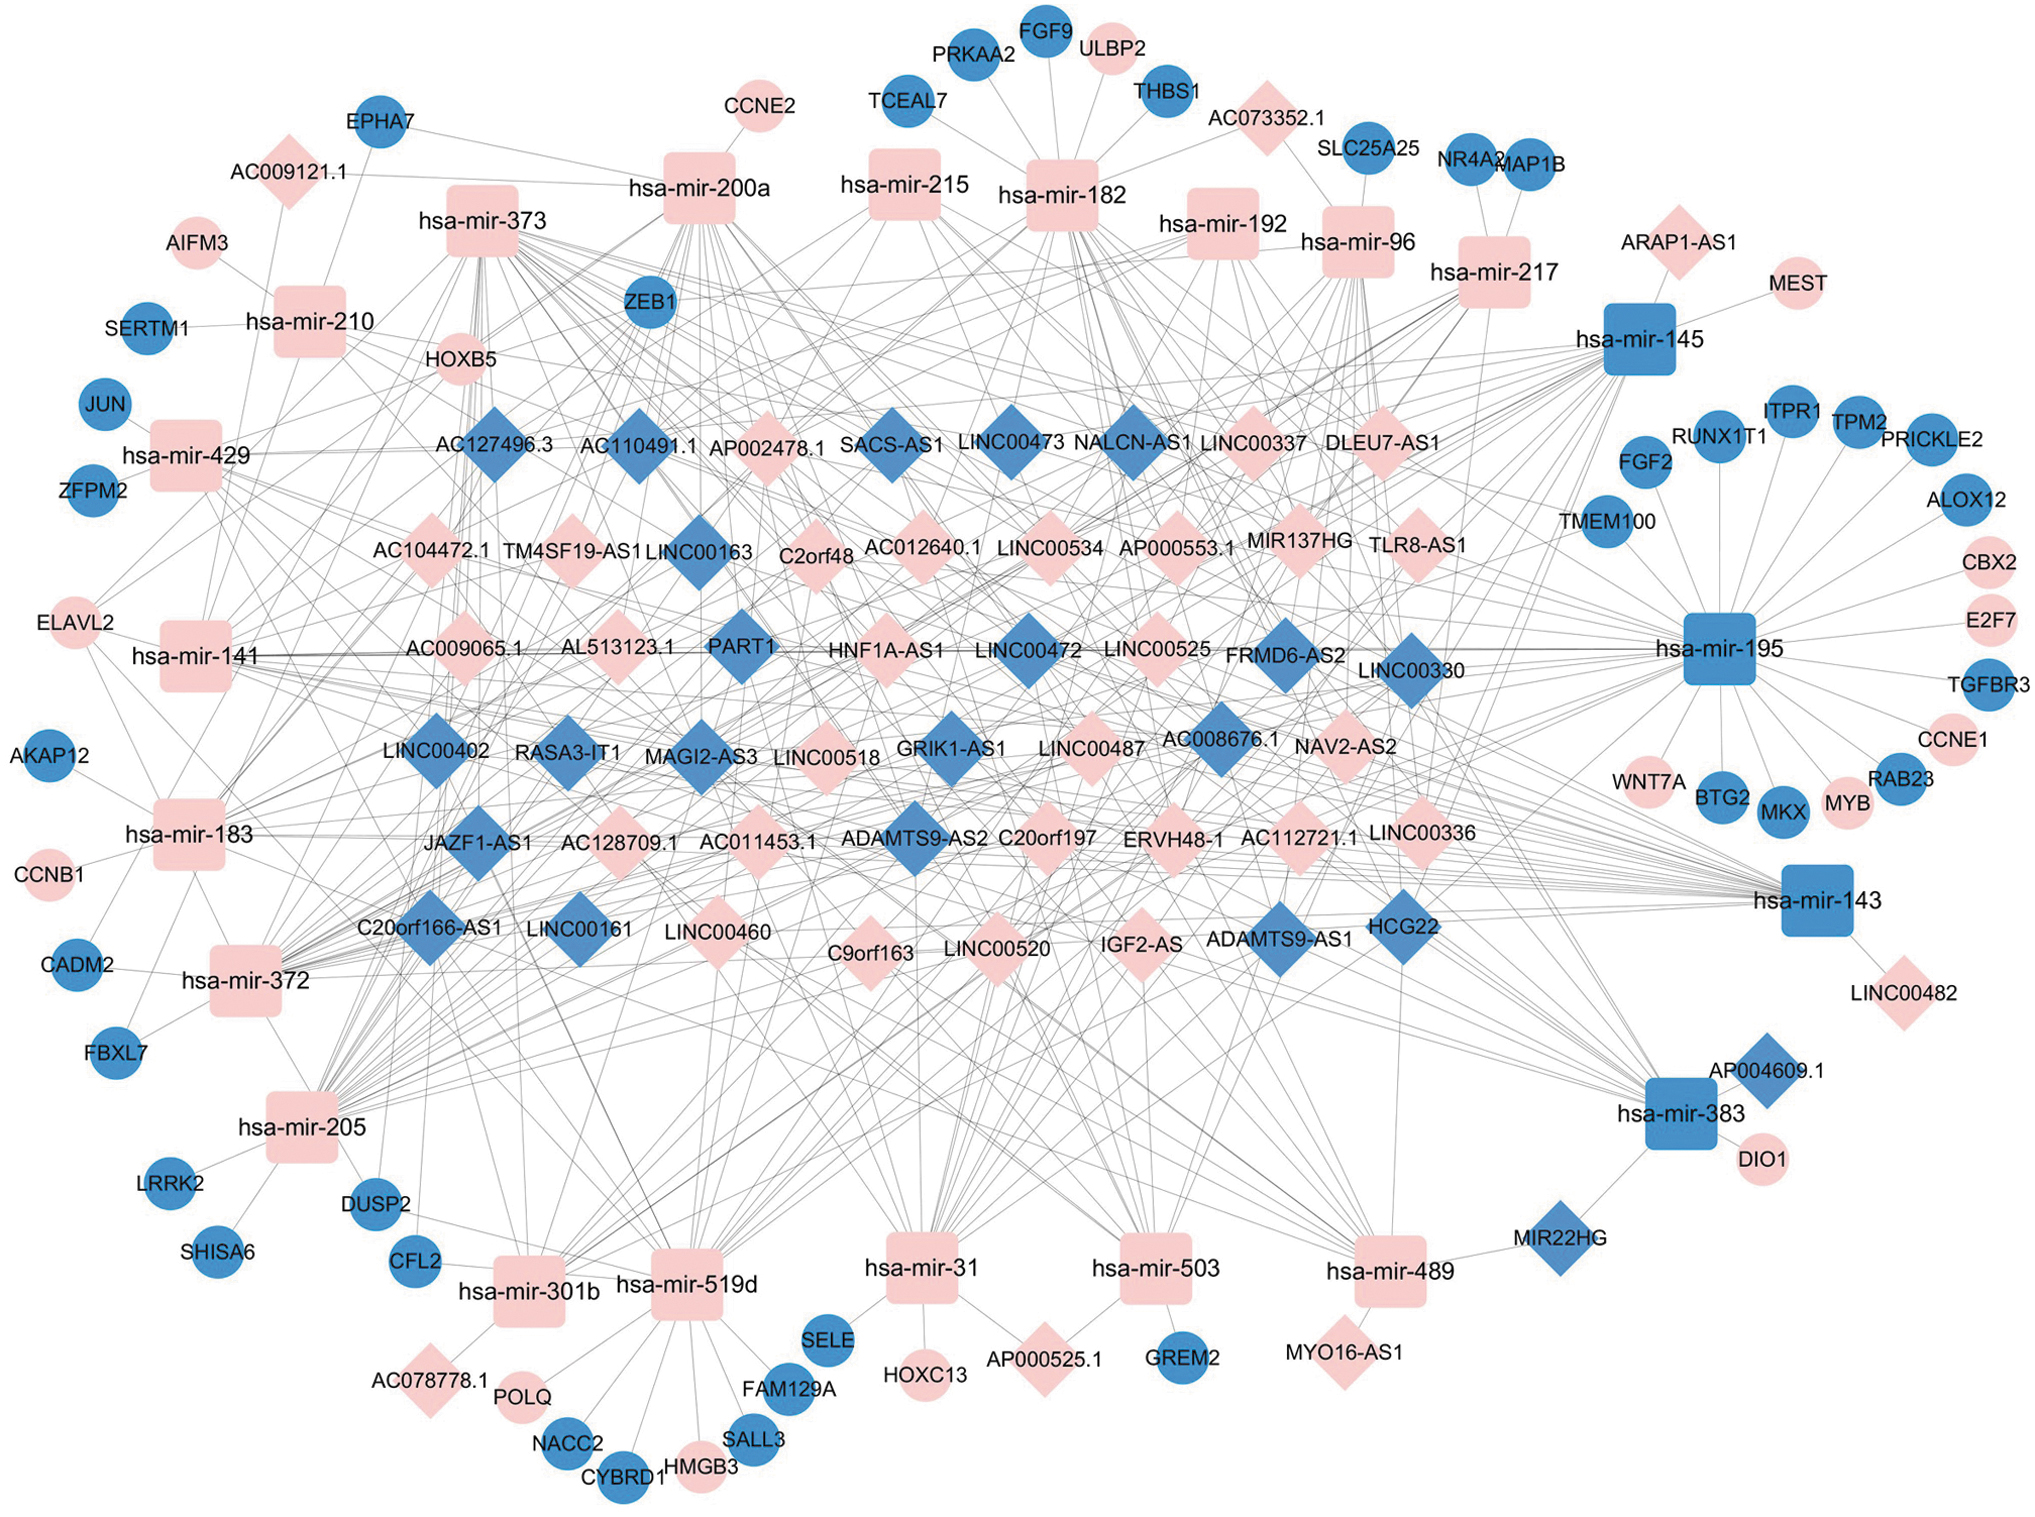
The lncRNA-based ceRNA network in muscle-invasive bladder cancer. The pink nodes indicate upregulated genes; the blue nodes indicate downregulated genes. Diamonds: lncRNAs, rounded rectangles: miRNAs, circles: mRNAs. ceRNA, competing endogenous RNA; lncRNA, long noncoding RNA.
GO and pathway analysis
Next, we explored the biological processes and pathways of the 52 DEmRNAs to reveal potential roles of the ceRNA network in MIBC. We performed GO functional analysis by using DAVID, and with p < 0.005, 8 GO terms were indicated as significantly different. KEGG was further utilized to analyze pathway enrichment, and with p < 0.01, 3 pathways (pathways in cancer, p53 signaling pathway, and oocyte meiosis) were considered statistically important. (Fig. 3)
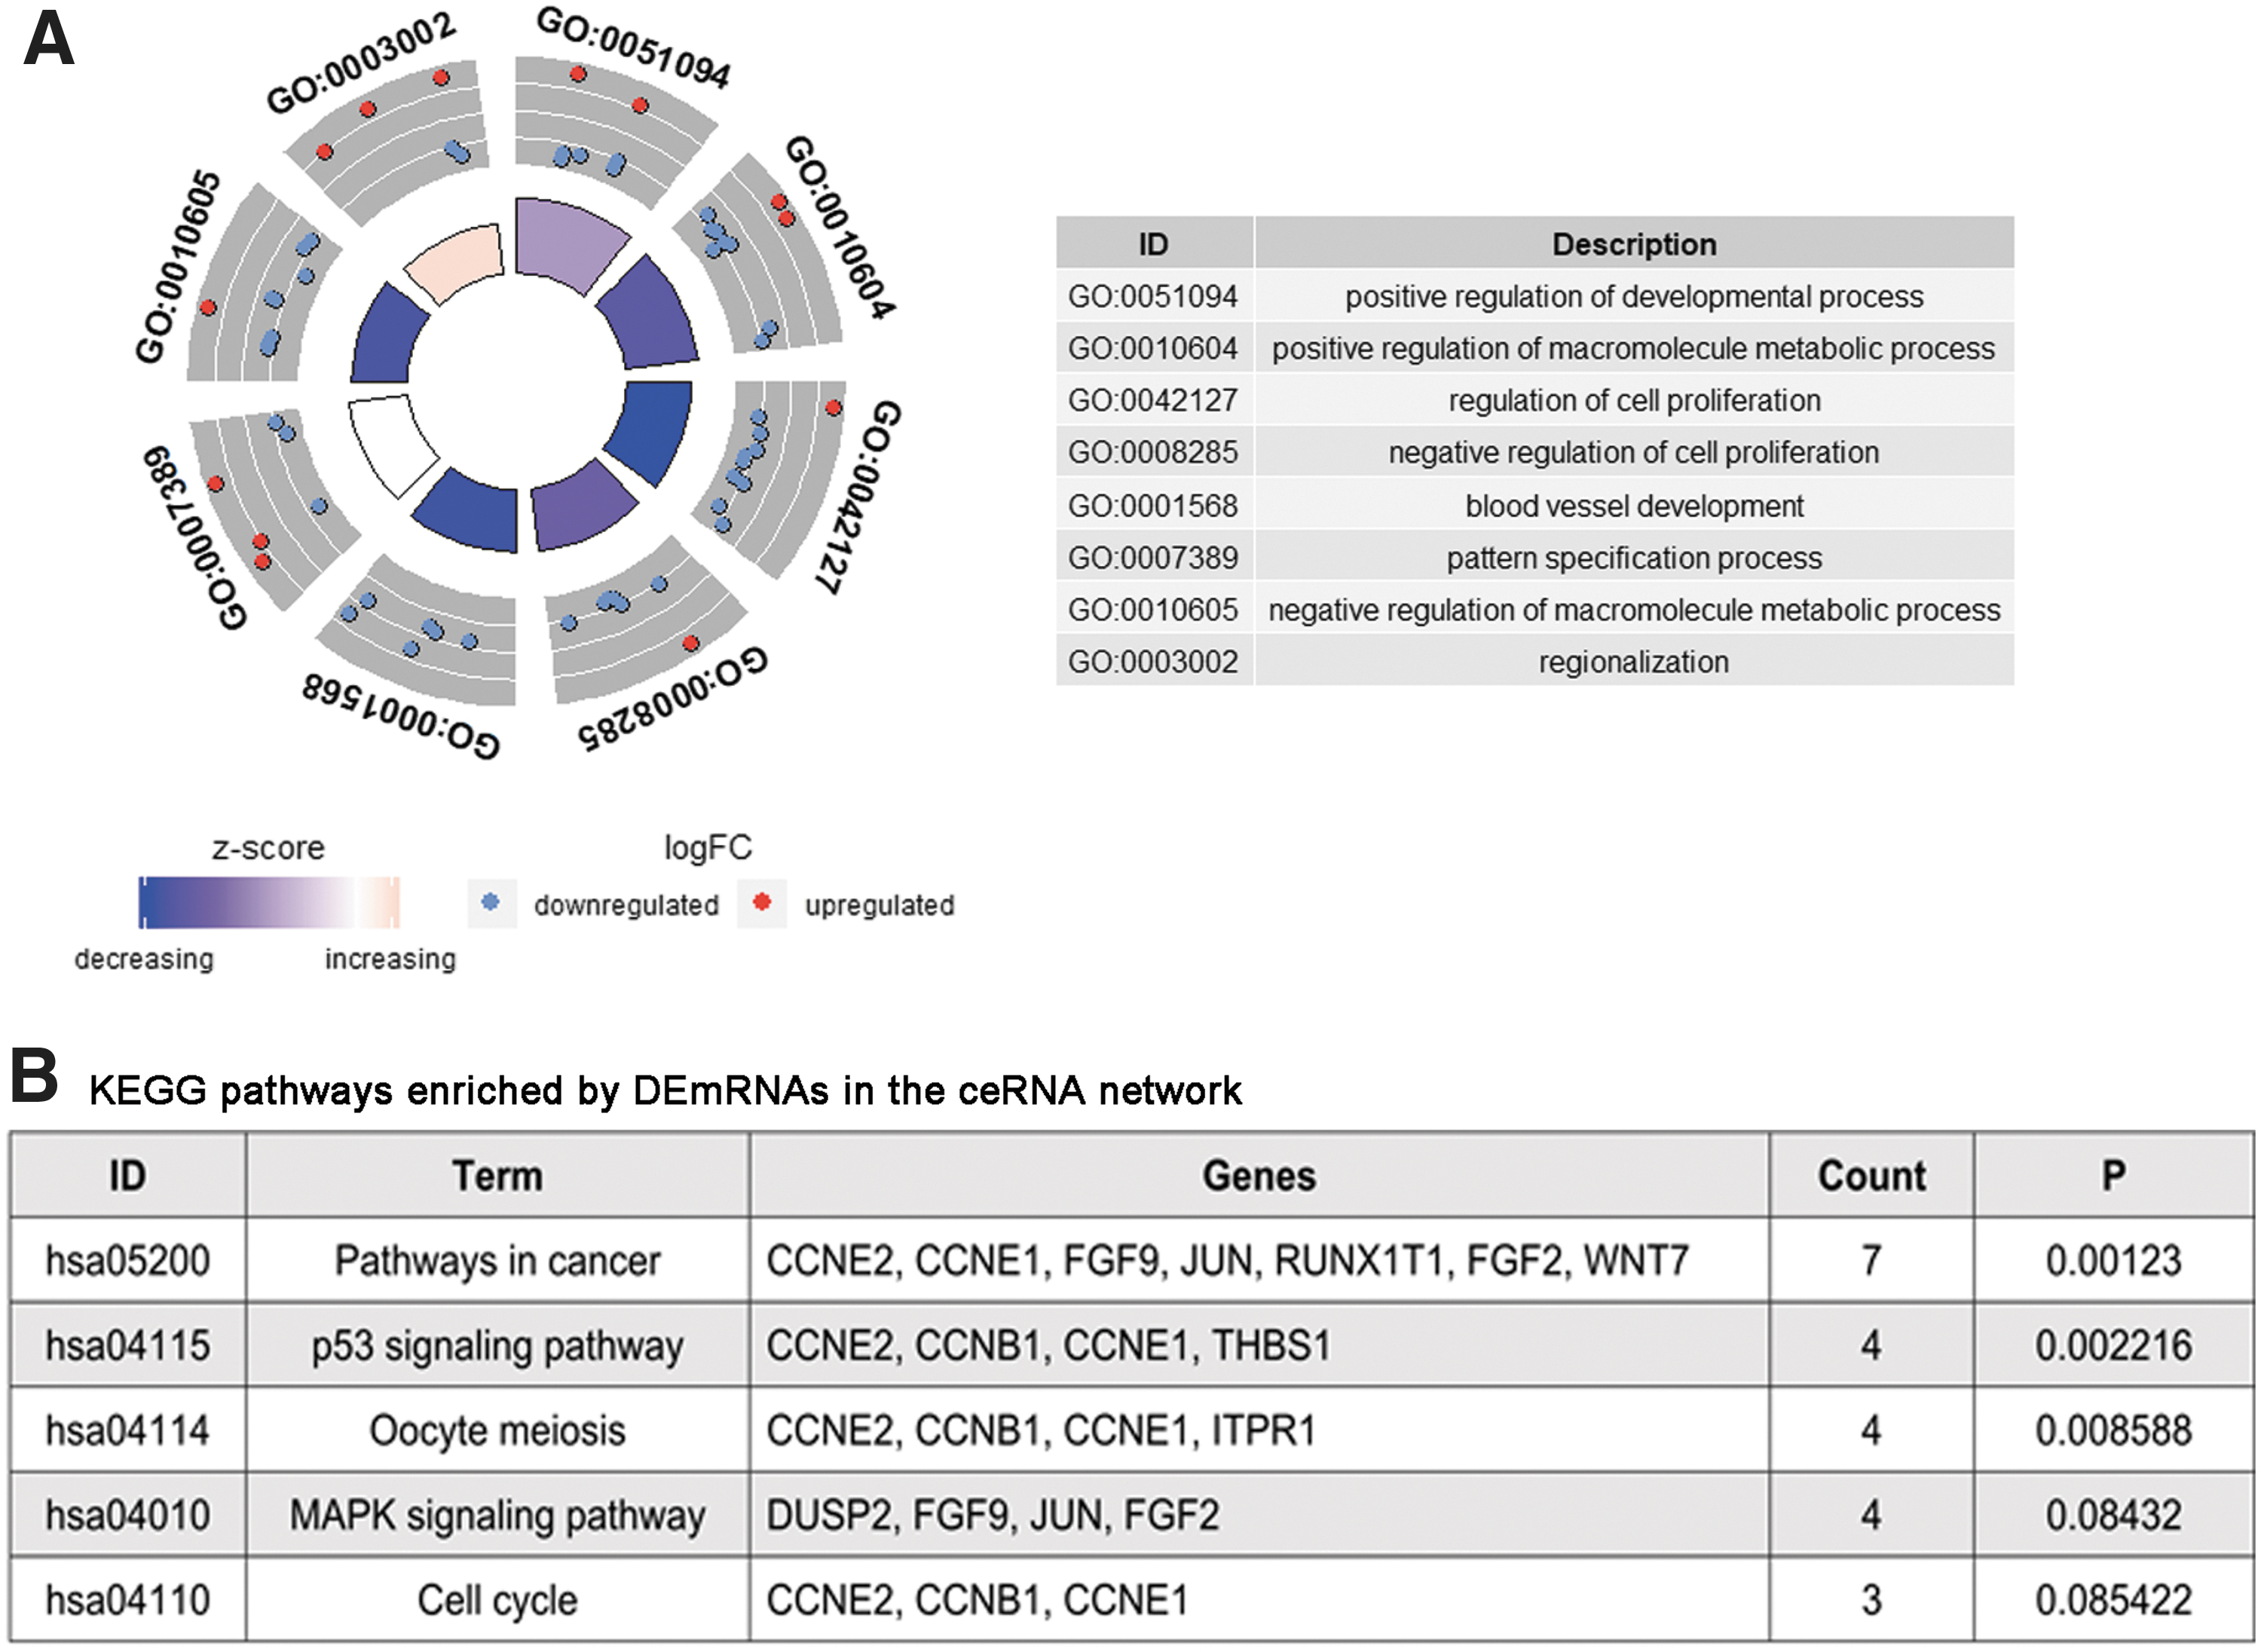
The functions of DEmRNAs in the ceRNA network were analyzed with DAVID.
Survival analysis of differentially expressed genes
To further assess whether differentially expressed genes in the ceRNA network had strong effects on the prognosis of MIBA patients, we analyzed the contributions of 52 DEmRNAs, 58 DElncRNAs, and 22 DEmiRNAs by using the Kaplan–Meier method. As a result of this analysis, 16 mRNAs, 13 lncRNAs, and 4 miRNAs were shown to be potential oncogenes, since high expression of these genes was correlated with short survival time; however, 4 mRNAs, 1 lncRNA, and 4 miRNAs were identified as protective RNAs in MIBC, because increased expression of these genes was positively correlated with OS (log-rank p < 0.05). The Supplementary Figure S3B showed top 3 mRNAs, lncRNAs, and miRNAs in descending order of log-rank P, respectively.
Construction of the 8-lncRNAs prognostic signature
As lncRNAs are the upstream factors in the ceRNA network and play a dominant role in that network, we considered the possibility that they could be optimal prognostic biomarkers for MIBC. Thus, we applied univariate Cox proportional hazards regression to identify those lncRNAs that were significantly correlated with OS (p < 0.05). Next, multivariate Cox hazards regression was implemented to select independent prognostic lncRNAs for MIBC. Eight lncRNAs (AC078778.1, LINC00525, AC008676.1, AP000553.1, SACS-AS1, AC009065.1, AC127496.3, and MYO16-AS1) (Table 1) with p < 0.01 were ultimately selected to develop a predictive model.
Multivariate Analysis of DElncRNA for Overall Survival
SE, standard error.
Using expression levels of the 8 lncRNAs and the coefficient calculated from multivariable Cox regression analysis, the risk score was calculated for each patient. By setting the median risk score, −3.0800, as the cutoff value, 200 patients with higher risk scores were allocated to the high-risk group, whereas 201 patients with lower risk scores were assigned to the low-risk group. As Kaplan–Meier curves demonstrate (Fig. 4A), the high-risk group had a higher mortality rate compared with that of the low-risk group (log rank p < 0.0001). The ROC curve of the 8-lncRNA signature was used to evaluate its specificity and sensitivity; the area under the ROC curve (AUC) for 3 years and for 5 years was 0.758 and 0.728, respectively (Fig. 4B). Figure 4C showed the distribution of risk scores and the expression patterns of 8 lncRNAs in 401 MIBC patients.
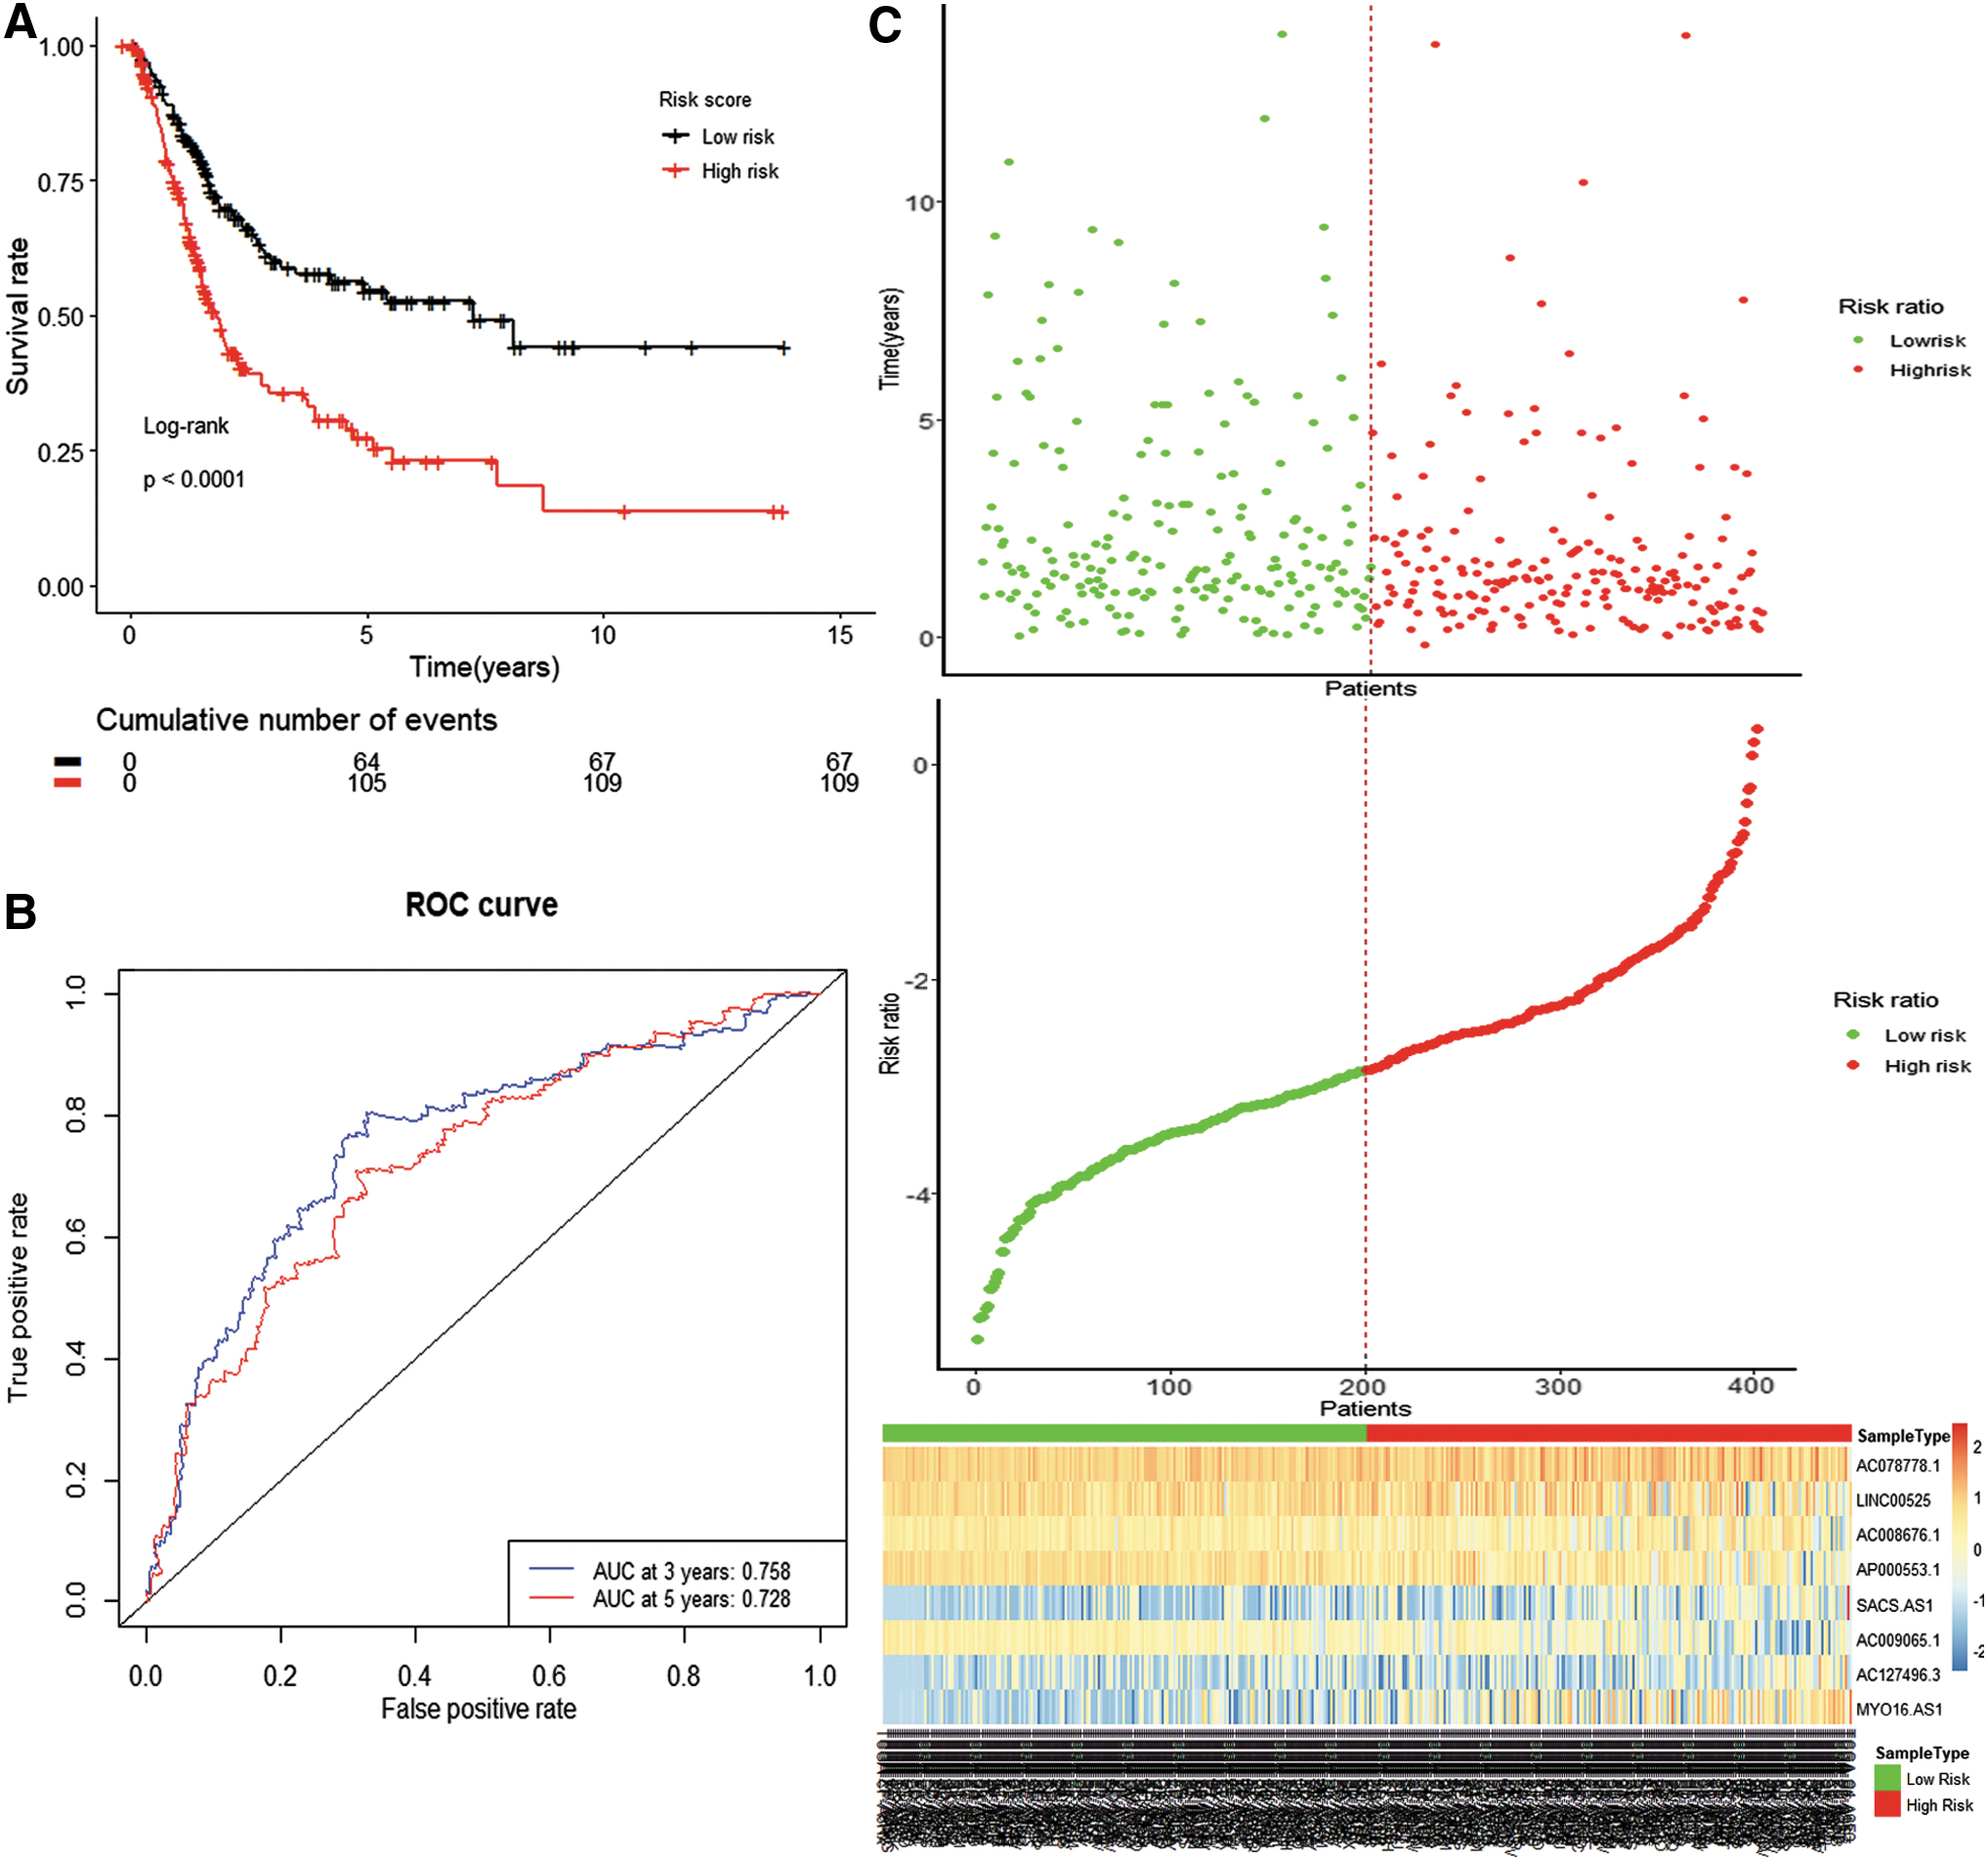
The prognostic power of the 8-lncRNA signature in muscle-invasive bladder cancer patients.
Independence of the 8-lncRNA signature for predicting survival in MIBC
To test the independence of the prognostic value of the predictive model from clinical features, including gender, age, grade, stage, and neoadjuvant treatment, we carried out univariate and multivariate regression models. As shown in Table 2, the results from multivariate Cox hazards analysis demonstrate that the 8-lncRNA signature, as well as age and gender were independent variables for predicting survival of MIBC. Supplementary Figure S3C shows the Kaplan–Meier survival curves for age and stage.
Characteristics and Clinical Data of Muscle-Invasive Bladder Cancer Patients
CI, confidence interval; HR, hazard ratio; SD, standard deviation.
MYO16-AS1 is a potential oncogenic lncRNA in MIBC
To further confirm the expression pattern of 8 lncRNAs, we conducted RT-qPCR analysis in 16 pairs of MIBC tissues from Sir Run Run Shaw Hospital. Consistent with the TCGA dataset, MYO16-AS1 expression was significantly upregulated in the MIBC tissues compared with those in normal tissues, whereas AC127496.3 was downregulated in MIBC tissues (Fig. 5A). However, AC078778.1, LINC00525, AC008676.1, AP000553.1, SACS-AS1, and AC009065.1 were not differentially expressed between tumor and normal tissues, a finding that might be due to the limited number of tissue samples (Fig. 5A). Kaplan–Meier curves in the TCGA dataset showed that both AC127496.3 and MYO16-AS1 contributed to poor survival (Supplementary Fig. S3D). We, thus, identified MYO16-AS1 as a potential oncogenic lncRNA in MIBC.
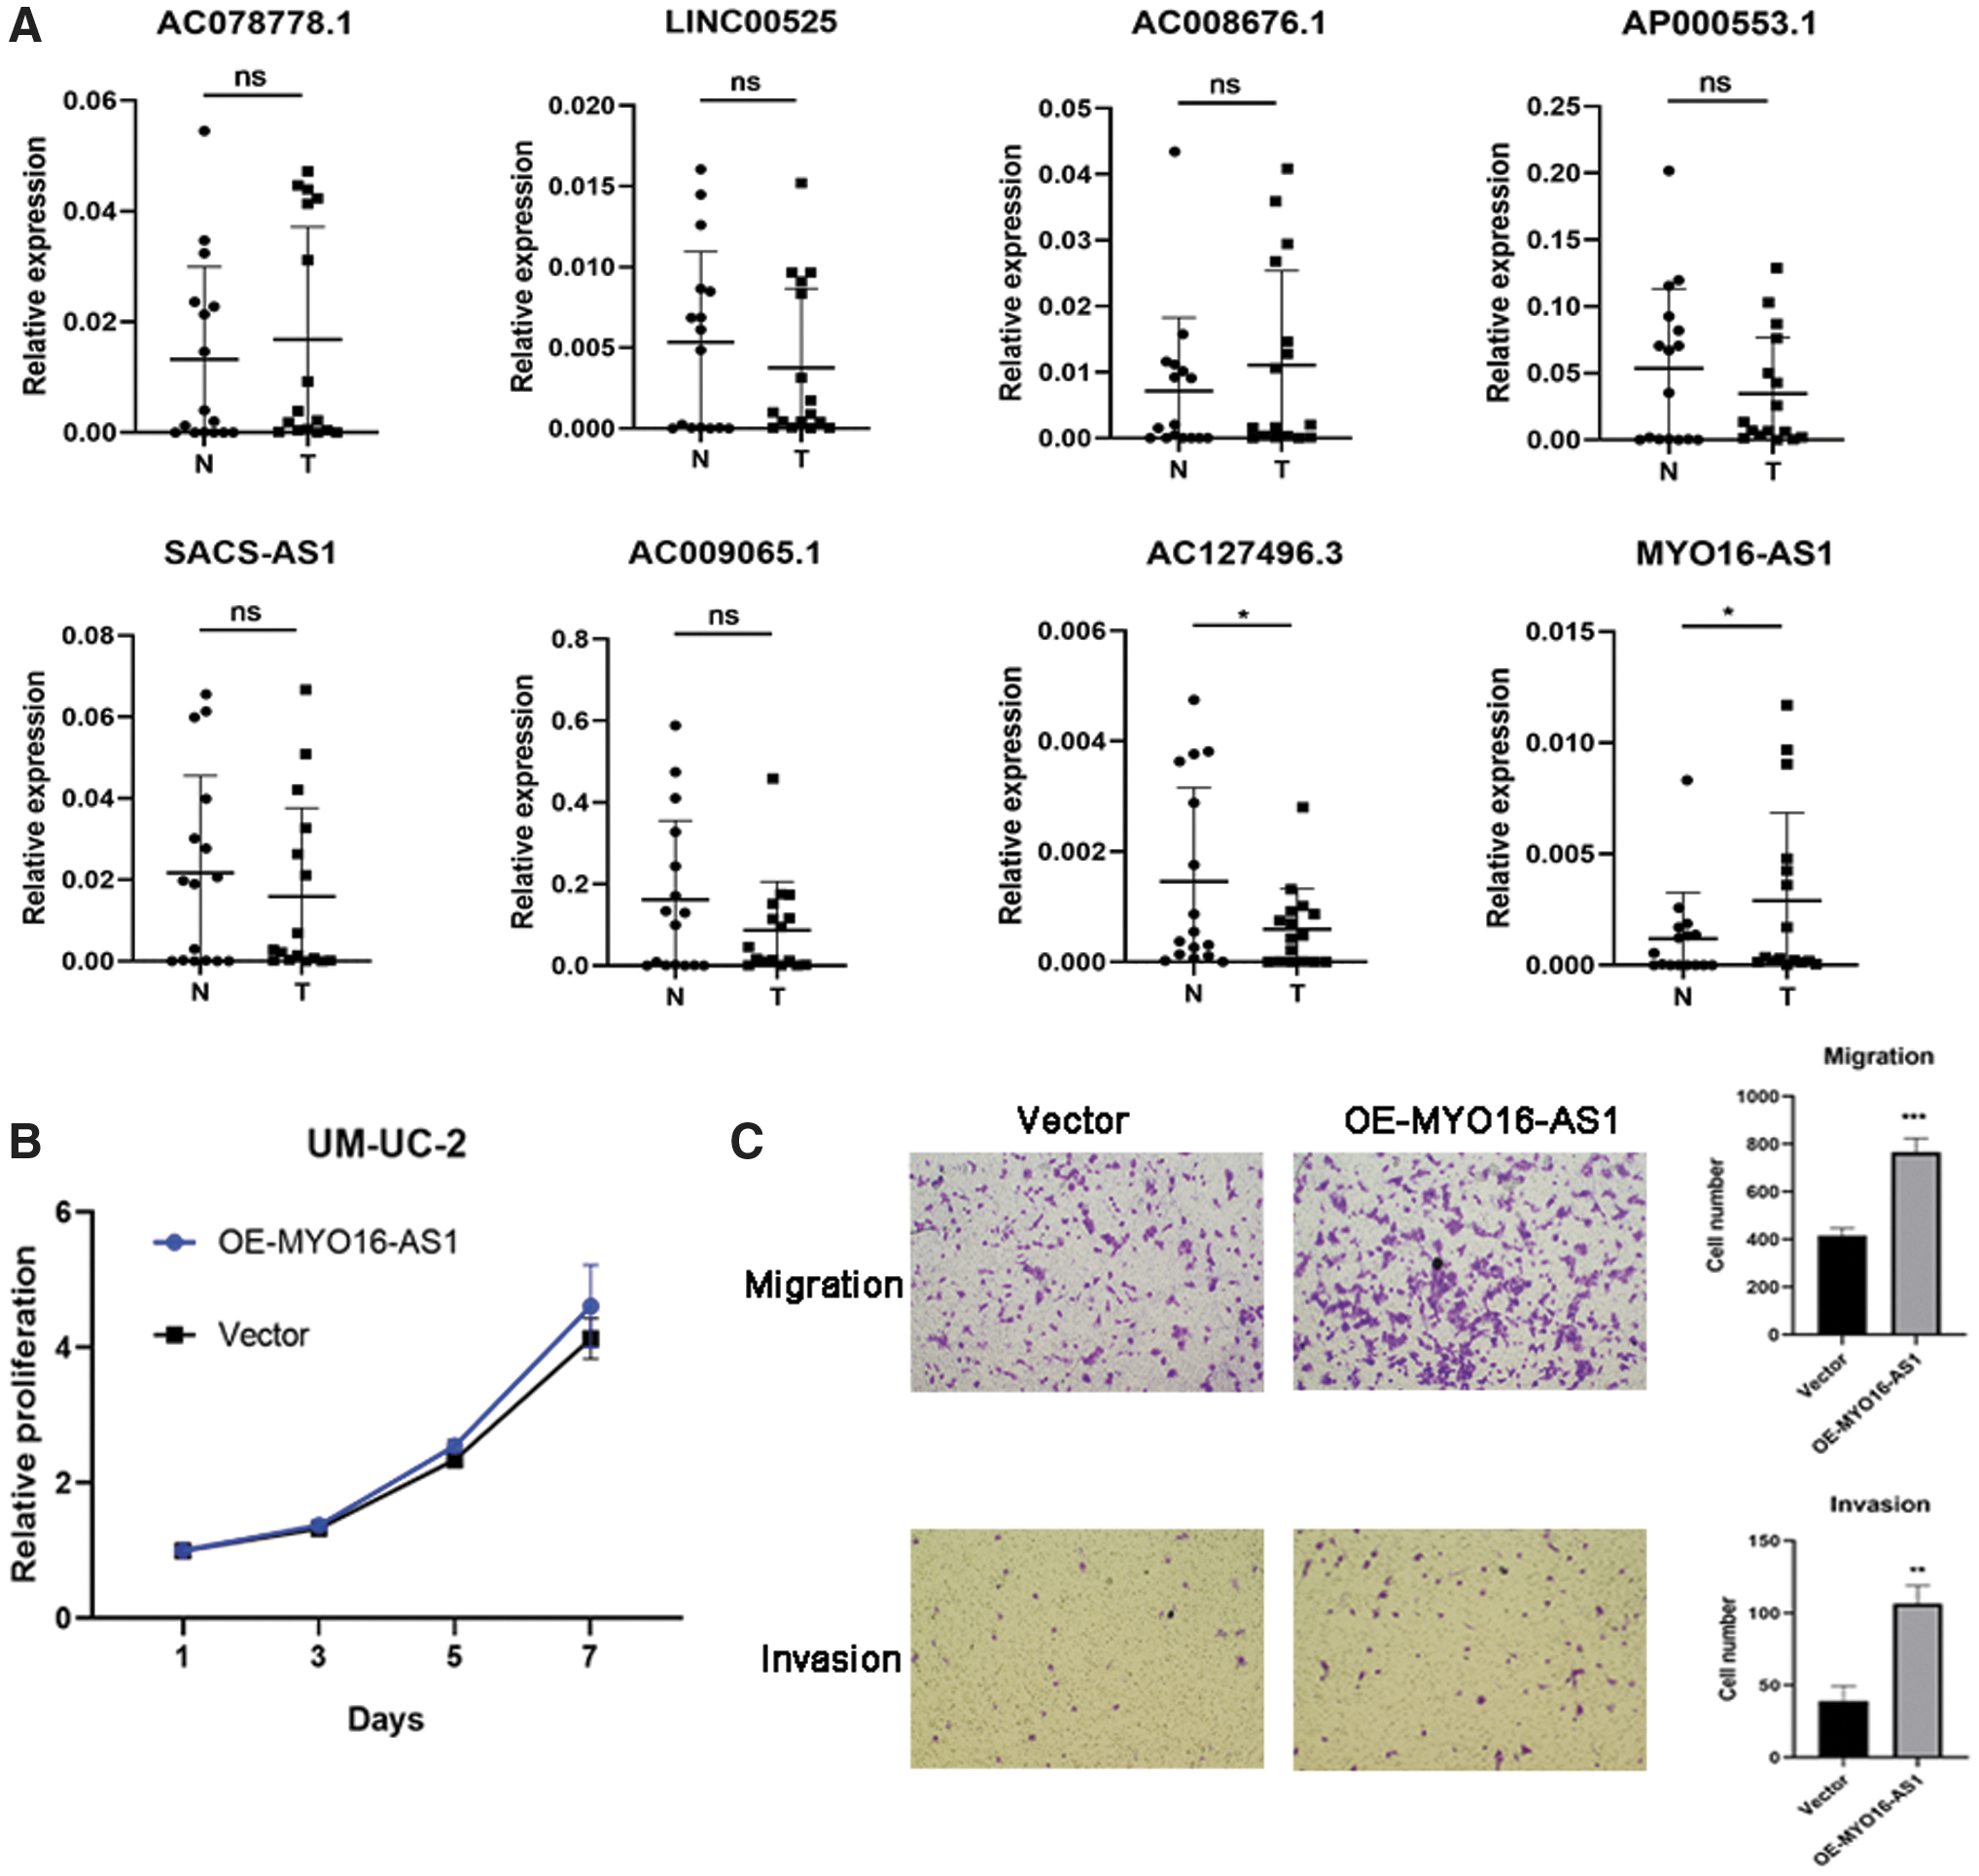
MYO16-AS1 promotes migration and invasion in UMUC2 cells.
To further investigate the oncogenic function of MYO16-AS1 in BC, we overexpressed MYO16-AS1 (Supplementary Fig. S3E) in UMUC2 cells and then performed a CCK8 assay and transwell assay. The CCK8 assay showed that MYO16-AS1 had no effect on cell growth (Fig. 5B). The results of the transwell assay demonstrated that MYO16-AS1 could, however, facilitate the migration and invasion ability of UMUC2 cells (Fig. 5C). In conclusion, these results suggest that MYO16-AS1 may play a critical role in promoting BC migration and invasion.
Discussion
To date, a ceRNA-related lncRNA signature has been widely identified in many cancers (Fan et al., 2018; Yin et al., 2018; Bai et al., 2019), but it has never been investigated in MIBC. Hence, in this study, in addition to establishing the ceRNA network, we also examined the influence of lncRNAs on patient survival and established an lncRNA prognostic signature.
Our ceRNA network demonstrated that 14 lncRNAs showed statistically significant effects on BC prognosis (p < 0.05). Among those 14 lncRNAs, ADAMTS9-AS1, ADAMTS9-AS2, LINC00460, and MAGI2-AS3 are the most well-studied lncRNAs in various types of cancers. ADAMTS9-AS1 has been reported as a prognostic biomarker for several cancers (Wang et al., 2016; Li et al., 2017; Fan et al., 2018; Xing et al., 2018a). The lncRNA ADAMTS9-AS1 has long been seen as a tumor suppressor, but more recently, it has emerged as an oncogenic modulator in several cancers. ADAMTS9-AS1 has been shown to function as a ceRNA for miRNAs to suppress cell proliferation, migration, and invasion in lung cancer (Liu et al., 2018a) and gastric cancer (Cao et al., 2018). By contrast, two other studies indicate that it could promote tongue squamous cell carcinoma (Li et al., 2019) and ovarian cancer (Wang et al., 2018a) progression through its ceRNA activity, resulting in a poor prognosis. In our study, ADAMTS9-AS1 was negatively associated with poor survival and it was downregulated in MIBC. It competed with 10 upregulated miRNAs (has-mir-205, has-mir-372, hasmir-183, has-mir-144, has-mir-373, has-mir-200a, has-mir-182, has-mir-96, has-mir-31, and has-mir-301b) to repress expression of their target genes, such as CADM2, FGF9, and SLC25A25.
Numerous previous studies have shown that the lncRNA LINC00460 enhanced progression of many caners via miRNA sponging (Liu et al., 2018b; Xing et al., 2018b; Feng et al., 2019) whereas MAGI2-AS3 has been determined to be a tumor suppressor in several cancers (Du et al., 2019; Yin et al., 2019), including BC (Wang et al., 2018b). In BC, MAGI2-AS3 regulates CCDC19 expression via sponging miR-15b-5p, whereas miR-15b-5p and CCDC19 were not included in our ceRNA network.
In addition, on the basis of the ceRNA network, an lncRNA prognostic signature composed of 8 lncRNAs was generated for MIBC patients by using a multivariate Cox regression model. The cumulative, combined risk score for the 8 lncRNAs shows that the predictive model can independently predict the survival rate of MIBC patients. The AUC of the ROC analysis was 0.758 (3 years) and 0.728 (5 years), suggesting the good prognostic power of the signature. To further explore the function of 8 lncRNAs and validate their expression pattern in the TCGA dataset, we collected 16 pairs of MIBC patient samples and assessed the expression of 8 lncRNAs. Probably due to our limited number of patient samples, the results only confirmed that AC127496.3 was downregulated and MYO16-AS1 was upregulated in MIBC tissues compared with normal tissues, a finding that is consistent with the TCGA dataset. The Kaplan–Meier curve showed that a high MYO16-AS1 expression level is associated with longer survival time, suggesting that MYO16-AS1 plays a pro-oncogenic role in MIBC. In addition, our migration and invasion assays demonstrate that MYO16-AS1 induces the metastasis in BC. In our ceRNA network, has-mir-489 is the only target miRNA of MYO16-AS1.
Previous studies have described the metastasis-inhibiting implications of has-mir-489 in multiple cancers (Yang et al., 2019; Jiang et al., 2020). Yuan et al. found that has-mir-489 could enhance pancreatic cancer metastasis via inhibition of ADAM9 and MMP7 expression (Yuan et al., 2017). Wang et al. have shown that has-mir-489 decreased glioma cell invasiveness by targeting the PAK5/RAF1/MMP2 pathway (Wang et al., 2019). For these reasons, we suspect that the pro-oncogenic role of MYO16-AS1 in BC was mediated by directing binding with has-mir-489 and further inhibiting has-mir-489 functions.
In summary, we first established an lncRNA-associated predictive model that is based on ceRNA within MIBC and further identified MYO16-AS1 as a pro-metastatic lncRNA in BC. There are still some limitations to the current study. Confirmation of our TCGA-based results from additional databases and more MIBC patient samples will be a step forward. Resolution of the detailed mechanism of MYO16-AS1's promotion of BC migration and invasion awaits further investigation.
Conclusion
In conclusion, we constructed a ceRNA network to understand the molecular mechanisms involved in MIBC. Based on that network, we further established an 8-lncRNAs prognostic signature to predict the OS of MIBC patients, and we found that MYO16-AS1 facilitates metastasis in BC.
Footnotes
Authors' Contributions
D.S., Q.Z., and Y.Z. conceived and designed the research. D.S., Y.Z., and L.X. analyzed data. S.Y. and S.C. collected patient samples. D.S., Q.Z., and L.X. performed RT-qPCR and cell experiments. D.S., Y.Z., and G.L. wrote this article. All authors revised the article.
Disclosure Statement
The authors declare that they have no competing interests.
Funding Information
This study was supported by grants from the National Natural Science Foundation of China (No. 81702504) and Zhejiang Provincial Medicine and Health Technology Project (No. 2020370101).
Supplementary Material
Supplementary Table S1
Supplementary Table S2
Supplementary Table S3
Supplementary Table S4
Supplementary Figure S1
Supplementary Figure S2
Supplementary Figure S3
References
Supplementary Material
Please find the following supplemental material available below.
For Open Access articles published under a Creative Commons License, all supplemental material carries the same license as the article it is associated with.
For non-Open Access articles published, all supplemental material carries a non-exclusive license, and permission requests for re-use of supplemental material or any part of supplemental material shall be sent directly to the copyright owner as specified in the copyright notice associated with the article.