




Abstract
The expressions and roles of protein inhibitor of activated STAT (PIAS) proteins, a group of proteins with STAT inhibition and SUMOylation E3 ligase activity, are rarely revealed in endometrial cancer (EC). In this study, we analyzed the expressions of PIASs and their relationships with clinical features by mining online data through web servers, including UALCAN and Gene Expression Profiling Interactive Analysis (GEPIA) in EC. The expressions of PIASs in EC tissues were further validated by immunohistochemistry (IHC). The online analyses revealed only PIAS1 was consistently downregulated both at mRNA and protein level in EC, which was validated by the IHC. Subsequently, the mechanism of PIAS1 downregulation was explored with online tools like UALCAN, cBioPortal, LinkedOmics, and the Encyclopedia of RNA Interactomes (ENCORI). The results indicated that the mutation rate of PIAS1 was extremely low and not associated with PIAS1 expression. The promoter methylation level of PIAS1 was comparable between normal and EC tissues. miR-182-5p and miR-96-5p with negative association with PIAS1 in EC were predicted to target PIAS1. Dual luciferase reporter assay confirmed miR-182-5p and miR-96-5p could target PIAS1 in EC. MiR-182-5p and miR-96-5p inhibitors could upregulate PIAS1 in EC cells. Moreover, ectopic PIAS1 expression and STAT3 inhibitor treatment significantly inhibited STAT3's activity and the levels of miR-182-5p and miR-96-5p in EC cells. Collectively, our findings revealed PIAS1 was downregulated in EC, which was caused by upregulation of miR-182-5p and miR-96-5p, and PIAS1 downregulation further activated STAT3 and increased the expression of miR-182-5p and miR-96-5p, confirming miR-182-5p and miR-96-5p mediated the negative feedback regulatory loop between PIAS1 and STAT3 in EC.
Introduction
Endometrial cancer (EC), also known as uteri corpus endometrial carcinoma, is one of the most prevalent gynecological malignancies for women both in developed and developing countries. The incidence and mortality of EC are rapidly increasing over the years (Ran et al., 2017; MacKintosh and Crosbie, 2018). Surgical resection alone, or in combination with chemotherapy and radiotherapy, is the primary treatment modality for EC patients. Satisfactory prognosis is generally approachable for EC patients at the early stage, however, which only contains a small part of overall EC patients. However, the therapeutic outcomes of most EC patients, diagnosed at advanced stages due to lack of effective diagnostic and prognostic biomarkers (Murali et al., 2014; McAlpine et al., 2016), are worse.
Therefore, it is of great significance to explore novel biomarkers, which can not only improve the understanding of molecular mechanisms of EC but also eventually enhance the clinical treatment of EC patients.
Protein inhibitors of activated STAT (PIAS) proteins (PIASs), comprising PIAS1, PIAS2, PIAS3, and PIAS4, are initially known as inhibitors of STAT transcription factors by direct interaction and abolishing their DNA binding capacity (Liu et al., 1998; Jiao et al., 2018; Wu et al., 2019). PIASs have sumo E3 ligase activity and catalyze the SUMOylation of specific substrates, like p53, NF-κB, and c-Myc (Schmidt and Muller, 2002; Rakowski et al., 2013; Wang et al., 2017), which largely account for the critical roles of PIASs in pathological processes, including tumorigenesis. Aberrant expression of PIASs have been revealed in cancers, such as breast cancer, prostate cancer, gastric cancer, lung cancer, colorectal cancer, and multiple myeloma, and correlate to the progression and prognosis of several cancers (Rabellino et al., 2017; Wu et al., 2019).
For example, PIAS1 is upregulated in prostate cancer and positively correlates to shorter relapse-free survival (RFS) (Puhr et al., 2016). Inversely, the abundance and nuclear location of PIAS1 serve as the favorable prognosis factors for patients with breast cancer (Liu et al., 2014; Chanda et al., 2017). Similarly, PIAS3 upregulation predicts improved prognosis of patients with lung squamous cell carcinoma (Abbas et al., 2015).
The expressions of PIASs in EC have been rarely explored. In this study, the expressions of PIASs in EC were analyzed by mining the online data and validated by immunohistochemistry (IHC). Downregulation of PIAS1 was consistently indicated by data from several databases, which was further validated by IHC in EC tissues. Mechanistically, in vitro experimental results revealed that miR-182-5p and miR-96-5p directly targeted PIAS1 and subsequently activated STAT3 in EC. Moreover, ectopic PIAS1 expression could downregulate miR-182-5p and miR-96-5p by suppressing STAT3 in EC. Collectively, our results revealed the negative feedback regulatory loop between PIAS1 and STAT3 in EC, which is mediated by miR-182-5p and miR-96-5p.
Materials and Methods
Ethical statement
Twenty normal endometrial samples and 20 EC tissues were collected from the surgical patients from June 2017 to December 2019 in the Second Xiangya Hospital of Central South University. The sample information was listed in Supplementary Data. The written informed consent was obtained from all enrolled patients. The study was authorized by the Academic Ethics Committee of the Second Xiangya Hospital of Central South University (PIAS-XXM-20191119) and performed under the instructions of Declaration of Helsinki. The rest data were retrieved from online databases, so it could be confirmed that all written informed consent had already been acquired.
Online databases
UALCAN was adopted to investigate the mRNA and protein levels of PIASs in EC and to analyze the relationships between PIAS1 expression and clinicopathological features in EC patients. The promoter methylation status of PIAS1 and the expression of related miRNAs in EC were also detected by UALCAN (Chandrashekar et al., 2017). The prognostic values of PIAS1 were analyzed by Kaplan–Meier plotter (Nagy et al., 2018). Gene Expression Profiling Interactive Analysis (GEPIA) was applied to validate the mRNA levels of PIASs and their prognostic values in EC (Tang et al., 2017). The mutation status of PIAS1 and their prognostic values were investigated by cBioPortal (Cerami et al., 2012). The miRNAs with notably negative correlations to PIAS1 expression in EC were obtained by LinkedOmics (Vasaikar et al., 2018) and the miRNAs targeting PIAS1 were predicted by ENCORI (Li et al., 2014).
Immunohistochemistry
IHC staining and quantitation were applied according to previous description (Liu et al., 2015; Huang et al., 2019a; Li et al., 2020). Rabbit anti-PIAS1 antibody (Proteintech, Rosemont, IL) and rabbit-PIAS2, rabbit-PIAS3, and rabbit-PIAS4 (BBI, Shanghai, China) antibodies were used. The score of IHC staining was quantified based on staining intensity and relative staining area. Absent, weak, moderate, and strong staining were assigned as 0, 1, 2, and 3, respectively. Zero percent, 0–30%, 30–60%, and >60% of staining cells were assigned as 0, 1, 2, and 3, respectively. The eventual staining score was the sum of the intensity score and area score (Huang et al., 2019a; Li et al., 2020).
Cell lines and culture
EC cell lines, HEC1B and RL952, were purchased from the American Type Culture Collection (Manassas, VA) and cultured with DMEM medium plus 10% FBS (Thermo, Waltham, MA). HEK-293T cells were also maintained in DMEM medium plus 10% FBS (Thermo). All cells were cultured in a humidified cell incubator at 37°C with 5% carbon dioxide.
Plasmid and miRNA transfection
The expression plasmids, pENTER-PIAS1, were purchased from Vigenebio, Inc. (Rockville, MD). The siRNAs, including siPIAS1 (5′-ACCCAGTCCATCCGGATATAA-3′) and siNC (negative control), miRNAs, including miR-182b-5p and miR-96-5p mimics and miR-182b-5p and miR-96-5p inhibitors, and their respective negative controls were obtained from Ribobio, Inc. (Guangzhou, China). The plasmids, miRNAs, and siRNAs were transfected alone or co-transfected into cells as described using Lipofectamine™ 2000 (Thermo Fisher, Carlsbad, CA) following the manufacturer's instructions. The sequences of siRNAs and miRNAs are listed in the Supplementary Table S1.
Cell counting kit-8 analysis
The cell counting kit-8 analysis (CCK) assay was adopted as described previous (Li et al., 2020). Briefly, EC cells with corresponding treatments were seeded into a 96-well plate at a density of 1 × 10⁴ cells per well. Every 24 h, the CCK-8 reagent was added and the absorbance at 450 nm was detected with a spectrophotometer (BioTek, Winooski, WI, USA). Three paralleled wells were applied for every group. The experiments were independently repeated thrice.
Plate clone formation
Plate clone formation was carried out as previously described (Li et al., 2020). Simply, EC cells with corresponding treatments were seeded into 6-well plates at a density of 1000 cells per well. Seven days later, the clones were fixed with methanol and stained with 0.5% crystal violet. Clones containing more than 50 cells were counted under an inverse microscope (Nikon, Tokyo, Japan). The experiments were independently repeated in triplicate.
Transwell
Transwell was performed according to previous description (Li et al., 2020). Simply, 8-μm pore size transwell chambers (Costar, ME) precoated with Matrigel (Corning, NY) were embed into the 24 well-plate. Five hundred microliters RPMI-1640 containing 2.5 × 10⁴ cells with corresponding treatments were pipetted into the chamber and 750 μL RPMI 1640 medium plus 5% FBS were added into well as a chemoattractant. The cells were cultured at 37°C for 24 h and then fixed with methanol and stained with 0.5% crystal violet. Cells on the upper side of the membrane were swabbed and the invasive cells were pictured and counted under a microscope scope (Nikon). The experiments were independently repeated in triplicate.
RNA isolation and quantitative real-time PCR
The total RNA isolation and quantitative real-time PCR (qPCR) were performed according to previous description (Huang et al., 2019b). The relative expressions of PIAS1, miR-96-5p, and miR-182-5p were determined by qPCR with GAPDH and U6 as an endogenous control, respectively. The primer sequences of PIAS1 and GAPDH are as follows: PIAS1, forward 5′-ACTGGAACTCCCACATCTTACA-3′, reverse 5′-GTTGTCTGATGCTAGACTGGTG-3′; and GAPDH, forward 5′-ATGGAGAAGGCTGGGGCTC-3′, reverse 5′-AAGTTGTCATGGATGACCTTG-3′. The miR-96-5p and miR-182-5p and U6 primers were purchased from the RiboBio, Inc. and the sequences were not offered for commercial confidentiality.
Dual luciferase reporter assay
The dual luciferase reporter assay was carried out as previous descriptions (Huang et al., 2019b). Briefly, psiCHECK2-wild-PIAS1–3′-untranslated region (UTR) and psiCHECK2-mutant-PIAS1–3′-UTR luciferase report plasmids were co-transfected with miR-96-5p mimics and miR-182-5p into HKE-293T cells, respectively, using Lipofectamine 2000 reagent (Thermo). After 48 h, the luciferase activity was detected and the relative luciferase activity was obtained by the ratio of firefly luciferase to Renilla luciferase activity.
Western blot
Western blot was performed as previously described (Huang et al., 2019b). Primary antibodies, including rabbit anti-PIAS1 (Proteintech), rabbit anti- SUMO2/3/4 (BBI), rabbit anti-STAT3, phospho-Stat3 (Ser727), phospho-Stat3 (Tyr705) (CST, Danvers, MA), rabbit anti-GAPDH (Abclonal, Wuhan, China), and mouse anti-β-Actin (Proteintech), were used to detect the corresponding protein level under distinct circumstances indicated in the Figures 5 and 6.
Statistical analysis
Statistical analyses and statistical charts were analyzed and produced using SPSS20.0 software and GraphPad Prism version 8. The student's t test, Fisher's exact test, and Pearson correlation coefficient were used for comparison and correlation analyses between two groups. For all analyses, p (two side) <0.05 was considered statistically significant.
Result
PIAS1 was consistently downregulated at both mRNA and protein level in EC
First, we investigated the mRNA level of PIASs in EC by mining data in UALCAN and GEPIA. As the data from UALCAN have shown, compared with normal tissues, PIAS1 mRNA was notably decreased, while PIAS2/3/4 were significantly increased in EC tissues (Fig. 1A). However, apart from notable downregulation of PIAS1 mRNA, the level of PIAS2/3/4 mRNAs was comparable between normal and EC tissues, which may be due to a larger volume of normal samples from GETx database (Fig. 1B). Subsequently, we explored the level of PIAS proteins in EC with the mass spectrometry-based proteomic data from the CPTAC (Office of Cancer Clinical Proteomics Research) (Chen et al., 2019) through UALCAN online server. In line with the expression tendency of PIAS1 mRNA, the level of PIAS1 protein was notably decreased in EC tissues (Fig. 2A). Paradoxically, the level of PIAS3 protein was significantly downregulated in EC tissues, exhibiting an inverse tendency to PIAS3 mRNA pattern (Fig. 2A). As for the protein level of PIAS2 and PIAS4, no notable differences were observed between normal and EC cancers (Fig. 2A). Besides, we further analyzed the protein levels of PIASs in EC specimens by IHC staining. Consistent with the mRNA expression pattern, the staining intensity of PIAS1 was significantly weaker in EC specimens than that in paracancerous samples (Fig. 2B; Table 1). The staining intensities of PIAS2, PIAS3, and PIAS4 between EC and para-cancerous tissues were comparable (Fig. 2B; Table 1). Collectively, these results manifested that PIAS1 was consistently downregulated in EC, at both mRNA and protein level, suggesting that PIAS1 serves as the main effector of PIASs and plays a critical role in EC.

The mRNA expressions of PIAS1/2/3/4 in EC tissues and normal tissues.
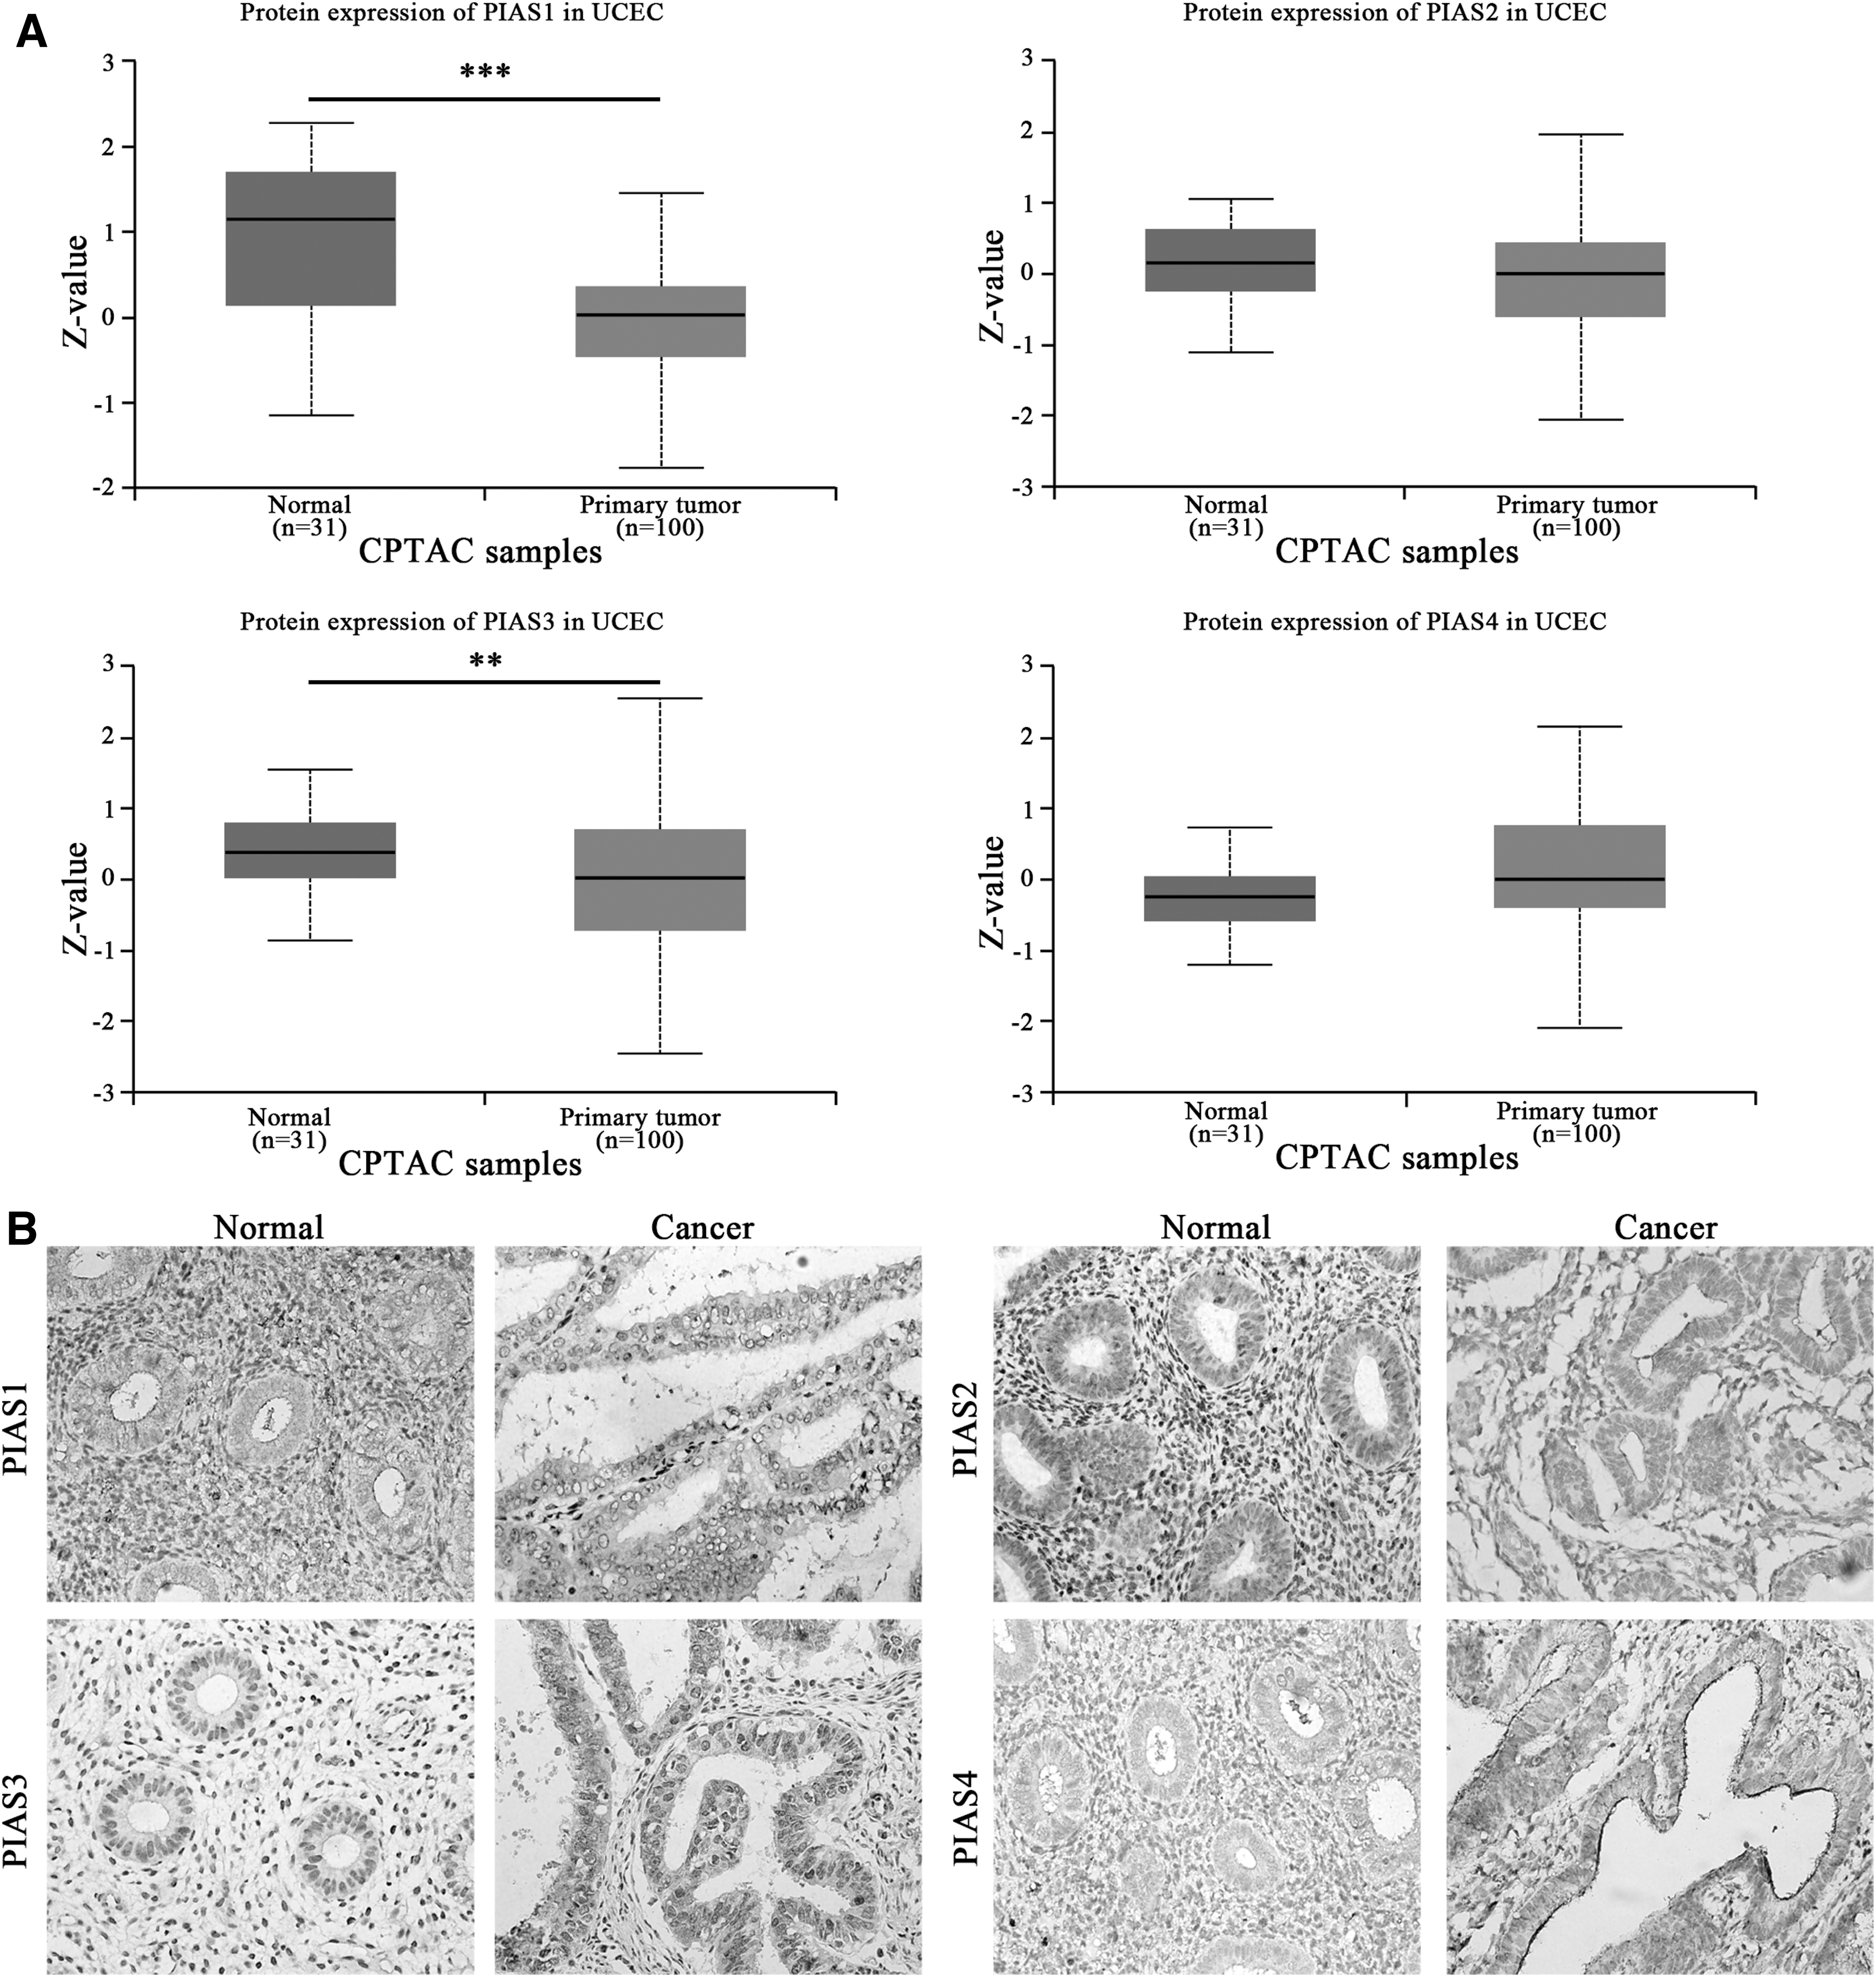
The protein level of PIAS1/2/3/4 in EC tissues and normal tissues.
Expression of Protein Inhibitor of Activated STAT in Paracancerous and Endometrial Cancer Tissues (n = 20, Fisher's Exact Test)
EC, endometrial cancer; PIAS, protein inhibitor of activated STAT.
PIAS1 showed no notable correlation to pathological features and prognosis of EC patients
Next, we investigated the relationships of PIAS1 expressions with pathological features and the prognosis of EC patients. Both mRNA and protein levels of PIAS1 exhibited no remarkable difference among distinct stages and histological types (Supplementary Fig. S1A, B). PIAS1 mRNA was not associated with TP53 mutation status of EC patients as well (Supplementary Fig. S1A). Notably, the PIAS1 mRNA showed a correlation with menopause status of EC patients with higher PIAS1 mRNA expression in perimenopause patients than premenopause and postmenopause patients (Supplementary Fig. S1A). Subsequently, we further analyzed the correlations of PIAS1 mRNA expression with the prognosis of EC patients using Kaplan–Meier plotter and GEPIA. The data revealed that the mRNA levels of PIAS1 exhibited no significant correlation with both overall survival (OS) and RFS/disease-free survival (DFS) of EC patients (Supplementary Fig. S1C), respectively. Thus, these results indicated that the expression of PIAS1 was not associated with pathological features and prognosis of EC patients.
Restoration of PIAS1 inhibits growth, proliferation, and invasion of EC cells
Next, we explored the function of PIAS1 in EC cells. The levels of PIAS1 in EC cells were successfully evaluated by ectopic expression of PISA1, indicated by qPCR (Fig. 3A) and Western blot (Fig. 3B). Subsequently, the effects of PIAS1 overexpression on growth, proliferation, and invasion of EC cells were detected. The results indicated that PIAS1 restoration notably impaired the growth, proliferation, and invasion of EC cells, demonstrated by lower cell viability (Fig. 3B), fewer clones (Fig. 3C), and fewer invasive cells (Fig. 3D), respectively. Moreover, the pan-SUMOylation status of EC cells with PIAS1 overexpression was also tested. Indeed, ectopic PIAS1 expression notably evaluated the pan-SUMOylation level of EC cells (Supplementary Fig. S2), suggesting the function of PIAS1 depends on its SUMOylation E3 ligase activity in EC. Therefore, these results prove that loss of PIAS1 exerts oncogenic roles in EC cells.
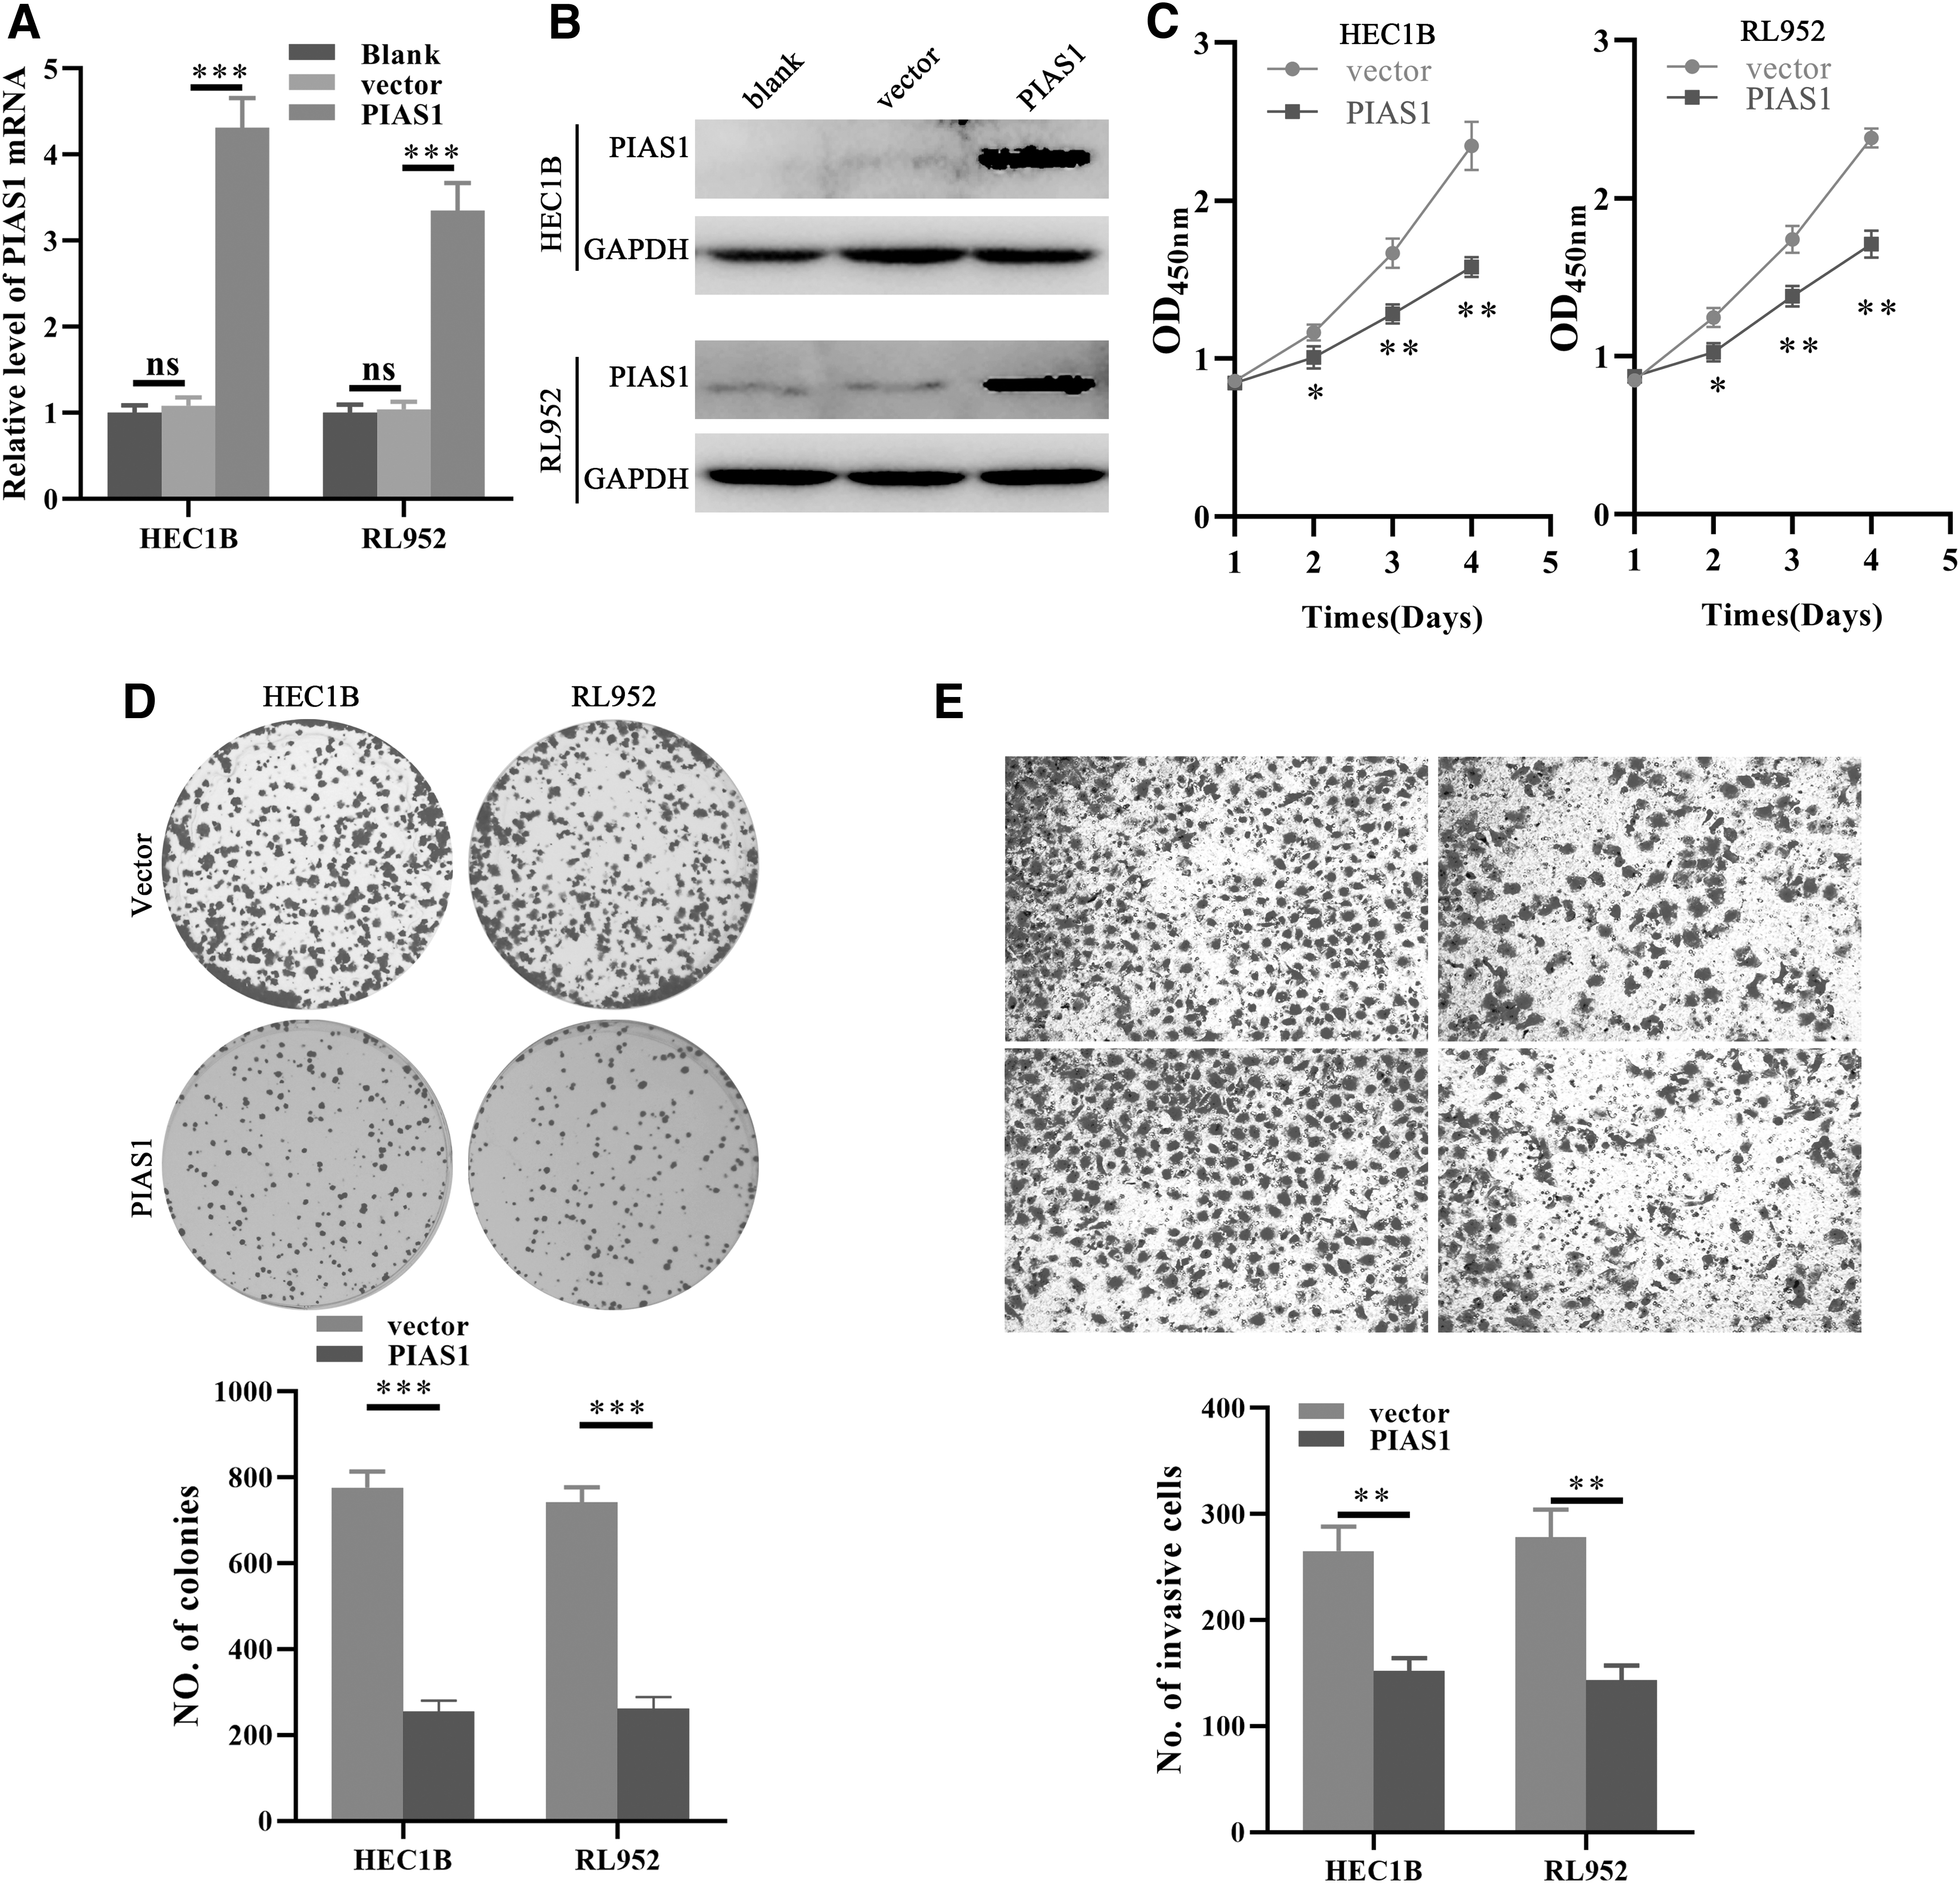
The PIAS1 restoration inhibits growth, proliferation, and invasion of EC cells. Ectopic expression of PIAS1 in HEC1B and RL952 cells, indicated by qPCR
Upregulation of miR-182-5p and miR-96-5p may account for the downregulation of PIAS1 in EC
Subsequently, we further explored the underlying mechanisms of downregulation of PIAS1 in EC. First, we analyzed the transcription-related mechanisms, including promoter methylation status and genetic mutation profiles of PIAS1, by UALCAN and cBioPortal server. As shown in Figure 4A, no notable difference of promoter methylation degree of PIAS1 was observed between normal and EC tissues (Fig. 4A). Moreover, the mutation rate of PIAS1 was only 2.21% (17 out of 544) and did not correlate to OS and DFS of EC patients (Fig. 4B; Supplementary Fig. S3A, B). These results suggested the post-transcriptional mechanisms, such as no coding RNA-related regulation, may lead to PIAS1 downregulation in EC. Therefore, we further explored the miRNAs with remarkable negative correlations with PIAS1 in EC through LinkedOmics. Twenty-two candidate miRNAs were obtained and the heat map of their expressions in EC is indicated in Supplementary Figure S4A. Interestingly, miR-183 cluster miRNAs, miR-182, miR-183, and miR-96, exhibited strongest correlation to PIAS1 in EC (Fig. 4C; Supplementary Fig. S4A). Next, we explored whether there were miRNAs that could target PIAS1 among 22 candidate miRNAs through ENCORI portal. Three miRNAs, miR-182-5p, miR-96-5p, and miR-497-5p, were predicted to target PIAS1 and showed negative correlation with PIAS1 mRNA (Fig. 4C; Supplementary Fig. S4B). Furthermore, we explored the level of miR-182-5p, miR-96-5p, and miR-497-5p in EC with UALCAN. Accordingly, miR-182 and miR-96 were significantly upregulated in EC (Fig. 4D), which was also confirmed by several studies (Myatt et al., 2010; Guo et al., 2013), further suggesting miR-182-5p and miR-96-5p may target PIAS1 in EC. Meanwhile, miR-497 was downregulated in EC tissues (Fig. 4D), indicating miR-497-5p does not involve the downregulation of PIAS1 in EC. Thus, upregulation of miR-182-5p and miR-96-5p mostly account for the downregulation of PIAS1 in EC.
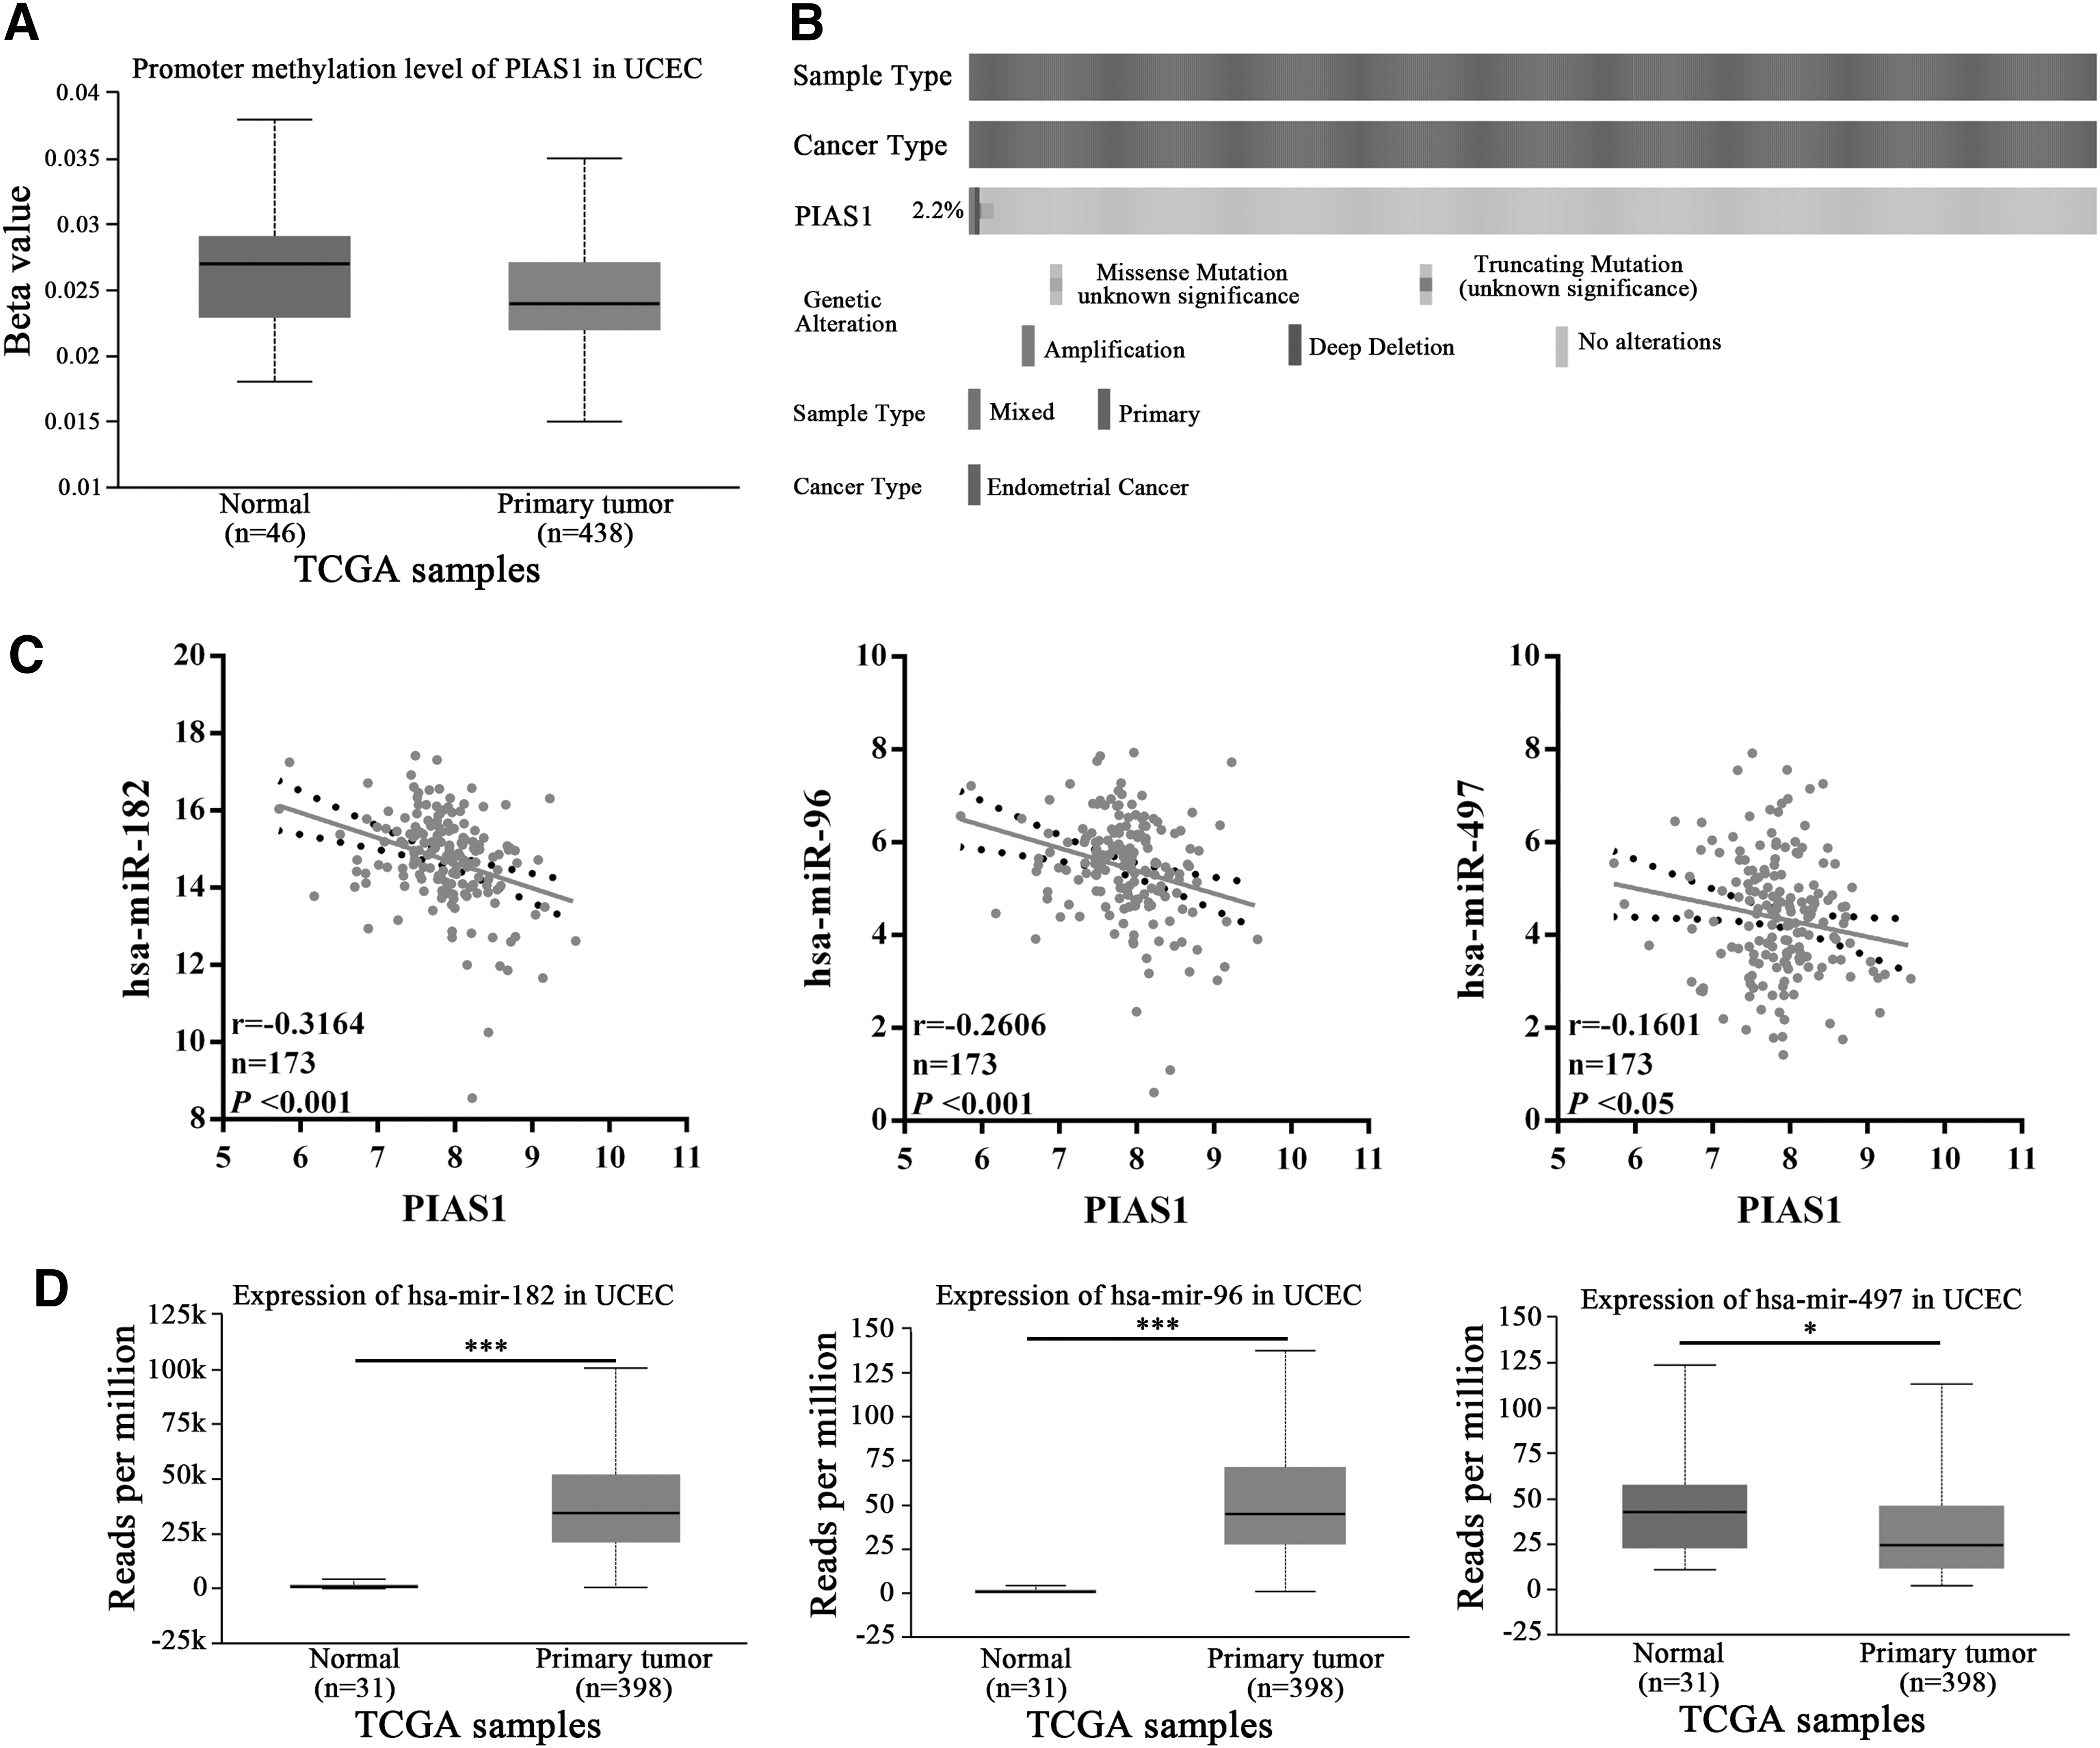
Exploring promoter methylation status, genetic mutation, and negatively related miRNAs of PIAS1 in EC.
miR-182-5p and miR-96-5p target PIAS1 and mediate the feedback regulatory loop between PIAS1 and STAT3 in EC
Next, we validated the notion that miR-182-5p and miR-96-5p may target PIAS1 in EC. As shown in Figure 5A, transfection of miR-182-5p and miR-96-5p inhibitor significantly increased the level of PIAS1 mRNA and protein. Moreover, dual luciferase reporter assays confirmed that miR-182-5p and miR-96-5p could directly bind PIAS1 and promote the degradation of PIAS1 mRNA (Fig. 5B). Interestingly, STAT3 could promote glioma tumorigenesis by inducing miR-182-5p expression (Xue et al., 2016). Considering the inhibitory functions of PIAS1 on STAT3 (Diao et al., 2009; Wu et al., 2019), these results suggested that a negative feedback loop between PIAS1 and STAT3 may exist in EC, which would mostly be mediated by miR-182-5p and miR-96-5p. Indeed, ectopic PIAS1 expression notably inhibited the activity of STAT3 and decreased the level of miR-182-5p and miR-96-5p in EC cells (Fig. 5C, D). Consistently, the level of miR-182-5p and miR-96-5p was significantly decreased and the level of PIAS1 was increased in EC cells when STAT3 was inhibited by a specific inhibitor Stattic (1 μM) (Fig. 5E, F). Taken together, these results validated that miR-182-5p and miR-96-5p target PIAS1 and mediate the feedback regulatory loop between PIAS1 and STAT3 in EC.
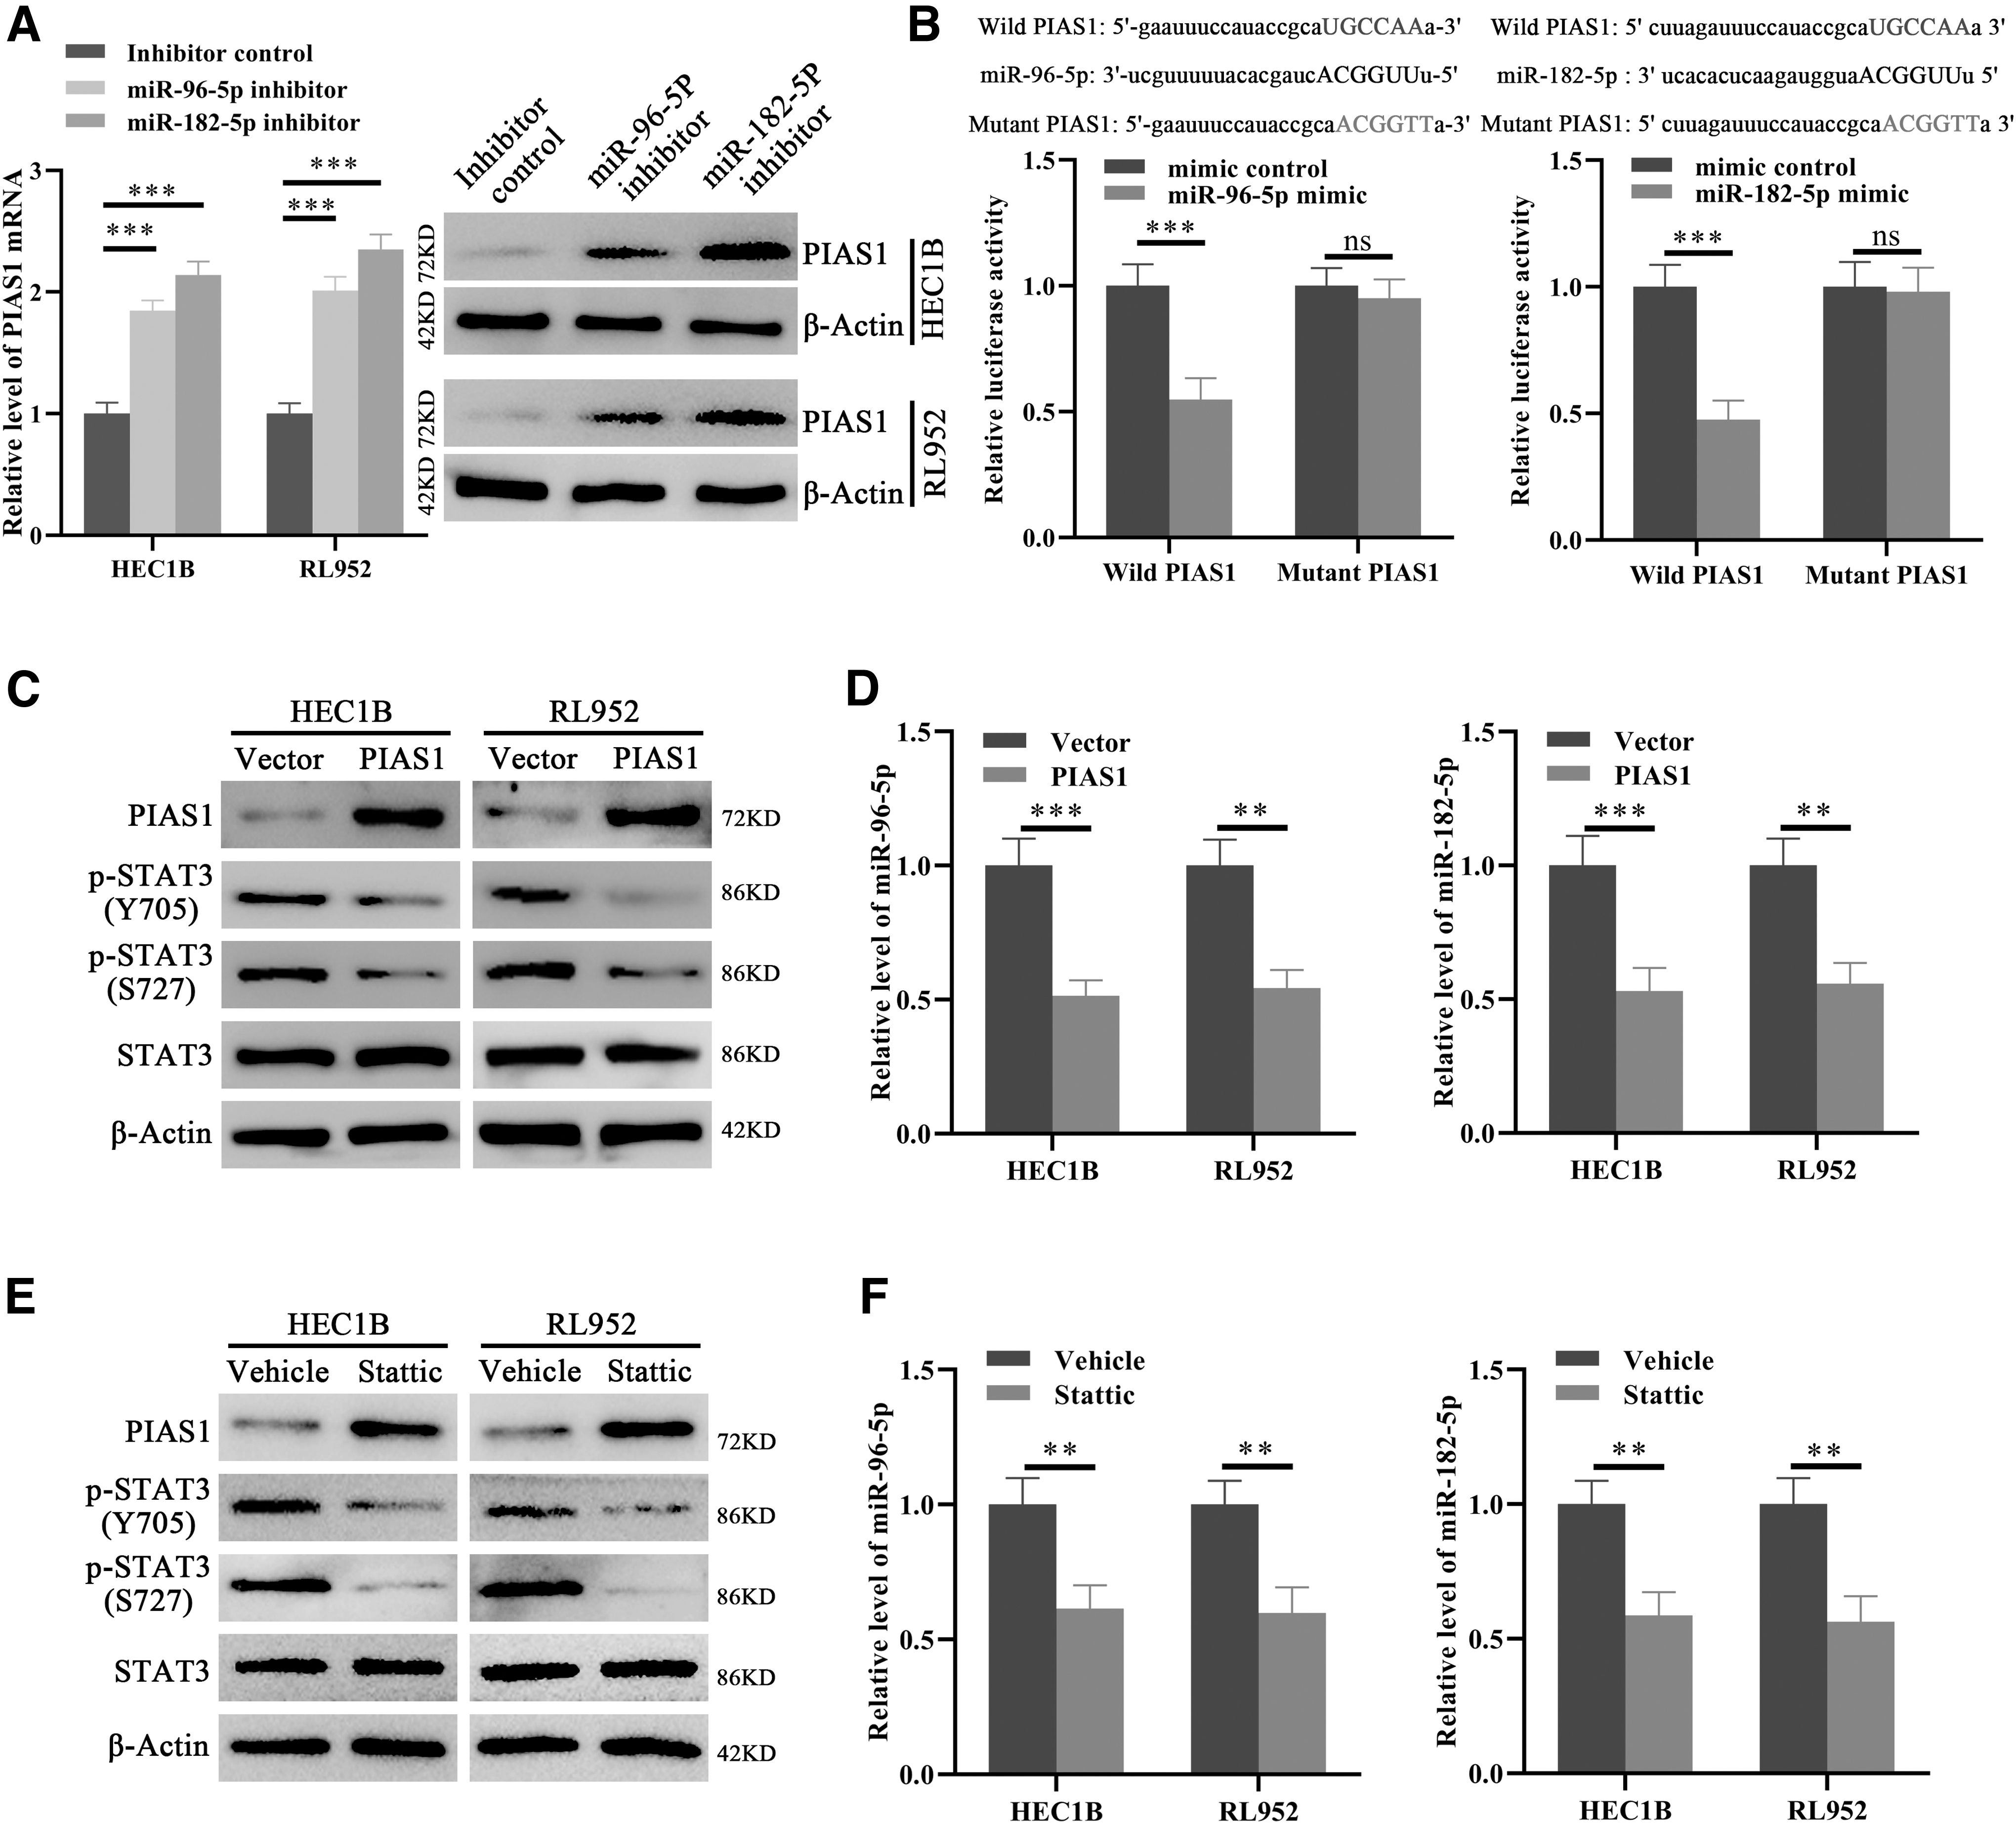
miR-182-5p and miR-96-5p target PIAS1 and mediate the negative feedback loop between PIAS1 and STAT3.
PIAS1 knockdown abolished the oncogenic roles of miR-182-5p and miR-96-5p in EC
Subsequently, we evaluated the roles of PIAS1 in mediating the effects of miR-182-5p and miR-96-5p in EC cells. miR-182-5p and miR-96-5p inhibitor treatment remarkably upregulated the levels of PIAS1 and inhibited the activities of STAT3, indicated by the level of p-STAT3 (S727) and p-STAT3 (Y705), which could be re-activated when PIAS1 was specifically knocked down by siRNAs in EC cells (Fig. 6A). Consistently, the growth, proliferation, and invasion of EC cells were constrained by miR-182-5p and miR-96-5p inhibitors; however, these inhibitory effects were released when PIAS1 was re-downregulated by specific siRNAs (Fig. 6B–D). Thus, these outcomes confirmed that PIAS1 downregulation was necessary for the oncogenic roles of miR-182-5p and miR-95-5p in EC cells.
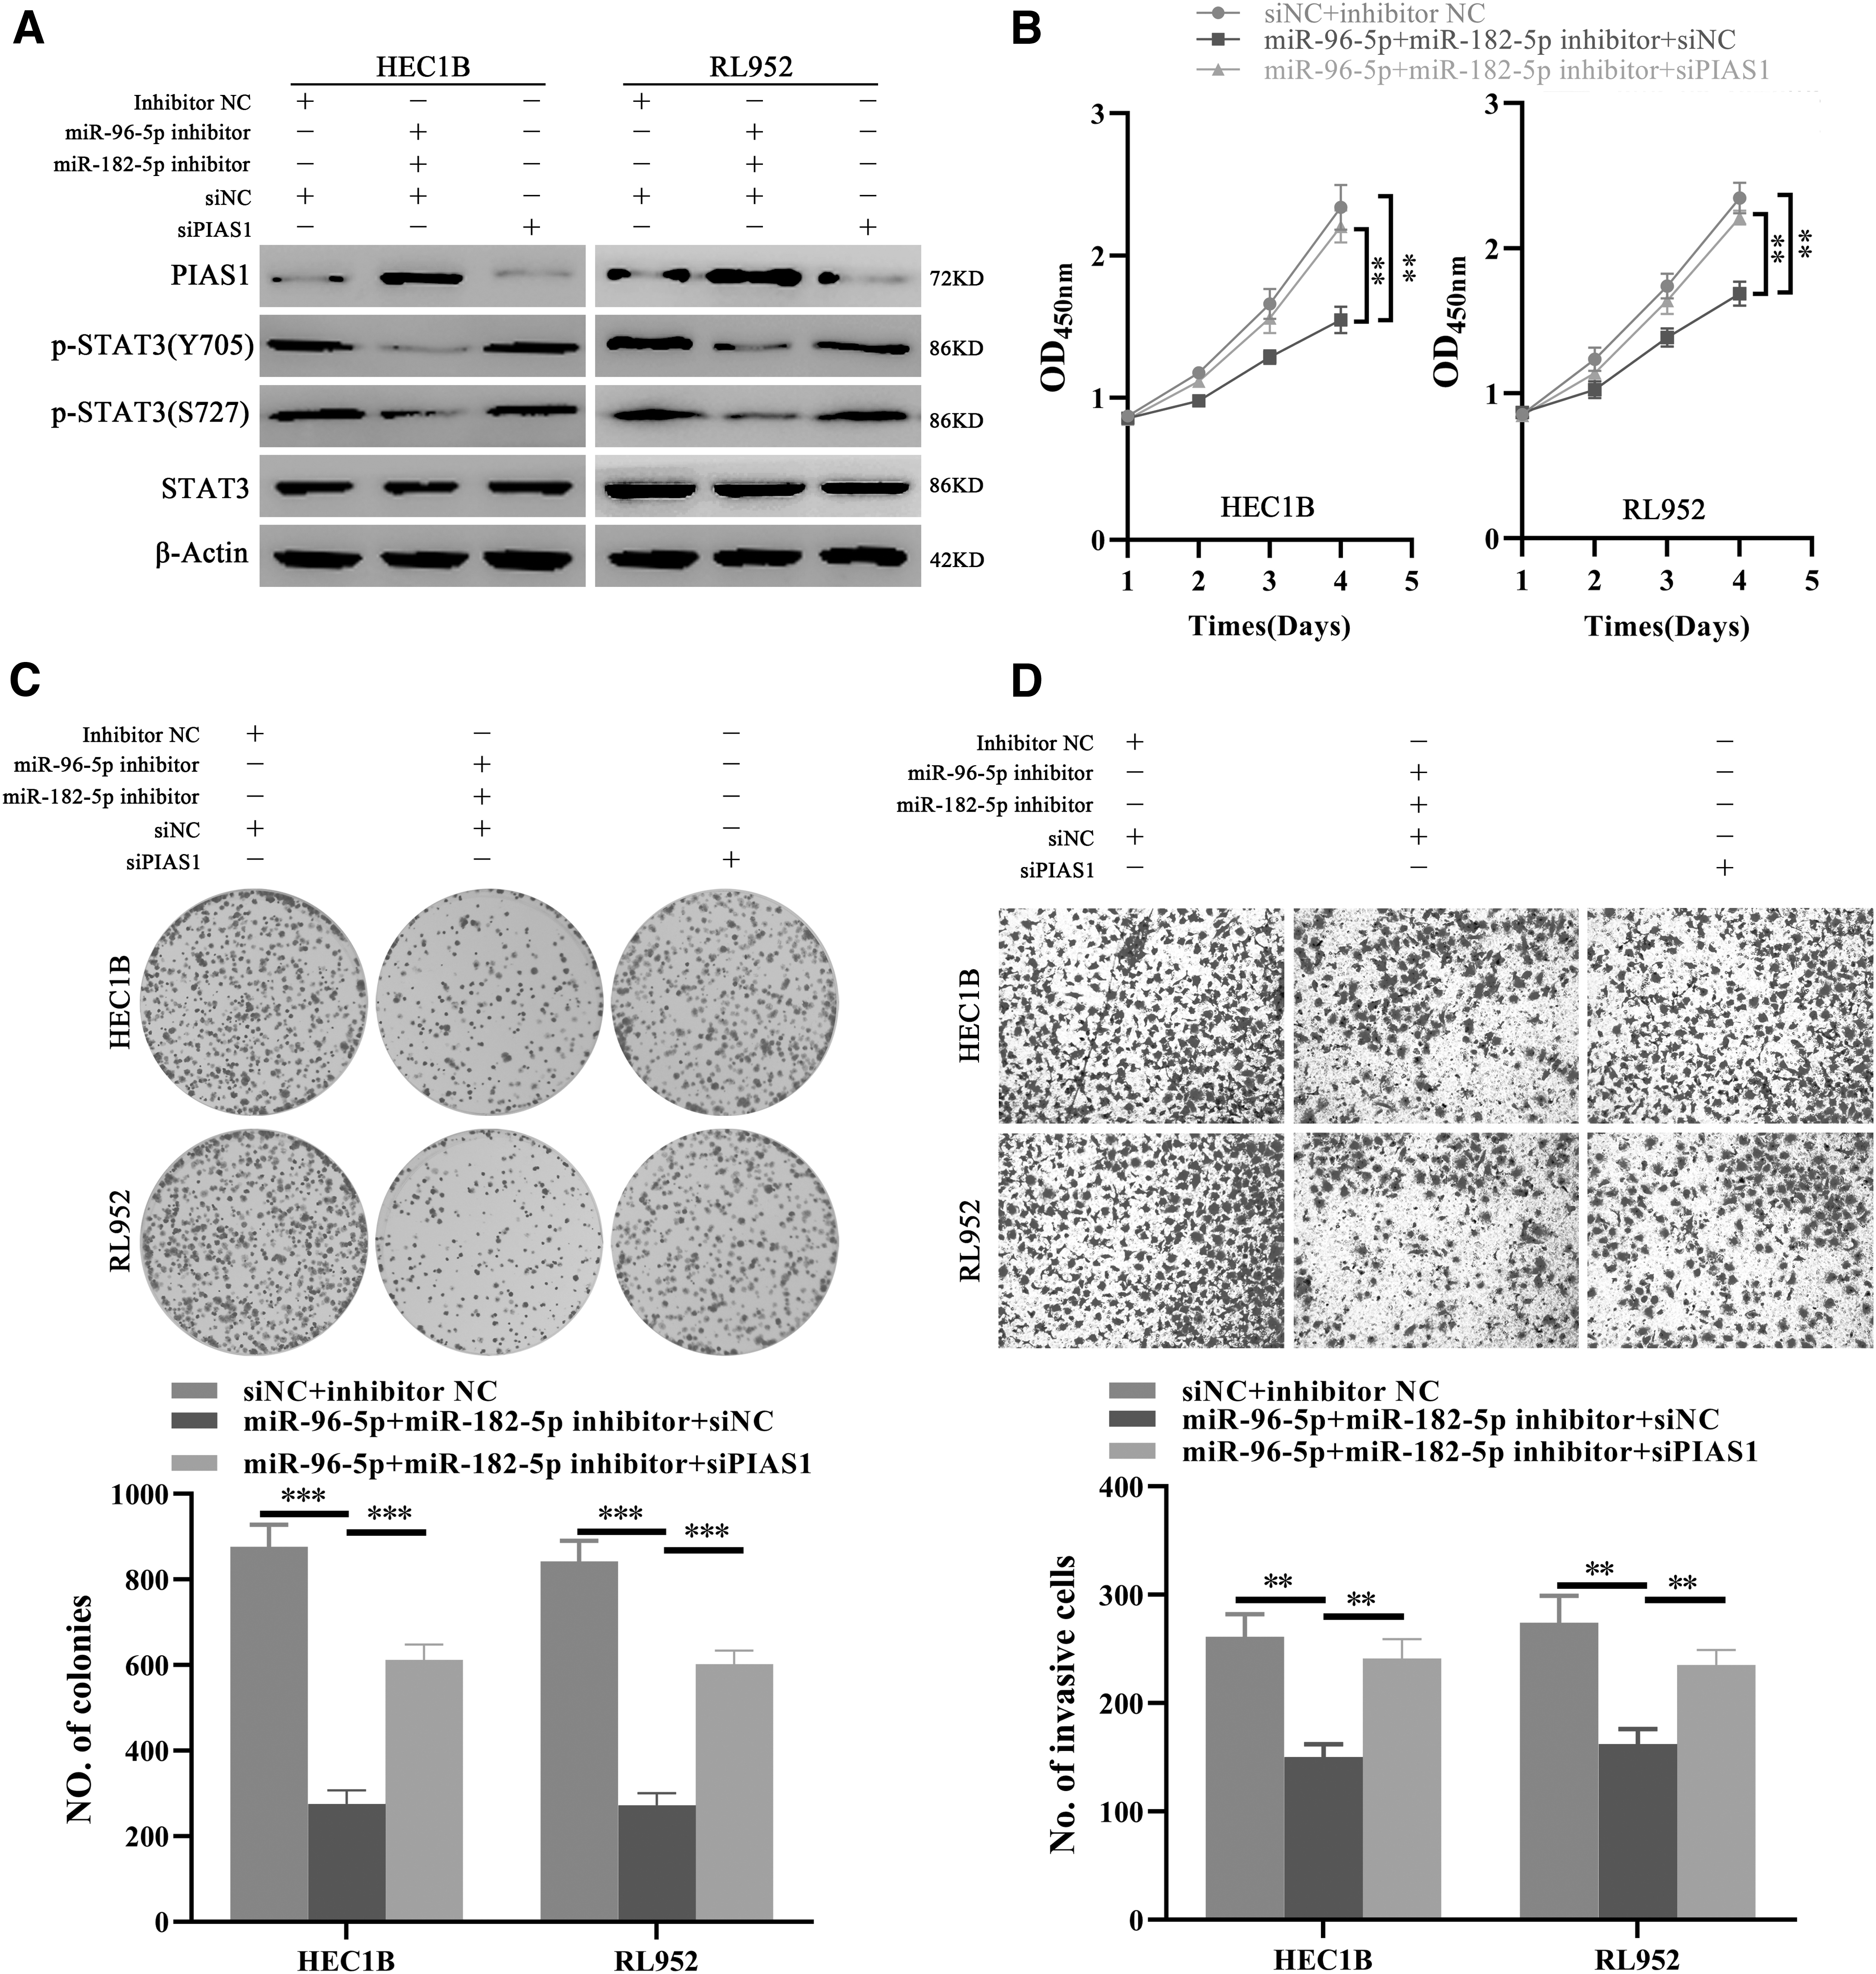
PIAS1 mediates the protumor functions of miR-182-5p and miR-96-5p in EC cells. (
Discussion
The aberrant expressions and functions of PIASs have been revealed in various cancers; however, the expressions and roles of PIASs have been rarely revealed in EC. In this study, we explored the mRNA and protein level of PIASs in EC and revealed that PIAS1 was consistently downregulated in EC. The expression of PIAS1 shows no significant correlation to pathological parameters such as stages, histopathological type, and TP53 mutation status, except for menopause status, and prognosis of EC patients. PIAS1 restoration could inhibit malignant progression of EC cells. Mechanistically, upregulation of miR-182-5p and miR-96-5p, which directly target PIAS1, accounts for the downregulation of PIAS1 and subsequently promotes malignant progression of EC cells. Furthermore, we originally demonstrate that PISA1 and STAT3 form a negative feedback loop by modulating miR-182-5p and miR-96-5p expression.
The critical roles of PIAS1 have been revealed by multiple studies (Rabellino et al., 2017; Wu et al., 2019). For example, PIAS1 upregulation predicts poor survival and antagonizes cell apoptosis in prostate cancer by maintaining the stability of AR (Puhr et al., 2014, 2016). Accordingly, PIAS1 promotes survival and progression lung cancer by physical interaction with focal adhesion kinase (Constanzo et al., 2016). In contrast, PIAS1 is downregulated and exerts antitumor roles in cancers. PIAS1 is downregulated, shows negative relation to tumor stages, and represses metastasis by inhibiting MAPK signaling in gastric cancer (Wei et al., 2011; Chen et al., 2012; Wang et al., 2018). PIAS1 is decreased in colon cancer and inversely correlates with tumor stages (Coppola et al., 2009). In this study, we revealed that PIAS1 was downregulated in EC both at mRNA and protein level. Nevertheless, PIAS1 showed no significant correlation with stages, histological types, and prognosis of EC patients. Accordingly, PIAS1 restoration exerted significant inhibitory effects on the malignant characteristics of EC cells, suggesting PIAS1 severs as a tumor suppressor protein in EC as well.
MiR-183 miRNA cluster, including miR-183, miR-182, and miR-96, is highly conserved and spliced from the same template. Upregulation of miR-183 cluster and their oncogenic roles has been revealed in dozens of cancers, including EC (Ma et al., 2016). MiR-182 and miR-96 are upregulated and promote malignant progression in EC by targeting TCEAL7, Cullin-5, and FOXO1 (Guo et al., 2013; Devor et al., 2016; Fang et al., 2018). Our results validated that miR-182-5p and miR-96-5p could directly bind and decrease PIAS1 expression, subsequently activate STAT3, and eventually promote malignant progression of EC cells, demonstrating PIAS1 is another target of miR-182-5p and miR-96-5p in EC. Interestingly, previous study has indicated that miR-182-5p is positively regulated by STAT3 in glioma tumorigenesis (Xue et al., 2016), suggesting a negative feedback loop between PIAS1 and STAT3 may exist in EC. Indeed, our results revealed that PIAS1 restoration could suppress STAT3 activity and decrease the expression of miR-182-5p and miR-96-5p. Accordingly, STAT3 activity inhibition led to downregulated miR-182-5p and miR-96-5p and upregulated PIAS1. Therefore, we present a negative feedback loop between PIAS1 and STAT3, which is mediated by miR-182-5p and miR-96-5p, exists in EC.
Conclusions
In conclusion, our findings reveal that PIAS1 is downregulated in EC, which is caused by upregulation of miR-182-5p and miR-96-5p. PIAS1 downregulation activates STAT3 and increases the expression of miR-182-5p and miR-96-5p, confirming the negative feedback regulatory loop, miR-182-5p+miR-96-5p/PIAS1/STAT3/miR-182-5p+miR-96-5p, in EC, and eventually promotes the malignant progression of EC, highlighting the promising application of this axis as the biomarker and therapeutic target in EC.
Footnotes
Disclosure Statement
No conflict of interests was declared by the authors.
Funding Information
This study was granted by the National Natural Science Foundation of China (Nos. 81702924, 81671437, 81771558, and 81771558), the Natural Science Foundation of Hunan Province of China (Nos. 2018JJ3811, 2019JJ40426, and 2020JJ4814), the Educational Commission of Hunan Province of China (19K101), Science and Technology Plan Project of Hunan Province (2020ZK4013), and the Open Sharing Fund for the Large-scale Instruments and Equipments of Central South University.
Supplementary Material
Supplementary Data
Supplementary Figure S1
Supplementary Figure S2
Supplementary Figure S3
Supplementary Figure S4
Supplementary Table S1
References
Supplementary Material
Please find the following supplemental material available below.
For Open Access articles published under a Creative Commons License, all supplemental material carries the same license as the article it is associated with.
For non-Open Access articles published, all supplemental material carries a non-exclusive license, and permission requests for re-use of supplemental material or any part of supplemental material shall be sent directly to the copyright owner as specified in the copyright notice associated with the article.
