




Abstract
This study aimed to explore the potential diagnostic biomarkers and mechanisms underlying acute myocardial infarction (AMI). We downloaded four datasets (GSE19339, GSE48060, GSE66360, and GSE97320) from the Gene Expression Omnibus database and combined them as an integrated dataset. A total of 153 differentially expressed genes (DEGs) were analyzed by the linear models for microarray analysis (LIMMA) package. Weighted gene co-expression network analysis was used to screen for the significant gene modules. The intersection of DEGs and genes in the most significant module was termed “common genes” (CGs). CGs were mainly enriched in “inflammatory response,” “neutrophil chemotaxis,” and “IL-17 signaling pathway” through functional enrichment analyses. Subsequently, 15 genes were identified as the hub genes in the protein–protein interaction network. The Fc fragment of IgE receptor Ig (FCER1G) and prostaglandin-endoperoxide synthase 2 (PTGS2) showed significantly increased expression in AMI patients and mice at the 12-h time point in our experiments. The receiver operating characteristic (ROC) curve was used to evaluate the diagnostic value of FCER1G and PTGS2. The area under ROC curve of FCER1G and PTGS2 was 77.6% and 80.7%, respectively. Moreover, the micro (mi)RNA-messenger (m)RNA network was also visualized; the results showed that miRNA-143, miRNA-144, and miRNA-26 could target PTGS2 in AMI progression.
Introduction
Acute myocardial infarction (AMI), one of the most severe manifestations of coronary heart disease, represents myocardial necrosis caused by acute, persistent ischemia and hypoxia of the coronary artery (Pan et al., 2020). Relevant epidemiological investigations report that AMI is responsible for 3–4 million deaths annually (Mirzavi et al., 2019). The outcomes of AMI include malignant arrhythmia, shock, heart failure, and sudden death leading to high morbidity and mortality (Mozaffarian et al., 2016).
The reperfusion of occluded coronary artery recanalization and ischemic myocardium within 3–6 h, or the latest by 12 h, of AMI can enable the near-necrotic cardiomyocytes to survive or reduce the necrotic range, reduce the myocardial remodeling after infarction, significantly improve the prognosis of patients, and reduce the mortality rate (Yang et al., 2006; Bajaj et al., 2015). In recent times, the biomarkers used for early diagnosis of AMI have mainly focused on cardiac troponin, despite the high false-positive rate (Jarolim, 2015; Park et al., 2017). Identification of new blood biomarkers is essential for better diagnosis of AMI.
The pathogenesis of AMI is complex and includes cardiomyocyte apoptosis, fibrosis, inflammation, and pathological hypertrophy. Atherosclerosis (AS) is the predominant cause of AMI. Inflammation is the main step underlying initiation and progression of AS and causes AMI (Moriya, 2019). Simultaneously, ischemia suffered during AMI causes tissue damage, leading to an inflammatory process. In addition, preclinical data suggest that an acute inflammatory response following an MI accelerates systemic AS (Joshi et al., 2015).
Over recent decades, high-throughput sequencing and public databases have been used widely for novel biomarkers of cardiovascular disease (Zhu et al., 2016). Weighted gene co-expression network analysis (WGCNA) is a systematic biological strategy for evaluating the patterns of gene association among different samples (Ravasz et al., 2002). Numerous potential biomarkers of AMI have been identified using WGCNA based on sequencing data (Li et al., 2019; Liu et al., 2019). For instance, Liu et al. (2019) revealed that fibroblast growth factor binding protein 2 (FGFBP2) and glucose-fructose oxidoreductase domain containing-1 (GFOD1) could be genetic biomarkers for the diagnosis of AMI (Liu et al.).
In this study, microarray datasets of AMI (GSE19339, GSE48060, GSE66360, and GSE97320) were collected from the Gene Expression Omnibus (GEO) database. Using various bioinformatics methods such as analysis of differentially expressed genes (DEGs), WGCNA, functional enrichment analyses, construction of protein–protein interactive (PPI) network, and microRNA–mRNA network for the initial identification of potential biomarkers, we subsequently identified relevant miRNAs and pathways associated with AMI. Then, the 15 hub genes from the PPI network were initially verified by reverse transcription-quantitative real-time polymerase chain reaction (RT-qPCR) in AMI patients and mice. Furthermore, different time points were set up to verify the identified hub genes from initial validation in AMI patients. Immunohistochemistry was carried out on AMI mice hearts to further confirm the expression of the identified hub genes. Finally, a receiver operating characteristic (ROC) curve was applied to analyze the diagnostic value of the identified hub genes.
Our results may help us to (1) discover new biomarkers with high sensitivity, which are important in AMI diagnosis, and (2) improve our understanding of the underlying mechanisms of AMI.
Materials and Methods
Ethical approval
The study protocol of animal experiments was approved by the Ethics Committee of Nanjing Medical University (Nanjing, China) (Approval number: IACUC-1803019). The study was undertaken in accordance with the Guide for the Care of Laboratory Animals published by the U.S. National Institutes of Health (publication 85–23, revised in 1996) in Bethesda, MD.
The clinical blood sample collection protocol was approved by the Ethics Committee of the Affiliated Hospital of Xuzhou Medical University (Xuzhou, China) (IRB Approval number: XYFY2018-KL043–01; March 7, 2018). All volunteers provided written informed consent for their blood samples to be used for experimentation, and all the volunteers were recruited at the Affiliated Hospital of Xuzhou Medical University.
Microarray data
The study design is shown in Figure 1. The data of gene expression profiles from GSE48060 (U.S.; 31 patients with AMI and 21 healthy controls [HCs]), GSE66360 (U.S.; 49 patients with AMI and 50 HCs), GSE97320 (China; 3 patients with AMI and 3 HCs), and GSE19339 (Switzerland; 4 patients with AMI and 4 HCs) were downloaded from GEO (
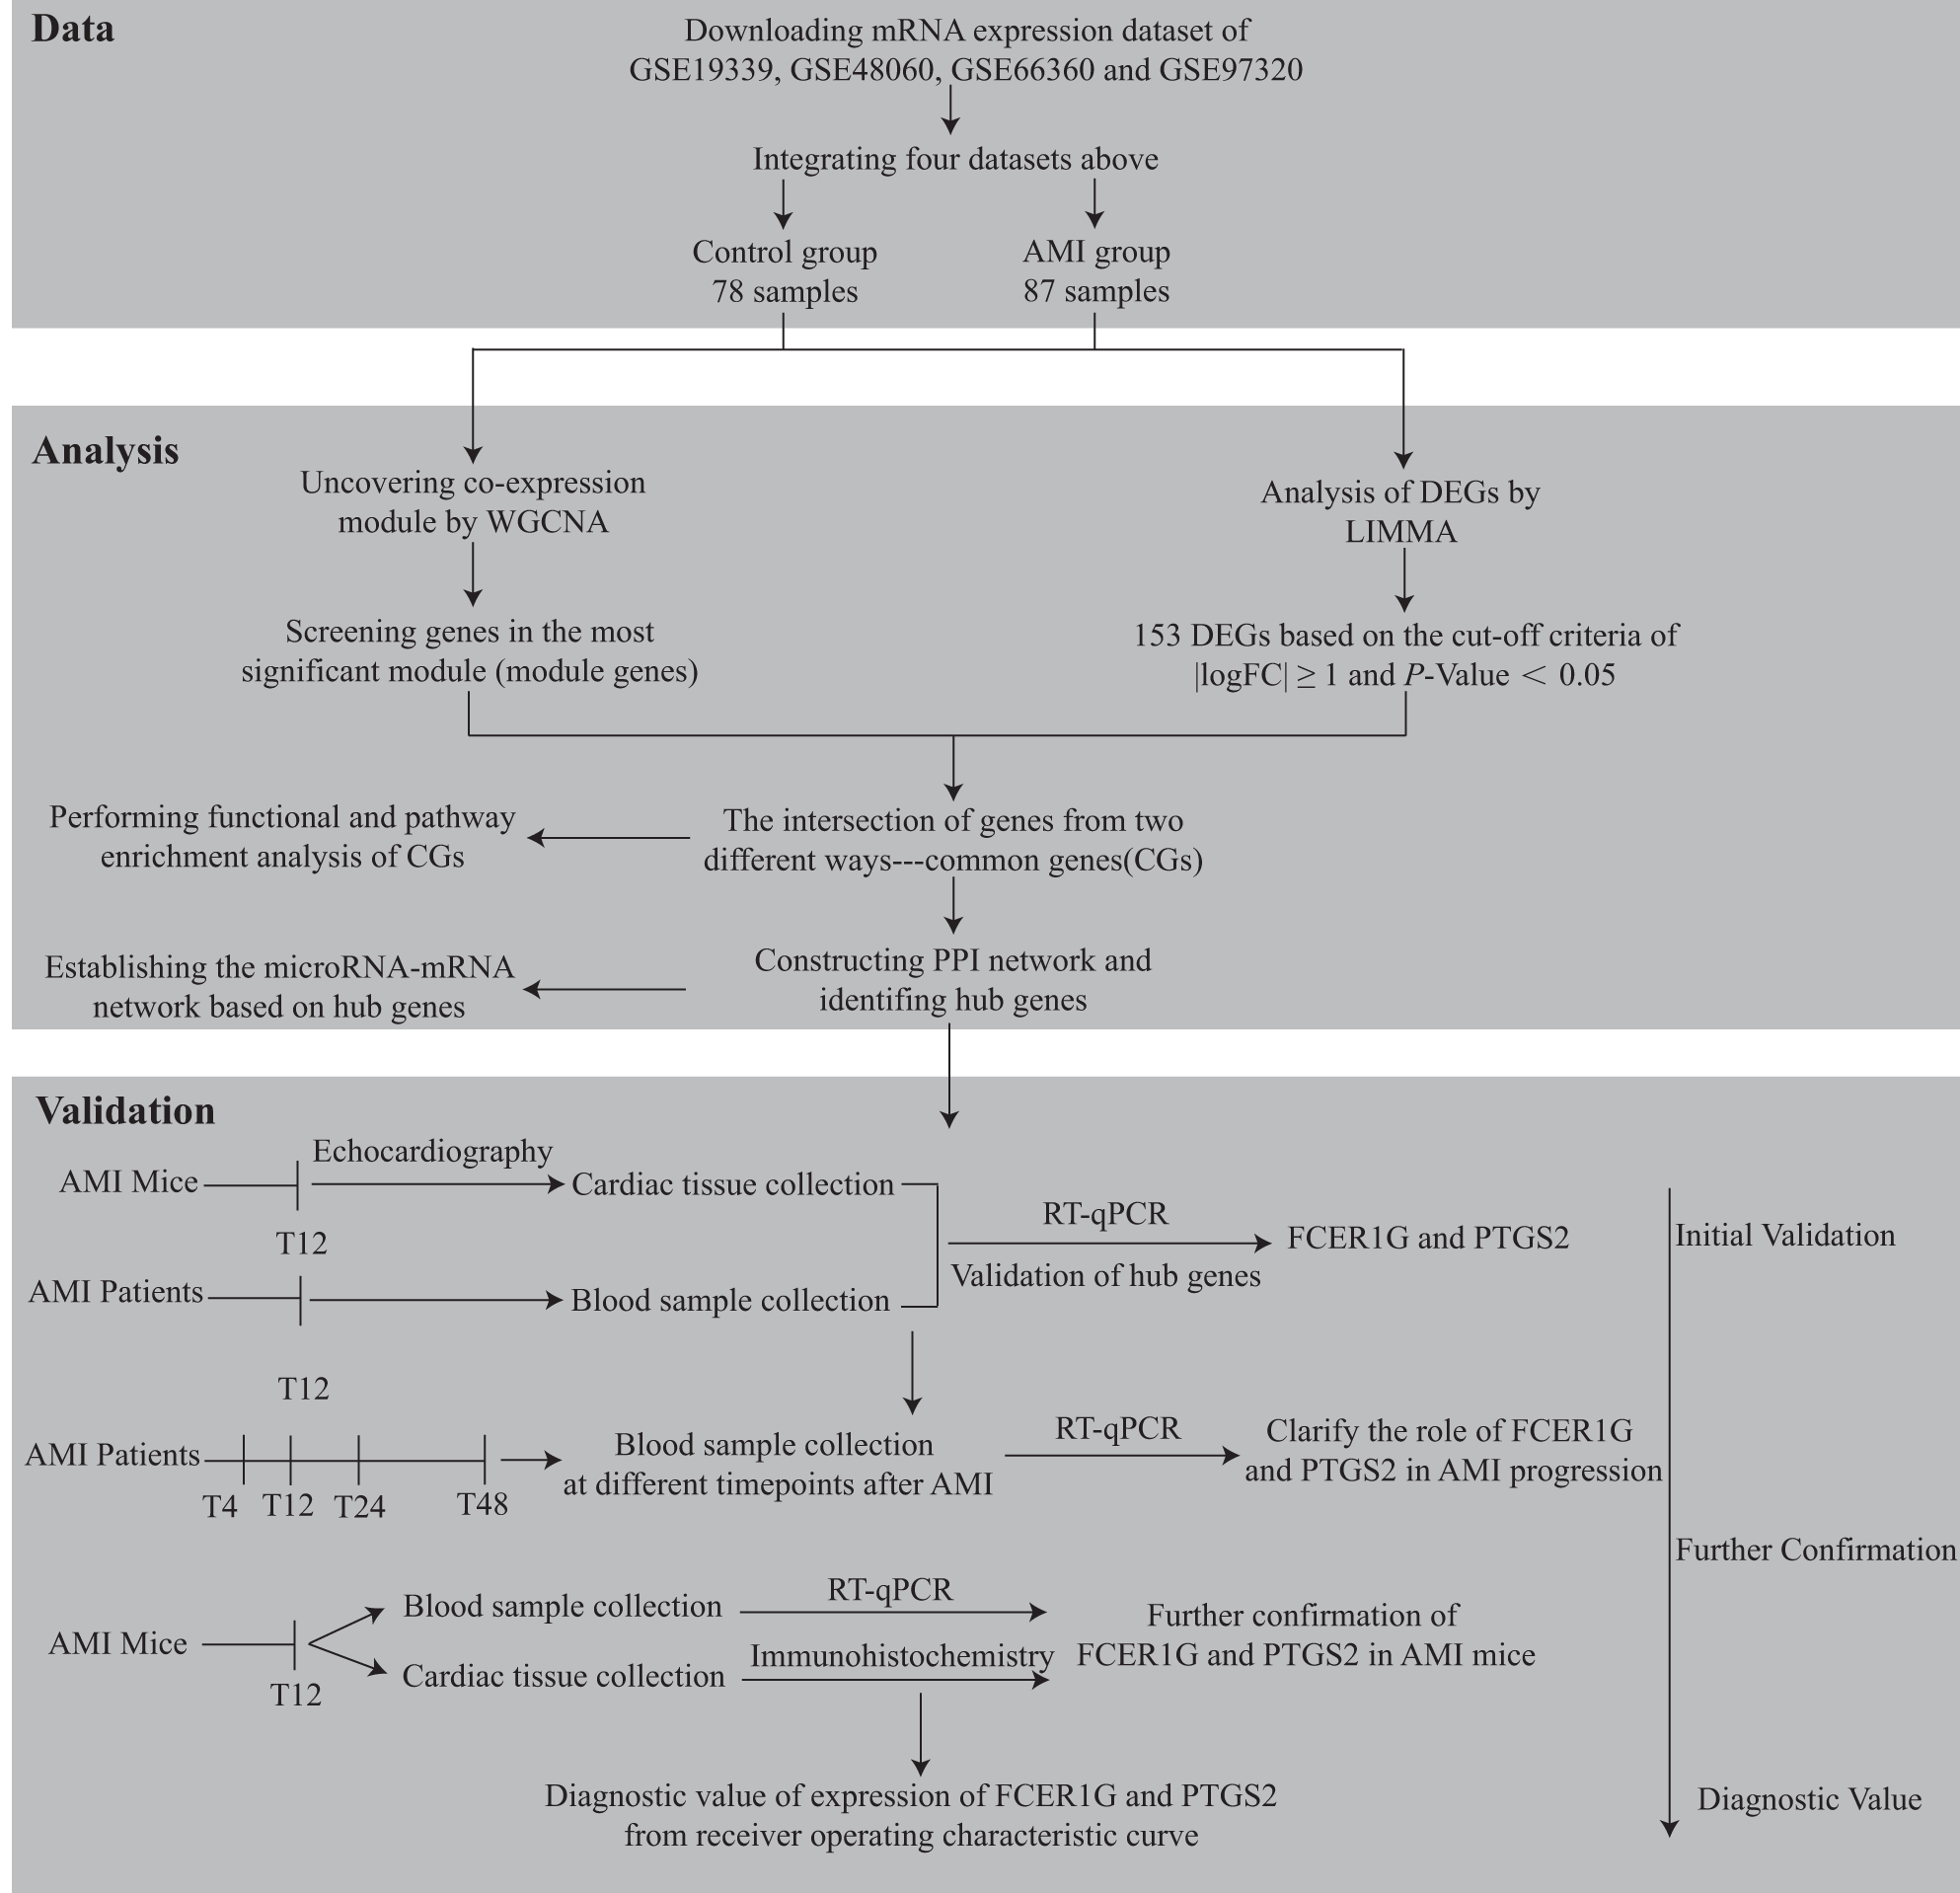
Study flowchart. AMI, acute myocardial infarction; CG, common gene; DEG, differentially expressed gene; LIMMA, linear models for microarray analysis; mRNA, messenger RNA; RT-qPCR, reverse transcription-quantitative real-time polymerase chain reaction; WGCNA, weighted gene co-expression network analysis.
Identification of DEGs
Gene expression profiles (GSE48060, GSE66360, GSE97320, and GSE19339) were processed using the robust multiarray average in the “affy” package in Bioconductor (
Construction of a WGCNA network
WGCNA can be used to detect modules (clusters) of genes with high correlations, or relating modules to traits from external samples (Langfelder and Horvath, 2008). First, genes were ranked by variance from large to small. Genes with the top 25% variance (5044) were selected for analyses. Second, before network construction, obvious outlier samples or samples with excessive numbers of missing entries were removed by using a sample network for outlier detection. Third, to detect modules of co-expressed genes, the adjacency matrix (derived from correlation analysis) was clustered using the “dynamic tree cut” algorithm. We calculated adjacencies using soft-threshold power and then transformed the adjacency into Topological Overlap Matrix and calculated the corresponding dissimilarities. Fourth, the minimum module size was set to 50 genes. The height for merging modules was set to 0.75, which required ≥25% dissimilarity among modules in expression. “Gene significance” (GS) was defined as the correlation between gene expression and each trait. In addition, “module membership” (MM) was defined as the association between gene expression and each module eigengene. MM and GS were calculated for modules correlated to AMI. Finally, an eigengene network was visualized. Modules most significantly correlated with AMI were considered to be the key modules of AMI and were used for further analyses. The intersection of DEGs screened from the integrated dataset and the genes in significant modules were termed “common genes” (CGs).
Enrichment analyses using Gene Ontology and Kyoto Encyclopedia of Genes and Genomes databases
Database for Annotation, Visualization, and Integrated Discovery (DAVID) 6.8 is a tool to classify gene functions. We used it for enrichment analyses to undertake Gene Ontology (GO) for CGs (Huang et al., 2007). The Kyoto Encyclopedia of Genes and Genomes (KEGG) Orthology-Based Annotation System (KOBAS) database is the first software to assess hypergeometric distribution to evaluate the significance of pathway enrichment (Xie et al., 2011). GO annotations were performed on CGs by using a DAVID online tool. Pathway analyses of CGs were undertaken using KOBAS. p < 0.05 and counts ≥2 were set as the threshold criteria.
Construction of a PPI network
The CGs obtained previously were mapped into Search Tool for the Retrieval of Interacting Genes/Proteins (STRING) v11.0 (Szklarczyk et al., 2017). A combined score of ≥0.4 of PPI pairs was considered significant. Then, CytoScape (
Regulatory miRNA-mRNA integrated network
Target miRNAs of the hub genes were predicted with miRTarBase, StarBase, and TargetScan. To improve the accuracy of prediction, only miRNAs predicted by two of these three databases were retained. After relationships between mRNAs and miRNAs were obtained, the miRNA-mRNA network was visualized using CytoScape.
Animal experimental design
Male C57BL/6 mice (8–10-week old; weight: 24–26 g) were acquired from Beijing Vital River Laboratory Animal Technology (Beijing, China). Mice were housed in plastic cages with a 12-h light/12-h dark cycle under specific pathogen-free laboratory conditions, and had free access to water and a basal diet.
We ligated the left descending artery (LAD) of mice with 7–0 silk to establish an AMI model as previously described. The cardiac tissue turned pale and the heart movement weakened, which confirmed successful establishment of the AMI model (Gao et al., 2010). For the sham operation group, we crossed the silk under the LAD without ligation.
To assess the expression level of hub genes at 12 h after AMI, 10 mice were randomly divided into two groups: sham operation (n = 4) and AMI (n = 6). Twelve hours after AMI surgery, eight mice (four from each group) survived and two were sacrificed owing to the exacerbation of cardiac function. Transthoracic echocardiography was undertaken to assess left ventricular function. Cardiac parameters including left ventricular ejection fraction (LVEF) and left ventricular fractional shortening (LVFS) were recorded. Mice were sacrificed after echocardiography, and cardiac tissue was collected for further analysis.
To further evaluate the expression level of target genes in mice at 12 h after AMI, eight mice were randomly divided into sham and AMI groups (n = 4 each). Blood sample of mice were collected from vena centralis retinae, and the hearts were harvested for immunohistochemistry.
Immunohistochemistry
Mouse hearts were collected, fixed in 10% neutral buffered formalin, and embedded in paraffin blocks. For immunohistochemical analysis, antigen retrieval was performed by immersing sections in 10 mM sodium citrate (pH 6.0) at 95°C for 30 min. Heart sections were incubated with the primary anti-FCER1G (1:500; Abcam, Cambridge, UK) and anti-PTGS2 (1:500; Abcam) antibodies at 4°C overnight. Then sections were washed and incubated with biotin-labeled goat anti-rabbit secondary antibody (1:250; Jackson Laboratories, Philadelphia, PA). Subsequently, sections were counterstained with hematoxylin. The numbers of infiltrating cells were counted in six fields per section in a blinded manner. An inverted microscope (Nikon, Eclipse 2000 TE) using NIS Elements imaging software was used for microscopy.
Clinical experimental design
For initial validation of the expression of hub genes in humans, we collected blood samples from four patients at 12 h after AMI and four HCs. To further assess the dynamic progression of the expression of target genes, which were upregulated both in AMI mice and patients, 46 AMI patients and 22 HCs were recruited.
We collected blood samples at the following four different time points: T4 (admitted to hospital immediately [onset time less than 4 h]), T12 (12 h after hospital admission), T24 (24 h after hospital admission), and T48 (48 h after hospital admission), and used RT-qPCR to detect the expression level of target genes. The basic clinical characteristics of participants are provided in Supplementary Table S2. The detailed inclusion and exclusion criteria of AMI patients and HCs are shown in Supplementary File S3. All participants completed the questionnaire to determine their suitability for clinical research. The questionnaire is presented in Supplementary File S4.
Reverse transcription-quantitative real-time polymerase chain reaction
To measure the relative mRNA expression in the cardiac tissue of mice and in the blood of mice and humans, TRIzol® reagent was used to extract total RNA according to the manufacturer's (TaKaRa Biotechnology, Shiga, Japan) protocols. Subsequently, reverse transcription was done using 500 ng of isolated total RNA to synthesize complementary DNA (cDNA) using the iScript™ cDNA Synthesis Kit (Bio-Rad Laboratories, Hercules, CA). Appropriate proportions of SYBR™ Green qPCR Master Mix kit (Bio-Rad Laboratories), cDNA, and deionized water were mixed, and the ABI-96 Real-Time PCR Detection System (Applied Biosystems, Foster City, CA) was used to quantify mRNA expression, which was normalized against that of the housekeeping gene 18S using the comparative quantification method (2−ΔΔCT). All primers used for amplification are listed in Supplementary Table S5.
Statistical analyses
Statistical analyses were performed using SPSS 22.0 (IBM Corporation, Armonk, NY); GraphPad Prism 7 (GraphPad, San Diego, CA); and R version 3.6.4 (R Foundation for Statistical Computing, Vienna, Austria). Continuous variables are presented as mean ± standard deviation, whereas categorical variables are presented as number and percentage. Statistical comparisons between the two groups were analyzed using an independent-sample t-test. One-way analysis of variance (ANOVA) and Bonferroni test were used for comparison between different groups. ROC curve was performed to evaluate the diagnostic value of FCER1G and PTGS2 in AMI. p < 0.05 was considered to indicate statistical significance.
Results
Identification of DEGs with LIMMA method
A total of 153 DEGs were screened from the integrated dataset (139 were upregulated and 14 were downregulated in the AMI group compared to the HCs). A volcano plot and hierarchical clustering heat map of DEGs are shown in Figure 2a and b, respectively. All DEGs are displayed in Supplementary Table S6.
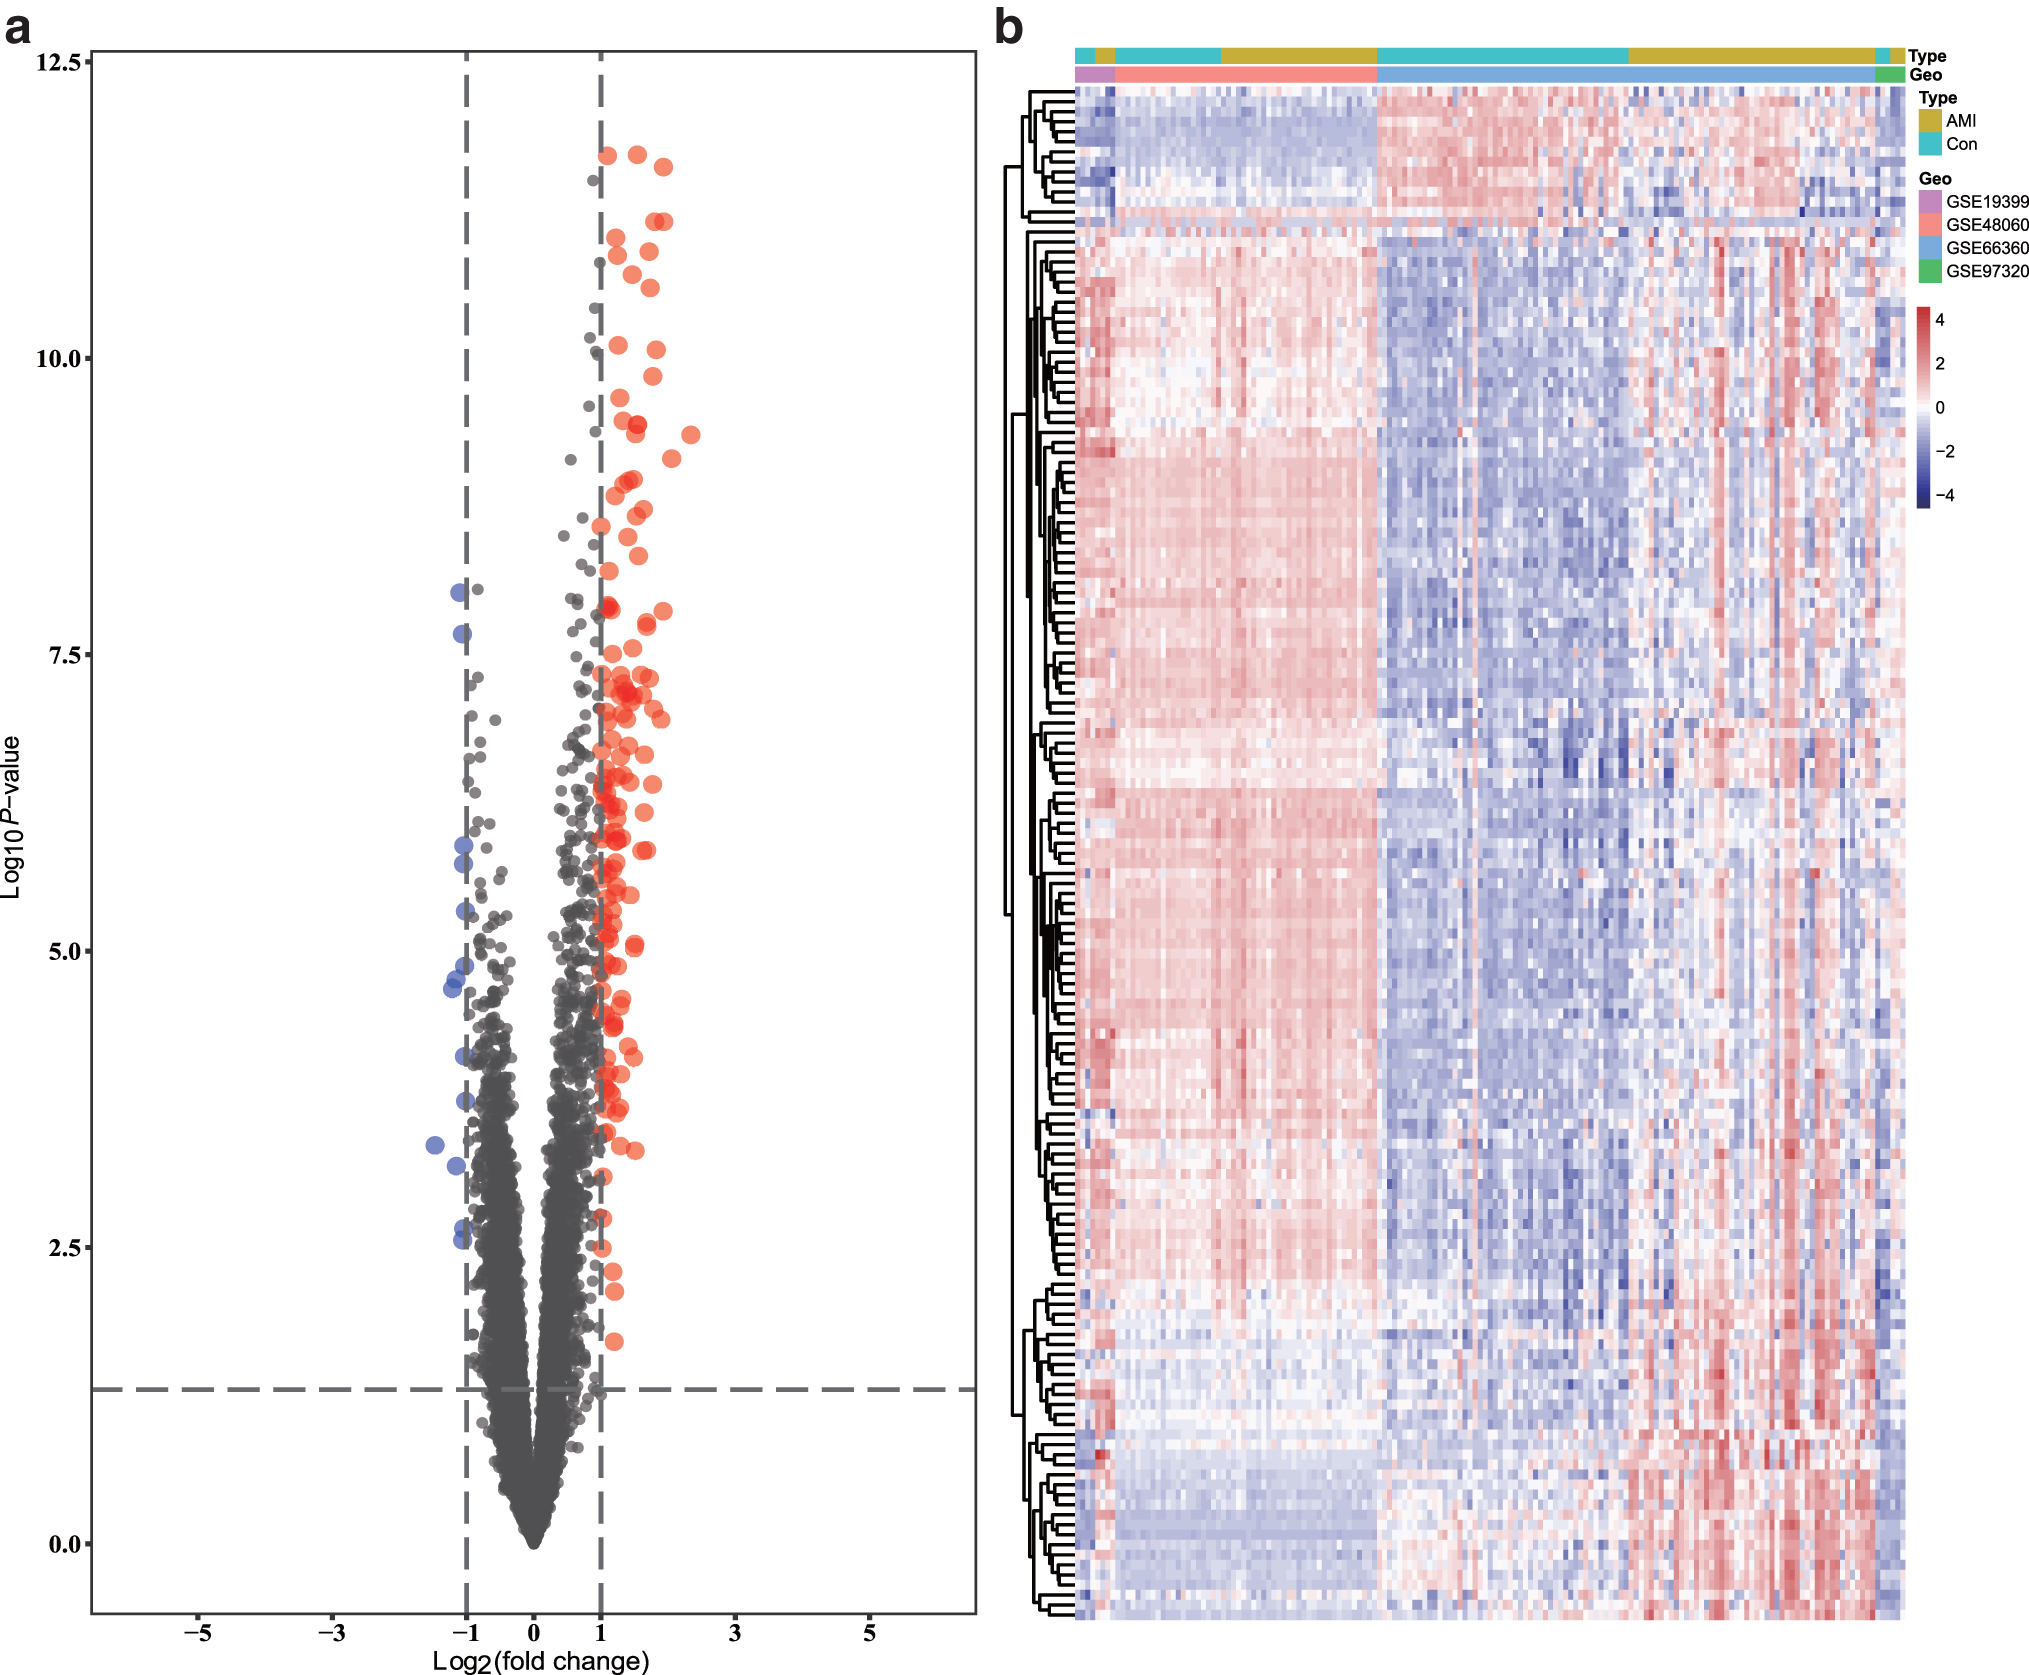
Volcano plot and heat map for the DEGs identified from the integrated dataset.
WGCNA and key module identification
We selected the power of β = 15 (scale-free R
2 = 0.9) as the “soft” threshold to ensure a scale-free network (Supplementary Fig. S1). Based on this power, we obtained five gene co-expression modules (GCMs) that are represented by different colors in Figure 3a. The correlation between GCMs and AMI is shown in Figure 3b (correlation coefficient = 0.63, p = 3.00 × 10⁻¹¹), in which the blue module (comprising 452 genes) demonstrated the most significant correlation with AMI (Supplementary Table S7). Furthermore, we explored the correlations between GS and MM for the blue module (Fig. 3c). The “Draw Venn Diagram” online tool (
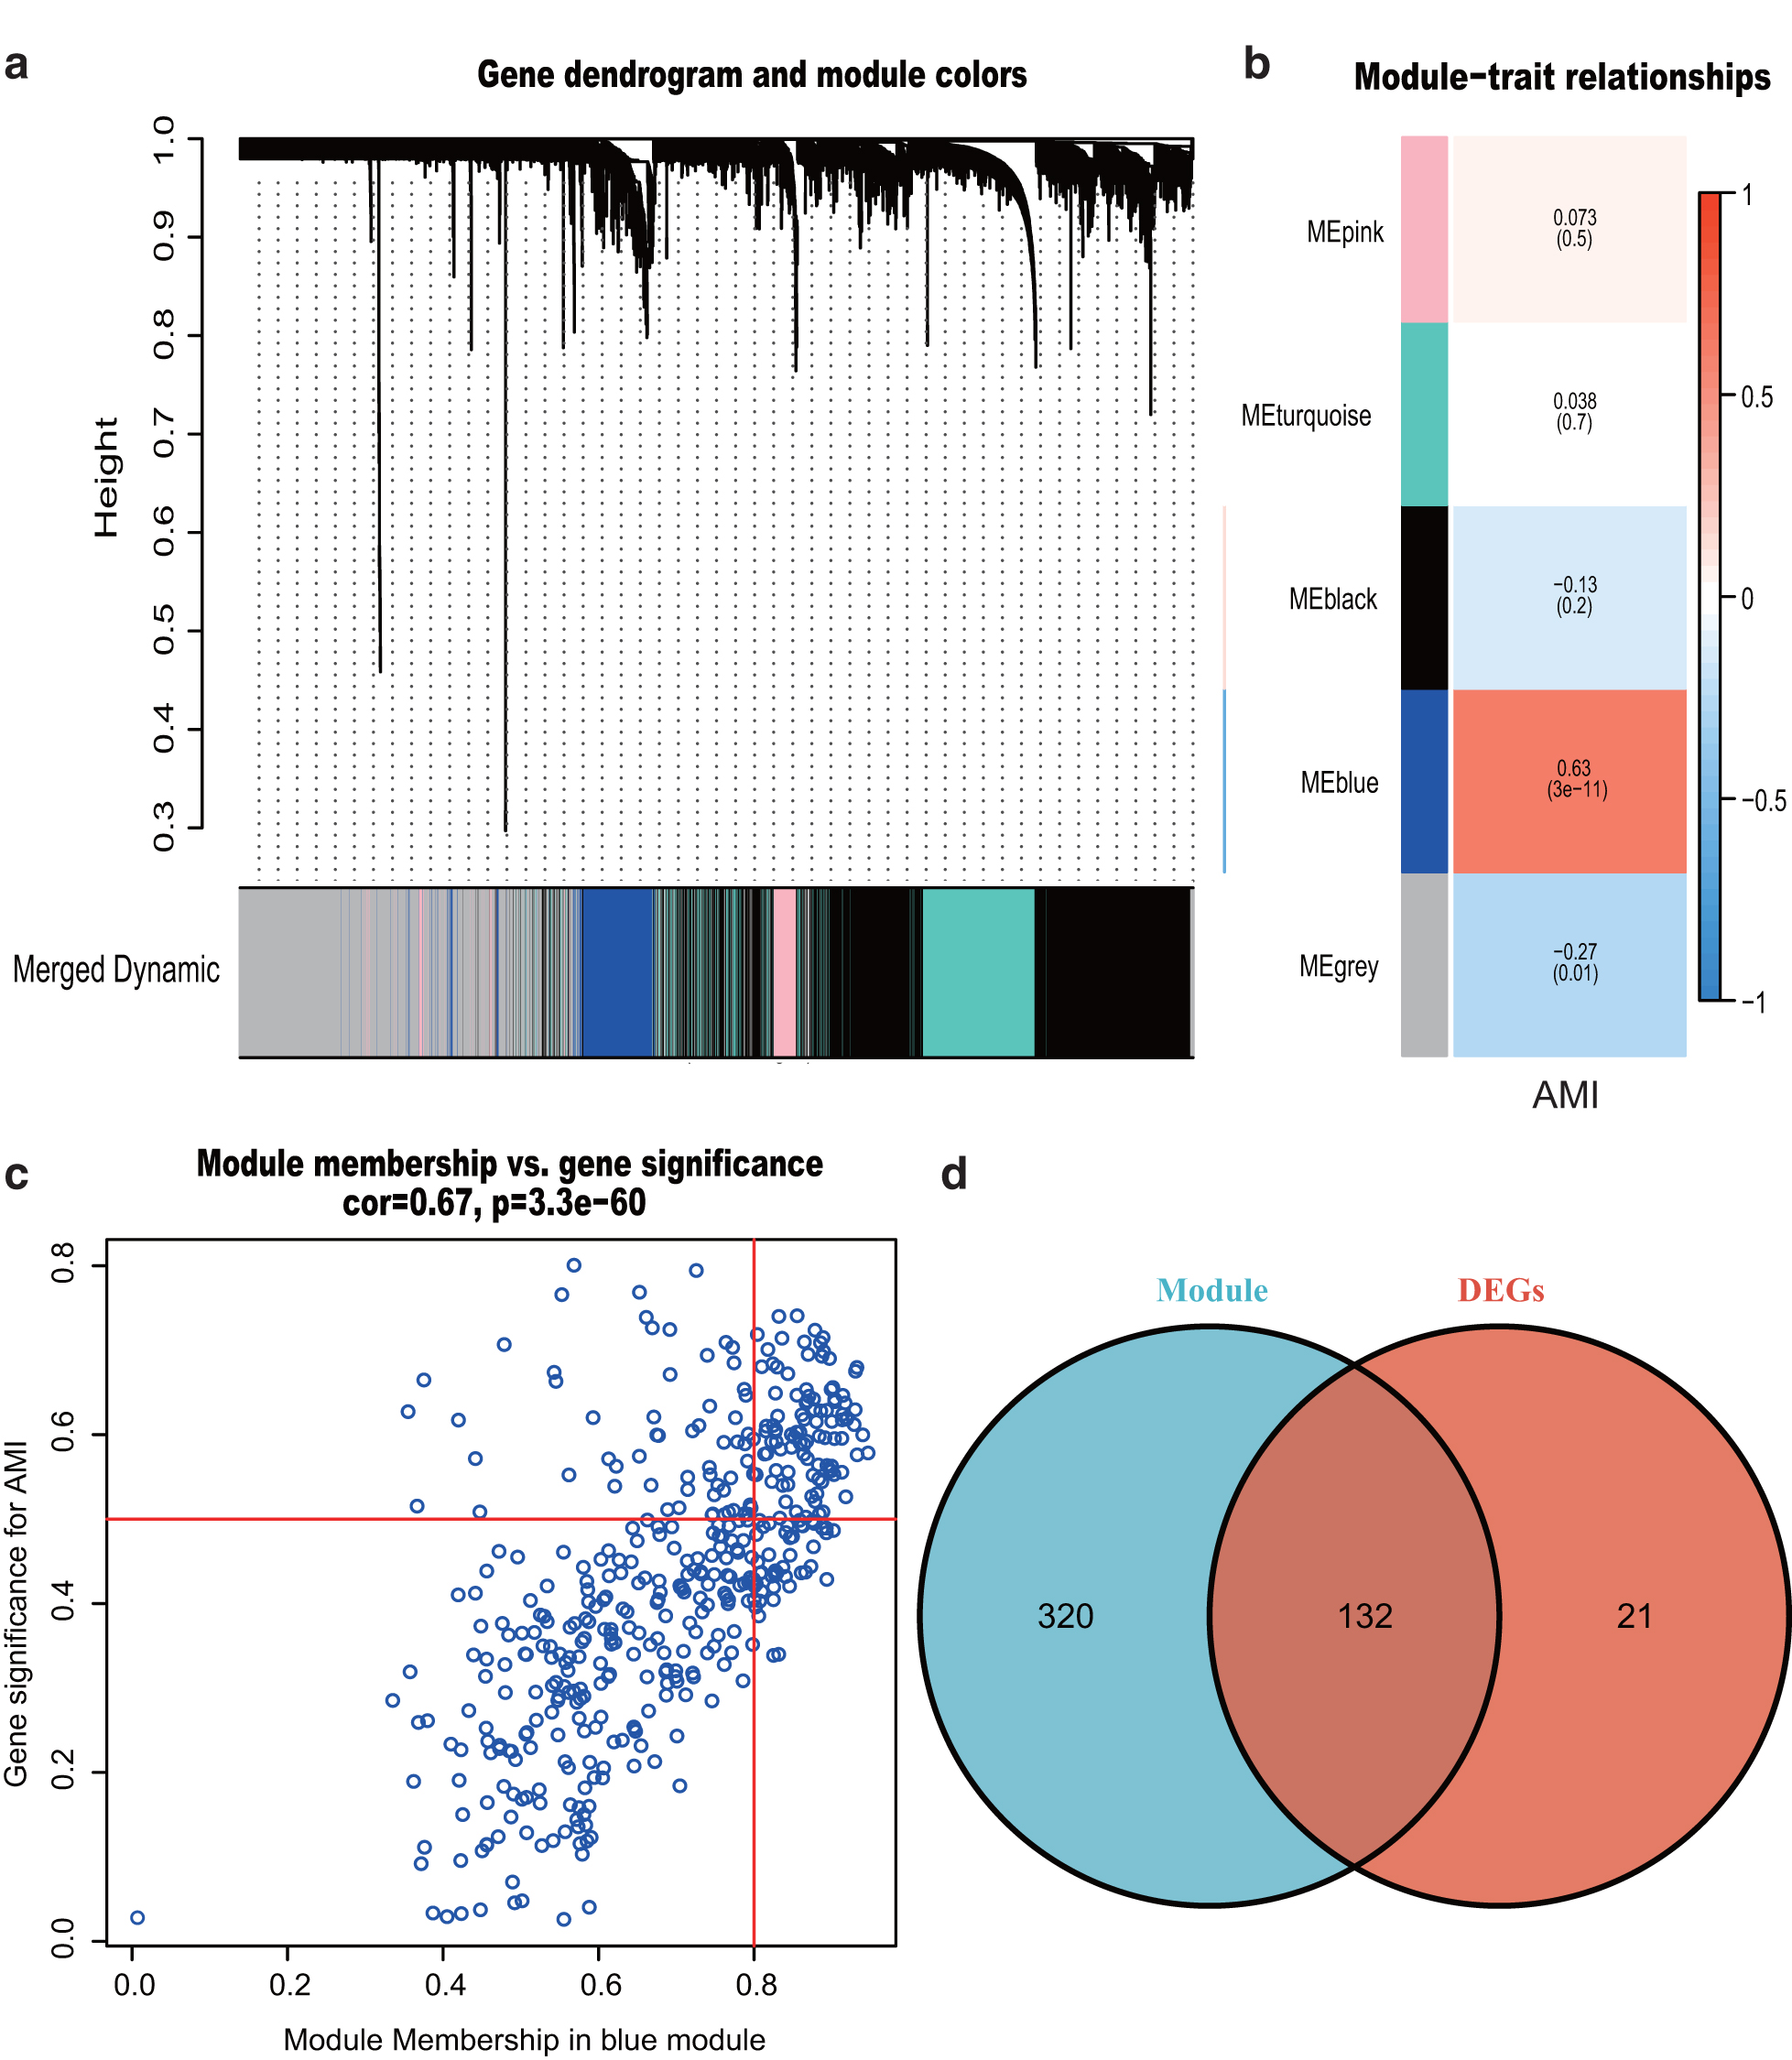
Weighted gene co-expression network analysis and Venn diagram.
Functional enrichment analysis of CGs
Analyses using the GO database showed that the CGs were enriched mainly in BPs, including an “inflammatory response,” “neutrophil chemotaxis,” and “innate immune response.” With regard to CC, the CGs were enriched in “plasma membrane.” With respect to MF, the CGs were significantly enriched in “receptor activity” (Supplementary Table S9). Analyses of pathway enrichment using the KEGG database showed that CGs were expressed mainly in the “IL-17 signaling pathway,” “C-type lectin receptor signaling pathway,” and “TNF signaling pathway” (Fig. 4 and Supplementary Table S10).

Functional and pathway enrichment analyses of CGs. BP, biological process; CC, cellular component; GO, Gene Ontology; KEGG, Kyoto Encyclopedia of Genes and Genomes; MF, molecular function. Color images are available online.
Analyses of PPI networks
A PPI network was constructed with 113 nodes and 865 edges (Supplementary Fig. S2). Among the 113 nodes, all nodes showed upregulated expression. The top 20 genes were identified by Degree, Closeness Centrality, and Betweenness Centrality, which were then used for analyses of Venn diagrams (Supplementary Fig. S3). The C-X-C motif chemokine ligand 1 (CXCL1), Fc fragment of IgE receptor Ig (FCER1G), formyl peptide receptor 1 (FPR1), formyl peptide receptor 2 (FPR2), interleukin 1 beta (IL1B), leukocyte immunoglobulin-like receptor B2 (LILRB2), matrix metallopeptidase 9 (MMP9), prostaglandin-endoperoxide synthase 2 (PTGS2), S100 calcium binding protein A12 (S100A12), S100A8, S100A9, toll-like receptor 2 (TLR2), TLR4, TLR8, and transmembrane immune signaling adaptor (TYROBP) overlapped among the three groups and were therefore deemed the hub genes.
Construction of a miRNA-mRNA integrated network
A regulatory miRNA-mRNA network was constructed, which comprised 48 nodes and 46 edges, including 5 target mRNAs and 43 miRNAs (Fig. 5). The predicted miRNAs such as miRNA-143-3p, miRNA-144-3p, miRNA-26a-5p, and miRNA-26b-5p interacted with PTGS2 and likely participate in AMI progression.
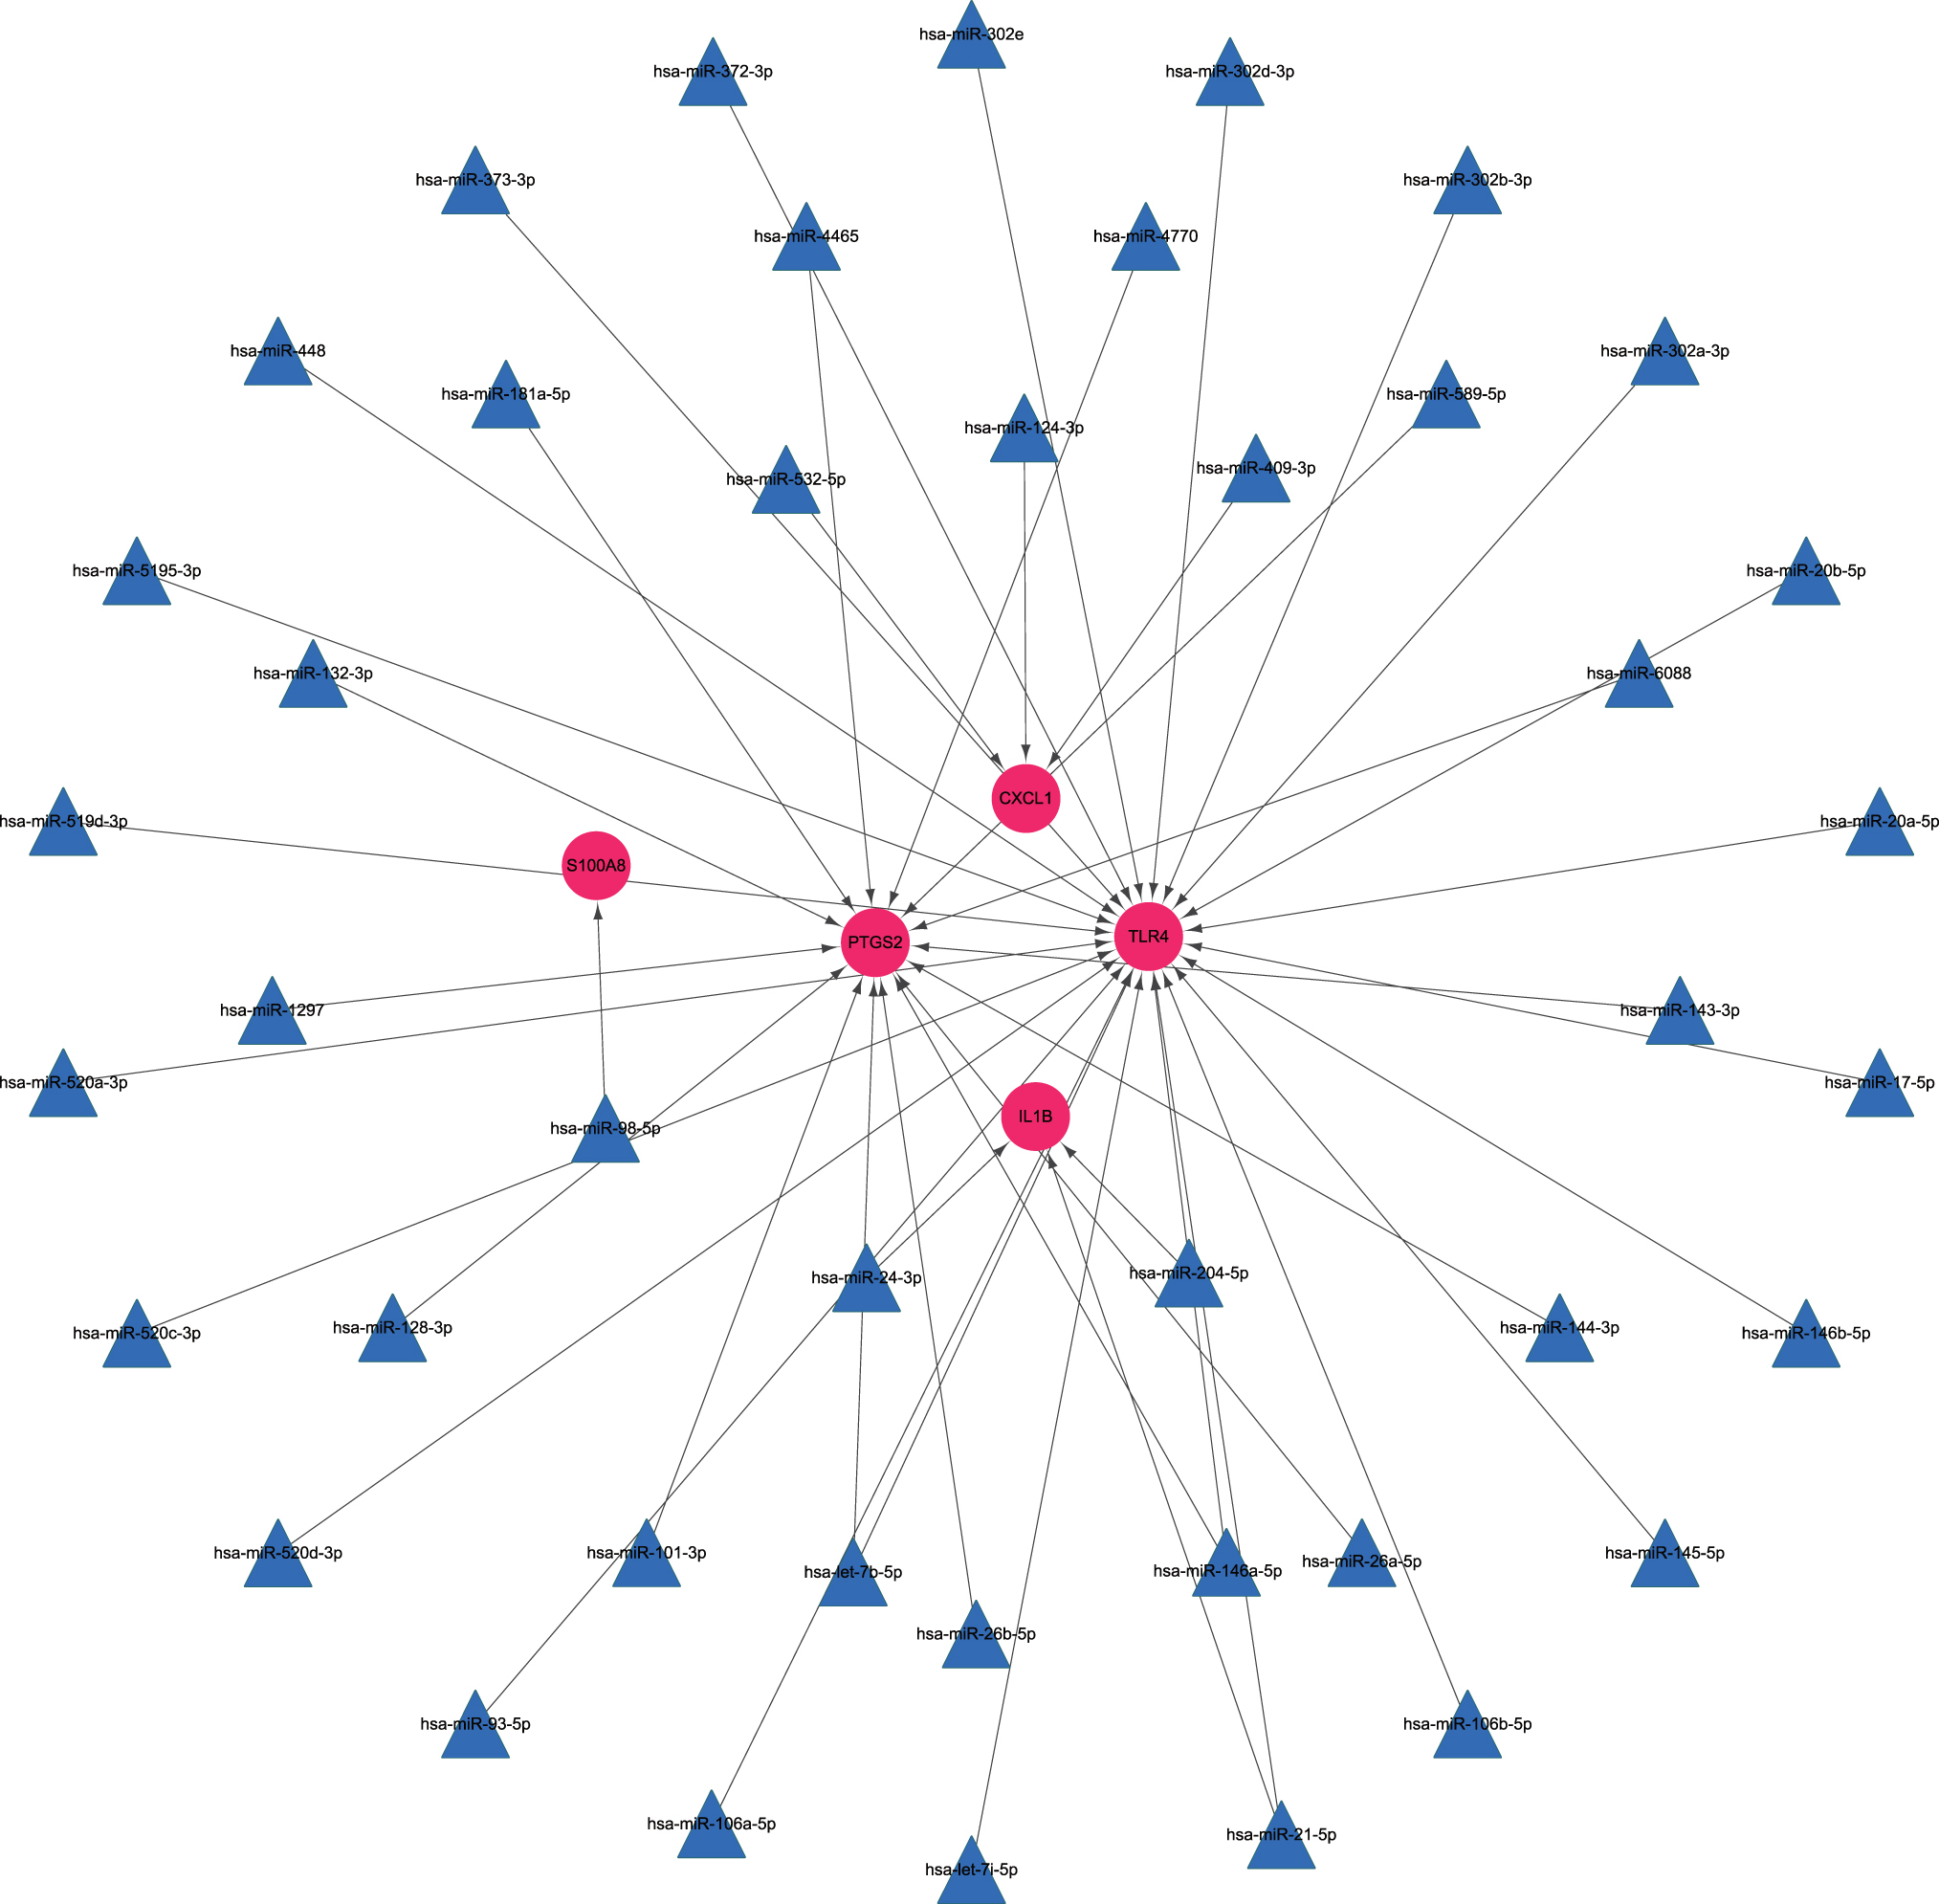
mRNA-miRNA integrated network. Pink balls represent mRNAs with upregulated expression and the blue triangles are predicted miRNAs. miRNA, microRNA. Color images are available online.
Initial validation of hub genes according to RT-qPCR
LVEF and LVFS were obviously lower in AMI mice than in sham-operated mice, based on echocardiography (Fig. 6a); this indicated successful establishment of the AMI mouse model. The validation of 15 hub genes from the PPI network in the cardiac tissue of mice and human blood showed that FCER1G and PTGS2 were significantly higher in the AMI group than in the control group (Fig. 6b, c).

Validation of hub genes.
Expression of FCER1G and PTGS2 at different time points in patients
Compared with the HCs, AMI patients showed significantly increased expression levels of FCER1G and PTGS2 at T4, T12, and T24 (p < 0.05). As can be seen from the time curve, FCER1G and PTGS2 started to increase at 4 h after the onset of AMI, reached the peak at 12 h, and tended to normalize at 48 h after the onset of AMI (Fig. 6d).
Confirmation of FCER1G and PTGS2 in mice
The expression of FCER1G and PTGS2 from blood samples of mice (validated by RT-qPCR) showed that both were highly expressed in AMI mice than sham-operated mice, consistent with the expression in cardiac tissue (Fig. 6e). Furthermore, the results of immunohistochemistry revealed that FCER1G and PTGS2 were highly expressed in the heart sections of AMI mice compared with the sham group (Fig. 6f).
Diagnostic value of expression of FCER1G and PTGS2
The ROC curve analysis showed that the area under curve (AUC) of FCER1G for the diagnosis of AMI immediately after admission (T4) was 0.776 (95% confidence interval [CI]: 0.653–0.876, p = 0.0022), and the sensitivity and specificity were 81.8% and 67.4%. The AUC of PTGS2 for the diagnosis of AMI immediately after admission (T4) was 0.807 (95% CI: 0.699–0.895, p = 0.0019), and the sensitivity and specificity were 85.4% and 67.8%, respectively (Fig. 6g).
Discussion
Inflammatory response plays a crucial part in determining the MI size and can affect pathological cardiac remodeling after AMI (Stengaard et al., 2016). In our study, with abundant bioinformatics analysis, we identified 10 hub genes related to inflammation in AMI pathogenesis (FCER1G, PTGS2, TLR2, TLR4, TLR8, TYROBP, CXCL1, IL1B, MMP9, and S100A8). Upon further validation in both AMI mice and humans, FCER1G and PTGS2 showed a significant increase both in AMI mice and humans compared with controls.
TLR2, TLR4, and TLR8 belong to the toll-like receptor family. The platelet TLR expression was reportedly associated with platelet activation in AMI (Hally et al., 2017). TYROBP was considered relating to hypertrophic cardiomyopathy with co-expression analysis (Chen et al., 2019). Fan and Wei (2020) found that CXCL1 and IL1B are potential biomarkers and therapeutic targets involved in atrial fibrillation. Shi and Yi (2018) proved that S100A8 promotes MMP-9 expression in the fibroblasts from cardiac rupture after MI.
Because there was no statistical significance concerning the expression level of the above eight inflammation-related genes at 12 h after AMI according to our experimental results, these genes were initially excluded as diagnostic biomarkers of AMI; however, the value of these eight genes in AMI and their relationships with inflammation still deserve exploration.
FCER1G is an important molecule that participates in regulation of inflammation. Bin and Leung (2016) summarized that hypomethylation of FCER1G was related to atopic dermatitis, a chronic inflammatory disease induced by the interaction between genetic, immune, and environmental factors. Yu et al. (2011) demonstrated that FCER1G was associated with chronic asthma. Our enrichment analyses revealed that FCER1G could recruit neutrophils in AMI pathogenesis. Neutrophils are key cells in the vascular inflammatory response of AMI and interact with macrophages (Frodermann and Nahrendorf, 2017). We believe that this is the first report to show that FCER1G could regulate neutrophil chemotaxis in AMI pathogenesis.
Apoptosis is a predominant phenotype of AMI (Burke and Virmani, 2007). Several studies have shown that inhibition of apoptosis could benefit the injured myocardium and alleviate post-MI injury. Inhibition of PTGS2 expression can reduce apoptosis in AMI according to experiments on cells, animals, and humans (Abbate et al., 2006). PTGS2 was found to be associated with the IL-17 signaling pathway according to our enrichment analyses. IL-17 reportedly affects the production of different proinflammatory mediators involved in the damage to or scarring of myocardial tissue (Mora-Ruíz et al., 2019). Hence, we speculated that PTGS2 has an important role in regulating cardiomyocyte apoptosis and inflammation in AMI.
With integrated use of miRTarBase, Starbase, and Targetscan, we speculated that four miRNAs could interact with PTGS2: miRNA-143-3p, miRNA-144-3p, miRNA-26a-5p, and miRNA-26b-5p. MiRNA-143 expression has been reported to be increased in peripheral blood monocytes from AMI patients compared to that in HCs (Parahuleva et al., 2017), and miRNA-144 can retain the stability of extracellular matrix remodeling after MI (He et al., 2018). Studies of the miRNA-26 family in vascular smooth muscle cells, cardiac fibroblasts, and cardiomyocytes have shown that miRNA-26 may be essential for repair mechanisms (Icli et al., 2014). Hence, we suggest that PTGS2 could interact with miRNA-143, miRNA-144, and miRNA-26 to aid AMI regulation.
Our study has two main limitations. First, focusing on target genes alone may lead to exclusion of other potential targets. Second, although we verified the potential biomarkers in blood samples of AMI patients at different time points (using RT-qPCR) and in blood and cardiac tissue of AMI mice (using RT-qPCR and immunohistochemistry), the detailed pathways through which the biomarkers may function need further investigation.
Conclusion
We speculated that FCER1G could regulate neutrophil chemotaxis, and PTGS2 might control apoptosis and inflammation in AMI pathogenesis. MiRNA-143, miRNA-144, and miRNA-26 could target PTGS2 in AMI progression. In addition, FCER1G and PTGS2 could be potential biomarkers for early diagnosis of AMI.
Availability of Data and Materials
The authors confirm that all data underlying the findings are fully available without restriction. All relevant data are in a public repository GEO series accession number GSE19339, GSE48060, GSE66360, and GSE97320. (
Footnotes
Disclosure Statement
No competing financial interests exist.
Funding Information
This work was supported by the grants from Applied Basic Research Project of Xuzhou to Defeng Pan [grant number: KC20097].
Supplementary Material
Supplementary Table S1
Supplementary Table S2
Supplementary Data S3
Supplementary Data S4
Supplementary Table S5
Supplementary Table S6
Supplementary Table S7
Supplementary Table S8
Supplementary Table S9
Supplementary Table S10
Supplementary Figure S1
Supplementary Figure S2
Supplementary Figure S3
References
Supplementary Material
Please find the following supplemental material available below.
For Open Access articles published under a Creative Commons License, all supplemental material carries the same license as the article it is associated with.
For non-Open Access articles published, all supplemental material carries a non-exclusive license, and permission requests for re-use of supplemental material or any part of supplemental material shall be sent directly to the copyright owner as specified in the copyright notice associated with the article.
