
Abstract
MYC amplification is detected in ∼15% of breast tumors and is associated with poor prognosis by mediating acquired resistance to anticancer therapies. This study aimed to determine the prevalence of MYC amplifications in Chinese women with breast cancer (BRCA) and investigate the correlation between MYC amplification and clinicopathological and molecular characteristics and its clinical implications. We analyzed MYC alterations in tissue specimens from 410 women diagnosed with BRCA in our hospital from June 1, 2017 to September 27, 2018. We compared our results with publicly available data from The Cancer Genome Atlas (TCGA) BRCA cohort (n = 1079). MYC amplification was identified in 12.4% (51/410) of our cohort, with mean copy number (CN) of 4.42 (range: 2.84–11.27). In TCGA cohort, MYC amplification was identified in 21.2% (229/1079) and was associated with age, estrogen receptor status, progesterone receptor status, human epidermal growth factor receptor 2 (HER2) status, and molecular subtype, whereas in our cohort, MYC amplification was associated with smaller tumor size (T1–2, p = 0.023) and higher Ki-67 levels (≥20%; p = 0.031). Analysis of molecular profiles revealed that MYC-amplified breast tumors had significantly more concurrent CN variations compared with MYC nonamplified BRCA in both Guangdong Provincial People's Hospital (GDPH) and TCGA cohorts (p < 0.001). Pathway mapping analysis demonstrated that MYC-amplified tumors had more mutations involved in 15 different but interrelated pathways critical in DNA repair, cell cycle, and cell proliferation. Patients in TCGA cohort with MYC-amplified hormone receptor (HR)-positive/HER2-positive BRCA (p = 0.038) and MYC nonamplified triple-negative BRCA (p = 0.027) had significantly shorter overall survival. In conclusion, this study contributes to a better understanding that MYC-amplified breast tumors had distinct clinicopathological and molecular features compared with MYC nonamplified breast tumors. Further research with a larger sample size is necessary to further elucidate the clinical and survival implications of MYC amplifications.
Introduction
According to the recent global cancer statistics from 185 countries, breast cancer (BRCA) is the most commonly diagnosed malignant tumor and the leading cause of cancer deaths among females (Bray et al., 2018). The BRCA incidence rate in most developing countries has been rising over the last decades. In particular, the BRCA incidence rate among Asian women has increased by ∼1.8% from 2006 to 2015. Notably, from 1989 to 2016, the mortality rate for BRCA patients has decreased by 40% (Siegel et al., 2019). The rapid decline in BRCA mortality over the past two decades is primarily the result of increased emphasis on early detection and more effective treatments.
Thus, revealing the mechanism underlying BRCA development and progression can facilitate early and precise treatments, ultimately leading to better prognoses. Various genetic alterations are implicated in the initiation and progression of BRCA (Jewer et al., 2020; Lee, 2020; Sjostrom et al., 2020).
Myc proto-oncogene (MYC) is an oncogene that is frequently dysregulated in various cancers, including BRCA (Deming et al., 2000; Green et al., 2016; Dang et al., 2019; Rihawi et al., 2019; Sonpavde et al., 2019; Madden et al., 2021). The MYC gene is localized on chromosome 8q24, which is one of the most unstable chromosomal regions. Previous studies have shown that MYC encodes a transcription factor that plays a critical role in cancer initiation and progression, including cell growth, proliferation, differentiation, metabolism, cell cycle, and drug resistance (L'Abbate et al., 2014; Stine et al., 2015; Poli et al., 2018; Lee et al., 2019a; Li et al., 2019). Moreover, MYC overexpression was also found to play a key role in the high proliferative luminal B class of BRCA (Craze et al., 2018).
In the recent years, numerous studies have shed light on the therapeutic implications of MYC alterations in BRCA and explored novel therapies targeting MYC (Miller et al., 2011; Green et al., 2016; Carey et al., 2018; Madden et al., 2021). Preclinical and clinical evidences have implicated MYC overexpression in endocrine therapy resistance of breast tumors (Miller et al., 2011; Green et al., 2016). MYC elicits BRCA subtype-specific functions and was also associated with shorter distant metastasis-free survival in luminal A lymph node (LN)-positive tumors treated with endocrine therapy (Green et al., 2016). Recently, in vitro studies have demonstrated that a combination of indirect MYC blockade and poly(ADP-ribose) polymerase (PARP) inhibitors, dinaciclib and niraparib, could result in synthetic lethality in triple-negative breast cancer (TNBC), independent of BRCA gene status (Carey et al., 2018). MYC is an attractive antitumor target for BRCA.
Currently, data on the frequency of MYC alterations, the associations between MYC amplification and clinicopathological parameters, and its impact on BRCA patient outcomes remain limited. In this study, we analyzed the prevalence of MYC alterations in a large cohort of Chinese women with BRCA from the Guangdong Provincial People's Hospital (GDPH). We then compared the clinical and molecular characteristics of women harboring MYC amplifications in our cohort and the BRCA cohort from the publicly-available data of The Cancer Genome Atlas (TCGA). Furthermore, we also investigated the clinical implications of MYC amplification in BRCA patients. Our main purpose was to create a more solid foundation for translational and clinical trial design and for future implementation of MYC as a biomarker and therapeutic target.
Materials and Methods
Patient samples
Both the clinical and MYC mutation data of the breast invasive carcinoma cohort from TCGA (GDAC Firehose Legacy dataset) were retrieved from the cBio Cancer Genomics Portal (cbioportal; The cBio Cancer Genomics Portal: An Open Platform for Exploring Multidimensional Cancer Genomics Data - October 14, 2012). TCGA cohort information was last updated on May 31, 2016. Of the 1105 women included in TCGA cohort, a total of 1079 had both survival and MYC mutation data available for analysis. As defined by cBioPortal, we selected copy number (CN) level of 2 for high-level amplification (with 0 as diploid and 1 as low-level gain).
The GDPH cohort initially screened the data from 412 women diagnosed with BRCA from June 1, 2017 to September 27, 2018. As described previously (Chen et al., 2020; Xiao et al., 2021a; 2021b), the formalin-fixed paraffin-embedded (FFPE) tumor tissues were obtained from the patients and used to perform next-generation sequencing. Clinical and pathological characteristics were collected at the same time. Our study was approved by the Institutional Review Board and Ethic Committee of GDPH.
Sequencing analyses
The tumor samples were submitted to Burning Rock Biotech, a commercial clinical laboratory accredited by the College of American Pathologist and certified by the Clinical Laboratory Improvement Amendments. Briefly, DNA was extracted from FFPE tumor samples using QIAamp DNA FFPE Tissue Kit according to manufacturer's instructions (Qiagen, Hilden, Germany). Covaris M220 was used to perform DNA fragmentation, followed by end repair, phosphorylation, and adaptor ligation. Fragments of 200–400 bp were selected using magnetic beads (Agencourt AMPure XP Kit, Beckman Coulter, CA) followed by hybridization with capture probes, hybrid selection with magnetic beads, and PCR amplification. The NextSeq500 sequencer (Illumina, Inc., CA) with pair-end reads was used to sequence the indexed samples.
A panel covering 520 cancer-related genes, spanning 1.64 megabases of the human genome (Burning Rock Biotech, Guangzhou, China), was used to perform genomic profiling. The panel consists of the whole exons of 312 genes and critical exons, introns, and promoter regions of the remaining 208 genes.
DNA sequencing data were analyzed using optimized bioinformatics pipelines developed by Burning Rock Biotech. Briefly, BWA aligner (version 0.7.10) was used to map the sequences to the human genome (hg19). GATK version 3.2 and VarScan were used to perform local alignment optimization, variant calling, and annotation. Variants were filtered using the VarScan fpfilter pipeline. Loci with a depth of less than 100 were filtered out. At least 5 supporting reads were needed for insertions and deletions, while 8 supporting reads were needed to call single nucleotide variants. Variants with population frequency of >0.1% from the public databases, including the 1000 genomes, dbSNPs, ExAC, and ESP6500SI-V2 databases, were grouped as single nucleotide polymorphisms and were excluded from further analyses.
ANNOVAR and SnpEff version 3.6 were used to annotate the remaining variants. Factera version 1.4.3 was used to perform DNA translocation analyses. Copy number variations (CNVs) were analyzed based on the depth of coverage data of capture intervals. Sequencing bias arising from guanine–cytosine content and probe design was corrected against the coverage data. The coverage of different samples was normalized to comparable scales by utilizing the average coverage of all captured regions. CNV was called for when the coverage data of the gene region was quantitatively different from its reference control with statistical significance. The normal CN was set at 2, and CN of 2.75 was considered CN amplification.
Statistical analyses
Statistical analyses were performed using the SPSS Statistics software package version 22.0 (SPSS, Inc.) and R statistical software (version 4.1; The R Foundation for Statistical Computing). The Pearson's chi-squared, likelihood-ratio test and Fisher's exact test were used to evaluate the association between MYC amplification status and clinicopathological parameters and mutational status. Difference in CNV between MYC-amplified and nonamplified groups was computed using Wilcoxon signed rank test. Pathway mapping analysis was performed using Kyoto Encyclopedia of Genes and Genomes (KEGG), with the difference between MYC-amplified and nonamplified groups computed using Fisher's exact test. Survival curves were analyzed using the Kaplan–Meier method with log-rank statistics using the GraphPad Prism software.
A p-value of <0.05 was considered statistically significant.
Results
Frequency of MYC mutations
We first analyzed the distribution of MYC gene alterations in the GDPH and TCGA BRCA cohorts. MYC amplification was identified in 12.4% (51/412) of our cohort, with a mean CN of 4.42 (2.84–11.27). We also identified a patient each with MYC c.1096G>A (p.E366K) missense mutation with an allele frequency (AF) of 18.21%, replication termination factor 2 (RTFDC1)-MYC fusion (R5:M3; AF = 1.62%) (Fig. 1A), and plasmacytoma variant translocation 1 (PVT1)-MYC fusion (P1:M2; AF = 3.33%) (Fig. 1B).
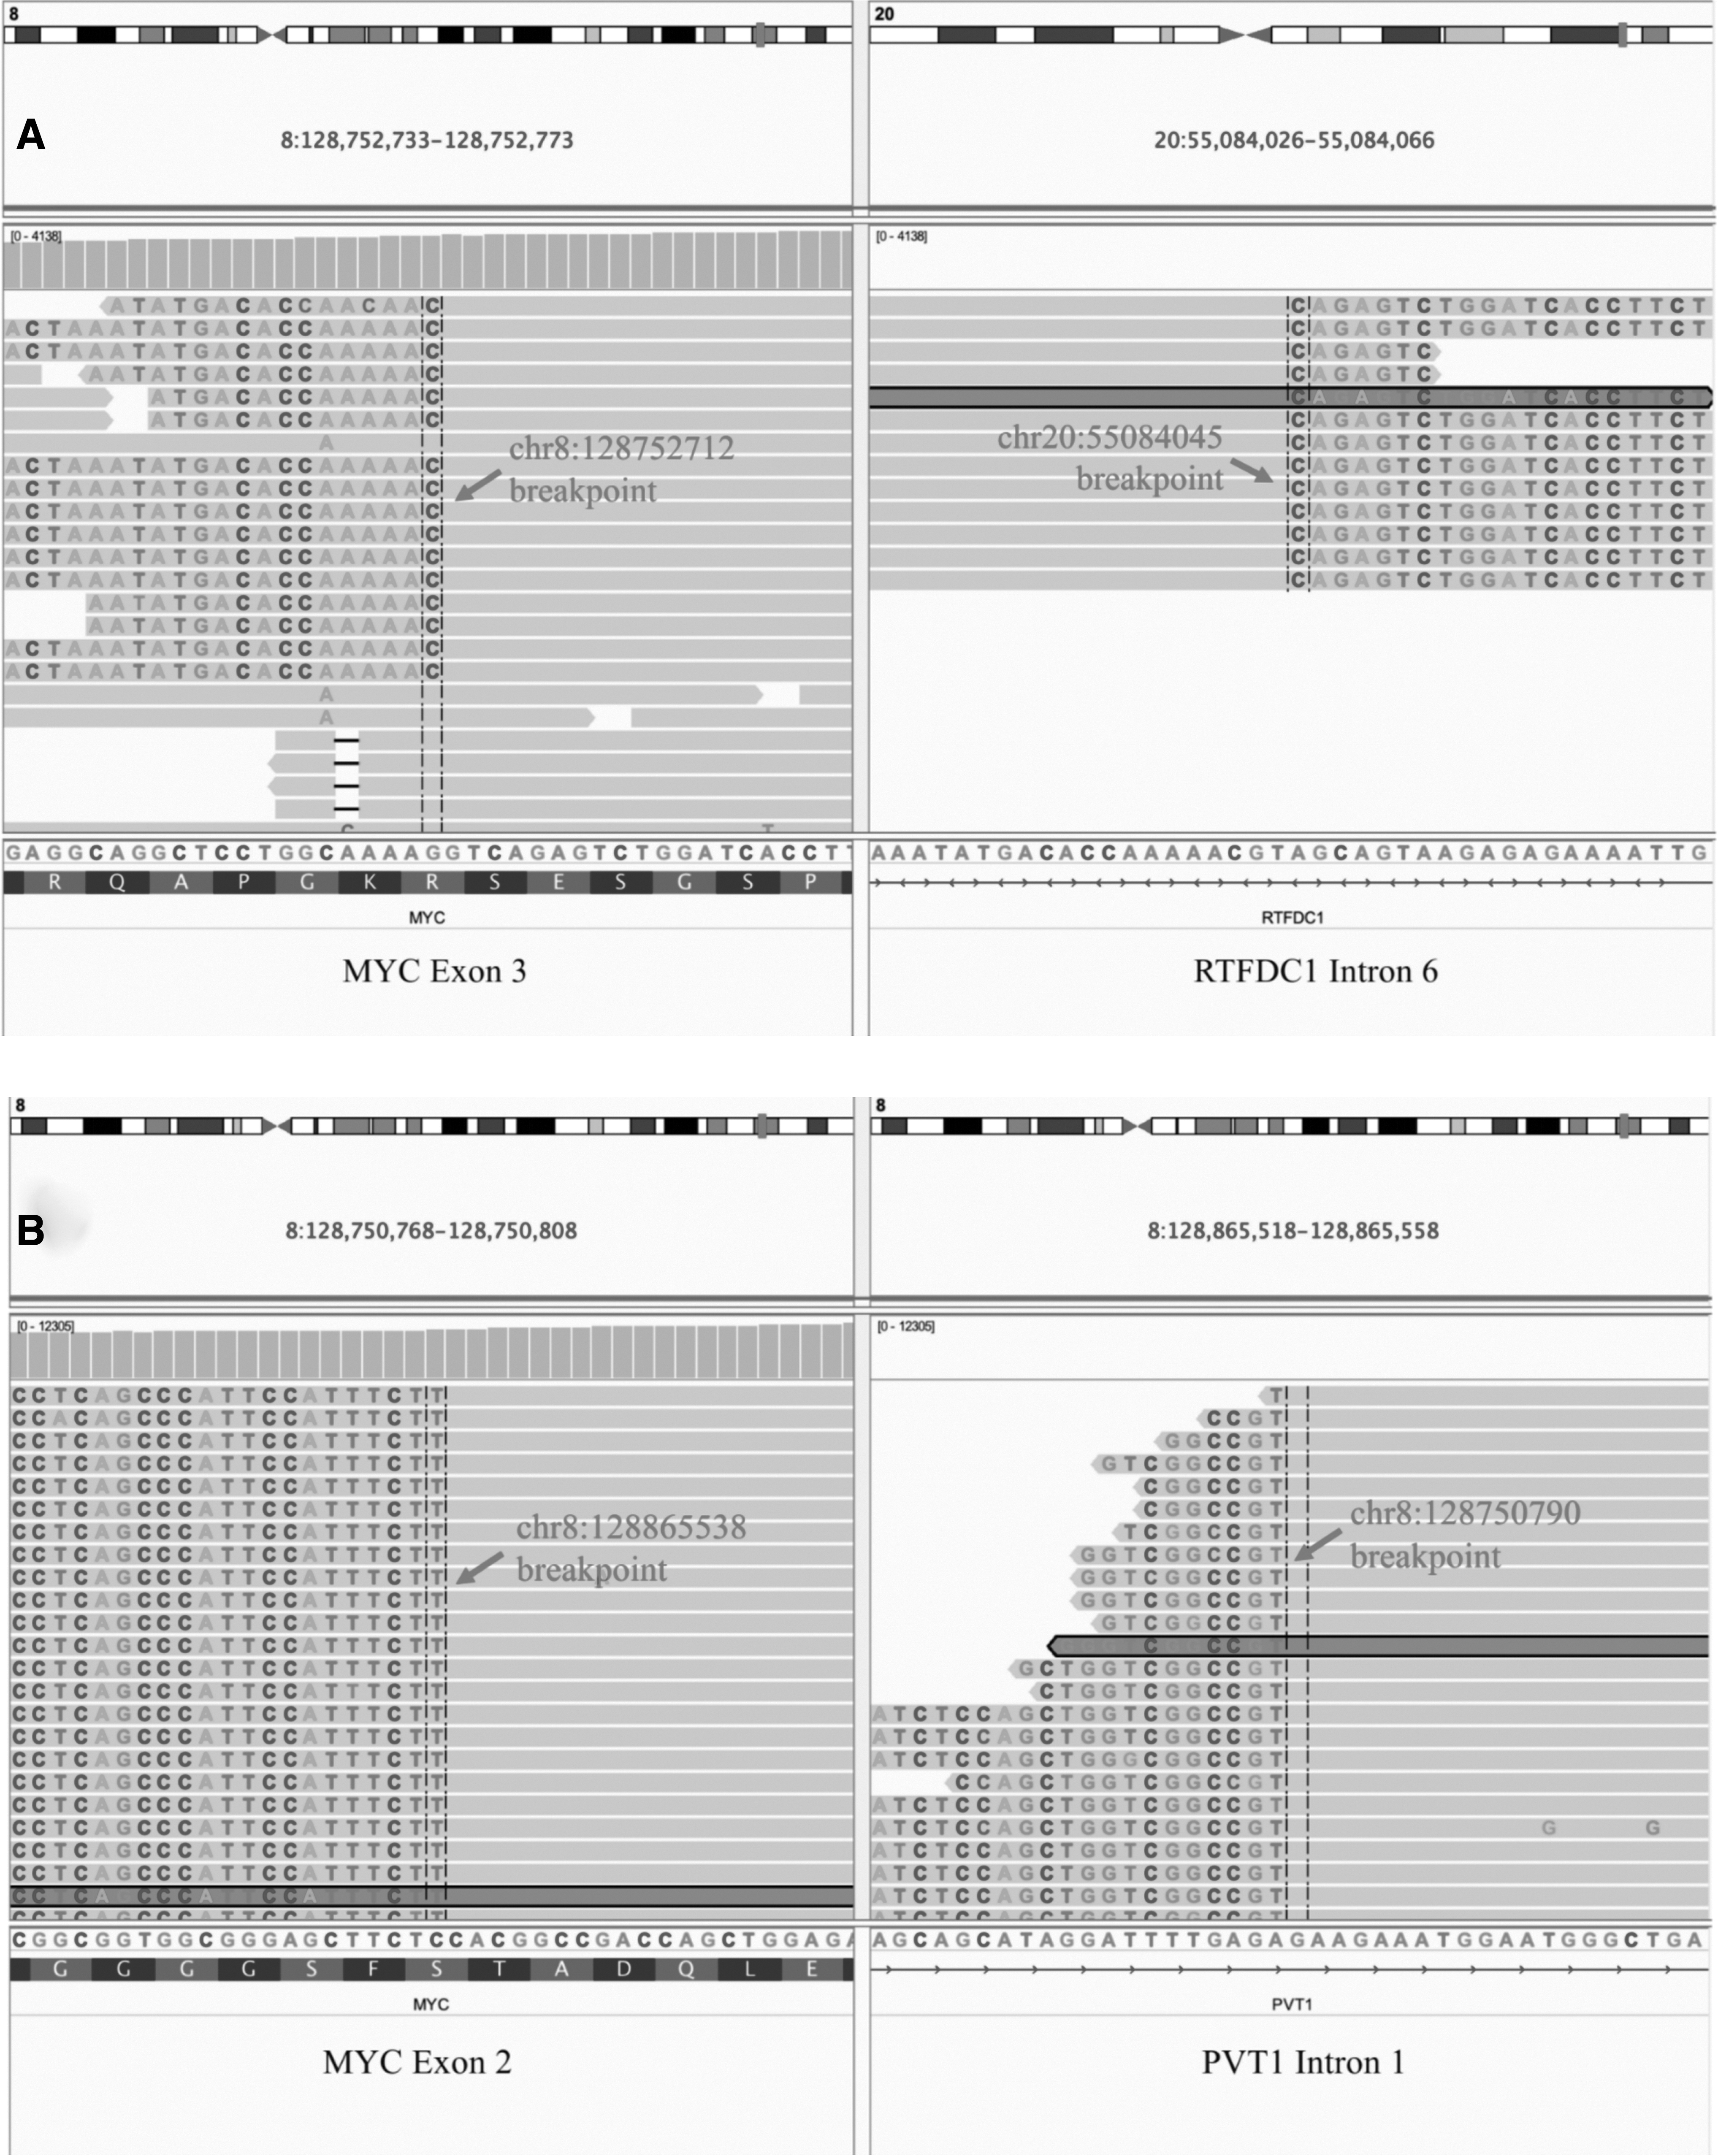
Rare MYC gene rearrangements detected from our cohort. Integrated genome viewer images depicting the chromosomal breakpoints for the fusion between the intron 6 of replication termination factor 2 (RTFDC1) and exon 3 of MYC (R5:M3; AF = 1.62%)
PVT1-MYC fusion was classified as likely pathogenic due to being absent from population databases and having been reported in cancer patients (Northcott et al., 2012; Tseng et al., 2014; Onagoruwa et al., 2020). The case harboring the PVT1-MYC fusion was also found to have concurrent MYC amplification. MYC E366K was rare (population frequency of 4.07E-06), while RTFDC1-MYC fusion was absent from population databases. Both MYC E366K and RTFDC1-MYC were classified as variants of uncertain significance. It should be noted that the 2 women each detected with MYC E366K and RTFDC1-MYC were excluded from the 410 women in the GDPH cohort for further analysis. In contrast, MYC amplification (high-level amplification, CN level = 2) in TCGA cohort was 21.2% (229/1079); however, the definite CN information was unavailable.
Patient characteristics
The GDPH cohort (n = 410) comprised of a majority of women >40 years of age (76.8%), with ductal carcinoma (87.8%), stage I-II (71.5%), hormone receptor (HR)-positive (75.4%), and human epidermal growth factor receptor 2 (HER2)-negative status (71.7%). The clinicopathological characteristics of our cohort were statistically different from TCGA cohort. Both cohorts had similar proportion of stage I-II and stage III-IV. Our cohort had significantly higher proportion of younger patients (≤40 years; 23.2% vs. 8.9%; p < 0.001), having ductal carcinoma (87.8% vs. 74.0%; p < 0.001), and HER2-negative tumors (71.7% vs. 51.5%; p < 0.001).
Our cohort also had significantly different molecular subtype distribution than TCGA cohort (p < 0.001), possibly due to higher number of missing data in TCGA cohort. Table 1 summarizes these comparisons in baseline clinicopathological characteristics of both cohorts.
Baseline Clinicopathological Characteristics of the Breast Cancer Cohorts from the Guangdong Provincial People's Hospital and The Cancer Genome Atlas
GDPH, Guangdong Provincial People's Hospital; HER2, human epidermal growth factor receptor 2; HR, hormone receptor; LN, lymph node.
Association between MYC amplification status and clinicopathological characteristics
We compared the clinicopathological characteristics of women with or without MYC amplification between the BRCA cohorts from TCGA and GDPH (Table 2). In our cohort, patients with MYC amplified tumors had statistically different tumor size (p = 0.023), molecular subtype (p = 0.028), and Ki-67 expression (p = 0.031) compared with patients without MYC amplification. In TCGA cohort, patients with MYC amplification had statistically different age (p = 0.047), tumor type (p < 0.001), estrogen receptor (ER) status (p < 0.001), progesterone receptor (PR) status (p < 0.001), HER2 status (p = 0.008), and molecular subtype (p < 0.001) compared with patients without MYC amplification.
Comparison of Baseline Clinicopathological Characteristics of the Breast Cancer Cohorts With or Without MYC Amplification from the Guangdong Provincial People's Hospital and The Cancer Genome Atlas
NA denotes data not available.
In both GDPH and TCGA cohorts, MYC amplification was more commonly detected in older women (>40 years; GDPH, 74.5%; TCGA, 87.8%), with invasive ductal carcinoma type (GDPH, 92.2%; TCGA, 88.2%), stage I-II (GDPH, 66.7%; TCGA, 69.4%), LN positive status (GDPH, 60.1%; TCGA, 55.0%), ER-positive status (GDPH, 76.5%; TCGA, 56.8%), HR-positive status (GDPH, 86.3%; TCGA, 58.5%), HER2-negative status (GDPH, 66.7%; TCGA, 46.3%), and HR+/HER2- subtype (GDPH, 54.9%; TCGA, 24.9%). MYC amplification was more frequently detected in patients with PR-positive tumors in our cohort (72.5%), while patients with PR-negative tumors had more frequent MYC amplification in TCGA cohort (53.7%).
MYC amplification was identified more frequently in HR-positive patients than HR-negative patients in the GDPH cohort (86.3% vs. 13.7%), with a similar trend in TCGA cohort (58.5% vs. 40.2%). The percentage of MYC-amplified breast tumors with HER2-negative status was higher than those with HER2-positive status in the GDPH cohort (66.7% vs. 33.4%). MYC amplification was more likely to be detected in tumors with high proliferative index (≥20% Ki67 expression) than those with low (<20%) proliferative index (70.6% vs. 29.4%; p = 0.005). According to molecular subtype, MYC amplification was frequently detected in HR+/HER2− (58.9%) and HR+/HER2+ (31.4%) subtypes in the GDPH cohort, while TCGA cohort had more HR+/HER2− (24.9%) and triple negative (21.4%) subtypes. However, this frequency was inconclusive for TCGA cohort due to >32% of missing HER2 status data.
These observations remained consistent when patients with MYC-amplified tumors from both cohorts were combined, particularly in HR-positive status, HER2-negative status, and HR+/HER2- molecular subtype (Table 3).
Clinicopathological Characteristics of the Women With or Without MYC Amplification After Pooling the Data from the Guangdong Provincial People's Hospital and The Cancer Genome Atlas
Molecular characteristics of MYC-amplified tumors in GDPH cohort
We further analyzed the molecular features of MYC-amplified breast tumors. Figure 2A summarized the somatic mutation landscape of the GDPH cohort. Of the 51 MYC-amplified breast tumors from the GDPH cohort, TP53 was the most frequently mutated gene in the cohort, detected in 70.6% (36/51), and was significantly higher than MYC nonamplified breast tumors (70.6% vs. 48.2% [173/359], p = 0.003; Fig. 2B). Mutations in phosphatidylinositol-4,5-bisphosphate 3-kinase catalytic subunit alpha (PIK3CA) were detected in 45.1% (23/51) of the women with MYC-amplified breast tumors and were similar between women with MYC-amplified and nonamplified tumors (45.1% vs. 45.7%, p = 1; Fig. 2B).

MYC-amplified breast tumors from GDPH cohort had significantly more concurrent CN amps.
Mutations in the mitogen-activated protein kinase kinase kinase 1 (MAP3K1) were also significantly more in MYC-amplified than MYC nonamplified tumors (17.6% vs. 6.7%, p = 0.013, Fig. 2B). Interestingly, MYC-amplified tumors were observed to harbor concurrent CN amplifications in various genes, particularly in RUNX1 partner transcriptional co-repressor 1 (RUNX1T1) (p < 0.01) and nibrin (NBN) (p < 0.01) (Fig. 2).
Comparative analyses demonstrated that MYC-amplified tumors had significantly higher number of CNVs than tumors with nonamplified MYC (p < 0.001; Fig. 2C). In addition to concurrent CN amplifications in RUNX1T1 (8q22) and NBN (8q21), other genes located in chromosome 8q were also found to be coamplified with MYC, including protein tyrosine kinase 2 (PTK2, 8q24.3), phosphatidylinositol-3,4,5-triphosphate dependent Rac exchange factor 2 (PREX2, 8q13.2), and protein kinase DNA-activated catalytic subunit (PRKDC, 8q11.21). In addition to genes located in chromosome 8q, we also observed concurrent CN amplifications in genes located in chromosome 8p11, including WRN RecQ-like helicase (WRN, 8p12), lysine acetyltransferase 6A (KAT6A, 8p11.21), fibroblast growth factor receptor 1 (FGFR1, 8p11.22), and adhesion G protein-coupled receptor A2 (ADGRA2, 8p11.23).
As shown in Figure 2D, the pattern for coamplification varied for each patient, with some patients showing coamplification in only genes from the q arm (e.g., MYC, RUNX1T1, NBN), while some showing gene coamplification spanning the q arm (e.g., MYC, RUNX1T1, NBN, PREX2, and PRKDC) and p arm (e.g., WRN, ADGRA2, FGFR1, and KAT6A) of chromosome 8. The CNVs detected from MYC-amplified tumors also spanned chromosome 17q (e.g., ERBB2 [17q12], CDK12 [17q12], SPOP [17q21.33], RARA [17q22], and BRIP [17q23.2]) and chromosome 11q13 (e.g., CCND1, FGF3, FGF4, and FGF19). These data suggest that the increased CNVs in MYC-amplified tumors could result in genomic instability and could potentially result in their more aggressive nature.
Molecular characteristics of MYC-amplified tumors in TCGA cohort
We also explored the molecular features of MYC-amplified breast tumors from TCGA cohort with their somatic genomic profile illustrated in Figure 3A. Among the 229 MYC-amplified breast tumors from TCGA cohort, TP53 mutations (50.7% [116/229]) were also the most frequently detected, followed by PIK3CA mutations (26.2% [60/229]), and ERBB2 CN amplification (21.0% [48/229]) (Fig. 3A). As compared with MYC nonamplified tumors, MYC-amplified breast tumors had significantly higher TP53 mutation rate (50.7% vs. 23.3%, p < 0.001), but significantly lower PIK3CA mutation rate (26.2% vs. 35.3%, p = 0.011) (Fig. 3B).
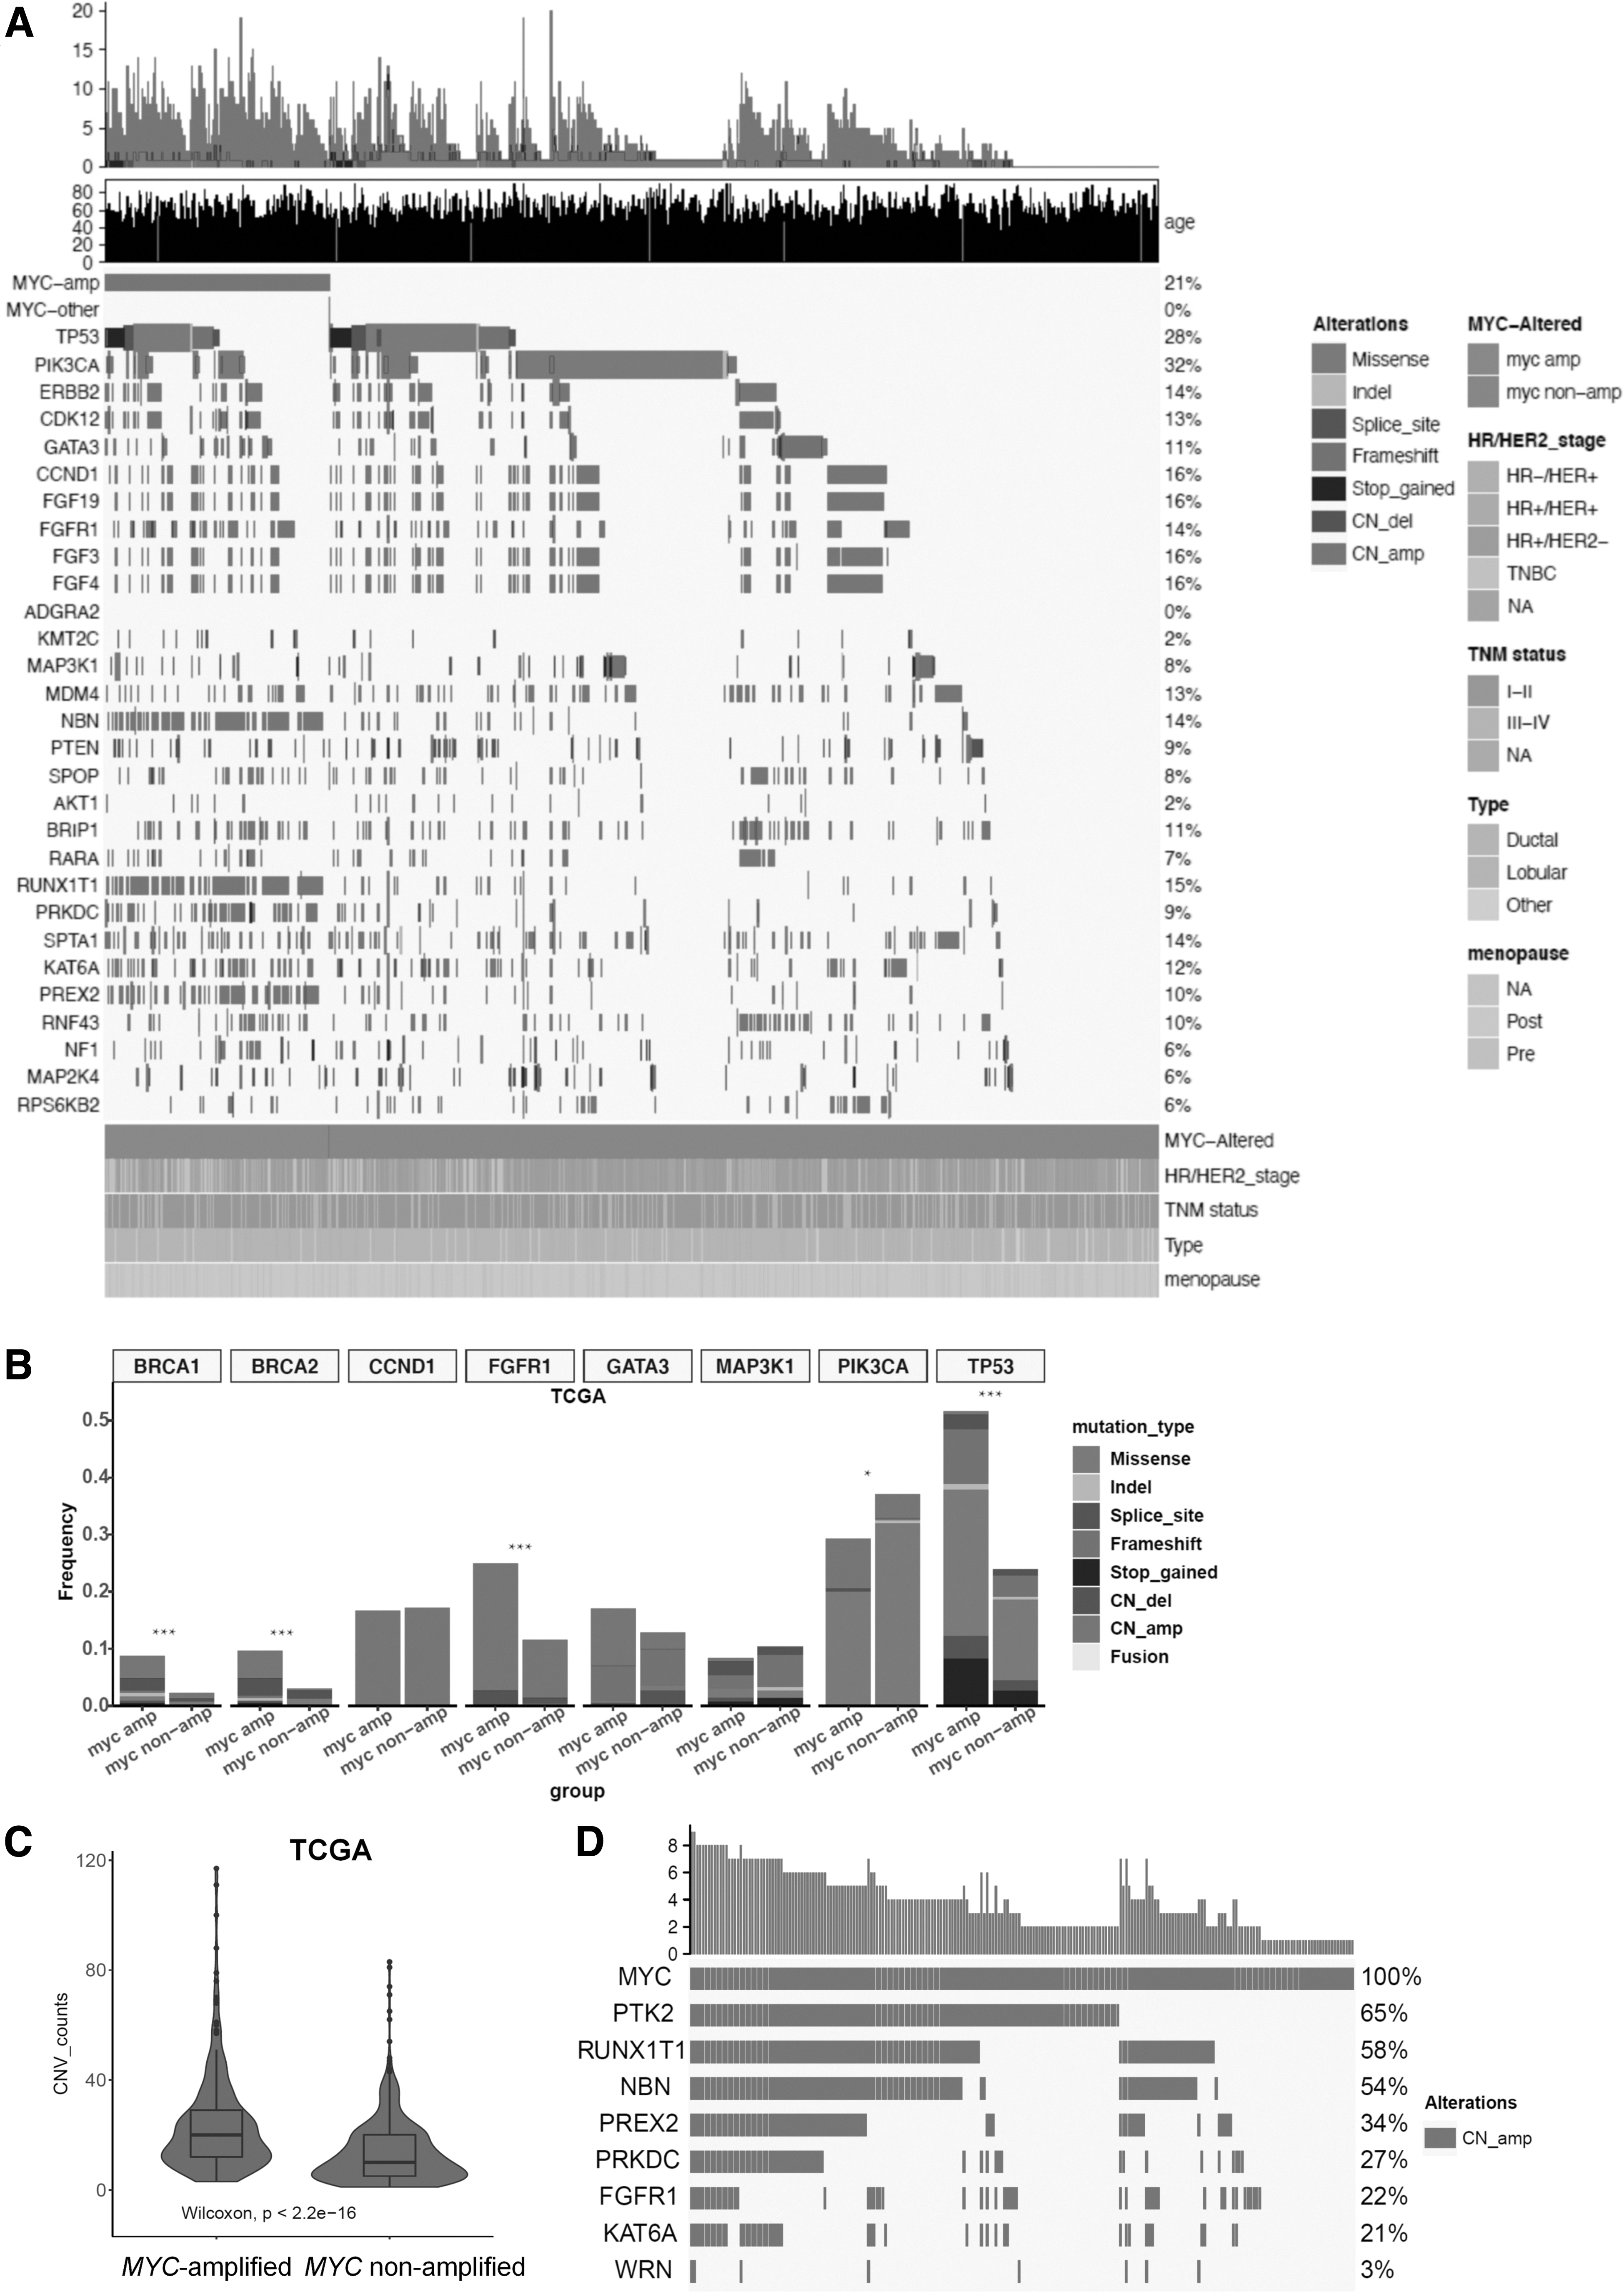
MYC-amplified breast tumors from TCGA cohort also had significantly more concurrent CN amps.
Similar to findings with GDPH cohort, MYC-amplified tumors from TCGA cohort also had significantly higher number of CNVs than tumors with nonamplified MYC (p < 0.001; Fig. 3C). According to the distribution of mutations in Figure 3A, the genes commonly coamplified with MYC in the GDPH cohort were similarly coamplified in TCGA cohort. Among the genes located in chromosome 8, a majority of the MYC-amplified tumors from TCGA cohort had coamplification of chromosome 8q PTK2 (65%), RUNX1T1 (58%), and NBN (54%) (Fig. 3D). These findings suggest that MYC-amplified tumors had distinct molecular profile than MYC nonamplified breast tumors, which were consistent between GDPH and TCGA cohorts.
Comparison between MYC-amplified tumors in GDPH and TCGA cohorts
We further compared the molecular profile of MYC-amplified breast tumors from the GDPH and TCGA cohorts. Compared with TCGA cohort, the GDPH cohort had significantly higher mutation detection rates in TP53 (70.6% vs. 50.7%, p = 0.012), PIK3CA (45.1% vs. 26.2%, p = 0.011), and ERBB2 (39.2% vs. 21.0%, p = 0.011) (Fig. 4A). These significantly higher mutation detection rates were consistent when our cohort comprising Chinese women with MYC-amplified tumors (n = 51) was compared with the subgroup of White women with MYC-amplified tumors from TCGA cohort (n = 141) (TP53, 70.6% vs. 51.8%, p = 0.022; PIK3CA, 45.1% vs. 23.4%, p = 0.006; ERBB2, 39.2% vs. 19.9%, p = 0.008) (Fig. 4B).
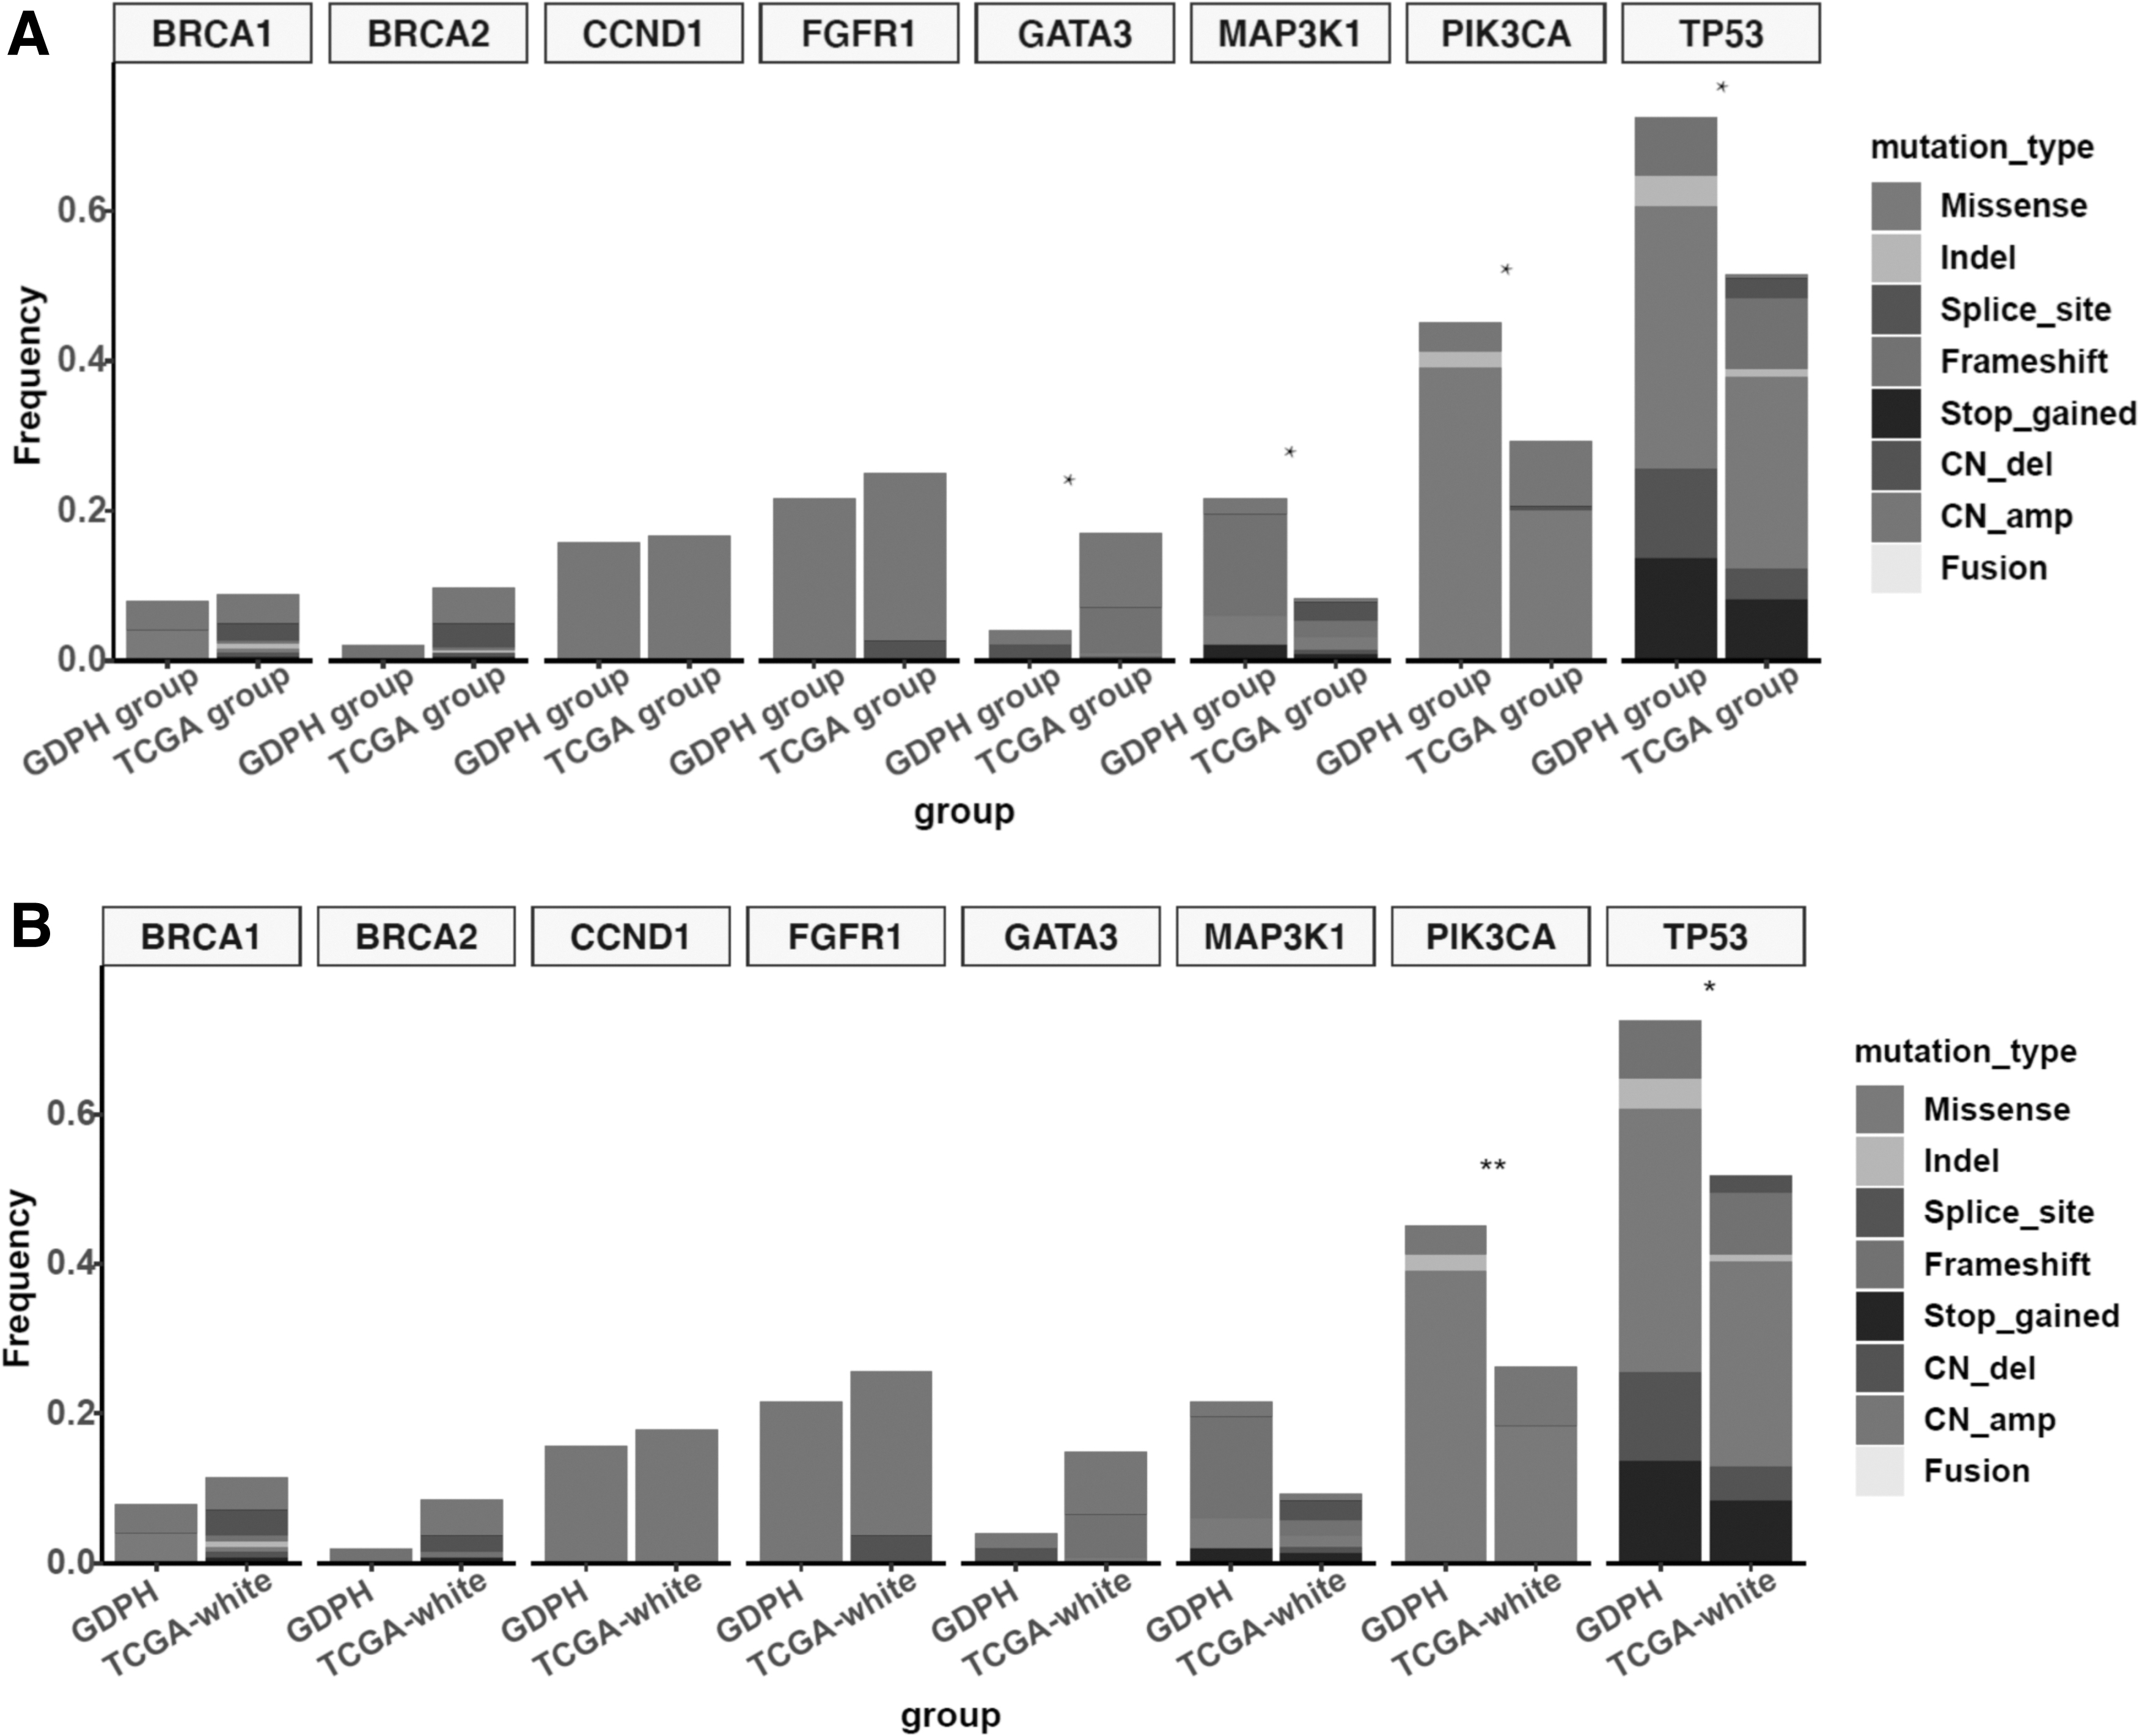
Comparison of the distribution of concurrent gene mutation frequency in MYC-amplified tumors between the GDPH and TCGA cohorts
The MYC-amplified subgroup of TCGA cohort was composed of 61.6% (141/229) White, 21.4% (49/229) Black or African American, 6.1% (14/229) Asians, and 10.9% (25/229) missing data. Meanwhile, the MYC nonamplified subgroup was composed of 70.9% (603/850) White, 15.5% (132/850) Black or African American, 5.4% (46/850) Asians, 0.1% (1/850) American Indian or Alaska native, and 8.0% (68/850) missing data.
Comparison between MYC-amplified and nonamplified tumors across molecular subtype in GDPH and TCGA cohorts
We also investigated the molecular features of MYC-amplified and nonamplified tumors across molecular subtypes (Fig. 5). The molecular subtype distribution per subgroup is detailed in Table 2. In the GDPH cohort, TP53 (64.3% vs. 26.0%, p < 0.001) and MAP3K1 (21.4% vs. 7.7%, p = 0.03) mutations were subtype specific and were significantly higher in MYC-amplified HR-positive/HER2-negative breast tumors (Fig. 5A). No other genes were differentially mutated across molecular subtype in the GDPH cohort.
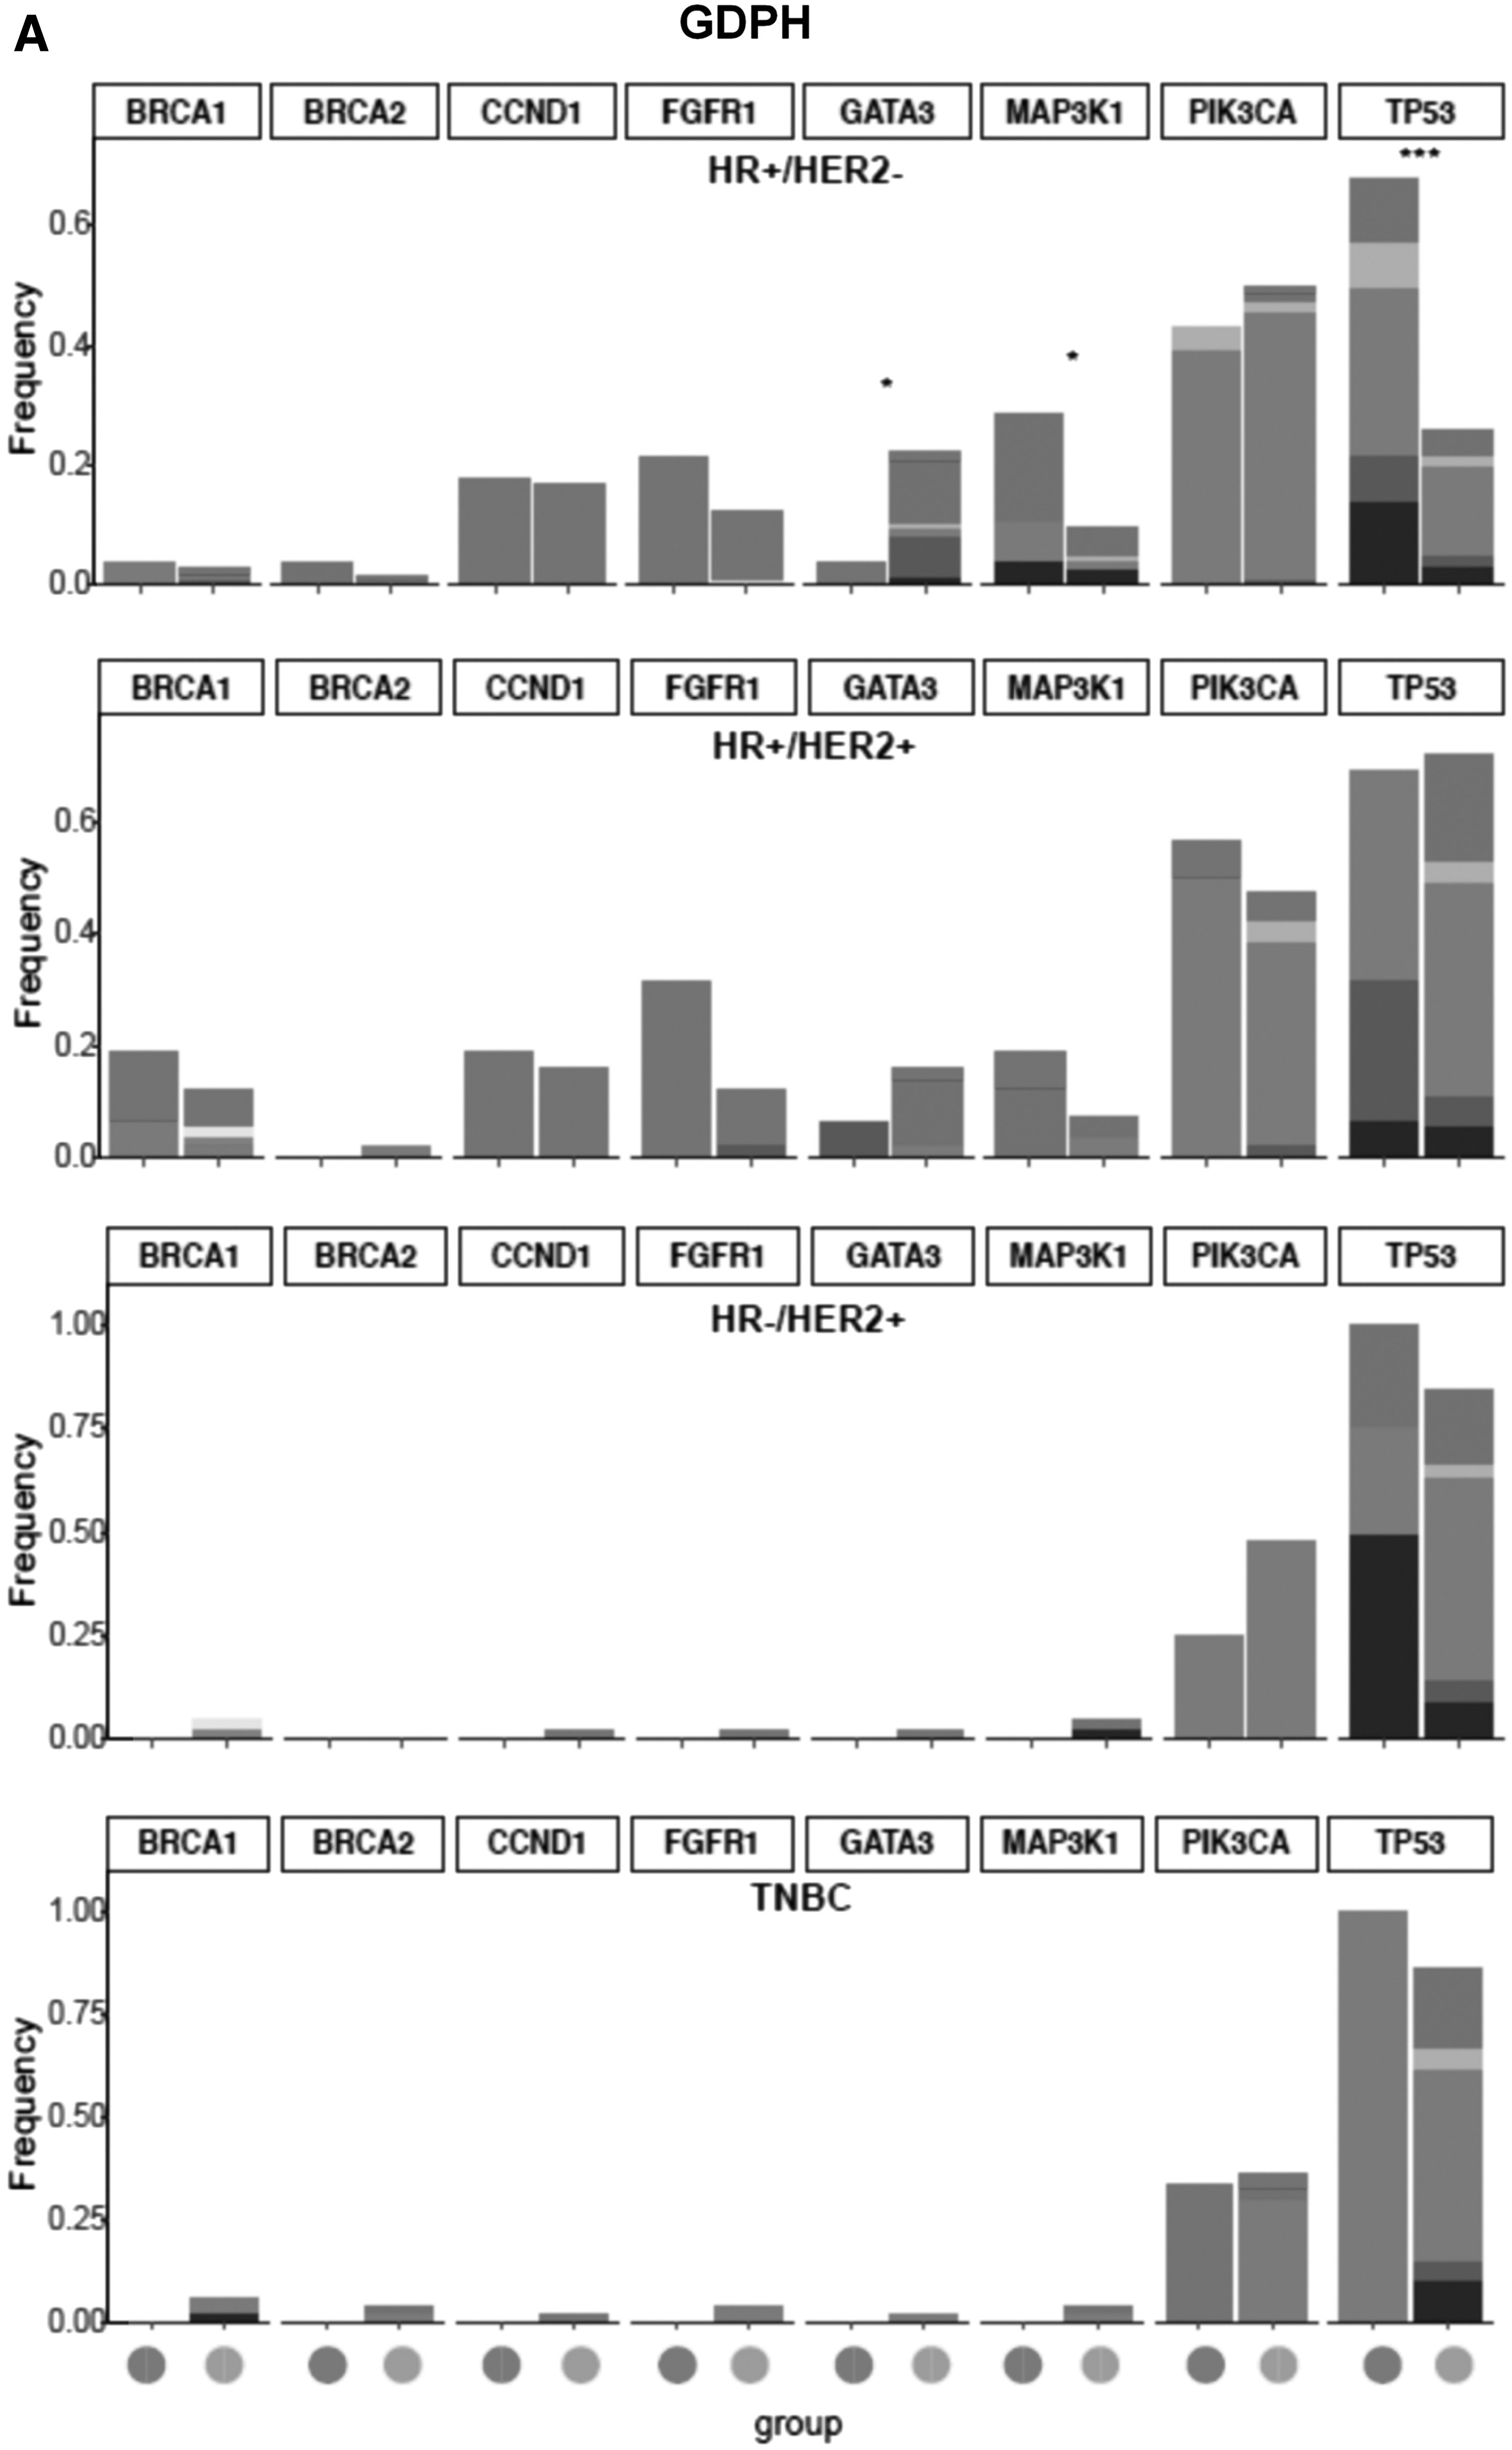
Comparison of the distribution of concurrent gene mutation frequency between MYC-amplified and nonamplified tumors in the GDPH
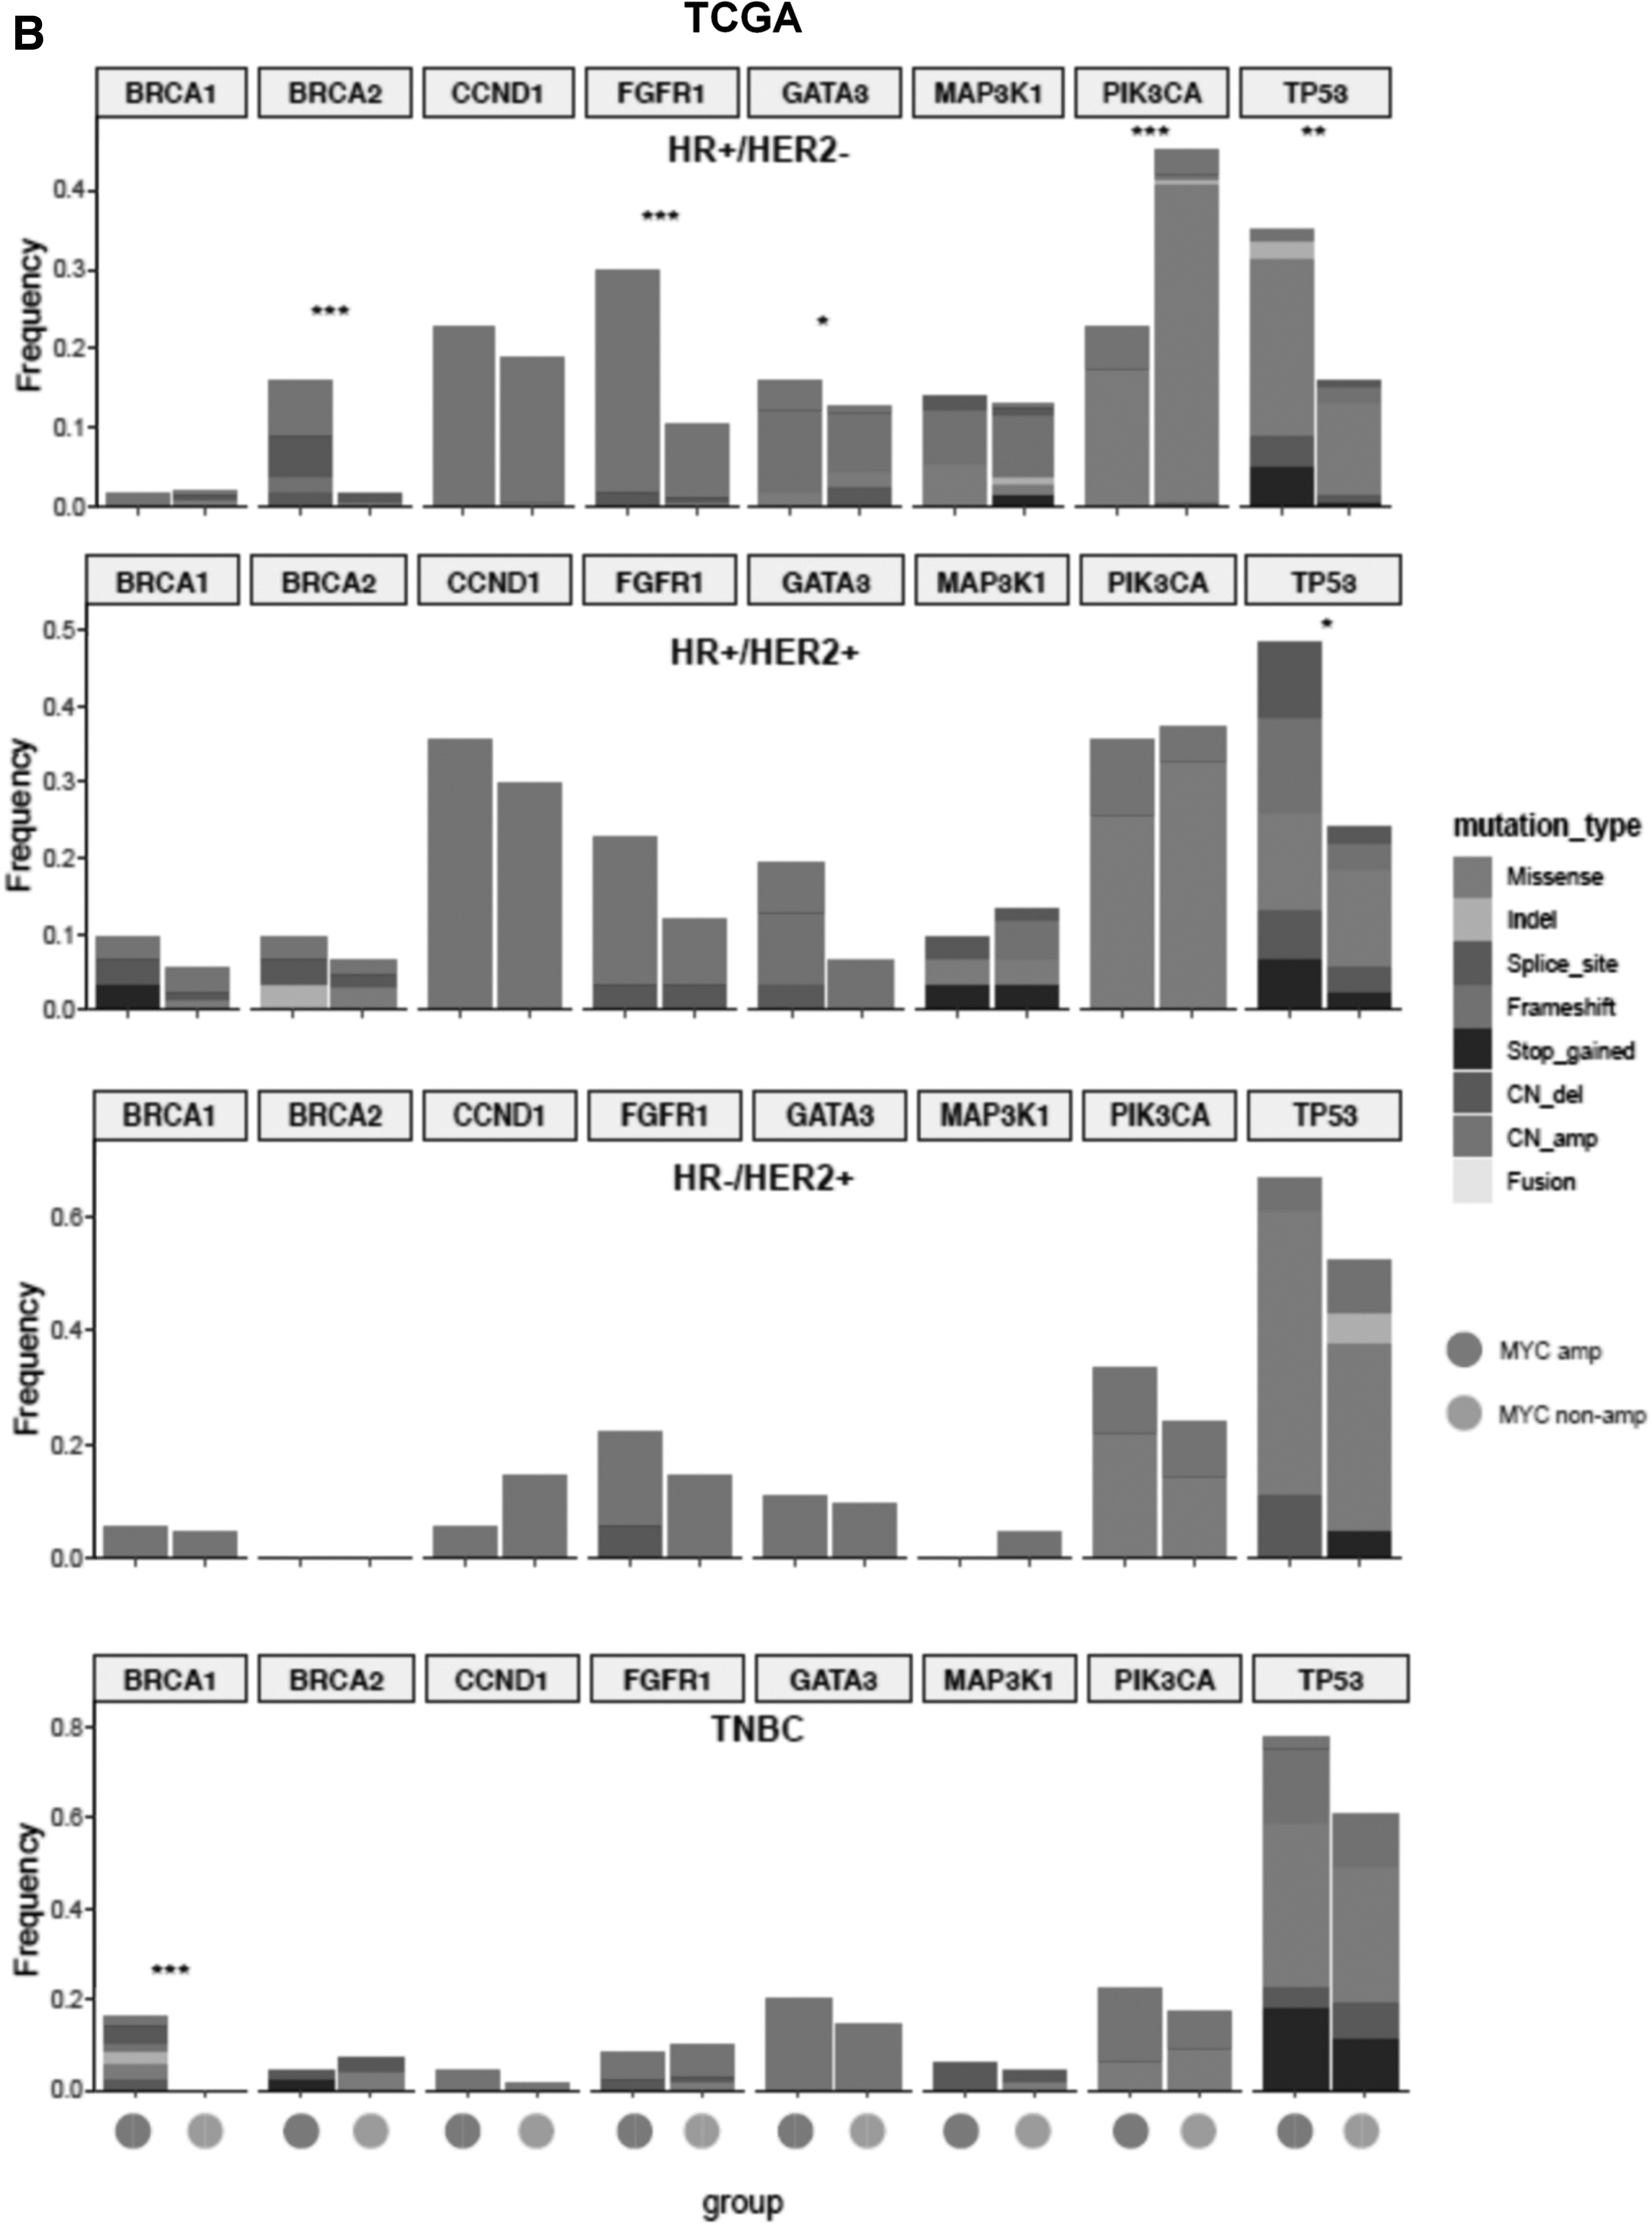
In TCGA cohort, TP53 mutations were significantly more in the MYC-amplified HR+/HER2− subgroup (35.1% vs. 15.4%, p = 0.001) and MYC-amplified HR+/HER2+ subgroup (45.2% vs. 23.1%, p = 0.023) than their MYC nonamplified counterpart (Fig. 5B). In addition, the MYC-amplified HR+/HER2− subgroup also had significantly higher BRCA2 mutation rate than their MYC nonamplified counterpart (15.8% vs. 1.7%, p < 0.001; Fig. 5B). In the TNBC subgroup, BRCA1 mutations were exclusively detected in MYC-amplified tumors and not detected in MYC nonamplified TNBC (16.3% vs. 0%, p < 0.001; Fig. 5B).
Signaling pathways differentially mutated in MYC-amplified tumors
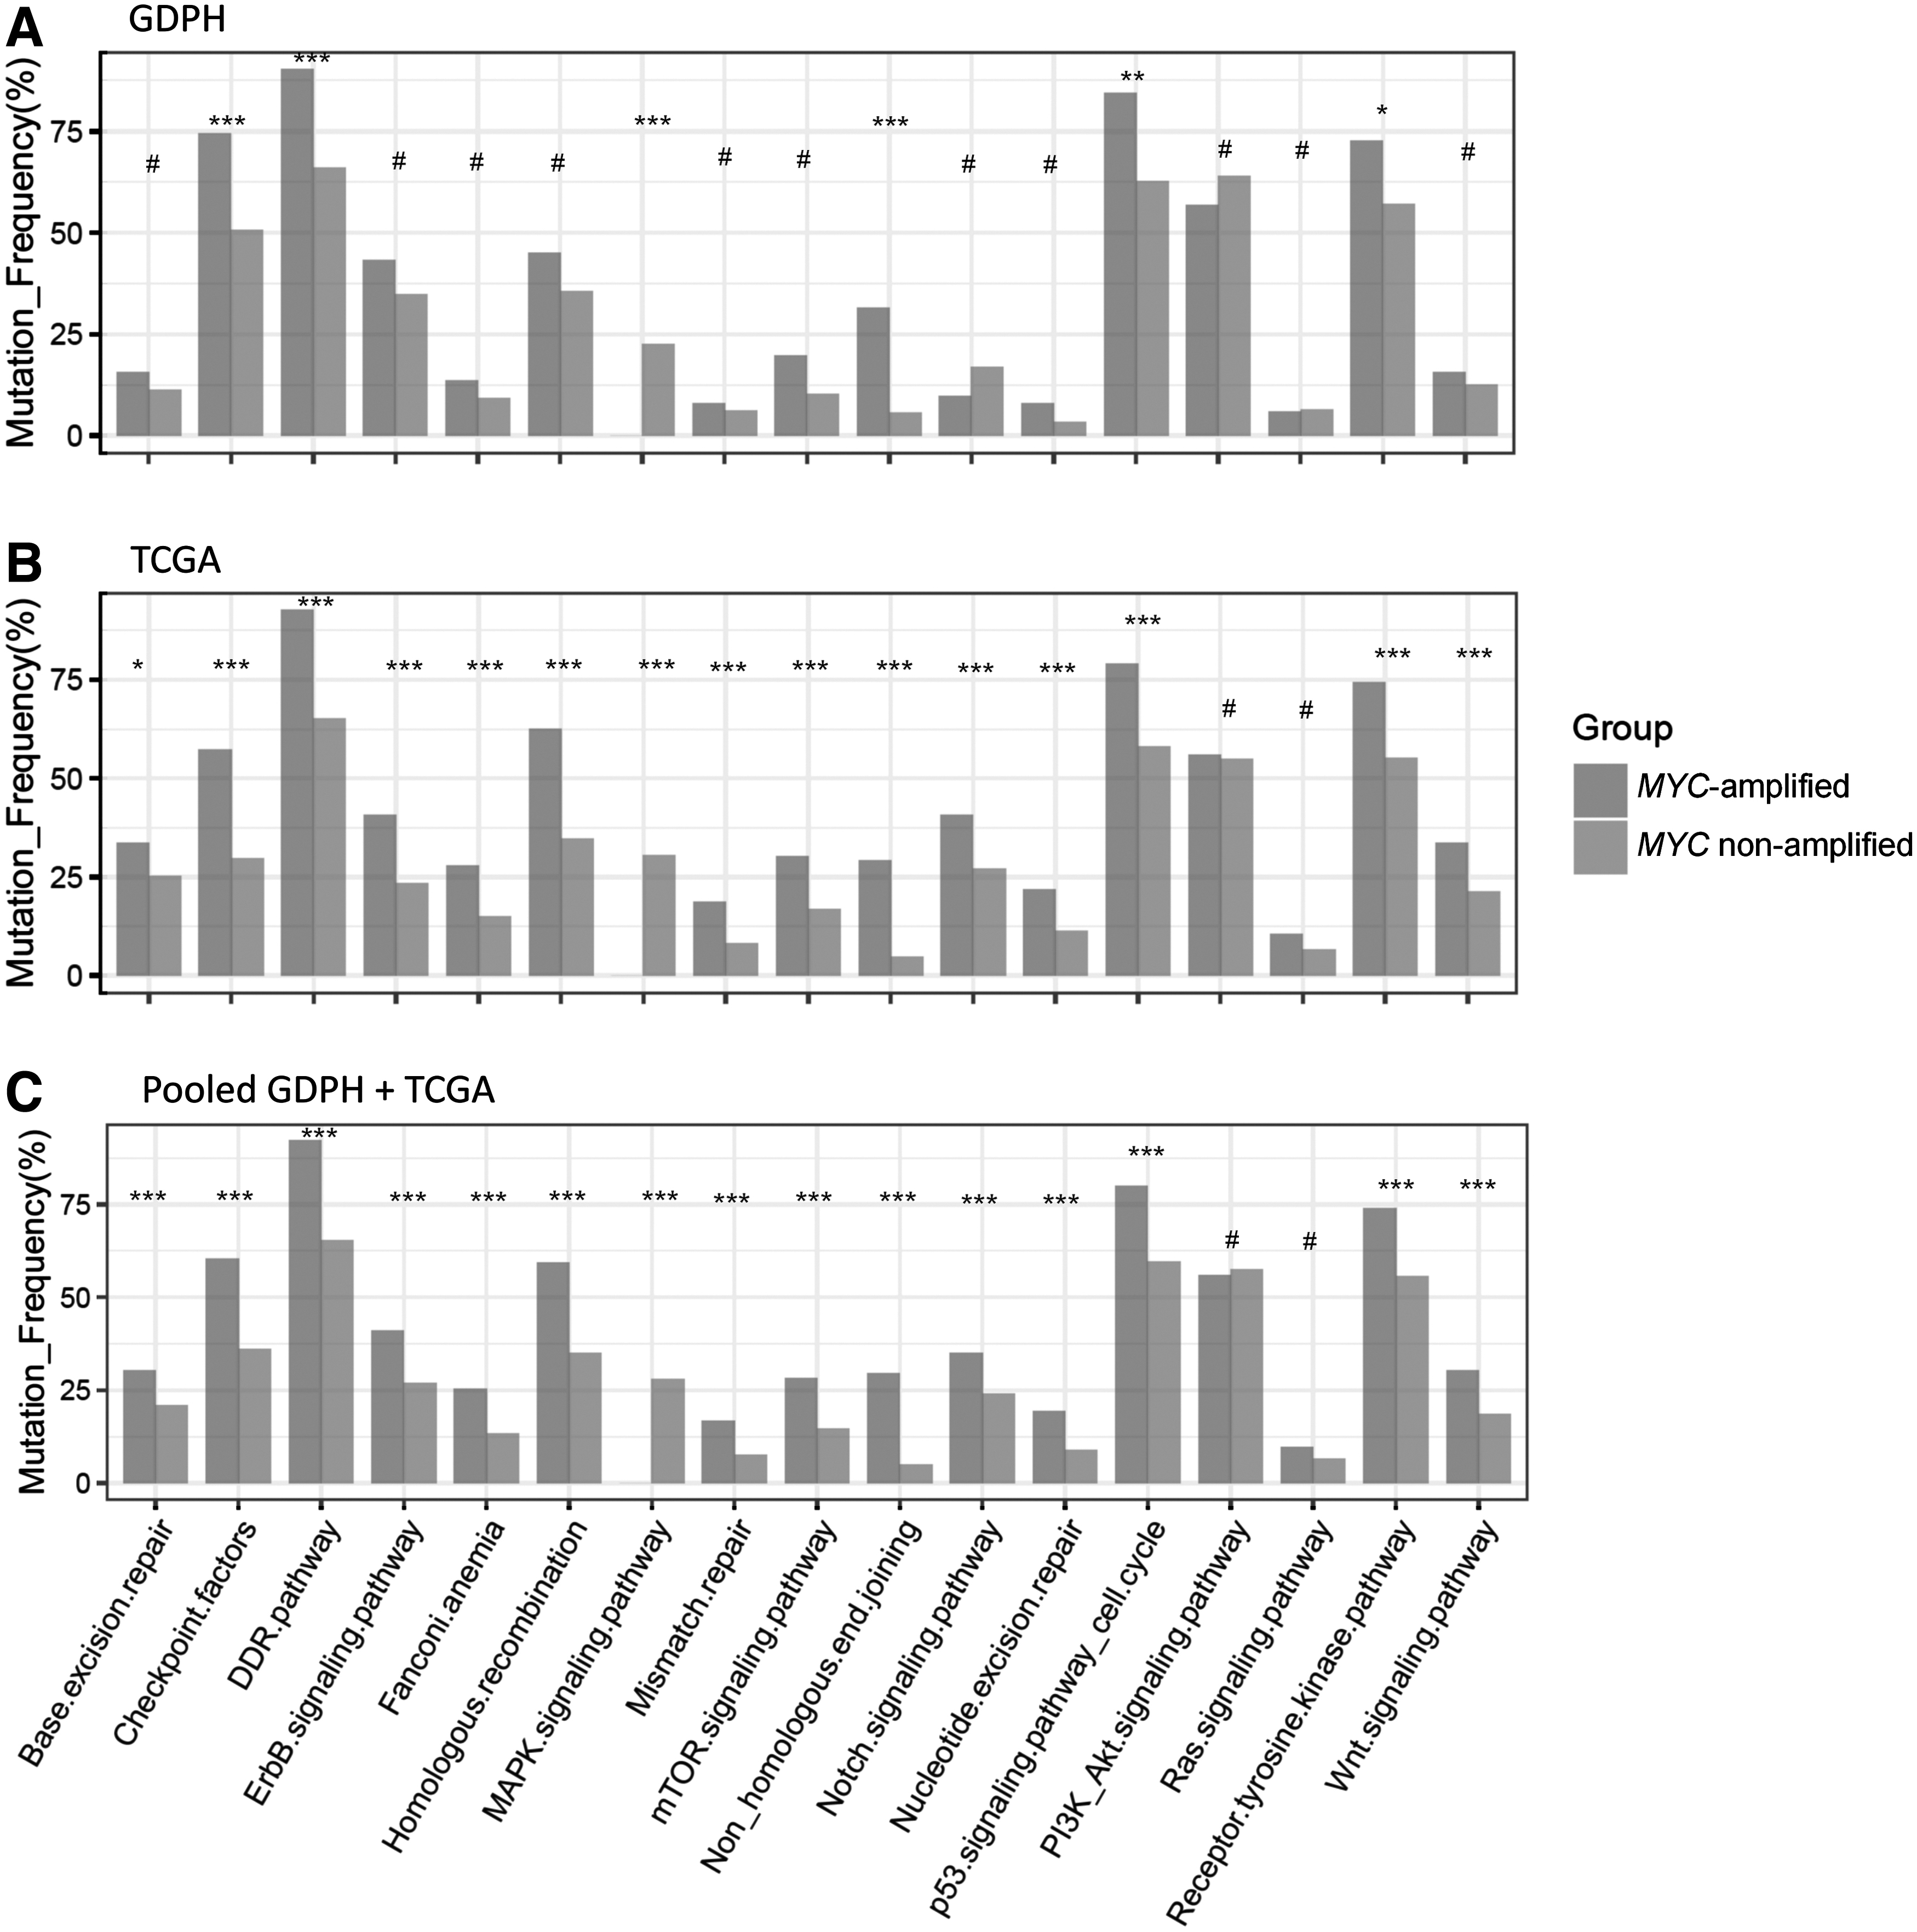
We further explored the signaling pathways that were differentially mutated in MYC-amplified tumors in GDPH and TCGA cohorts (Fig. 6). We mapped the related pathways using KEGG and compared the data between MYC-amplified and nonamplified tumors in GDPH and TCGA.
Comparison of the mutated signaling pathways between MYC-amplified and nonamplified tumors in the GDPH
Compared with MYC nonamplified tumors, MYC-amplified tumors from the GDPH cohort had significantly more mutations in genes related to six signaling pathways, including checkpoint factors (p = 0.001), DNA damage repair pathway (p < 0.001), mitogen activated protein kinase pathway (p < 0.001), nonhomologous end joining repair pathway (p < 0.001), p53 signaling pathway/cell cycle (p = 0.002), and receptor tyrosine kinase pathway (p = 0.047) (Fig. 6A). Consistent with the GDPH cohort, the above mentioned six pathways were also more significantly mutated in MYC-amplified tumors from TCGA cohort (p < 0.001).
In addition to these six pathways, another nine pathways were also significantly mutated in MYC-amplified tumors from TCGA cohort, including base excision repair pathway (p = 0.012), ErbB signaling pathway (p < 0.001), fanconi anemia pathway (p < 0.001), homologous recombination repair pathway (p < 0.001), mismatch repair pathway (p < 0.001), mammalian target of rapamycin signaling pathway (p < 0.001), Notch signaling pathway (p < 0.001), nucleotide excision repair pathway (p < 0.001), and Wnt signaling pathway (p < 0.001) (Fig. 6B). Interestingly, when the data from the GDPH and TCGA cohorts were combined, these 15 signaling pathways remained significantly higher in MYC-amplified breast tumors compared with MYC nonamplified tumors (Fig. 6C).
It should be noted that 8 out of the 15 pathways were involved in DNA repair and cell cycle, whereas the other pathways were related to cell growth and proliferation. Two pathways, phosphatidylinositol 3-kinase (PI3K)-protein kinase B (Akt) signaling and Ras signaling pathways, were similarly mutated between MYC amplified and MYC nonamplified tumors in both GDPH and TCGA cohorts (Fig. 6A-C). These findings demonstrate that MYC amplified tumors had a variety of dysregulated signaling pathways, particularly those that were involved in DNA repair, cell cycle, and cell proliferation.
MYC amplification and patient outcomes of different molecular BRCA subtypes in TCGA cohort
Since survival outcomes were not available for our cohort, we analyzed the disease-free survival (DFS) or overall survival (OS) data from TCGA cohort to evaluate the association between MYC amplification and patient outcomes. Patients with or without MYC amplification had comparable DFS, regardless of molecular subtype (Fig. 7A–E). Moreover, MYC amplification status did not influence OS among all patients and patients with HR+/HER2− and HER2-enriched (Fig. 8A–D). Interestingly, patients with HR+/HER2+ tumors with MYC amplification had significantly shorter OS than those without MYC amplification (p = 0.038, Fig. 8C). In contrast, TNBC tumors with MYC amplification had significantly better OS than MYC nonamplified TNBC (p = 0.027, Fig. 8E).
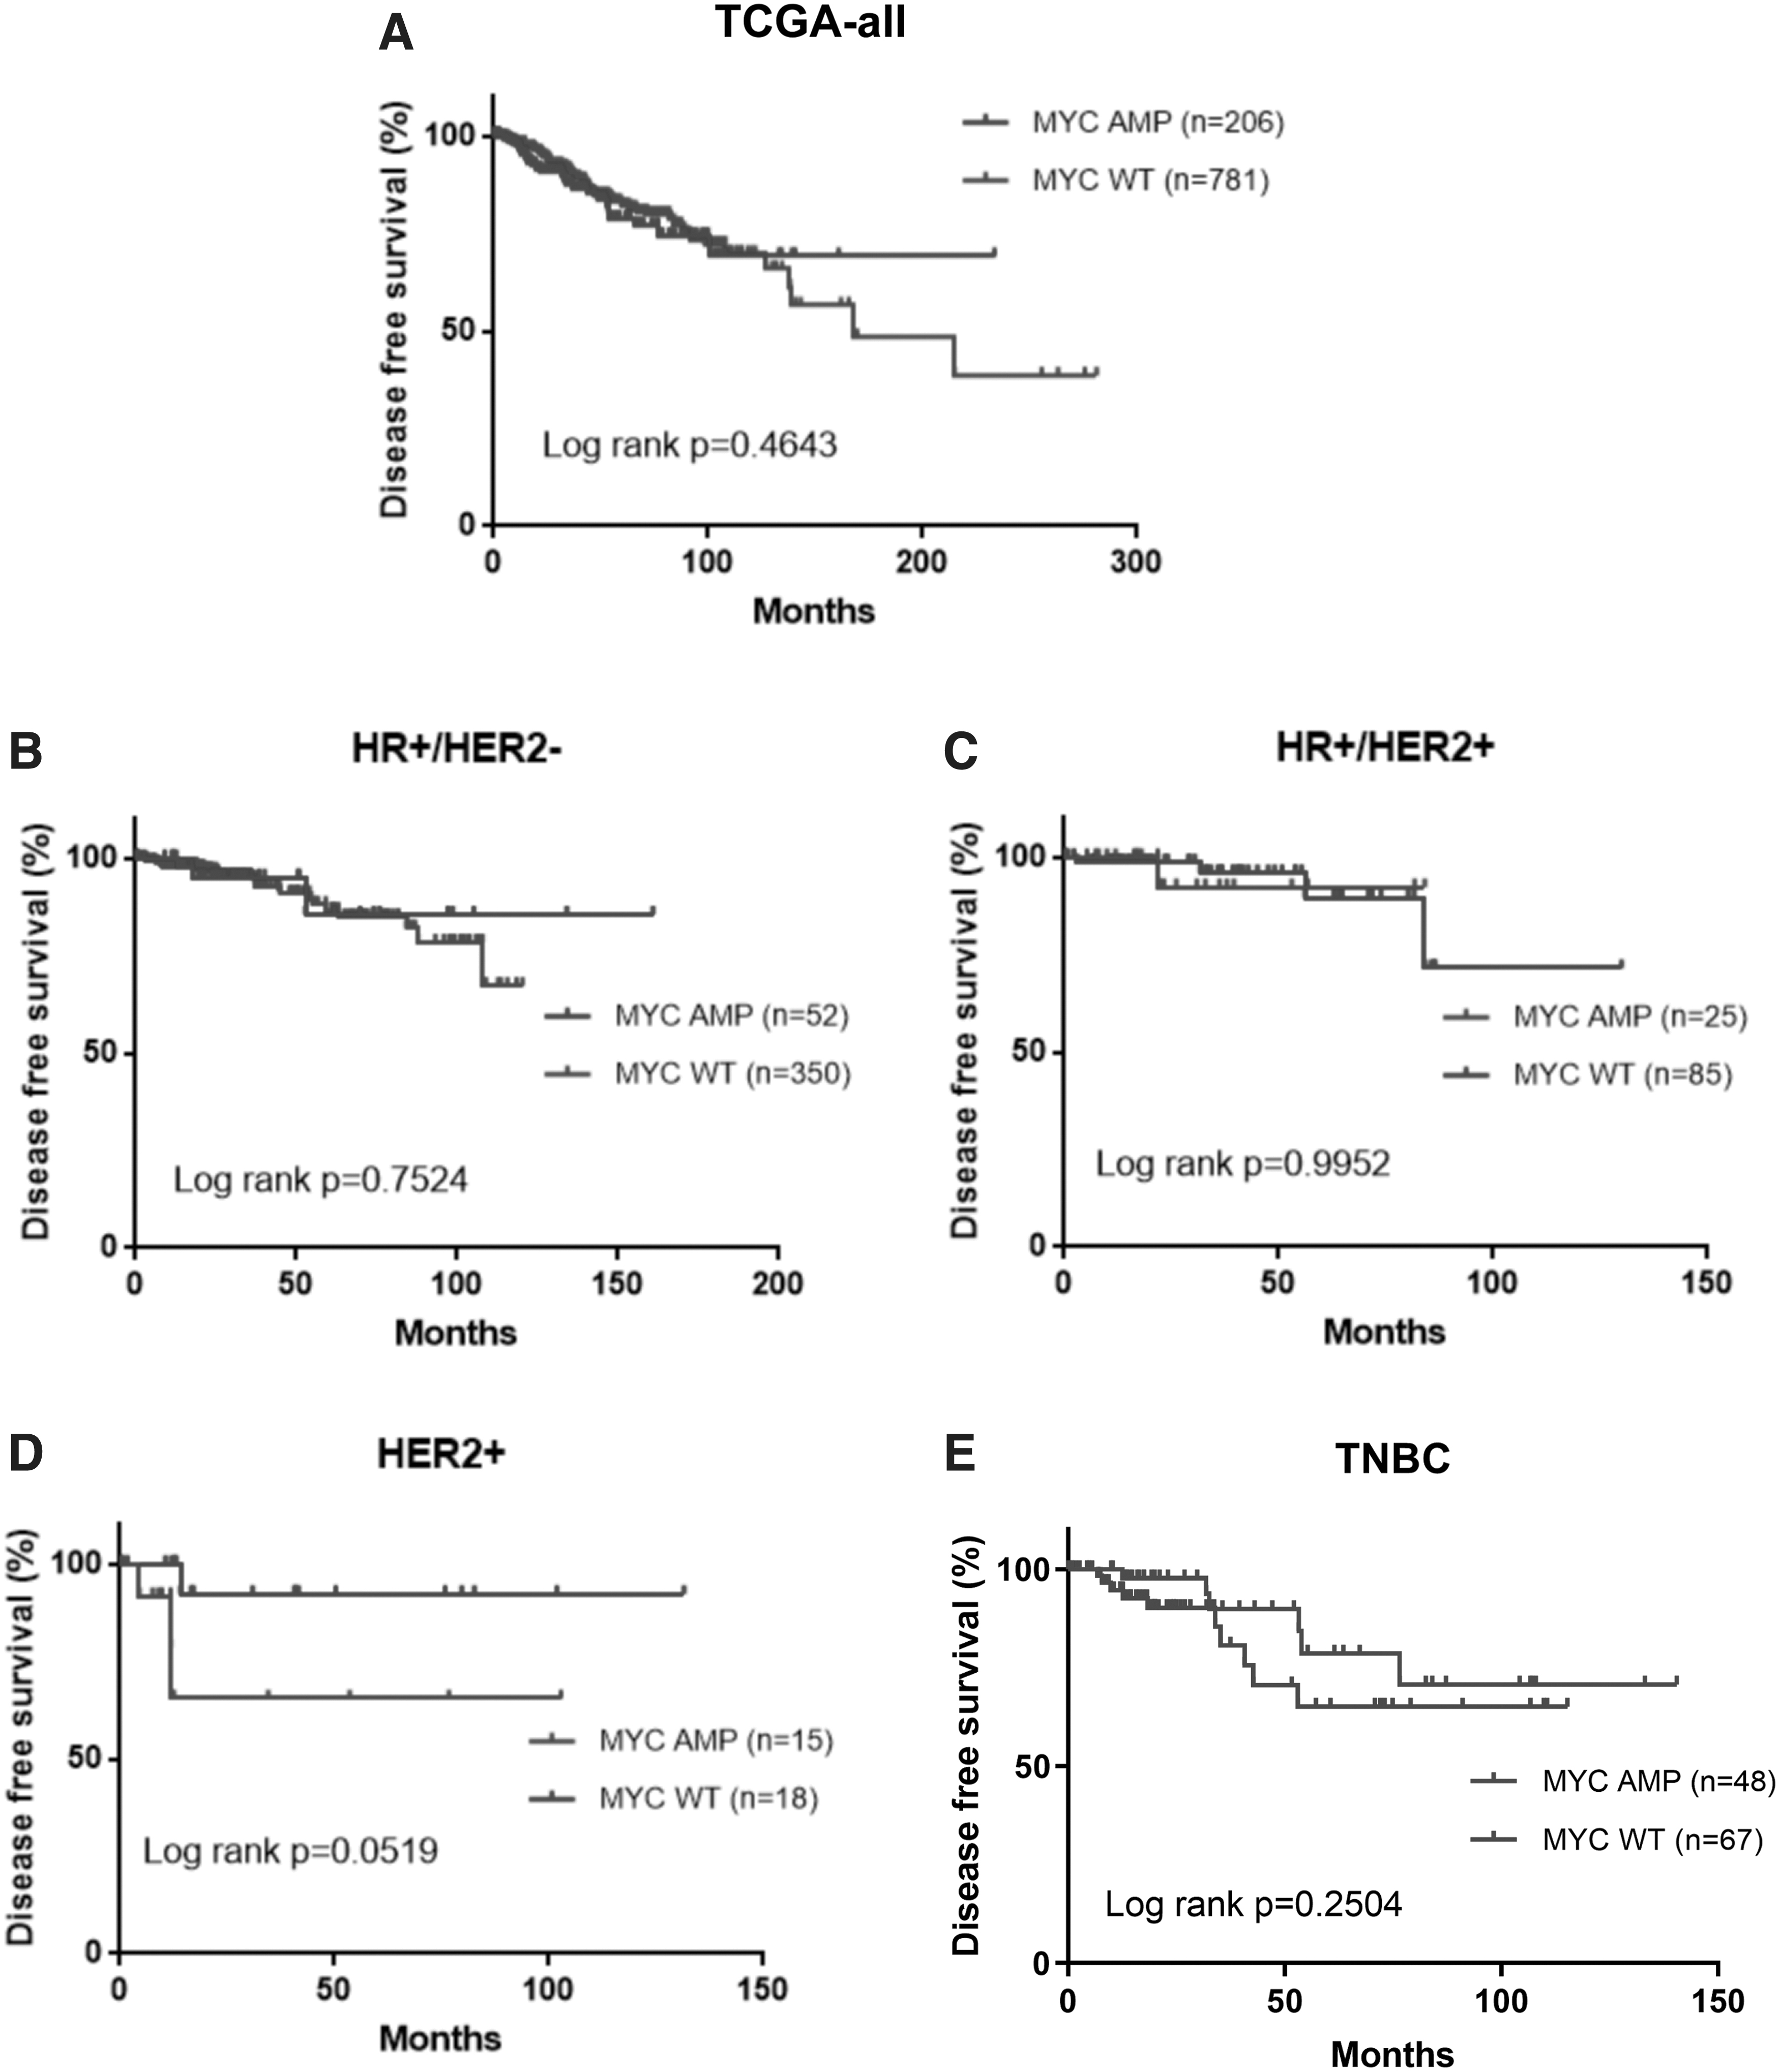
DFS outcomes were similar for patients with MYC-amplified (MYC amp) and nonamplified (MYC wild type, wt) BRCA from TCGA cohort.
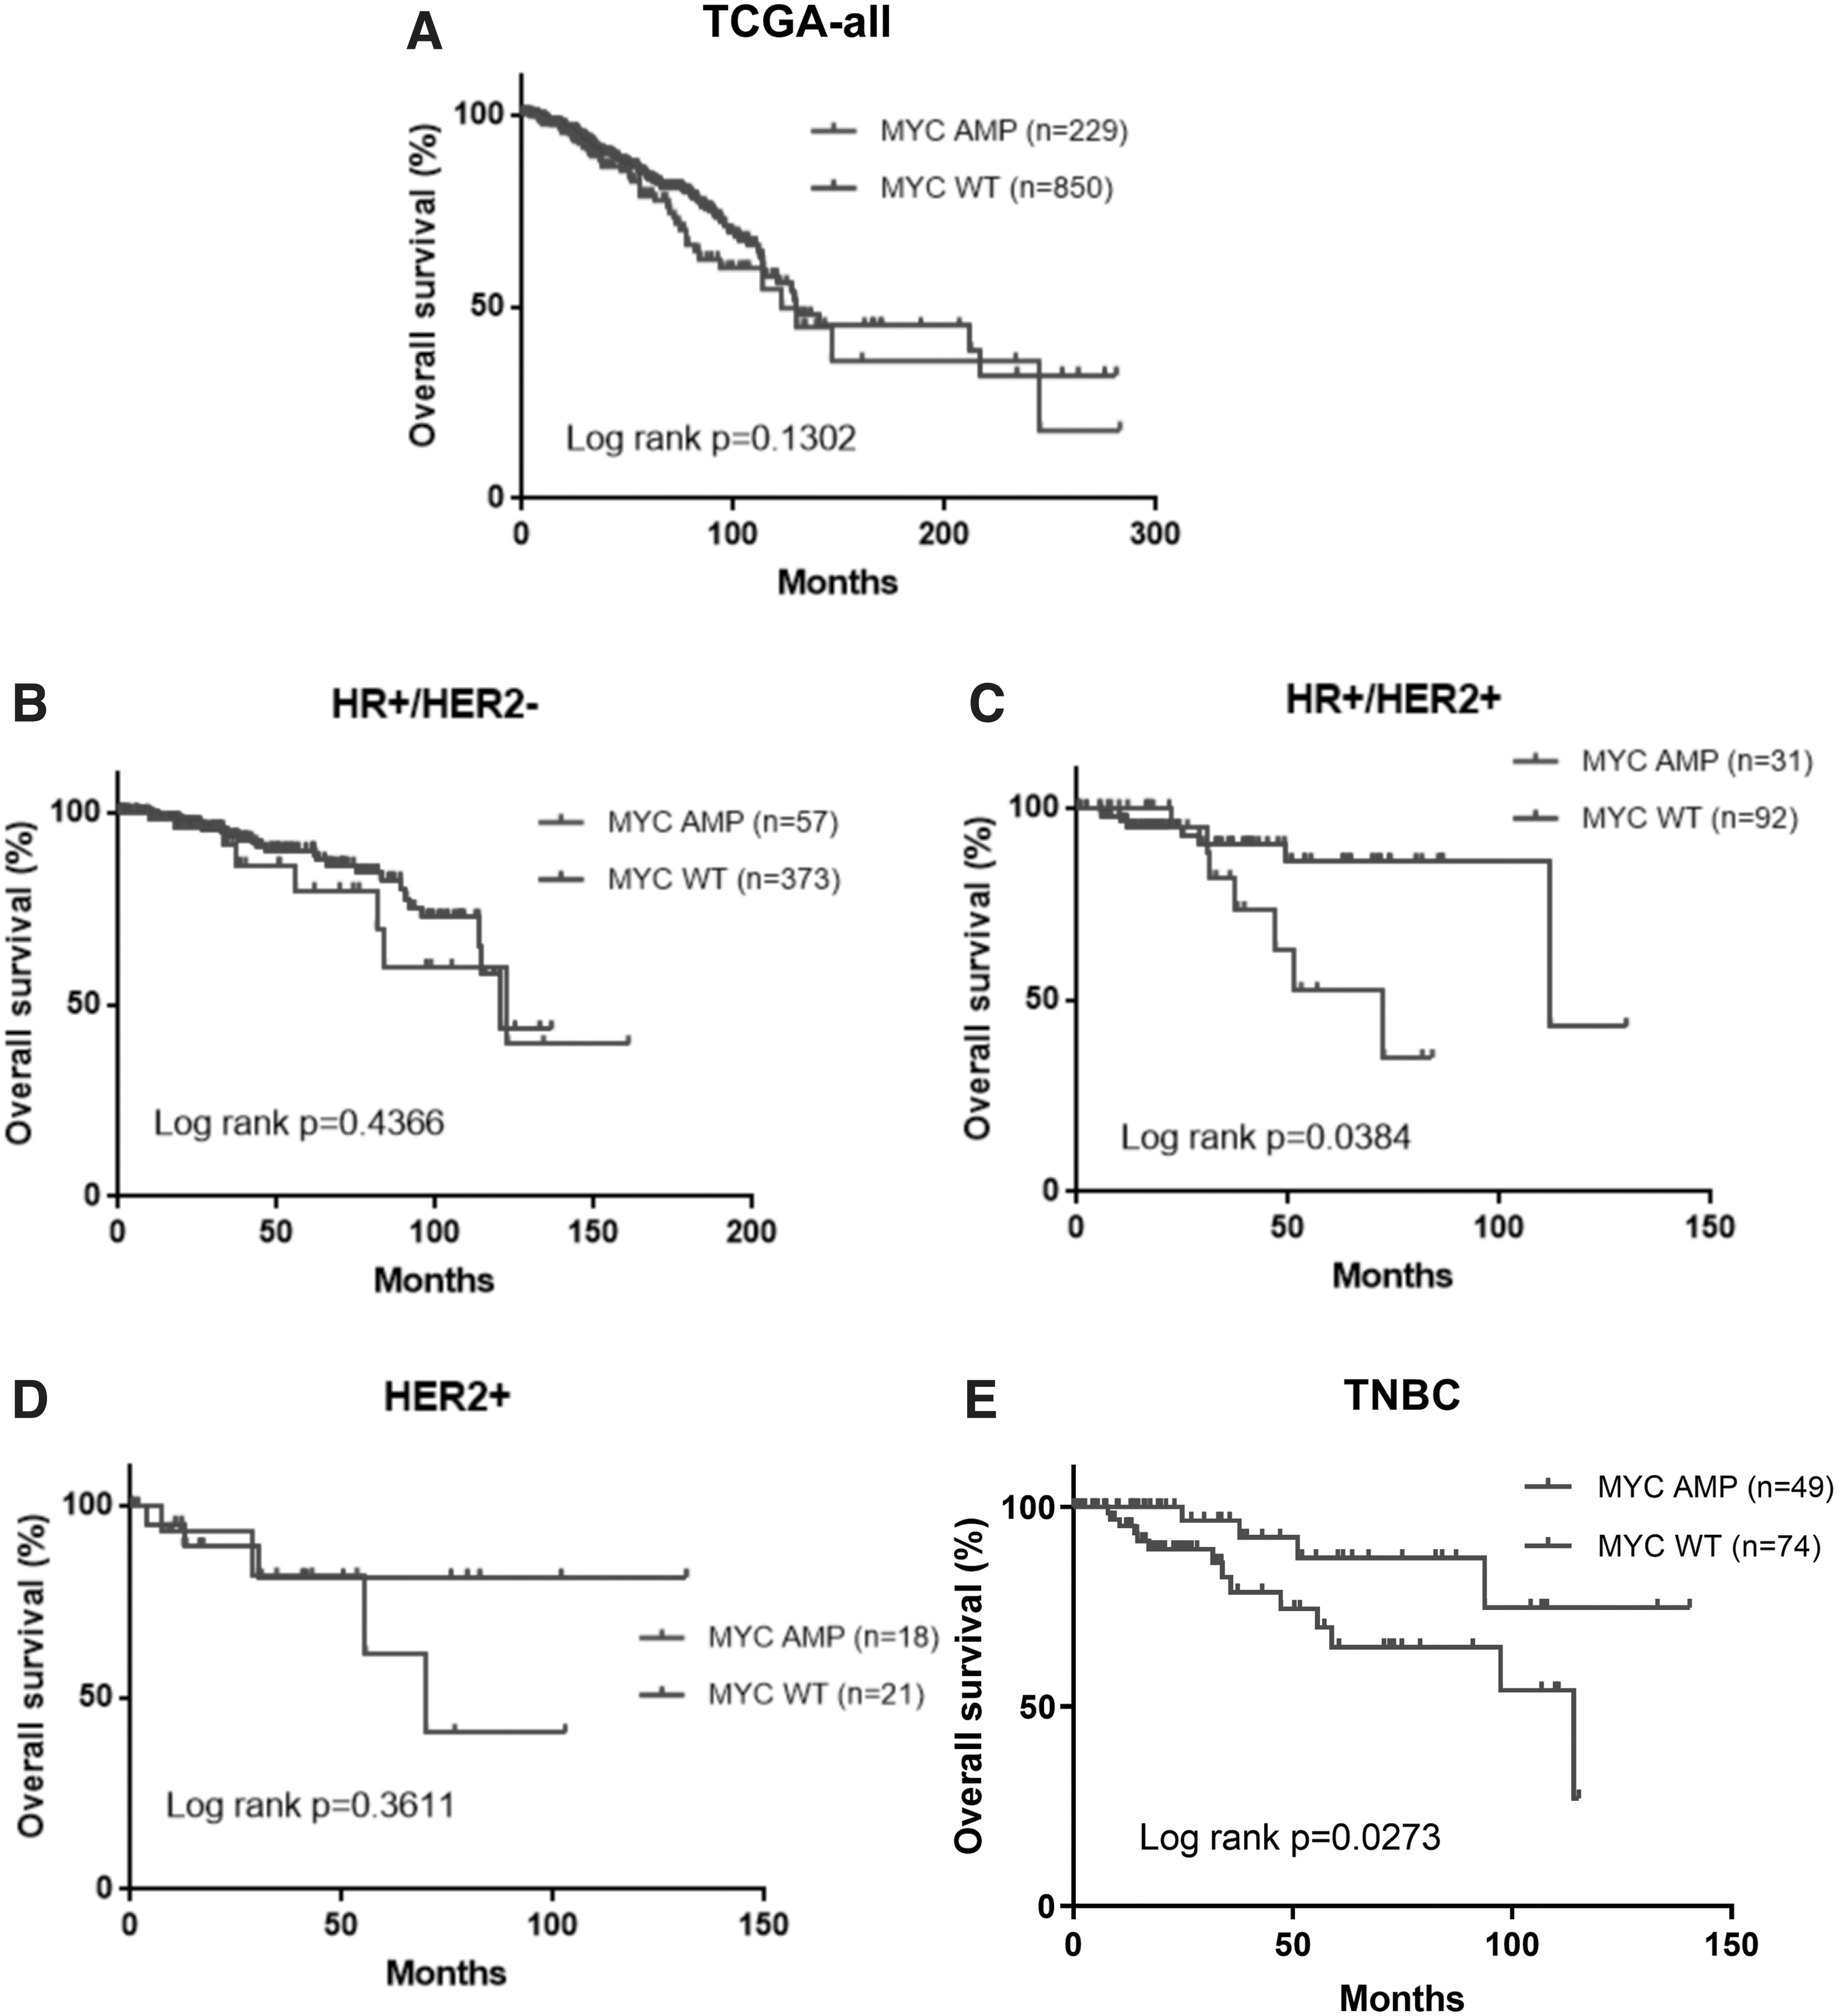
OS outcomes had subtype specific trend for patients with MYC-amplified (MYC amp) and nonamplified (MYC wild type, wt) BRCA from TCGA cohort.
Discussion
TCGA has greatly contributed to our current understanding that gene alterations are involved in the initiation and progression of various cancer types, including BRCA. However, TCGA database only included 3–6% of cancer patients of Asian descent (Spratt et al., 2016). Specifically, only 5.6% (60/1079) of the BRCA patients in TCGA database were Asians (Yuan et al., 2018). Hence, the prevalence of certain molecular alterations among Asian BRCA patients remains unknown. The purpose of our study was to investigate the prevalence of MYC alterations in Chinese patients with BRCA. We also explored the correlations between MYC amplifications and clinicopathological and molecular characteristics, as well as their impact on patient outcomes for BRCA patients, to provide a deeper understanding of the clinical and molecular features of MYC-amplified breast tumors.
Copy number alterations of certain genes and chromosomal regions, including MYC located in chromosome 8q24, have been implicated in breast tumorigenesis and were associated with poor prognosis (Deming et al., 2000; Jain et al., 2001; Al-Kuraya et al., 2004; Chin et al., 2006; Green et al., 2016). Previous studies have found that MYC was amplified in 30–50% of breast tumors (Deming et al., 2000; Miller et al., 2011; Green et al., 2016).
In the BRCA cohort of TCGA, the frequency of MYC amplification was 21.22%, which was much higher than that found in our cohort (12.44%). This difference in prevalence might be due to the patient population we have included in this study. One of our previous studies have reported a 23% detection rate of MYC amplification from Chinese women with BRCA (Zhang et al., 2019). TCGA cohort had older patient population with more postmenopausal women than our cohort, and MYC amplification was more likely to be detected among older patients.
In our study, we identified two MYC gene fusions, RTFDC1-MYC and PVT1-MYC. The patient identified with a PVT1-MYC gene fusion also had concurrent MYC amplification, suggesting translocation and segmental duplication of chromosome 8q24 locus. PVT1-MYC gene fusion was first reported in medulloblastoma and was reported in the American Association for Cancer Research (AACR) Project Genomics, Evidence, Neoplasia, Information, Exchange (GENIE) Consortium at a frequency of 0.18%, with breast invasive ductal carcinoma as one of the tumor types with the highest prevalence (Consortium, 2017). Northcott et al. (2012) confirmed the fusion transcript consisting of exons 1 to 3 of PVT1 fused to the exons 2 to 3 of MYC.
PVT1-MYC gene fusions were found to occur in ≥60% of patients with medulloblastoma harboring MYC amplification. Tseng et al. (2014) found that the CN of PVT1, also located in chromosome 8q24.21 similar to MYC, was also amplified in ≥98% of cancers harboring MYC CN amplifications. Moreover, the increase in PVT1 long noncoding RNA expression levels was required for high MYC protein levels and enhanced proliferation in 8q24-amplified human cancer cells, including BRCA cells (Tseng et al., 2014).Due to its critical role as a regulatory RNA, the amplification and/or overexpression of PVT1 has been found in many cancers and has been associated with cancer progression; however, its specific mechanism of action remains unclear (Onagoruwa et al., 2020).
In our cohort, we have also identified RTFDC1-MYC fusion, which was previously unreported, and MYC E366K missense mutation, which was previously reported in a patient with lung adenocarcinoma and cataloged in COSMIC (Zehir et al., 2017). Both RTFDC1-MYC and MYC E366K were classified as variants of uncertain significance. The function of both these rare somatic mutations in breast tumorigenesis awaits further investigation.
Genomic gains of chromosome 8q, which includes MYC, have been reported in variety of cancers, including BRCA (Shadeo and Lam, 2006). Preclinical evidence has shown that MYC overexpression contributes to breast tumorigenesis by inducing chromosomal instability (Rohrberg et al., 2020). Focal amplification of MYC oncogene promotes genomic instability by inducing DNA replication stress through forced entry of the cells into S phase, which then lead to increased replication-related errors and DNA lesions (Duijf et al., 2019). Based on our molecular analyses, we found that MYC-amplified tumors had more concurrent CNVs in genes located in chromosomes 8p, 8q, 11q, and 17q, which increase the likelihood of chromosomal instability.
Further pathway mapping analysis also revealed that MYC-amplified tumors had more mutations involved in 15 different but interrelated pathways critical in DNA repair, cell cycle, and cell proliferation. These findings provide an evidence of simultaneous dysregulation of multiple signaling pathways resulting from an increased number of CNVs and contributing to an increased chromosomal instability in MYC-amplified breast tumors.
Deming et al. (2000) conducted a meta-analysis comprising 29 studies and 3797 patients and showed that MYC amplification was significantly but weakly associated with tumor grade, LN metastases, negative PR status, and postmenopausal status. In a recent study comprising 65 African American patients, statistically significant associations were found between MYC amplification and HER2 amplification, positive LN status, and distant metastases. Moreover, they also revealed that MYC amplification was more frequently identified in grade III carcinomas, premenopausal women, and patients with negative PR status and positive ER status (Naab et al., 2018). These findings were not always consistent with those found in our study.
The above mentioned studies and TCGA cohort found that MYC amplification was associated with PR-negative and ER-positive status, while our cohort had the opposite trend, in which more patients with MYC amplification had ER-positive and PR-positive status. Numerous studies have demonstrated the critical role of estrogen in MYC gene expression and the association between MYC overexpression and resistance to endocrine therapy (McNeil et al., 2006; Chen et al., 2015); however, the clinical implications of HR status on MYC amplification remain controversial. Nabb et al. (2018) found that MYC amplification is more frequently identified in ER-positive tumors, which was consistent with our cohort and TCGA cohort.
Another meta-analysis found that MYC functions differently based on the tumor's ER status. It was found that MYC was associated with the expression of translational genes in ER-positive tumors, while in ER-negative tumors, it was related to the upregulation of glucose metabolism genes (Green et al., 2016). In addition to HR status, Naab et al. (2018) also revealed a significant association between MYC amplification and HER2 amplification in BRCA. This was consistent with the results of a previous study which revealed coamplification of MYC and HER2 (Kwak et al., 2017). In terms of molecular subtype, our findings revealed an association between molecular subtype and MYC amplification.
Notably, we found that patients in TCGA cohort with either TNBC or HR+/HER2+ tumors harboring MYC amplification had significantly inferior OS. However, more research is needed to reveal how MYC interacts with the ER, PR, and HER2 signaling pathway. In addition, we also found that MYC amplification was more frequent in tumors with high proliferative index/Ki67 level. High Ki67 index has been identified as one of the predictors of high chromosomal instability (Lee et al., 2019b). However, only a few studies have investigated the association between MYC and Ki67 (Münzel et al., 1991).
Our study has several limitations. First, a larger sample size might be more sufficient to draw more convincing conclusions; second, the lack of treatment and survival outcome information in the GDPH cohort. Third, the definitions of some molecular biomarkers had changed from the time TCGA data were collected to when our data were collected. Most notably, the cutoff for HR status has changed from 10% to 1%. To make the two cohorts comparable, we chose 10% as the final definition. Finally, our data only included genomic profiling data and did not investigate the MYC protein expression and the gene and protein expression analysis of the rare MYC translocations and missense mutation. Further research with a larger sample size is necessary to further elucidate the clinical and survival implications of MYC amplifications.
Conclusion
In conclusion, this study found that MYC-amplified breast tumors had distinct clinicopathological characteristics and molecular profile. Our findings add to the growing knowledge that MYC amplification is associated with aggressive phenotype of BRCA. This aggressive phenotype and complex biology of MYC-amplified breast tumors might be associated with the intratumor genetic complexity and genomic instability resulting from simultaneous deregulation of multiple signaling pathways, which could potentially result in clinical resistance to certain therapeutic regimens.
Footnotes
Authors' Contributions
The study was carried out in collaboration between all authors. L.C., C.Y.R., and N.L. carried out the patient selection and clinical sample collection. L.C., C.Y.R., N.L., G.C.Z., X.R.L., C.F.L., H.P.M., Y.L.W., B.C., L.Z.W., M.H.J, G.N.W, J.L.L., and N.L. performed the data analysis and article writing. L.C., C.Y.R., and N.L. discussed, wrote, and revised the article. All authors have contributed, read, and approved the final article.
Acknowledgments
The authors thank TCGA project organizers for research efforts and for sharing their data, as well as all the participants in the present study. The authors also extend their appreciation to the staff of Burning Rock Biotech, particularly Drs. Analyn Lizaso, Dailin Sun, Ting Hou, Zhou Zhang, Junjun Li, and Jing Liu for their active support.
Disclosure Statement
No competing financial interests exist.
Funding Information
This work was supported by funds from the National Natural Science Foundation of China (grant number 81902828 to Bo Chen; and 82002928 to Jianguo Lai). The funding bodies have no role in the design of the study, the collection, analysis, and interpretation of data, article writing, and the decision to submit the article for publication.