




Abstract
Hair follicle stem cells (HFSCs) play a significant role in hair development. miR-1 has been reported as an important regulatory factor that affects hair follicle growth and development, but its regulatory mechanism on HFSC development remains unknown. In this study, the molecular mechanism of miR-1 in regulating HFSC proliferation and differentiation was investigated. High-throughput RNA-seq and integrated analysis were performed to identify differentially transcribed mRNAs and microRNAs (miRNAs) in HFSCs co-cultured with dermal papilla cells (named dHFSCs) and control HFSCs. We then determined the molecular function of miR-1 in HFSCs. Compared with HFSCs, 13 differentially transcribed miRNAs were identified in dHFSCs. The in vitro results indicated that the overtranscription of miR-1 inhibited HFSC proliferation, but enhanced HFSC differentiation by targeting IGF1R and LEF1 genes. This study provides new insights into the molecular mechanisms of HFSC development. Approval ID (2014ZX08008-002).
Introduction
Hair follicle stem cells (HFSCs) (Yang and Peng, 2010; Ojeh et al., 2015; Du et al., 2018a) are a type of adult stem cells located in the bulge region of HFs, and they have ability to self-renew and differentiate multi-directionally (Hoffman, 2006; Elaine, 2007; Cédric and Elaine, 2014; Shen et al., 2017). Dermal papilla cells (DPCs) are located at the base of HFs, and they play a leading role in regulating HF development and cyclical growth (Driskell et al., 2011; Madaan et al., 2018). During the telogen (resting) phase, when the number of matrix cells decreases owing to apoptosis, DPCs release molecular signals to activate the differentiation of HFSCs and promote the regeneration of HFs (Reynolds et al., 1991; Zhang et al., 2016).
Previous studies have reported a co-culture system of HFSCs with DPCs (Zhang et al., 2013; Yan et al., 2019), but the molecular mechanisms of HFSC development and the related signaling pathways remain to be fully understood.
MicroRNAs (miRNAs) are small molecules that regulate cell organogenesis, apoptosis, proliferation, and differentiation (Mardaryev et al., 2010; Ahmed et al., 2014; Li et al., 2019). In previous studies, miRNAs have been reported in regulating the proliferation and differentiation of HFSCs (Xuejuan et al., 2013; Du et al., 2018a); for example, the differentiation of HFSCs was promoted by miR-21 (Cai et al., 2018) and miR-203a-3p (Luo et al., 2020). miR-1 has been considered as an important regulatory factor that affects the growth and development of HF (Yuan et al., 2013; Zhou et al., 2018; Yan et al., 2019). However, the mechanism of miR-1 in regulating the development of HFSCs requires further clarification.
Thus, we aimed to elucidate the molecular mechanism of miR-1 in regulating the proliferation and differentiation of HFSC. In this study, HFSCs co-cultured with DPCs (dHFSCs) and control HFSCs were used as experimental materials and subjected to high-throughput RNA-seq. Integrative analysis was then carried out to determine the differentially transcribed miRNAs and their target genes. We also identified the target genes of miR-1. Our findings will provide a deeper insight into the molecular mechanism underlying the development of HFSCs.
Materials and Methods
Animals and cell culture
All studies were performed in accordance with the guidelines of the Northwest A&F University, Yangling, China (approval ID: 2014ZX08008-002).
The HFSC line was established and cultured as described previously (Yan et al., 2019). HFSCs were cultured in Dulbecco's modified Eagle's medium (DMEM)/F12 medium supplemented with 10% fetal bovine serum, 1% penicillin–streptomycin, 10 ng/mL insulin, 10 ng/mL epidermal growth factor, and 0.4 μg/mL hydrocortisone in 5% CO2 at 37°C. The medium was replaced every 2 days.
HFSCs and DPCs were co-cultured in DMEM/F12 medium in Transwell chambers (Yan et al., 2019). DPCs were isolated from Shaanbei White Cashmere goats in our laboratory (He et al., 2016; Zhou et al., 2017; Yan et al., 2019).
RNA-seq analysis
For mRNA and small RNA libraries construction, total RNA was extracted from dHFSCs and HFSCs (each group had three biological replicates) using an Eastep® Super Total RNA Extraction Kit (Promega, Shanghai, China) following the manufacturer's instructions. RNA was analyzed using a 2100 Bioanalyzer (Agilent Technologies) and sequenced on a HiSeq 2500 platform (Illumina).
mRNA libraries were constructed according to previous studies (Gao et al., 2016). After sequencing, the raw data contained a number of connectors, low-quality reads, so Cutadapt (Martin, 2011) was used to filter the raw reads to get clean data for further analysis. Then the clean data were mapped to the latest goat reference genome (GCF_001704415.1_ARS1_genomic.fna) using TopHat2 (Kim et al., 2013). The mismatch was no more than 2.
Small RNA library were constructed as previous studies (Du et al., 2018b); after sequencing, the data containing poly-N, 5′ adapter contaminants, poly A, T, G or C, reads without 3′ adapter or insert tag, low-quality reads were cleaned using Cutadapt (Martin, 2011; Yan et al., 2019), then the sequence of 20–25 nt would be reserved, which covered the main length of mature miRNA. After this, the data were mapped to the latest goat reference genome (GCF_001704415.1_ARS1_genomic.fna) using Bowtie (Langmead et al., 2009). The mapped reads were obtained using miRBase (Griffiths-Jones et al., 2008) as a reference. miREvo (Wen et al., 2012) and mirdeep2 (Friedländer et al., 2012) were used to predict novel miRNAs based on their secondary structures and Dicer cleavage sites.
mRNA transcription was estimated using fragments per kilobase of exon model per million mapped reads (Marioni et al., 2008). For miRNAs, the data were normalized as transcripts per million (Zhou et al., 2010).
DESeq R package (Love et al., 2014) was used to analyze the differential transcriptions of mRNAs and miRNAs in dHFSCs and HFSCs. A |log2 (fold change)| >1 and adjusted p < 0.05 were used as the threshold cutoffs to screen significantly differentially transcribed genes and miRNAs.
We used GOseq (Young et al., 2010) to perform Gene Ontology (GO) analysis. KO-Based Annotation System (Mao et al., 2005) was used to assess the enrichment of DE genes or miRNA target genes in the Kyoto Encyclopedia of Genes and Genomes (KEGG) pathways. A process or pathway with p-value <0.05 was considered to be significantly enriched.
Integrated analysis of differentially transcribed mRNA–miRNAs networking between HFSCs and dHFSCs
Integrated analysis of differentially transcribed mRNA (DE mRNA)–miRNA networking was performed as previously described (Zhou et al., 2018). Based on the mRNA and miRNA libraries analysis results, we screened the target genes of differentially transcribed miRNAs (DE miRNAs). The target genes that were differently transcribed in mRNA libraries were selected for further research.
Cell transfection
miR-1 mimics and negative control (NC) were synthesized by GenePharma (Shanghai, China). The sequence of miR-1 mimic was as follows: uggaauguaaagaaguauguau. miR-1 mimics or NC were transfected into HFSCs using Lipofectamine 3000 (Invitrogen, Carlsbad, CA), following the manufacturer's instructions. After 48 h, transfected HFSCs were collected for further analysis.
Cell proliferation assay
HFSCs transfected with miR-1 mimics or NC were collected for cell proliferation assays. Cell proliferation was examined by using a cell counting kit-8 (Dojindo Molecular Technologies, Inc., Kumamoto, Japan) and EdU cell proliferation kit (Thermo Fisher Scientific), following the manufacturers' protocols.
For cell cycle analysis, HFSCs transfected with miR-1 mimics or NC were fixed with ice-cold 70% ethanol and stained with propidium iodide and RNase solution (550825; BD Pharmingen). The cells were analyzed by using a FACScan flow cytometer (Becton Dickinson) equipped with a 488-nm excitation laser using the CellQuest Pro software (Becton Dickinson).
Quantitative real-time PCR
To validate the accuracy of RNA-seq analysis results, total RNA was extracted from dHFSCs and HFSCs as described previously, and cDNA was synthesized by using a cDNA Synthesis Kit (Thermo Fisher Scientific). Six DE genes, CREB5, KLF4, PTGS2, ID1, SPP1, and DLX5, were selected randomly, with the housekeeping gene β-actin used as an endogenous control. Six DE miRNAs (miR-1, miR-504, miR-455-5p, miR-660, miR-100-5p, and miR-182) were also selected randomly for quantitative real-time (RT) PCR. U6 was used as an endogenous control.
To confirm the effect of miR-1 on HFSCs, total RNA was isolated from HFSCs transfected with miR-1 mimics and NC, and cDNA was synthesized. The relative transcriptions of the cell proliferation marker genes (KI67, PCNA, AKT, and mTOR), the differentiation marker genes (K6, S100A3, Notch1, and β-catenin) were detected.
The qRT-PCR was performed on a CEX96 Touch Real-time PCR Detection System (Bio-Rad) in a 20-μL reaction volume containing 10 μL of SYBR Premix Ex Taq II (Takara, China), 7 μL of water, 2 μL of cDNA samples, 0.5 μL of forward primer, and 0.5 μL of reverse primer. All primers used in this assay are listed in Supplementary Table S7.
Western blotting
HFSCs transfected with miR-1 mimics or NC were collected and lysed in 200 μL radio immunoprecipitation assay buffer containing 1 mM phenylmethylsulfonyl fluoride (Solarbio, China). The lysed cells were subjected to 12% sodium dodecyl sulfate–polyacrylamide gel electrophoresis gel in a running buffer. Next, the proteins were electrotransferred to polyvinylidene fluoride membranes (Roche, Switzerland). The membranes were blocked for 1 h at room temperature with 5% skim milk and incubated at 4°C overnight with the following primary antibodies: anti-K6, anti-S100A3, anti-Notch1, anti-β-catenin, and anti-PCNA rabbit polyclonal antibodies (Proteintech, China); anti-AKT rabbit polyclonal antibody (CST); anti-mTOR rabbit monoclonal antibody (BOSTER, China); and anti-β-actin (BOSTER).
The membranes were then incubated at room temperature for 1 h with secondary horseradish peroxidase-conjugated antibodies. After that, the membranes were detected using a chemiluminescence reagent (ECL, Millipore) and visualized with a fluorescence imaging system (Sagecreation). Subsequently, the images were analyzed by using the ImageJ software (Gallo-Oller et al., 2018).
Target gene prediction
RNAhybrid (Krüger and Rehmsmeier, 2006) and Pita prediction tools (version 7.0) (Kertesz et al., 2007) were used to predict the target genes of miR-1. FOXP1, IGF1R, SOX9, MSI2, LEF1, and FOXC1 were selected as miR-1 target genes.
Dual luciferase vector construction
The 3′UTR of FOXP1, IGF1R, SOX9, MSI2, LEF1, and FOXC1 genes were amplified from Shaanbei White Cashmere goat cDNA (cDNA synthesis method was described previously) and verified by Sanger sequencing. Fragments were cloned into the psiCheck2 vector, which was digested with XhoI and NotI. A site-directed mutagenesis kit (TaKaRa, Dalian, China) was used to generate the mutant vectors, following the manufacturer's instructions. All mutants were verified by sequencing. All primers used in this assay are given in Supplementary Tables S8 and S9.
Dual luciferase reporter assays
HFSCs transfected with FOXP1, IGF1R, SOX9, MSI2, LEF1, and FOXC1 dual luciferase reporter vectors and mutant vectors were lysed using cell lysis buffer. After 48 h, firefly and Renilla luciferase activities were detected by using a Dual Luciferase Reporter Gene Assay Kit (Promega, Madison) according to the manufacturer's protocol. Relative luciferase activity indicated the ratio of firefly luciferase to Renilla luciferase activities.
Statistical analysis
Data were presented as the mean ± standard error of the mean. All results were analyzed using Microsoft Excel. The means were compared using t-tests, and statistical significance was set at p < 0.05.
Results
Identification of mRNAs and miRNAs in HFSCs and dHFSCs
For mRNA libraries, an average of 25,245,466.83 raw reads were produced per sample. After filtration, 24,123,618 clean reads were obtained, which formed 3.62 G clean bases per sample. For miRNA libraries, an average of 18,427,949.5 raw reads were produced per sample, and 17,654,735.7 clean reads were obtained after filtration, which formed 0.921 G clean bases for each sample. The clean reads were classified and mapped to the latest goat reference genome (GCF_001704415.1_ARS1_genomic.fna). The sequencing data for each sample are summarized in Supplementary Tables S1 and S2.
More than 94% of the clean reads were mapped to the reference genome in both the mRNA and miRNA datasets (Supplementary Tables S3 and S4). The correlation of triple biological replicates was up to 0.98 (r 2 ≥ 0.982) (Supplementary Fig. S1). All these data showed that the samples had sufficient reproducibility and rationality; therefore, all of them were used for further analysis of mRNA and miRNA transcription profiles.
Transcriptional profiles of mRNAs and miRNAs HFSCs and dHFSCs
We identified 357 known miRNAs and 203 novel miRNAs (Supplementary Table S3). There were 12,802 co-transcribed genes and 656 DE genes (342 upregulated genes and 314 downregulated genes in dHFSCs compared with HFSCs) (Supplementary Table S5). The top 20 most significantly DE genes are given in Table 1 and Figure 1. A total of 403 co-transcribed miRNAs (Supplementary Table S6) and 13 DE miRNAs (6 upregulated and 7 downregulated in dHFSCs) (Table 2, Fig. 2) were detected.
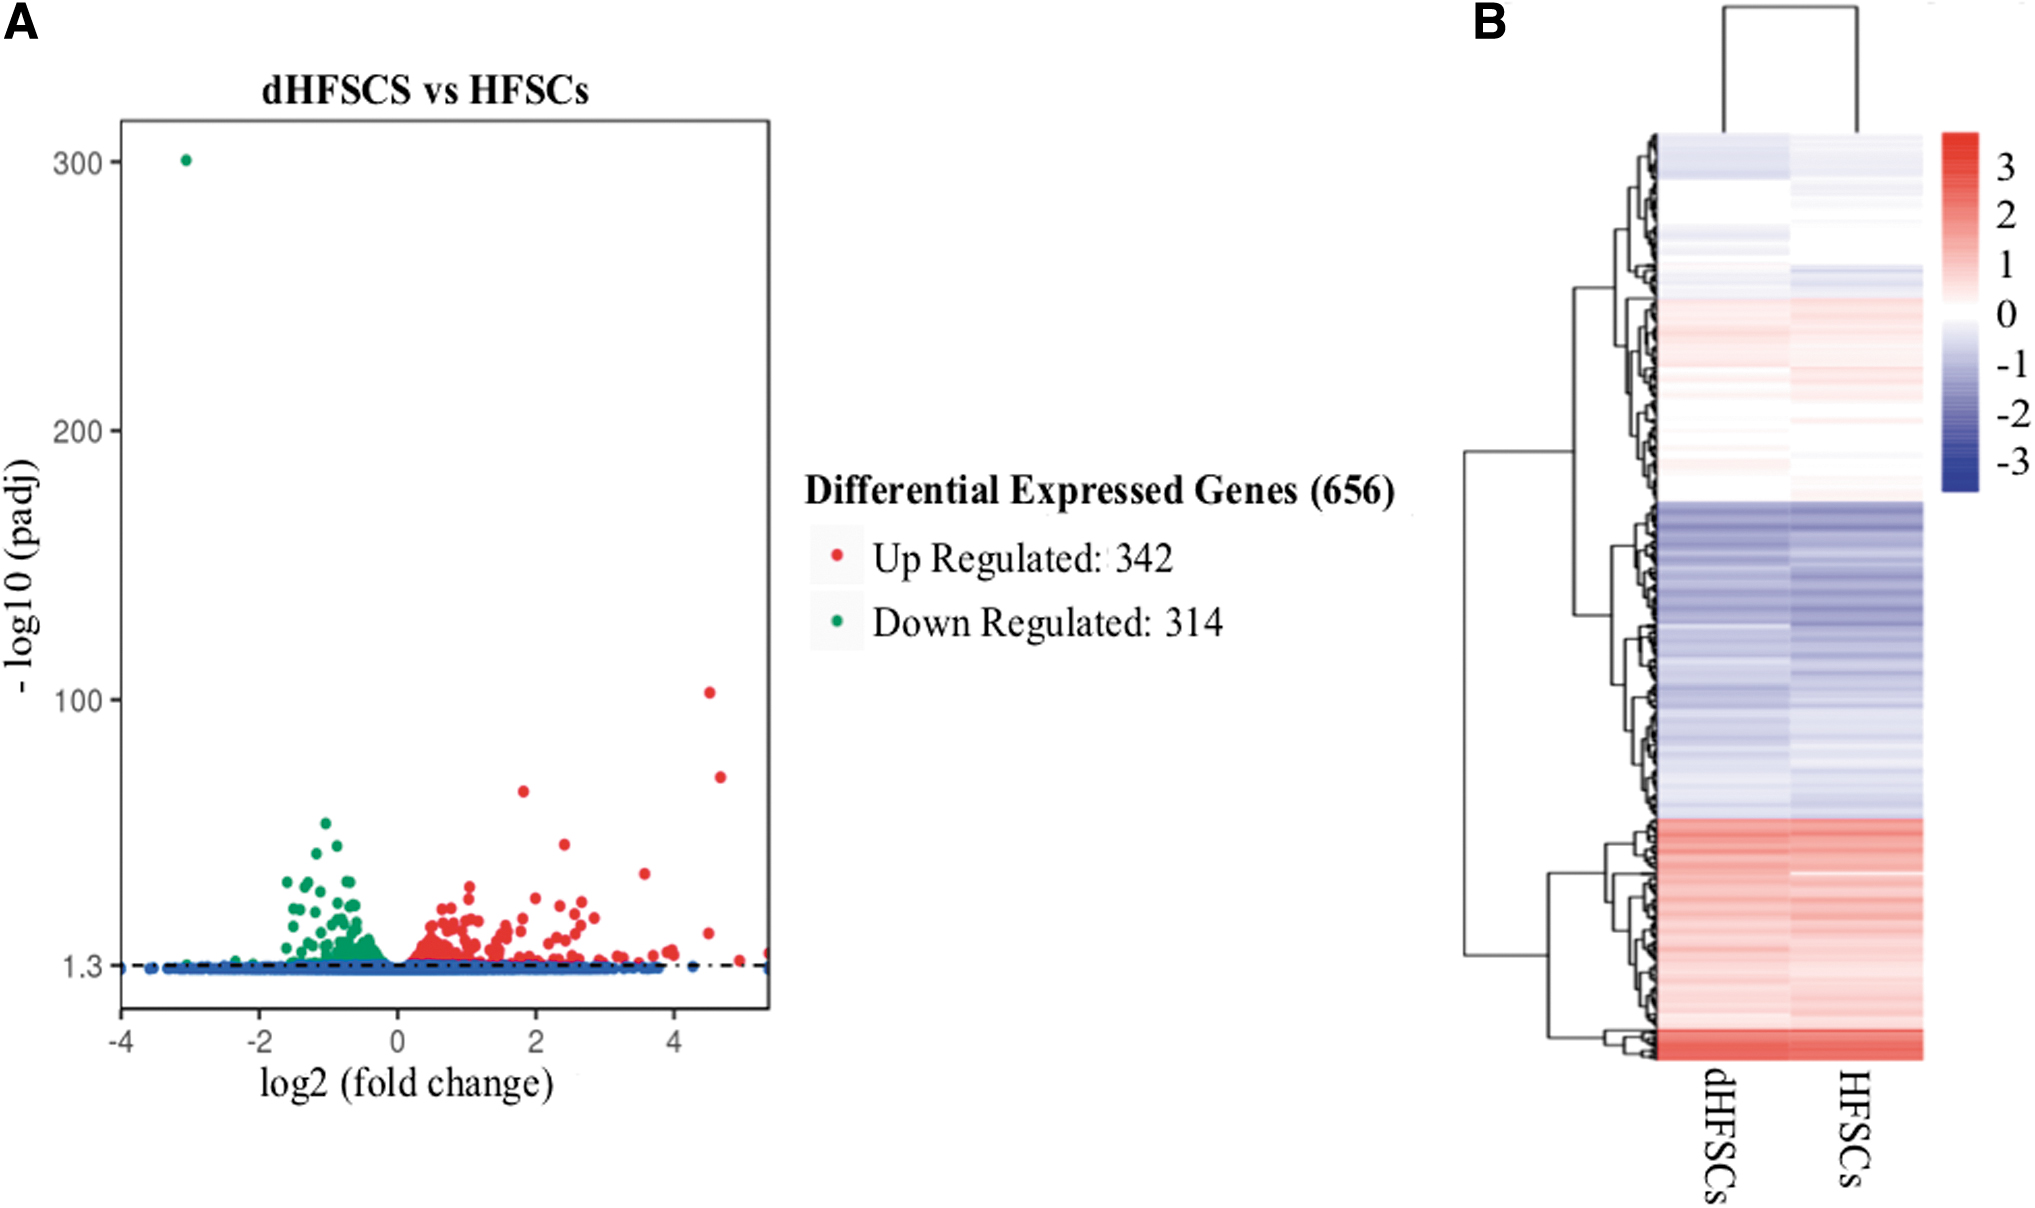
Transcriptional profiles in HFSCs.
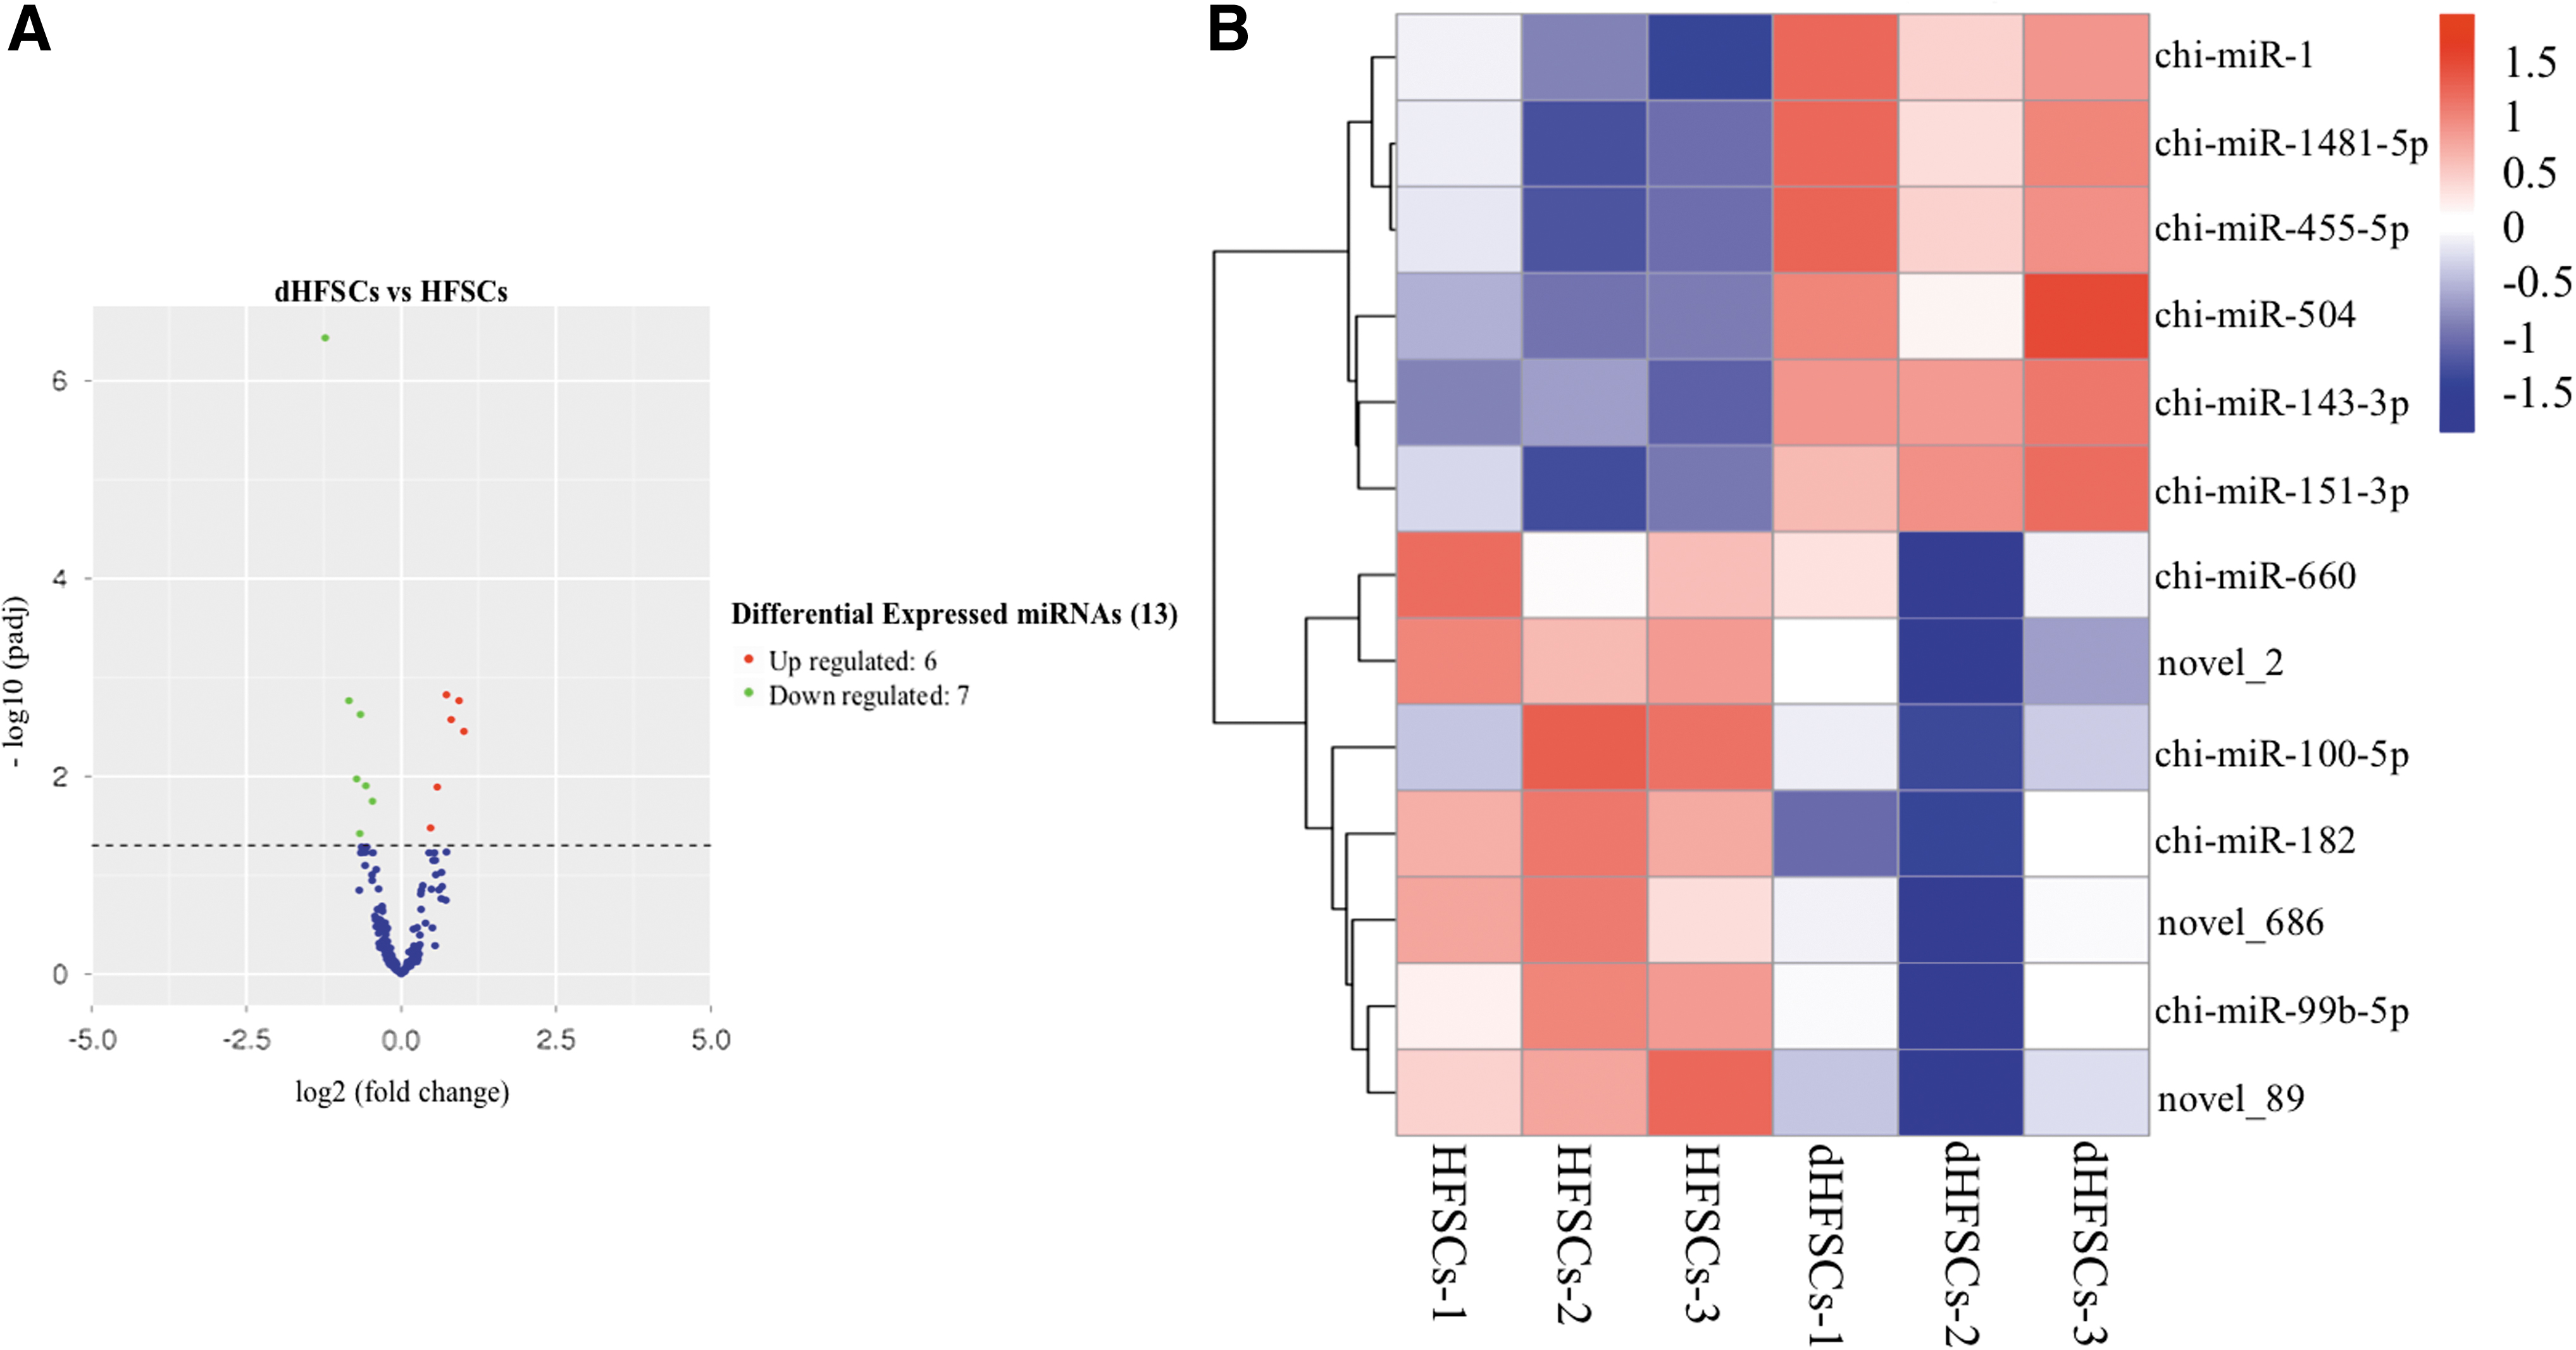
miRNA transcriptional profiles in HFSCs.
Top 20 Most Significantly Differentially Transcribed Genes
dHFSCs, co-cultured HFSCs with DPCs; HFSCs, hair follicle stem cells.
Top 13 Most Significantly Differentially Transcribed MicroRNAs
To validate the accuracy of the RNA-seq results, six DE genes (CREB5, KLF4, PTGS2, ID1, SPP1, and DLX5) and six DE miRNAs (miR-1, miR-504, miR-455-5p, miR-660, miR-100-5p, and miR-182) were subjected to qRT-PCR. The results were consistent with the RNA-seq data (Fig. 3).
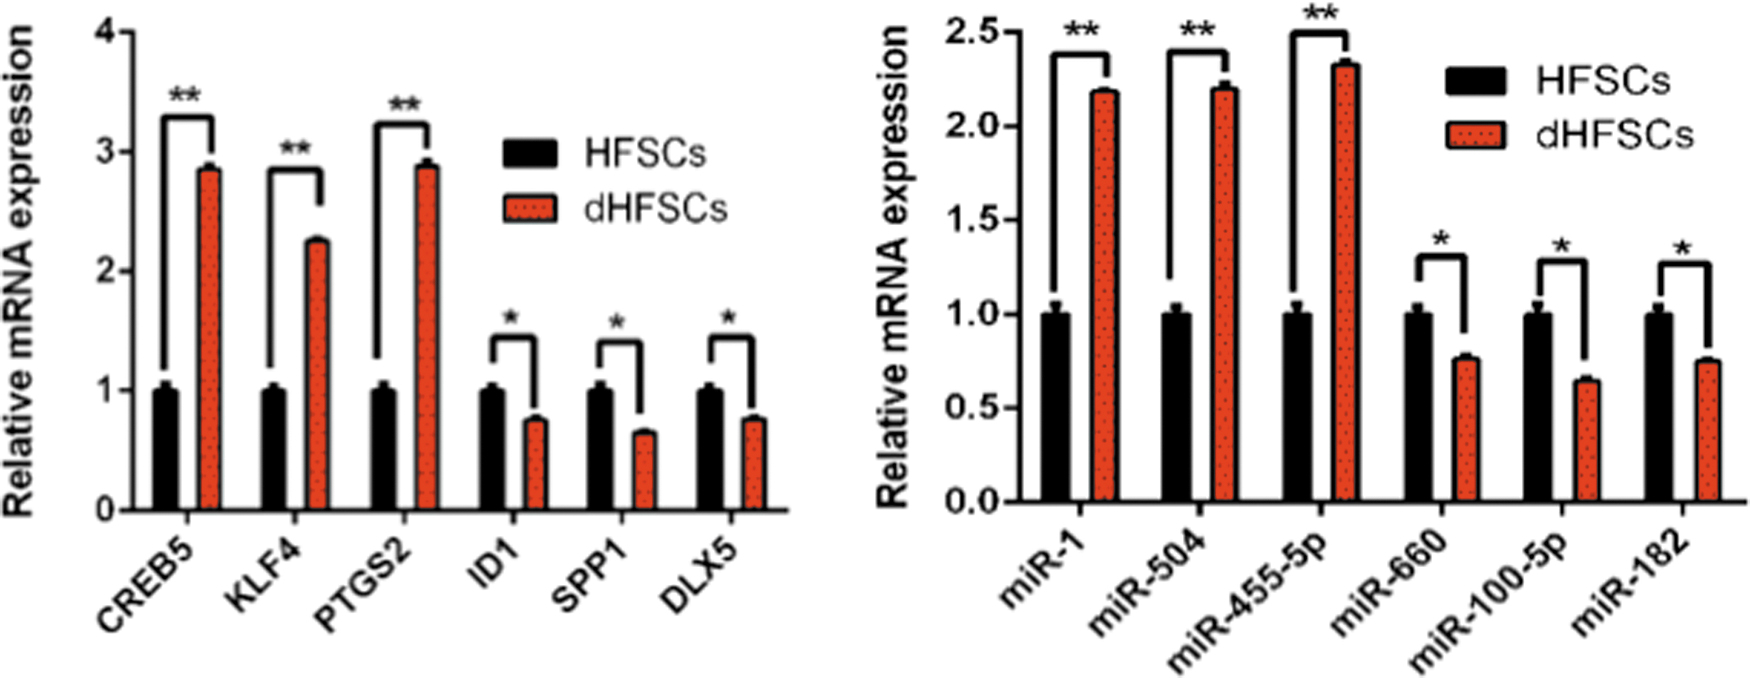
qPCR validation of RNA-seq. qPCR results of six differently transcribed genes and six differently transcribed miRNAs. *p < 0.05, **p < 0.01. qPCR, quantitative PCR. Color images are available online.
GO and KEGG pathway enrichment analyses of DE mRNAs and miRNAs
GO and KEGG enrichment analyses were performed to further validate the functions of the DE mRNAs and miRNAs. GO enrichment was divided into three categories: biological process (BP), cellular component (CC), and molecular function (MF). The most significantly enriched BP term was proteolysis. Among CC terms, the cation transport extracellular region was significantly enriched. Finally, among MF terms, insulin-like growth factor binding and growth factor binding were enriched significantly (Fig. 4A).
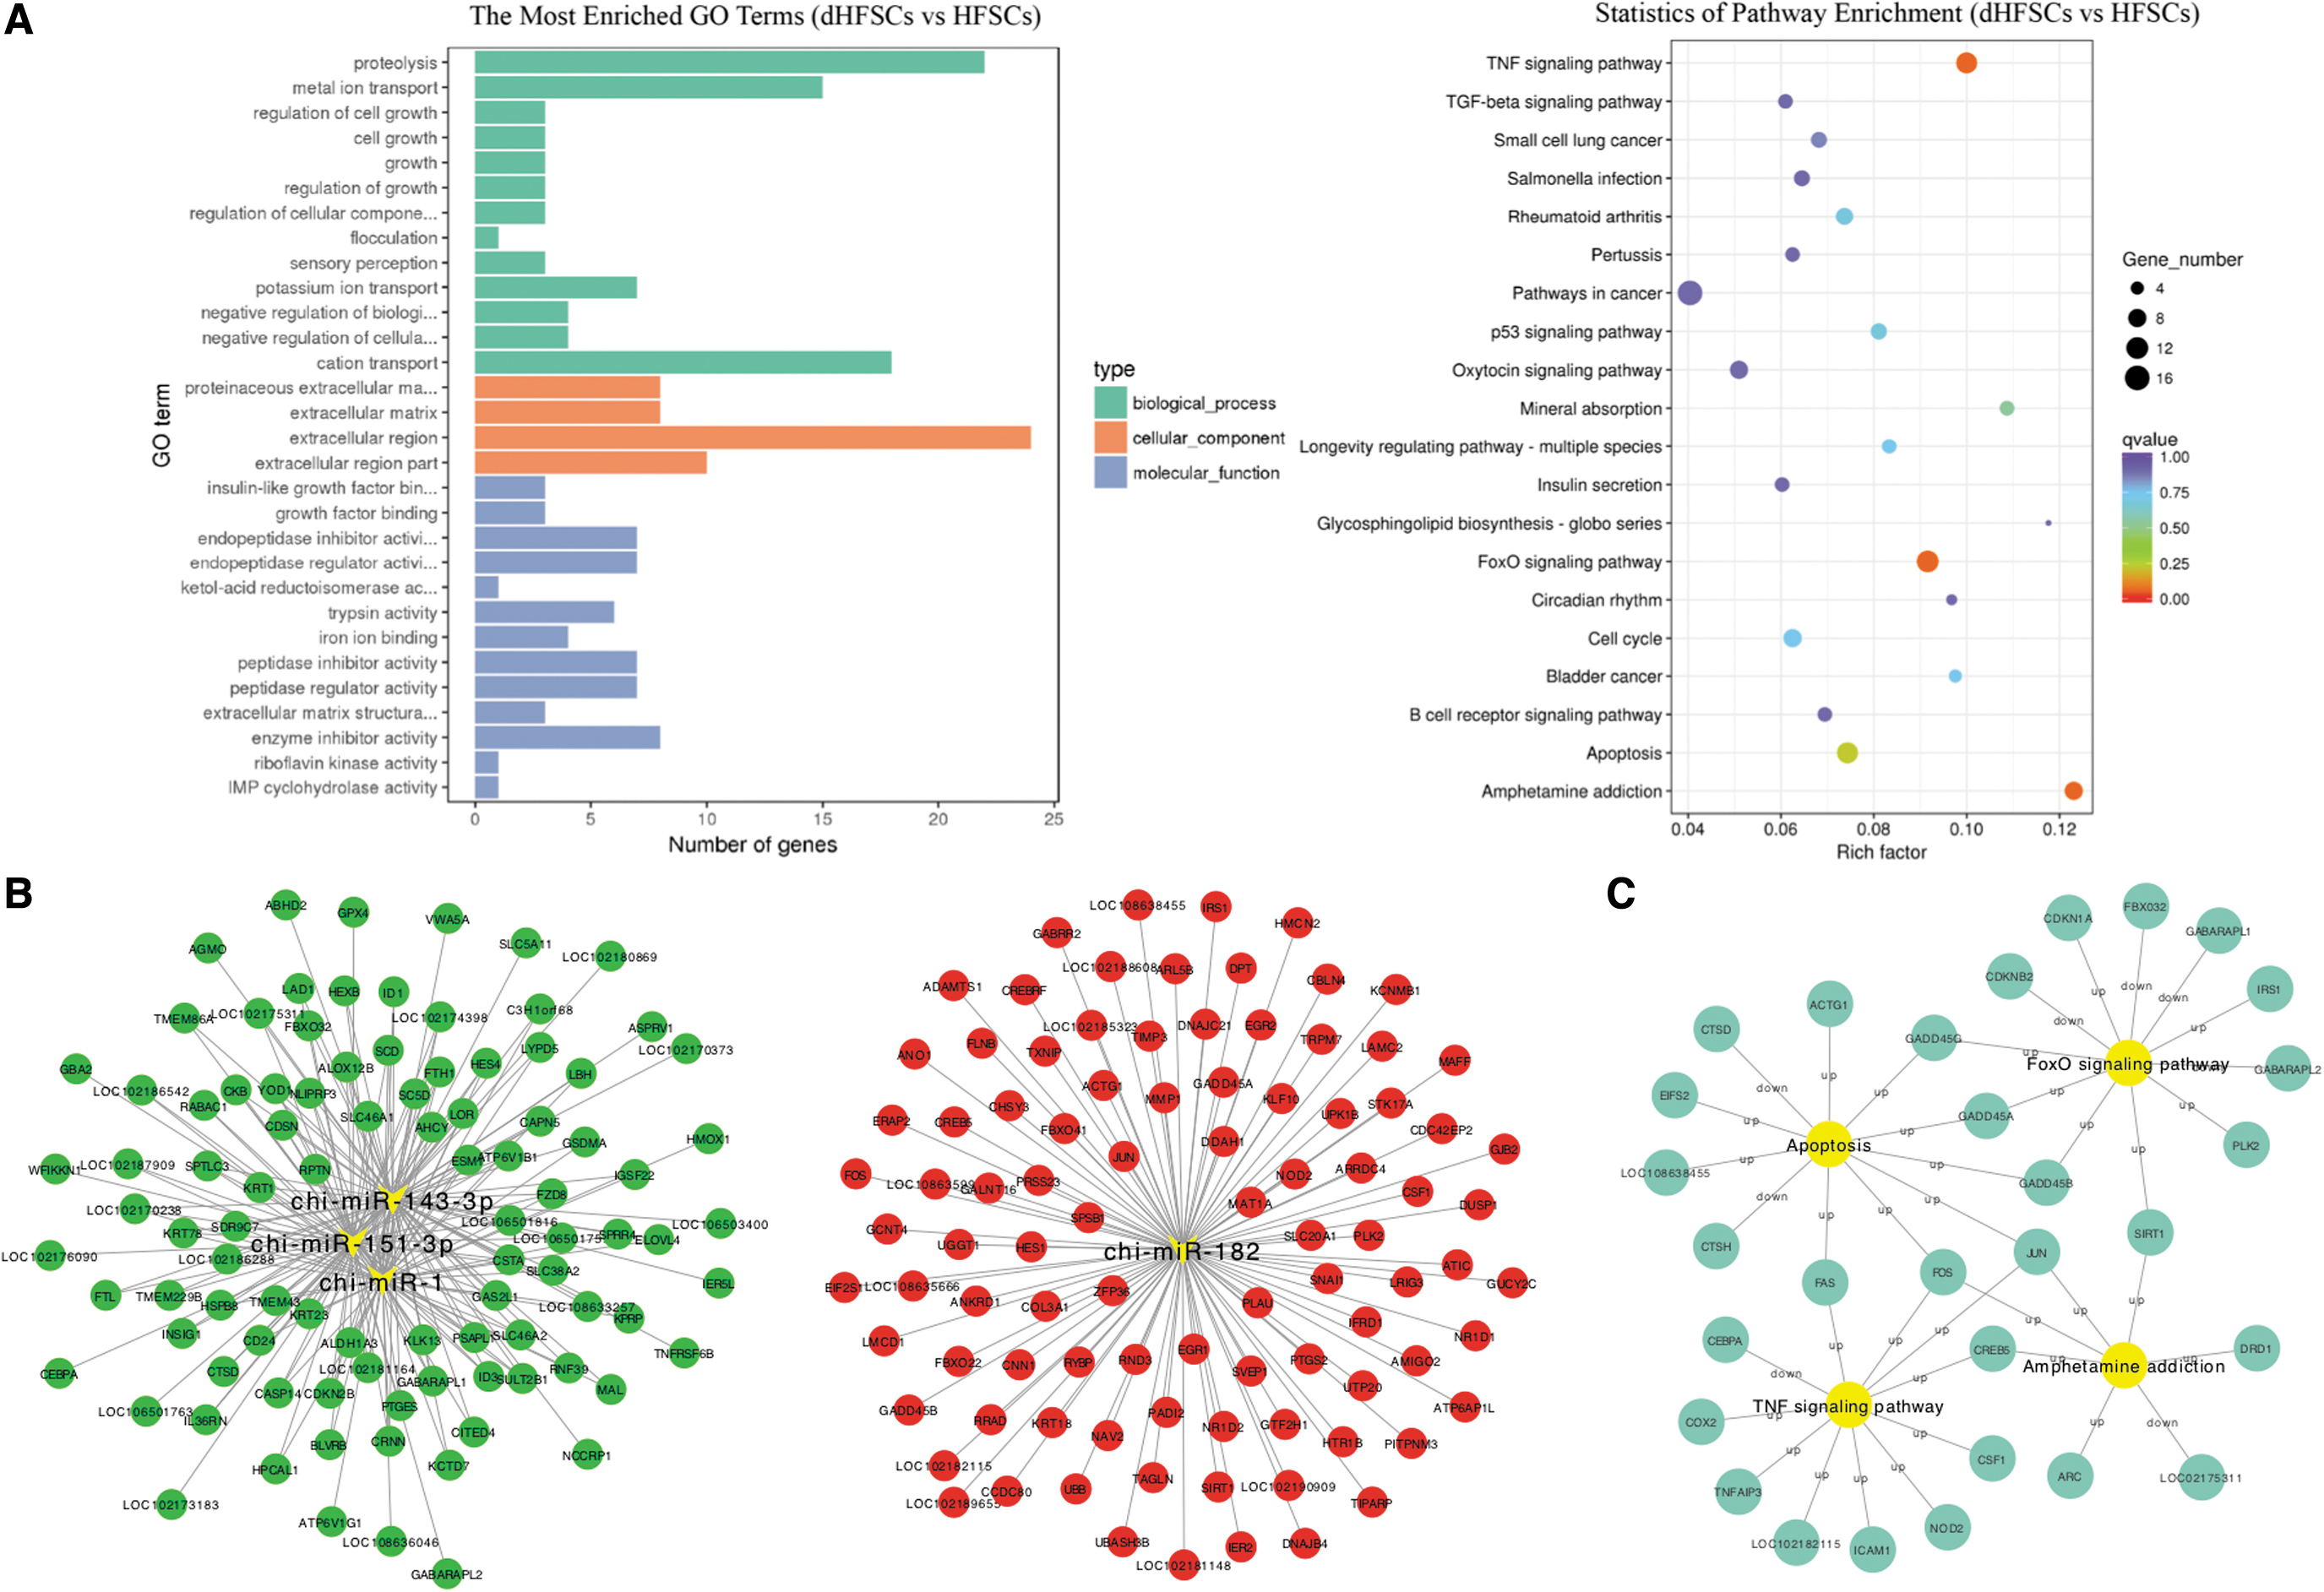
Integrated co-transcription and co-localization network analysis of DE mRNAs and miRNAs.
KEGG enrichment analysis was based on the richness factor of filtration, Q-values, and the number of genes. The most enriched pathways were the TNF signaling pathway, FoxO signaling pathway, amphetamine addiction, and apoptosis (Fig. 4A, Table 3). A total of 138 DE genes involved in the top 20 signaling pathways were identified. Among these, 30 DE genes (22 upregulated and 8 downregulated genes in dHFSCs), which were the most enriched genes in the top three signaling pathways, were selected to determine the most important pathways that affect the proliferation and differentiation of HFSCs.
Top 20 Most Enriched Pathways of Conjoint Analysis
TGF, transforming growth factor; TNF, tumor necrosis factor.
The 22 upregulated genes were NOD2, CREB5, TNFAIP3, CSF1, FAS, JUN, CXCL1 (LOC102182115), FOS, ICAM1, PTGS2, COX2, PLK2, SIRT1, GADD45B, GADD45G, IRS1, CDKN1A, GADD45A, ARC, EIF2S1, LOC108638455, and ACTG1. The eight downregulated genes were CEBPA, GABARAPL2, CDKN2B, FBX032, GABARAPL1, LOC102175311, CTSD, and CTSH.
In the TNF signaling pathway, the transcriptions of NOD2, TNFAIP3, and CXCL1 was significantly increased. It has been reported (Williams et al., 2017) that skin healing rate was affected in NOD2 knockout rats. Moreover, a significant increase in the transcription of CXCL1 was observed in injured rat and human skin tissue (He et al., 2018), whereas knockout of TNFAIP3 exacerbated inflammatory skin in mice (Devos et al., 2018). These previous studies indicate that the CXCL1 and TNFAIP3 genes are closely related to skin growth and development.
The FoxO signaling pathway participates in cell apoptosis, cell cycle regulation, intracellular glucose metabolism, oxidative stress, and various cellular physiological processes. Integrated analysis revealed that the transcription levels of SIRT1 and PLK2 were significantly increased. The network regulation of genes involved in these pathways is given in Figure 4C.
Networking between DE mRNAs and miRNAs in HFSCs and dHFSCs
To explore which DE miRNAs were involved in the proliferation and differentiation of HFSCs, we performed an analysis of DE mRNA–miRNA networking between HFSCs and dHFSCs. We found that in the presence of DPCs, miR-1, miR-151-3p, and miR-143-3p were upregulated, whereas miR-182 was downregulated. Therefore, we constructed miRNA–mRNA networks with these four miRNAs as the centers and corresponding mRNAs as the targets (Fig. 4B). We divided the mRNA–miRNA networks based on the expression patterns of upregulated and downregulated genes (Fig. 4B). The results showed that miR-1, miR-151-3p, and miR-143-3p could downregulate the target genes, whereas miR-182 could upregulate its target genes to regulate HFSC development.
miR-1 inhibited the proliferation but enhanced the differentiation of HFSCs by targeting IGF1R and LEF1 genes
It was clear that miR-1 transcription was significantly increased in dHFSCs compared with that in HFSCs. This is consistent with a previous report that miR-1 participates in HF development (Zhou et al., 2018). Cell proliferation assay results showed that after transfection with miR-1 mimics, the proliferation of HFSCs was significantly reduced (p < 0.01) compared with that of the cells transfected with NC (Fig. 5A, C). Cell cycle assay results showed that the overtranscription of miR-1 induced cell cycle arrest at the G0–G1 phase in HFSCs (Fig. 5B), suggesting the inhibitory effect of miR-1 on the proliferation of HFSCs.
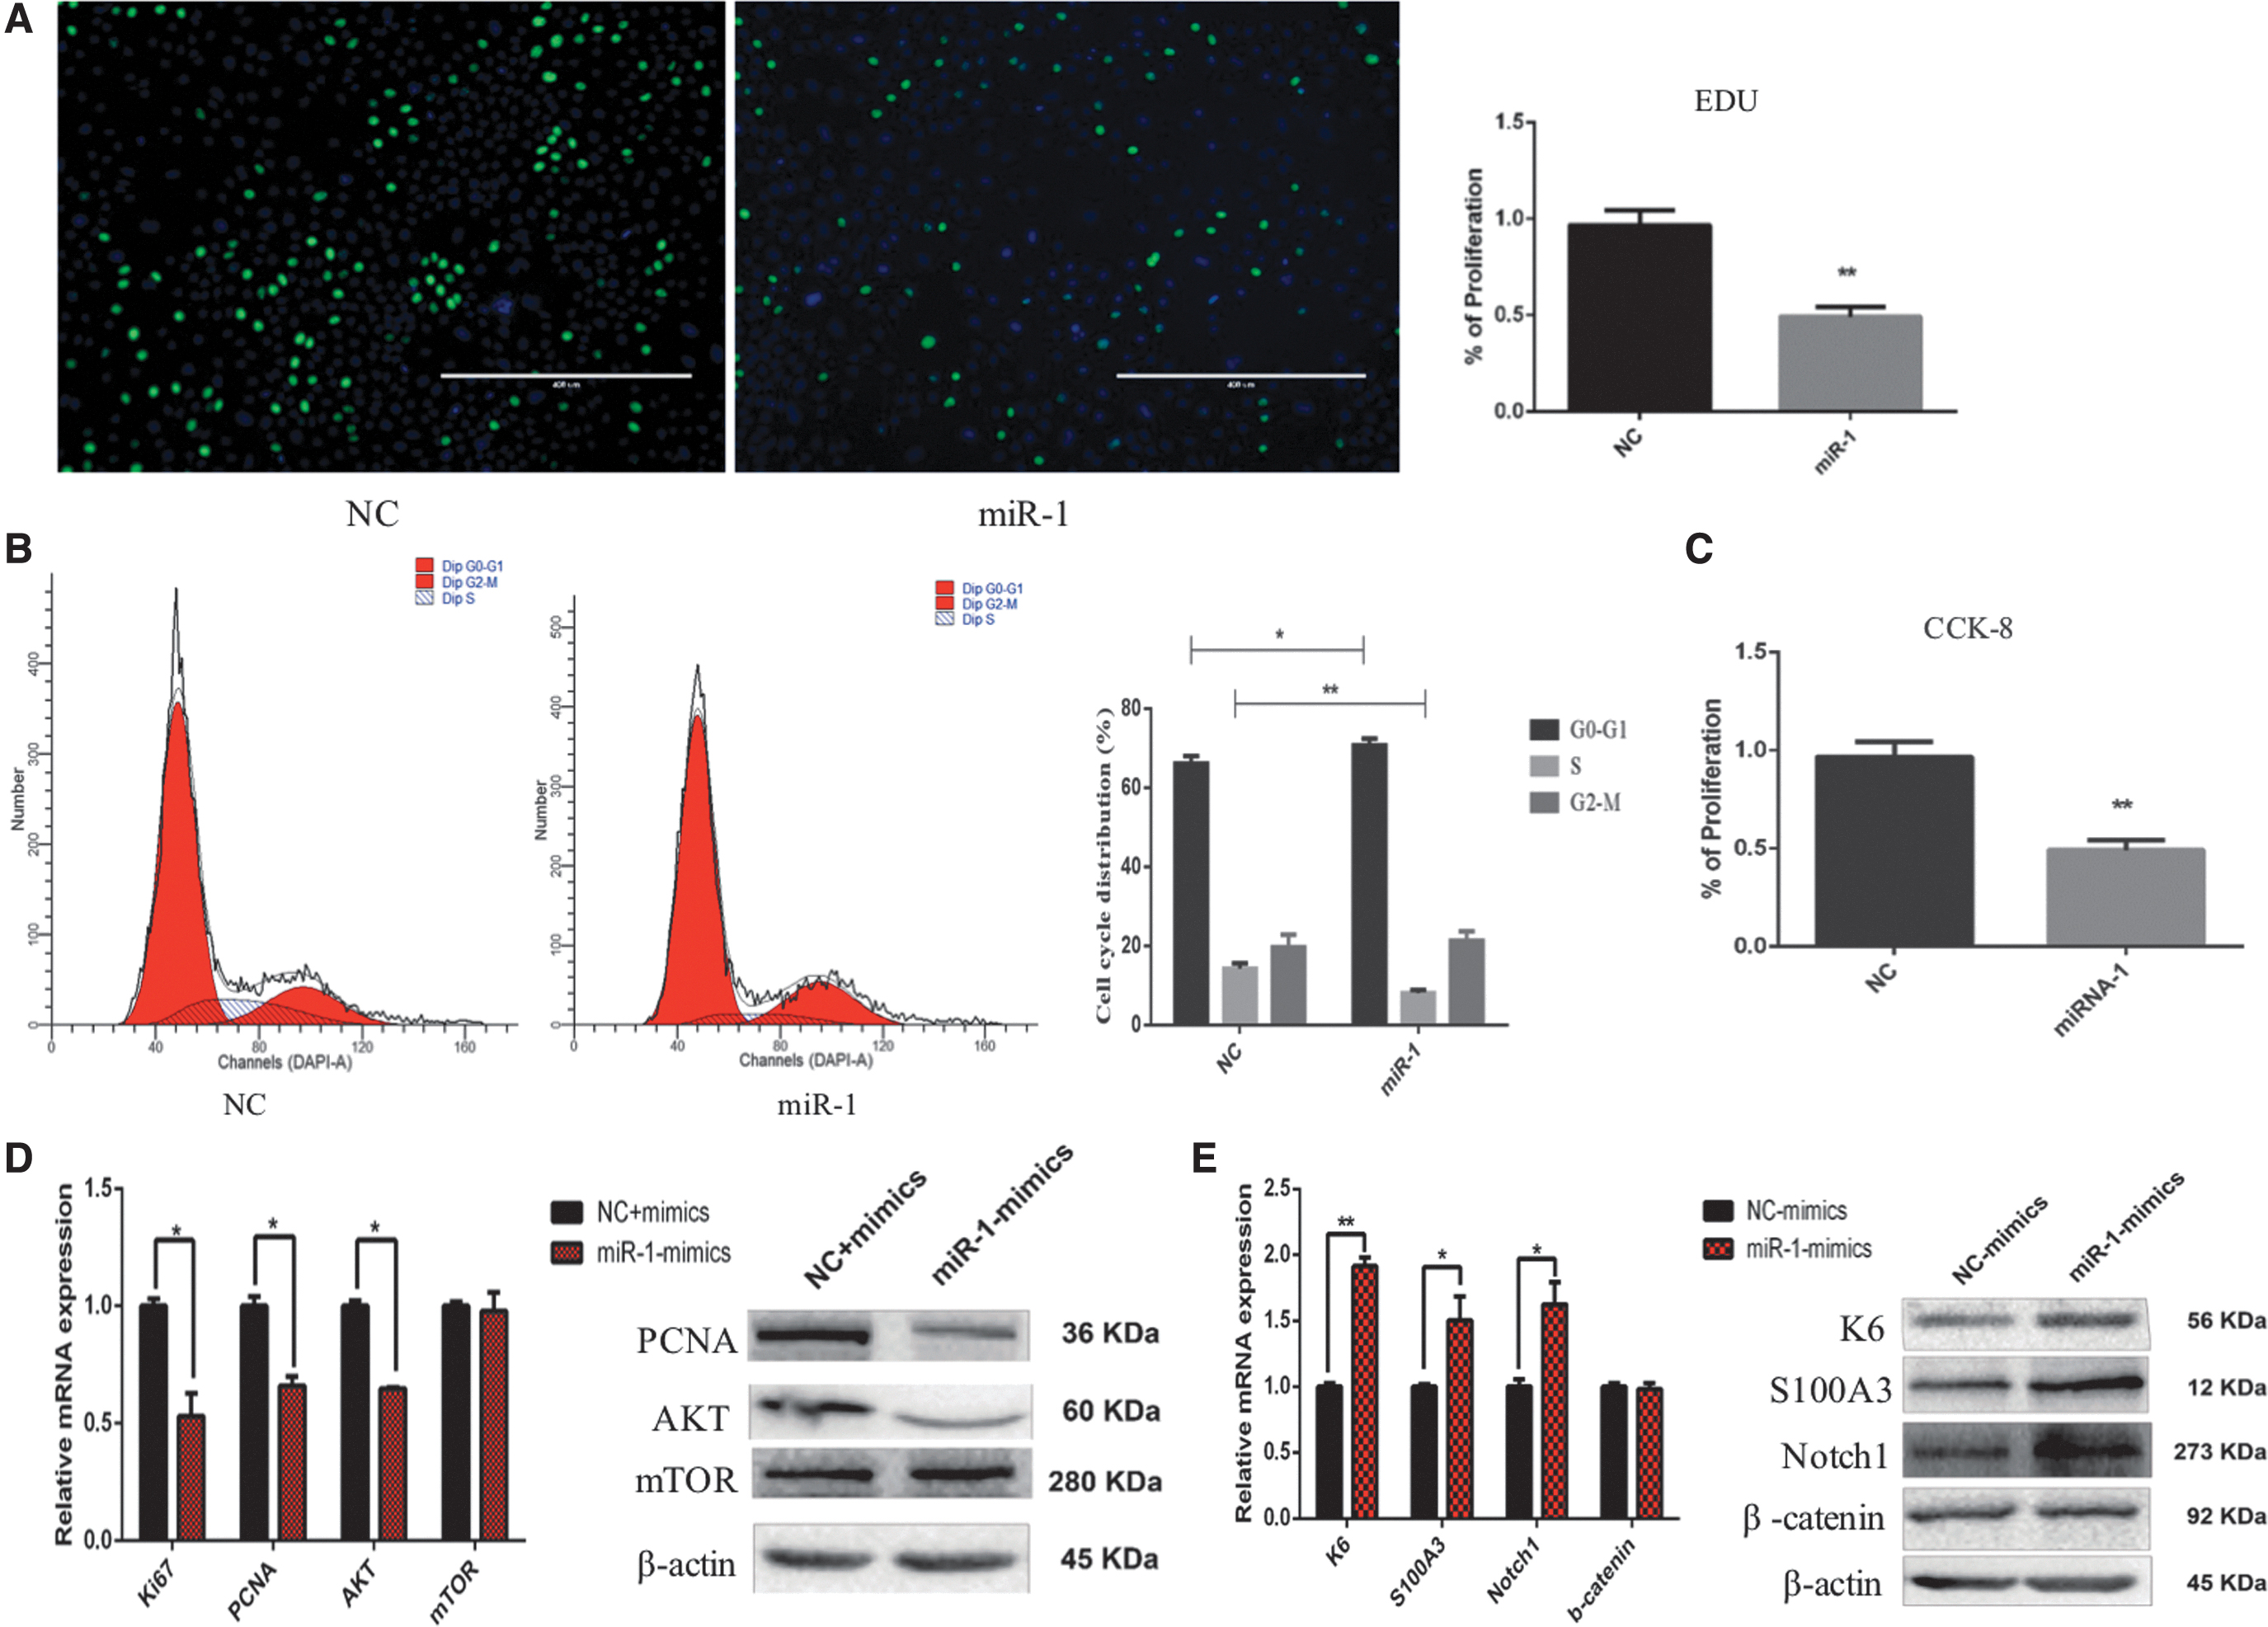
miR-1 inhibited the proliferation but enhanced the differentiation of HFSCs.
After being transfected by miR-1 mimics, the mRNA transcriptional and protein expressional levels of KI67, PCNA, and AKT were significantly lower in HFSCs (p < 0.01) than in NC (Fig. 5D). These results further showed that the overtranscription of miR-1 inhibited the expression of cell proliferation marker genes (KI67 and PCNA) by regulating the AKT signaling pathway. Moreover, after the overtranscription of miR-1 mimics, the mRNA transcriptional and protein expressional levels of K6, S100A3, and Notch1 were significantly higher in HFSCs than in NC (Fig. 5E). These results indicated that the overtranscription of miR-1 enhanced the expression of differentiation marker genes (K6 and S100A3) by activating the Notch1 signaling pathway to enhance the differentiation of HFSCs.
Based on the prediction of miR-1 target genes, we screened FOXP1, FOXC1, IGF1R, SOX9, MSI2, and LEF1 and further explored their molecular mechanisms of miR-1. A dual luciferase reporter assay was conducted to analyze their regulatory relationships. The luciferase activities of IGF1R and LEF1 were inhibited after transfection with miR-1 mimics. After the target gene binding sites were mutated (Supplementary Fig. S2), the luciferase activities of IGF1R and LEF1 were recovered. However, there was no interaction between miR-1 and FOXP1, FOXC1, SOX9, and MSI2 (Fig. 6). These results indicated that miR-1 regulated IGF1R and LEF1. Taken together, the results showed that miR-1 inhibited the proliferation but enhanced the differentiation of HFSCs by targeting IGF1R and LEF1 genes.

Dual fluorescein reporter assay. **p < 0.01.
Discussion
As the basis for the growth and development of animal coats, HFSCs serve as the best cell model for studying the mechanism and promotion of cashmere fiber growth (Tudorita et al., 2004; Paus and Foitzik, 2010; Kandyba and Kobielak, 2014). In this study, we investigated the regulatory mechanism of HFSC proliferation and differentiation in dHFSCs and control HFSCs. Based on the bioinformatics analysis, 13 DE miRNAs were identified. These 13 DE miRNAs showed differential transcriptions in the skin tissue samples of Shaanbei White Cashmere goats at different phases (anagen, catagen, and telogen) of follicle growth (Yuan et al., 2013; Zhou et al., 2018).
A previous study found that miRNA-143 was abundantly transcribed in ear tissues, whereas miR-1 and miR-455-3p were only transcribed in the skin tissues of Inner Mongolia Cashmere goats (Williams et al., 2017). In another study, mesenchymal stem cells were transplanted to tight-skin mice, and miR-151-5p was identified as a therapeutic target for systemic sclerosis (Chen et al., 2017). Moreover, miR-182-5p was highly transcribed in goat skin tissue, whereas miR-143-3p showed differential transcription in goats with different coat colors (Wu et al., 2014).
We found that miR-1 inhibited the proliferation but enhanced the differentiation of HFSCs by targeting LEF1 and IGF1R genes.
LEF1 is an important transcriptional factor that regulates HF patterning and stem cell fate through the Wnt signaling pathway (Genderen et al., 1994; Zhou et al., 1995). LEF1 knockout led to a loss of vibrissal HFs and an arrest of dorsal HFs, whereas LEF1 activation induced de novo HF formation (Merrill et al., 2001; Zhang et al., 2013). The IGF signaling pathway is involved in cell proliferation, apoptosis, differentiation, survival, metabolism, and migration (Stewart and Rotwein, 1996). It also plays a critical role in HF development (Little et al., 2010). IGF1 and IGF1R are important transcriptional factors in the IGF signaling pathway, and IGF1R knockout mice show growth retardation (Liu et al., 1993), tissue and organ dysplasia, infertility, and even immediate death after birth (Pandini et al., 2007).
Therefore, according to the findings of this study, LEF1 and IGF1R genes determine HFSC-directed hair fate by regulating the Wnt and IGF signaling pathways, respectively. Our study revealed that the miR-1-LEF1 and miR-1-IGF1R axes may constitute new signaling pathways for regulating HFSC proliferation and differentiation.
Conclusions
This study provided new insights into the molecular mechanisms driving the development of HFSCs. We performed integrated analysis of mRNAs and miRNAs and investigated the potential regulatory mechanisms underlying HFSC proliferation and differentiation. Thirteen miRNAs showed differential transcriptions in dHFSCs compared with HFSCs. We further showed that miR-1 inhibited the proliferation but enhanced the differentiation of HFSCs by targeting IGF1R and LEF1 genes. However, the relationship between miR-1 and the candidate target genes (IGF1R and/or LEF1) in regulating HFSC proliferation and differentiation requires further investigation.
Footnotes
Authors' Contributions
H.Y., M.J., W.Z., and Y.C. designed the research. H.Y., M.J., Y.L., and Q.D. performed the experiments. H.Y., M.J., Y.L., Y.G., and X.W. analyzed the data and wrote the article.
Acknowledgment
All authors acknowledge and thank the respective institutes and universities.
Disclosure Statement
No competing financial interests exist.
Funding Information
This work was supported by the Natural Science Foundation of China (31872332); Datong Municipal Science and Technology Bureau (2020061 to H.Y.); PhD Initiation Grant of Datong University (2019-B-07 to H.Y.); Science and Technology Innovation Project of Universities, Shanxi Province of China (2020L0493 to H.Y.)
Supplementary Material
Supplementary Figure S1
Supplementary Figure S2
Supplementary Table S1
Supplementary Table S2
Supplementary Table S3
Supplementary Table S4
Supplementary Table S5
Supplementary Table S6
Supplementary Table S7
Supplementary Table S8
Supplementary Table S9
References
Supplementary Material
Please find the following supplemental material available below.
For Open Access articles published under a Creative Commons License, all supplemental material carries the same license as the article it is associated with.
For non-Open Access articles published, all supplemental material carries a non-exclusive license, and permission requests for re-use of supplemental material or any part of supplemental material shall be sent directly to the copyright owner as specified in the copyright notice associated with the article.
