
Abstract
Chronic kidney disease (CKD) accelerates atherosclerosis. The mechanism of CKD-related atherosclerosis is complex, and CKD-specific risk factors may contribute to this process in addition to traditional risk factors such as hypertension, diabetes, and hypercholesterolemia. In the present study, to discover CKD-specific atherosclerosis risk factors, a total of 62 patients with different stages of kidney function were enrolled. All patients underwent coronary angiographies and the severity of coronary atherosclerosis was defined by the SYNTAX score. Patients were divided into different groups according to their kidney function levels and coronary atherosclerosis severity. Data-independent acquisition mass spectrometry was used to identify differentially expressed proteins (DEPs) in the plasma samples, and weighted correlation network analysis (WGCNA) was employed to identify significant protein modules and hub proteins related to CKD-specific atherosclerosis. The results showed that 10 DEPs associated with atherosclerosis were found in the comparative groups with modest and severe CKD. Through WGCNA, 1768 proteins were identified and 8 protein modules were established. Enrichment analyses of protein modules revealed functional clusters mainly associated with inflammation and the complement and coagulation cascade as atherosclerosis developed under CKD conditions. The results may help to better understand the mechanisms of CKD-related atherosclerosis and guide future research on developing treatments for CKD-related atherosclerosis.
Introduction
Chronic kidney disease (CKD) is associated with an increased risk for cardiovascular disease (CVD) (Weiner et al., 2004). Notably, cardiovascular mortality is approximately two times higher in patients with stage 3 CKD and three times higher in patients with stage 4 CKD compared with those without CKD. CVD accounts for more than 50% of deaths in patients with CKD worldwide (Briasoulis and Bakris, 2013). In light of these findings, the American College of Cardiology and the American Heart Association recommended that CKD should be considered a CVD risk equivalent (Levey et al., 2003). Among the different types of CVD, coronary atherosclerosis is highly prevalent and advances more rapidly in CKD patients (Amann et al., 2004; van der Velde et al., 2011), and the incidence of coronary atherosclerosis in CKD patients is inversely related to the glomerular filtration rate (GFR) (Anavekar et al., 2004; Chronic Kidney Disease Prognosis et al., 2010).
The mechanism of increased coronary atherosclerosis in CKD is uncertain. Traditional risk factors, including hypertension, diabetes, and hypercholesterolemia, cannot fully explain the frequency and severity of coronary atherosclerosis, as the Framingham risk score based on traditional risk factors provides poor overall accuracy in predicting cardiovascular events within the CKD population (Kalantar-Zadeh et al., 2003; Weiner et al., 2006, 2007). It is believed that there are specific risk factors in CKD-related atherosclerosis, and nontraditional risk factors, including inflammation, endothelial dysfunction, oxidative stress, and volume overload may contribute to this process (Sarnak et al., 2003; Miyamoto et al., 2011). The close relationship between atherosclerosis and CKD is most likely due to the coexistence of both traditional and nontraditional risk factors. Interestingly, CKD patients might experience no atherosclerosis incidence even with long-term severe kidney dysfunction, indicating that the mechanism remains undetected for this complication.
Given the association between CKD and atherosclerosis, we hypothesized that a direct analysis of the proteomes may provide insight into their relationship. Data-independent acquisition (DIA)-based proteomic quantification is one of the most effective approaches for analyzing changes in the proteomes of diseases. In the present study, through liquid chromatography–mass spectrometry (LC-MS)-based DIA proteomics and bioinformatics analyses, including weighted correlation network analysis (WGCNA), we evaluated differences in the expression of plasma proteins in patients with different stages of kidney function existing with or without coronary atherosclerosis. The results of this study may help to better understand the mechanism of CKD-related atherosclerosis.
Materials and Methods
Study participants and sample collection
This study protocol was approved by the Ethics Committee of Ruijin Hospital (ID: 2020-152), Shanghai Jiao Tong University School of Medicine, and written informed consent was obtained from all participants.
The study included 62 patients at different stages of kidney function who were admitted to the Department of Cardiology, Ruijin Hospital between January 2017 and December 2021. Kidney function was established by estimated GFR using the Chronic Kidney Disease Epidemiology Collaboration (CKD-EPI) formula (Levey et al., 2011). For all enrolled patients with kidney dysfunction, the cause of kidney dysfunction was chronic injury. Each patient underwent a coronary angiography using the Judkins technique in multiple angulated views, and the SYNTAX score (SS) was evaluated. Patients with no coronary atherosclerosis or severe coronary atherosclerosis based on a SS >22 were enrolled in the present study. Patients were excluded if there was a previous history of myocardial infarction, coronary artery bypass graft surgery, and/or percutaneous coronary intervention. Patients were also excluded if they had diabetes mellitus, a malignant tumor, familial hypercholesterolemia, systemic disease (e.g., systemic lupus erythematosus), and/or left ventricular (LV) systolic dysfunction defined as an LV ejection fraction ≤50%.
Patients were divided into six groups based on GFR differences and coronary atherosclerosis severity (A, CKD1–2 as 60 ≤ GFR <90 mL/min/1.73 m2 without coronary atherosclerosis, n = 11; B, CKD1–2 with severe coronary atherosclerosis, n = 11; C, CKD3-4 as 15 ≤ GFR <60 mL/min/1.73 m2 without coronary atherosclerosis, n = 11; D, CKD3–4 with severe coronary atherosclerosis, n = 11; E, CKD5 as GFR <15 mL/min/1.73 m2 without coronary atherosclerosis, n = 8; F, CKD5 with severe coronary atherosclerosis, n = 10). All CKD5 patients received hemodialysis treatment. Blood samples were collected after overnight fasting from all patients for further MS analysis, and plasma biochemical parameters were measured. In the case of hemodialyzed patients, blood samples were collected on the next day of hemodialysis treatment.
Data-dependent acquisition and DIA MS assay
Plasma samples were separated of most abundant proteins using Human 14 Multiple Affinity Removal System Column following the manufacturer's protocol (Agilent Technologies). Proteins were subjected to digestion procedure modified from the filter-aided sample preparation protocol. Briefly, 200 μg proteins were added to an ultrafiltration tube. The detergent, DTT, and other low-molecular-weight components were removed using uric acid (UA) buffer (8 M urea, 150 mM Tris-HCl pH 8.0) by repeated ultrafiltration (Microcon units, 10 kD). Then 100 μL iodoacetamide (100 mM IAA in UA buffer) was added to block reduced cysteine residues and the samples were incubated for 30 min in darkness. The filters were washed with 100 μL UA buffer three times and then 100 μL 25 mM NH4HCO3 buffer two times. Then the protein suspensions were digested with 4 μg trypsin (Promega) in 40 μL 25 mM NH4HCO3 buffer overnight at 37°C, and the resulting peptides were collected as a filtrate. Finally, tryptic peptides were C18 purified and spiked with retention time calibration peptides to correct for relative retention time differences between runs.
A comprehensive spectral library was generated from a pooled plasma sample, which comprised the 62 enrolled patients. All fractions for data-dependent acquisition (DDA) library generation were injected into a Thermo Scientific Q Exactive HFX mass spectrometer connected to an Easy nLC 1200 chromatography system (Thermo Scientific, IL). Peptides (1.5 μg) were separated on an C18 LC Analytical Column (2 μm, 180 μm × 15 cm) with a linear gradient of buffer B (80% acetonitrile and 0.1% formic acid) at a flow rate of 600 nL/min over 65 min. The MS detection method was positive ion, the scan range was 300–1800 m/z, resolution for the MS1 scan was 60,000 at 200 m/z, the target of AGC (Automatic gain control) was 3e6, maximum IT was 25 ms, and dynamic exclusion was 30 s. Each full mass spectrometry–single ion monitoring (MS–SIM) scan followed 20 ddMS2 scans. Resolution for the MS2 scan was 15,000, the AGC target was 5e4, maximum IT was 25 ms, and the normalized collision energy was 30 eV.
For the DIA MS assay, each sample peptide was analyzed by LC-MS/MS operating in the DIA mode by Shanghai Applied Protein Technology Co., Ltd. (Shanghai, China). Each DIA cycle contained one full MS–SIM scan, and 30 DIA scans covered a mass range of 350–1800 m/z with the following settings: SIM full scan resolution was 60,000 at 200 m/z; AGC 3e6; maximum IT 30 ms; profile mode; DIA scans were set at a resolution of 30,000; AGC target of 3e6; Max IT was auto; and normalized collision energy was 30 eV. Runtime was 65 min with a linear gradient of buffer B (80% acetonitrile and 0.1% formic acid) at a flow rate of 600 nL/min. Quality control samples (pooled sample from equal aliquot of each sample in the experiment) were injected in the DIA mode at the beginning of the MS study and after every six to eight injections thereafter, which was used to monitor the MS performance.
Bioinformatics analysis
The data generated in the DIA mode MS analysis were identified for a spectral library using Spectronaut Pulsar X (version 12; Biognosys AG, Schlieren, Switzerland) (Bruderer et al., 2016), which uses iRT peptides to calibrate the retention time. False discovery rate (FDR) was estimated using the mProphet scoring algorithm, which accurately reflects the matching degree of ion pairs. Protein entries that satisfied FDR ≤0.01 were used to build the final spectral library. Differentially expressed proteins (DEPs) in pairwise comparative groups were identified.
We further used WGCNA to study the relationship between protein modules and clinical features. WGCNA was designed to construct large networks in an unsupervised manner and study the correlation patterns of multiple sample proteins with the topological overlap matrix (TOM) method. Proteins that share similar expression patterns in different samples are grouped into a “module.” The relationships between biological characteristics and protein modules are studied and the most relevant modules in clinical practice are then revealed. In the present study, to clarify the mechanisms of specific modules on CKD-related atherosclerosis, we used the Blast2GO pipeline for gene ontology (GO) annotations of those protein modules, and the significantly enriched GO terms were analyzed using Fisher's exact test (Conesa et al., 2005).
The Kyoto Encyclopedia of Genes and Genomes (KEGG) pathway enrichment analysis was conducted with the protein modules as the background set (Kanehisa et al., 2017). Proteins in modules were imported into the STRING database (STRING 11.0) to perform network interaction analysis of protein–protein relationships. Finally, for hub protein identification, the networks were exported in a format fit for analysis by Cytoscape and correlation patterns among revealed that protein samples were constructed.
Statistical analysis
Continuous variables are expressed as the mean ± standard deviation and were evaluated using a t-test. For categorical variables, the chi-square test was used to evaluate differences between comparison groups. For GO and KEGG analyses, Fisher's exact test was used to test the enrichment of proteins in interested modules analyzed by WGCNA. Data were analyzed using SPSS 13.0 (SPSS, Inc., Chicago, IL), and p < 0.05 was considered statistically significant.
Results
Quantitative protein detection
The baseline characteristics of enrolled patients are summarized in Table 1. The detailed clinical data of the patients are shown in Supplementary Clinical Data. There were no significant differences found among traditional cardiovascular risk factors, including sex, age, body mass index (BMI), smoking, hypertension, and hypercholesterolemia, between coronary artery disease (CAD) patients and non-CAD patients at the same stage of kidney function. It should be noted that to focus on the effect of kidney dysfunction on atherosclerosis, patients with normal kidney function were excluded in CKD1–2 groups and only patients with mild CKD, defined as 60 ≤ GFR <90 mL/min/1.73 m2, were enrolled. In CKD1–2 patients, the average GFR was 75.8 ± 6.0 mL/min/1.73 m2 in the non-CAD group, compared with 76.0 ± 2.2 mL/min/1.73 m2 in the CAD group.
Baseline and Demographic Characteristics of the Study Population
Results are expressed as mean ± standard deviation, or as number (frequency) for binary variables.
ALB, albumin; ALT, alanine aminotransferase; Apo, apolipoprotein; APTT, activated partial thromboplastin time; AST, aspartate aminotransferase; BMI, body mass index; BNP, B-type natriuretic peptide; BUN, blood urea nitrogen; Ca, calcium; CAD, coronary artery disease; CKD, chronic kidney disease; CK-MB, creatine kinase-MB; CRE, creatinine; CRP, C-reactive protein; cTnI: cardiac troponin I; Cys-C, cystatin-C; DD, D-dimer; FDP, fibrin degradation products; GFR, glomerular filtration rate; HBP, high blood pressure; HDL-C, high-density lipoprotein-cholesterol; HGB, hemoglobin; LDL-C, low-density lipoprotein-cholesterol; Lp, lipoprotein; LVEF, left ventricular ejection fraction; Pi, phosphate; PLTs, platelets; PT, prothrombin time; SS, SYNTAX score; TC, total cholesterol; TG, triglycerides; UA, uric acid; WBC, white blood cells.
The details of the proteins identified and quantified by DIA are shown in Supplementary Table S1. Fold change ≥1.5 and p < 0.05 were used as the screening criteria for significantly different DEPs. The present study identified a total of 187 DEPs in A/B (72 upregulated and 115 downregulated in B), 106 DEPs in C/D (61 upregulated and 45 downregulated in D), and 86 DEPs in E/F (22 upregulated and 62 downregulated in F). The identification and cluster analysis chart of DEPs in pairwise comparative groups at the same stage of kidney function are shown in Supplementary Figure S1.
Unfortunately, no common DEPs were found among A/B, C/D, or E/F comparative groups using Venn diagrams (Supplementary Fig. S2). However, among C/D and E/F comparative groups with modest and severe kidney dysfunction, 10 DEPs were reported to be associated with atherosclerosis disease, including alpha-1B-glycoprotein (A1BG), CD44, platelet factor 4 variant 1 (PF4V1), haptoglobin (HP), mannan-binding lectin serine protease 1 (MASP1), human neutrophil peptides (HNPs), immunoglobulin G4 (IgG4), afamin (AFM), c-Mpl, and transferrin (TRF), among which most are related to inflammation.
Weighted correlation network analysis
To further explore the CKD-specific mechanism in atherosclerosis formation and identify groups of proteins with highly similar characteristics from the proteome of plasma samples, the R package WGCNA was applied to build the coexpression network.
Partial least-squares discrimination analysis showed substantial variability in the distribution of protein abundance in CAD and non-CAD patients at different stages of kidney function (Fig. 1A). Then we performed cluster analysis on 1768 proteins from the 62 samples and no outlier sample was excluded for subsequent analysis (Fig. 1B). The scale-free TOM network model was used to study protein–protein interaction (PPI) networks. We first used its ability to uncover tightly correlated modules, and clusters of proteins with similar binding characteristics were calculated for correlation coefficients. The results suggest that strong modularity was found (Fig. 2). In total, 8 nonoverlapping modules with highly correlated proteins were detected, encompassing 45 to 325 proteins. Modules were named after different colors according to the convention of WGCNA. A total of 625 proteins were not assigned to any module and were labeled with the color gray (Fig. 3).

Partial least-squares discrimination analysis and cluster analysis.
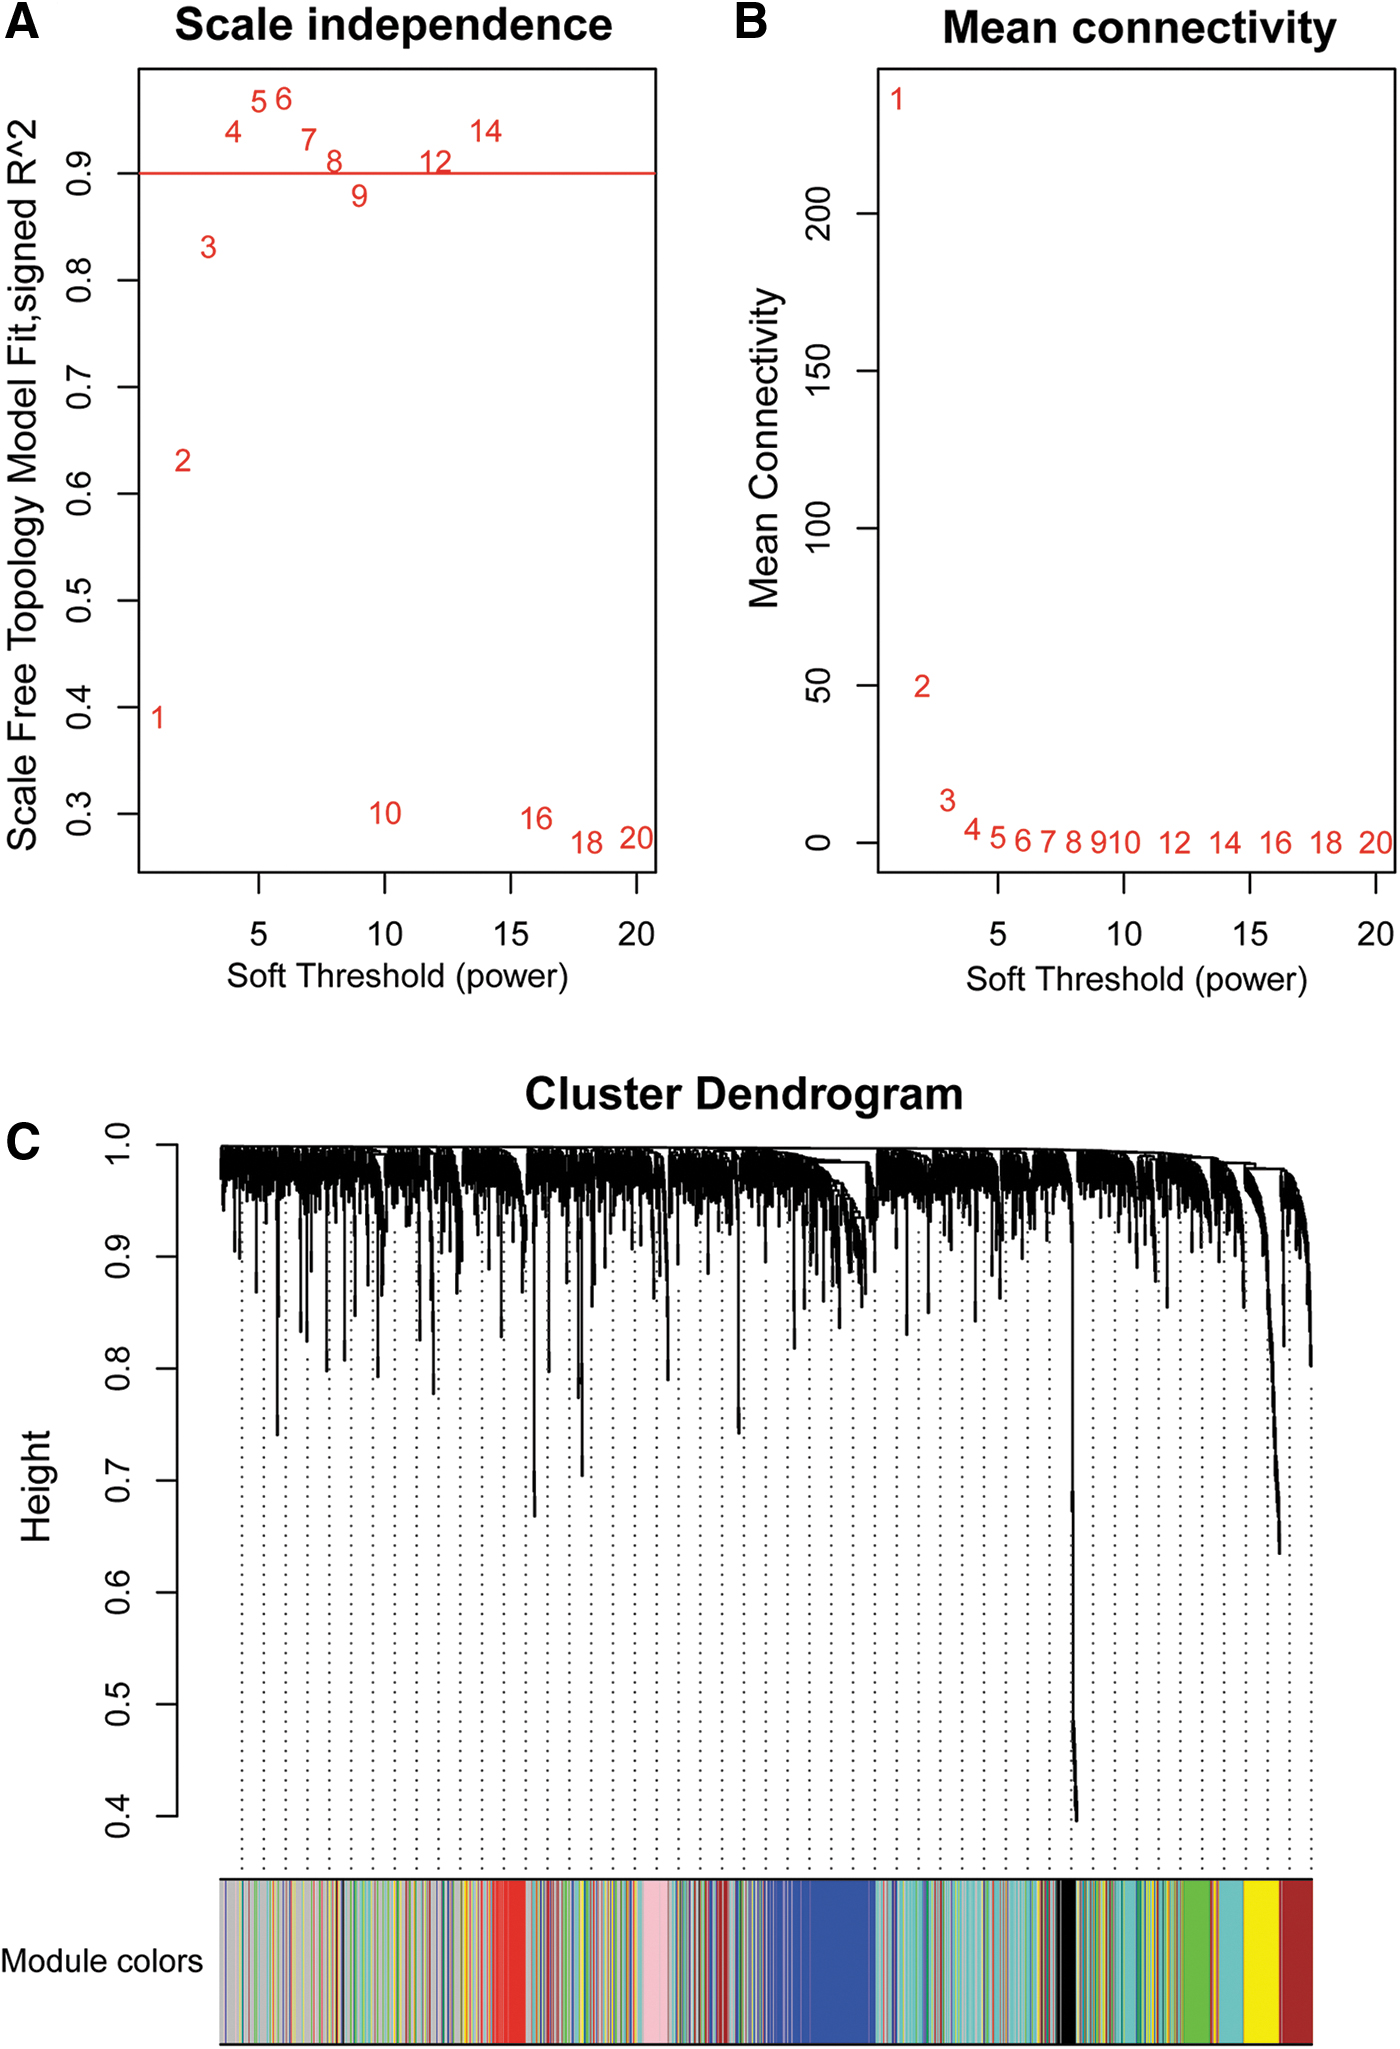
Determination of soft-thresholding power in WGCNA.
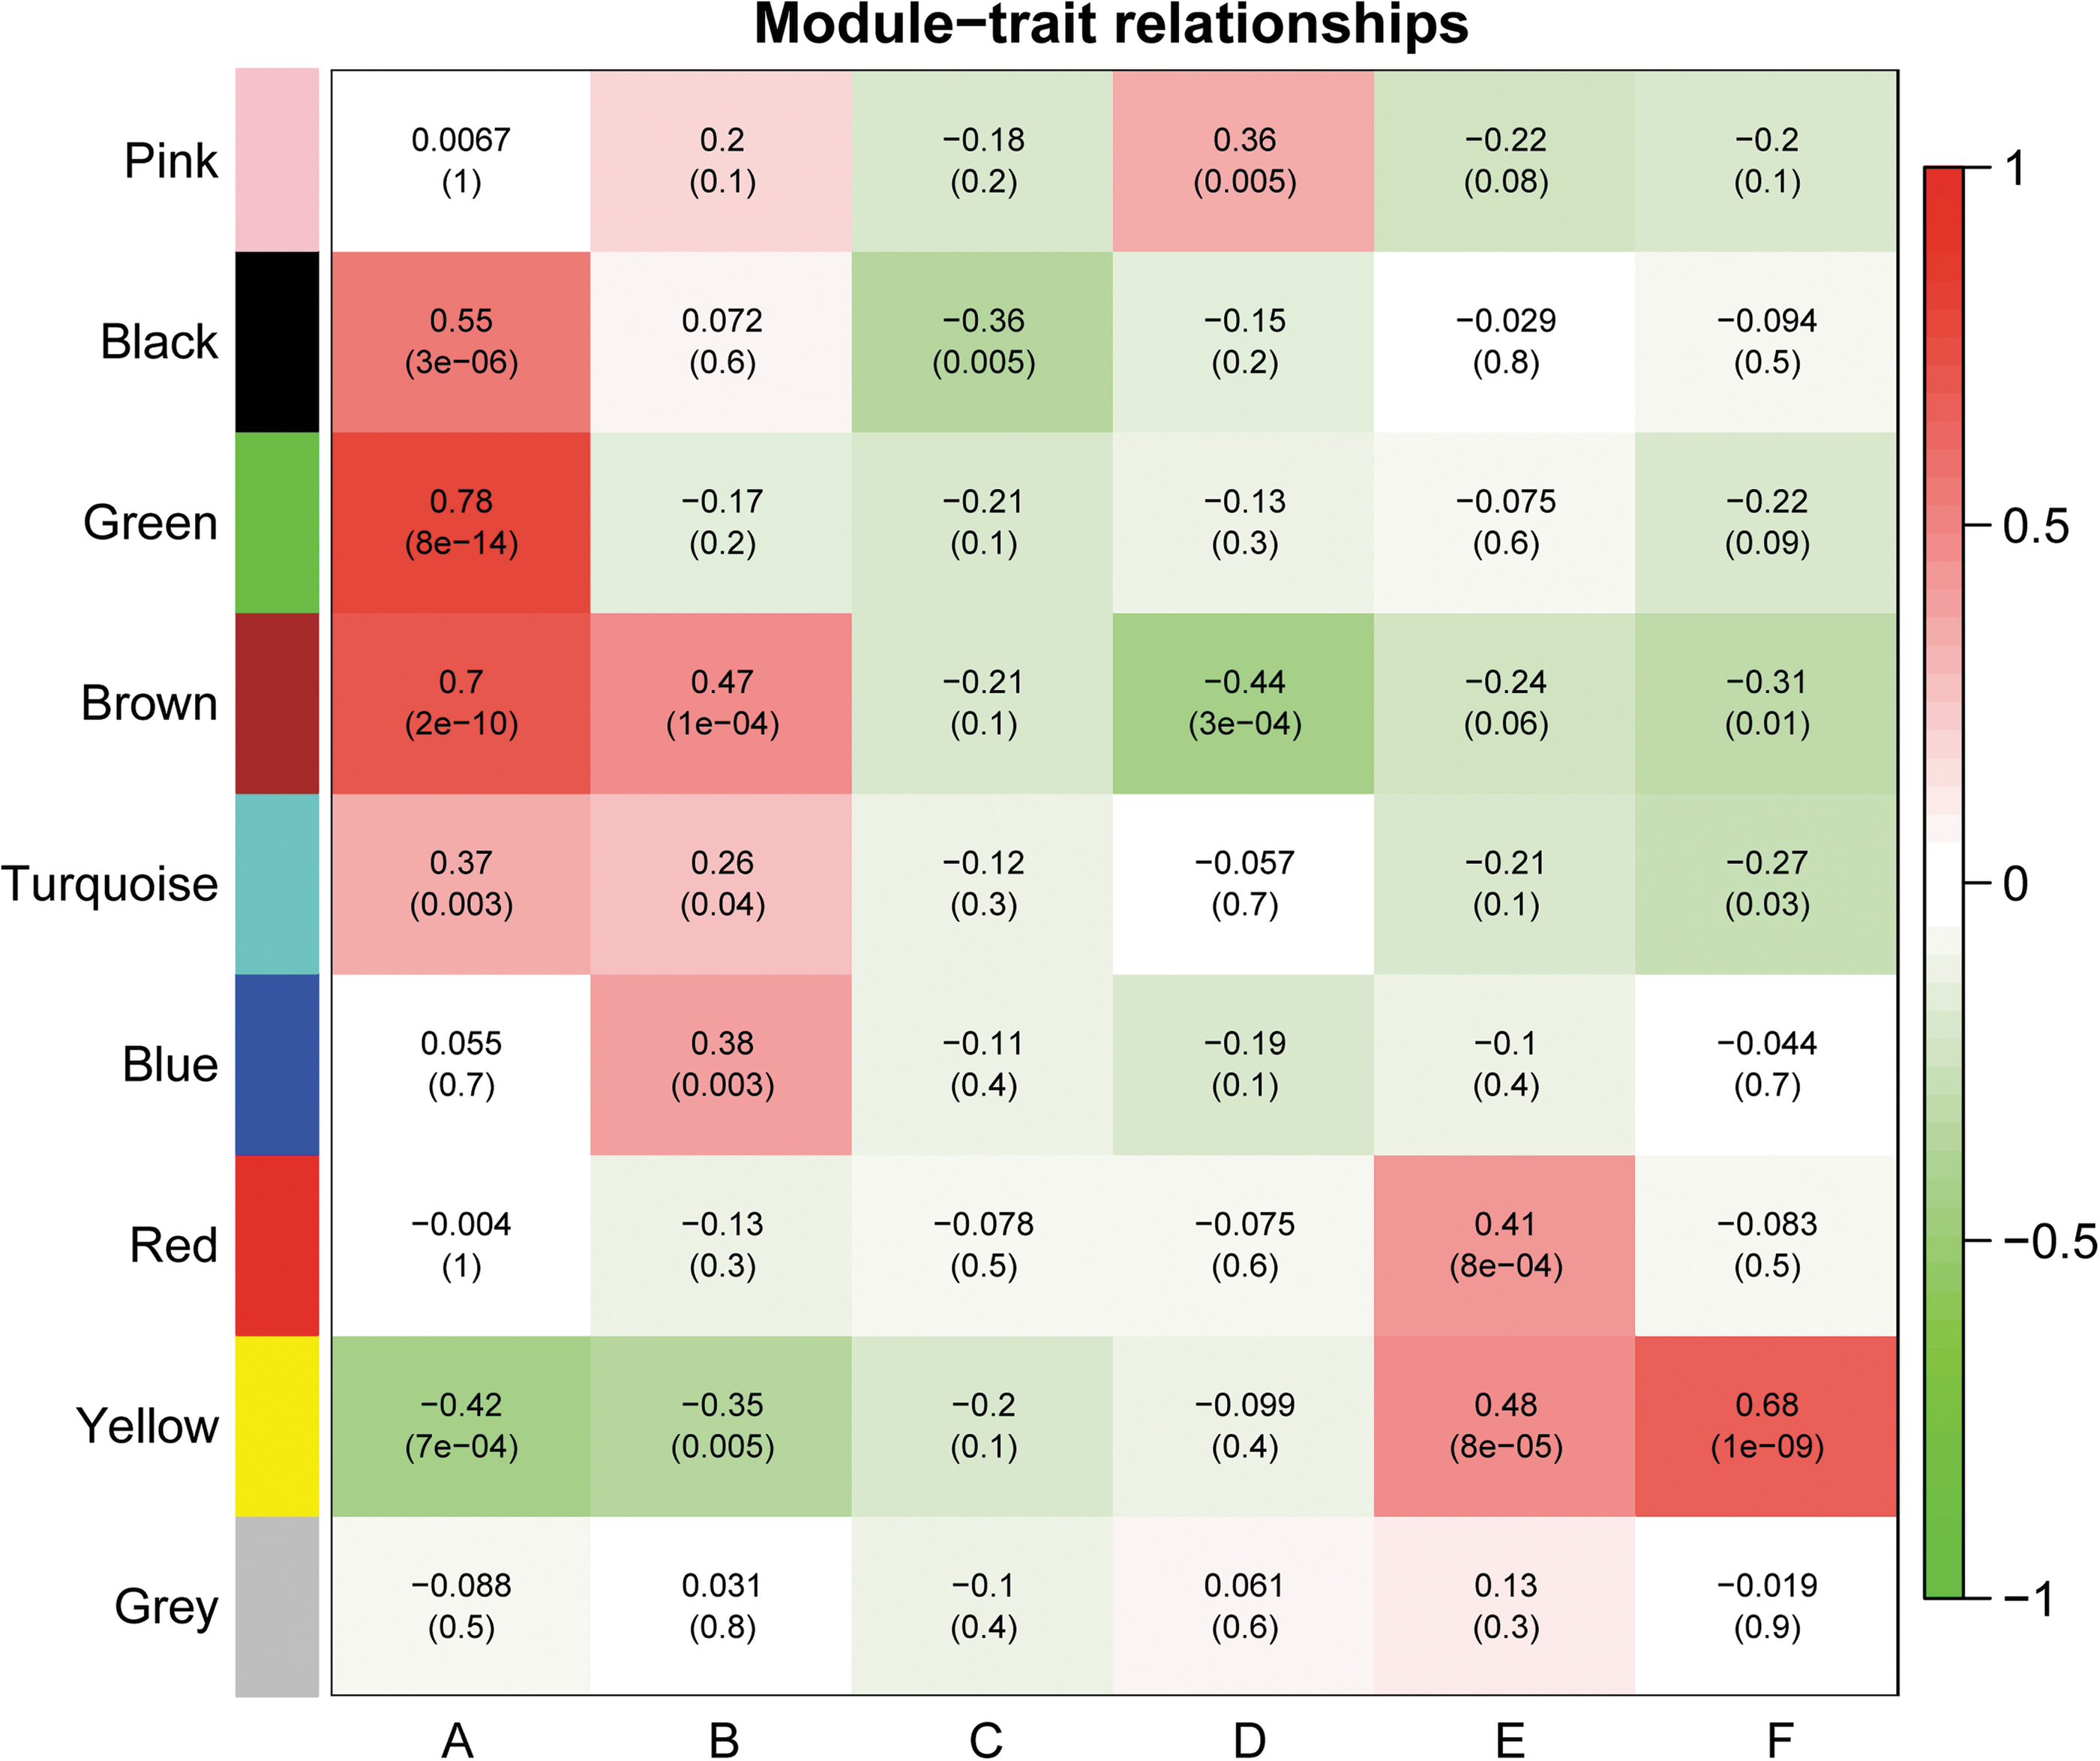
Heat map showing the Pearson correlations and p values (in brackets) between protein modules and clinical phenotypes. According to the WGCNA algorithm, 1768 proteins were divided into 9 distinct modules: pink, black, green, brown, turquoise, blue, red, yellow, and gray. The color scale on the right side of the figure refers to the correlation between the module and the clinical trait.
GO and KEGG analyses
To further clarify the mechanism underlying the impact of protein modules on correlative CKD-related atherosclerosis, proteins in the modules of interest were uploaded to the Database for GO functional annotation and KEGG pathway enrichment analyses. It was noted that proteins in brown (177 proteins) and yellow (141 proteins) modules share similar expression patterns as kidney function declines (A/B > C/D > E/F in brown module, A/B < C/D < E/F in yellow module). More importantly, these proteins share the same expression trend between CAD and non-CAD groups at the same stage of kidney dysfunction (A > B, C > D, E > F in brown module, A < B, C < D, E < F in yellow module). Thus, we posit that CKD-specific atherosclerosis risk factors are more likely to be included in these two modules compared with other modules.
GO analyses in the brown and yellow modules revealed that protein binding was the primary molecular function for atherosclerosis development, while protein modules significantly involved in inflammation, complement and coagulation cascades were found to be related to CKD-specific atherosclerosis in the KEGG analysis (Fig. 4). The PPI results are shown in Figure 5.

Functional GO classification and KEGG pathway classification of proteins in the yellow and brown modules from WGCNA analyses. (
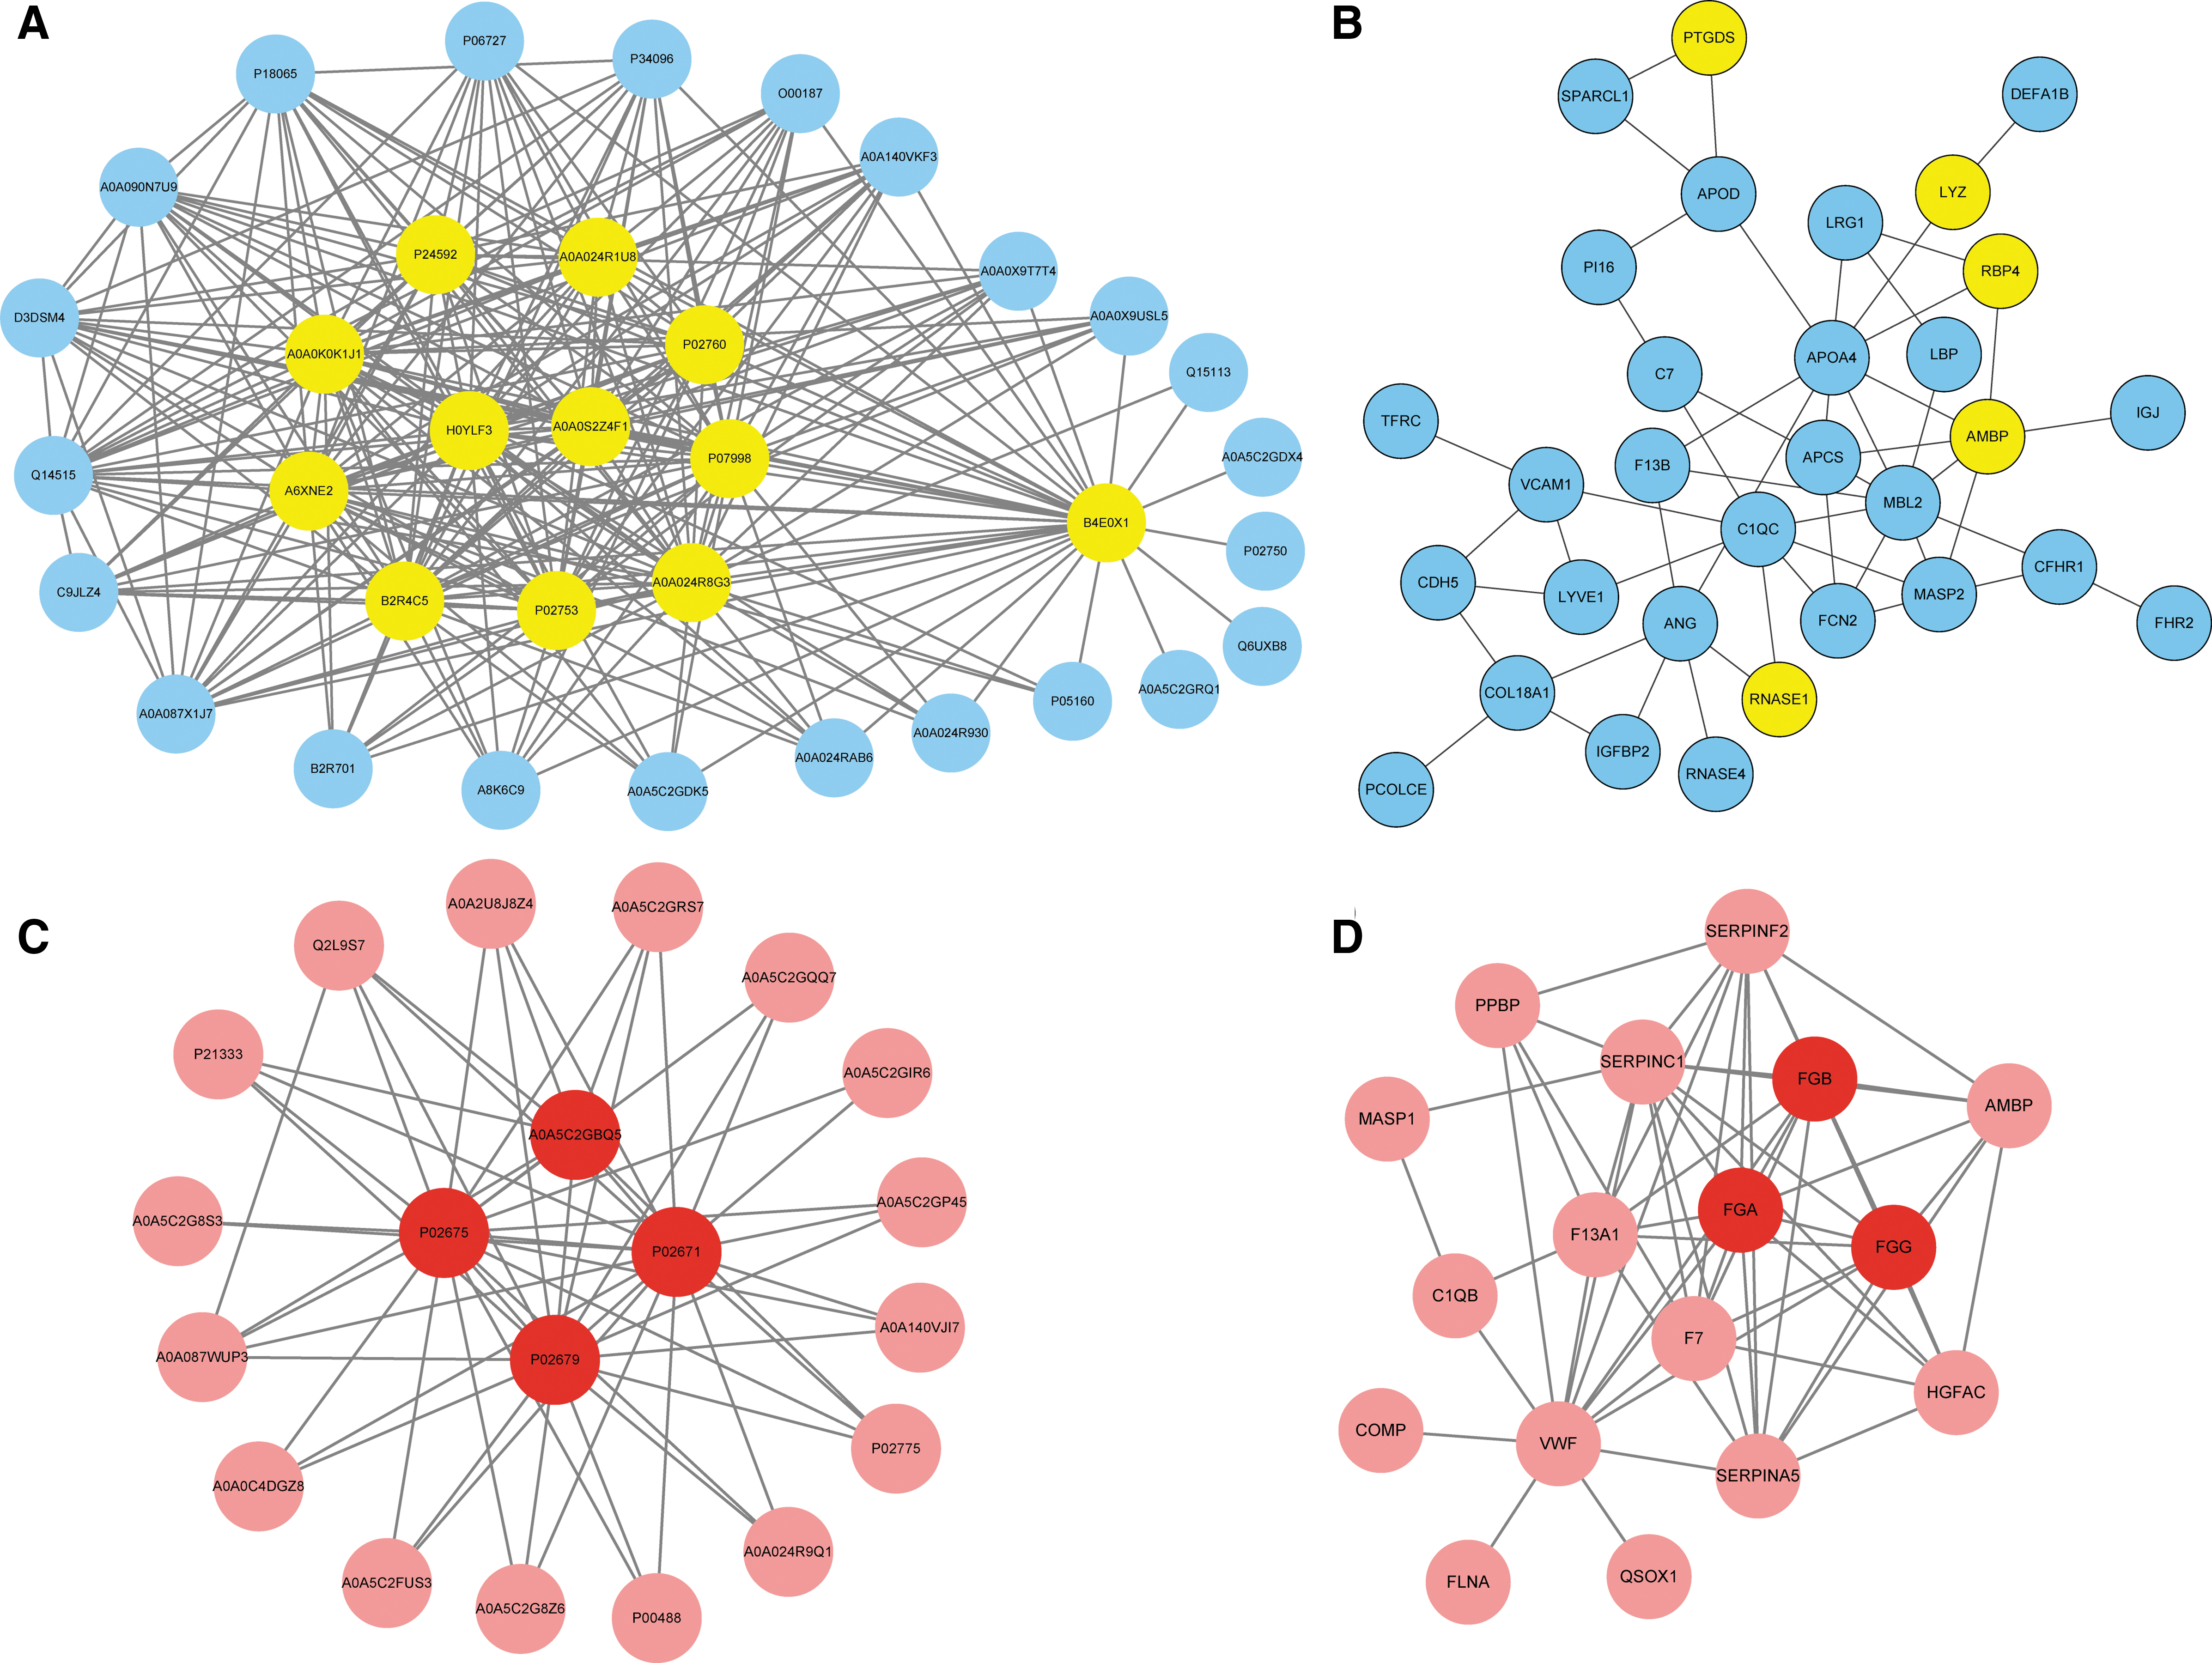
Protein–protein relationships network diagram of proteins in the yellow
Hub protein identification
Finally, we wanted to identify the hub proteins belonging to the brown and yellow modules that might play important roles in CKD-related atherosclerosis. The module coexpression networks were exported and then visualized using CytoScape software. The results indicated that nine proteins with high connectivity in the yellow modules were hub proteins, including insulin-like growth factor-binding protein 4 and 6 (IGFBP4 and IGFBP6), retinol-binding protein 4 (RBP4), prostaglandin-D2 synthase (PGDS), complement factor D, ribonuclease, cystatin-C, β2-microglobulin, and alpha1-microglobulin/bikunin precursor. Additionally, three proteins in the brown module were selected as hub proteins, including fibrinogen alpha chain, fibrinogen beta chain, and fibrinogen gamma chain. The relative accumulations of the 12 hub proteins in the plasma of different groups are shown in Figure 6.
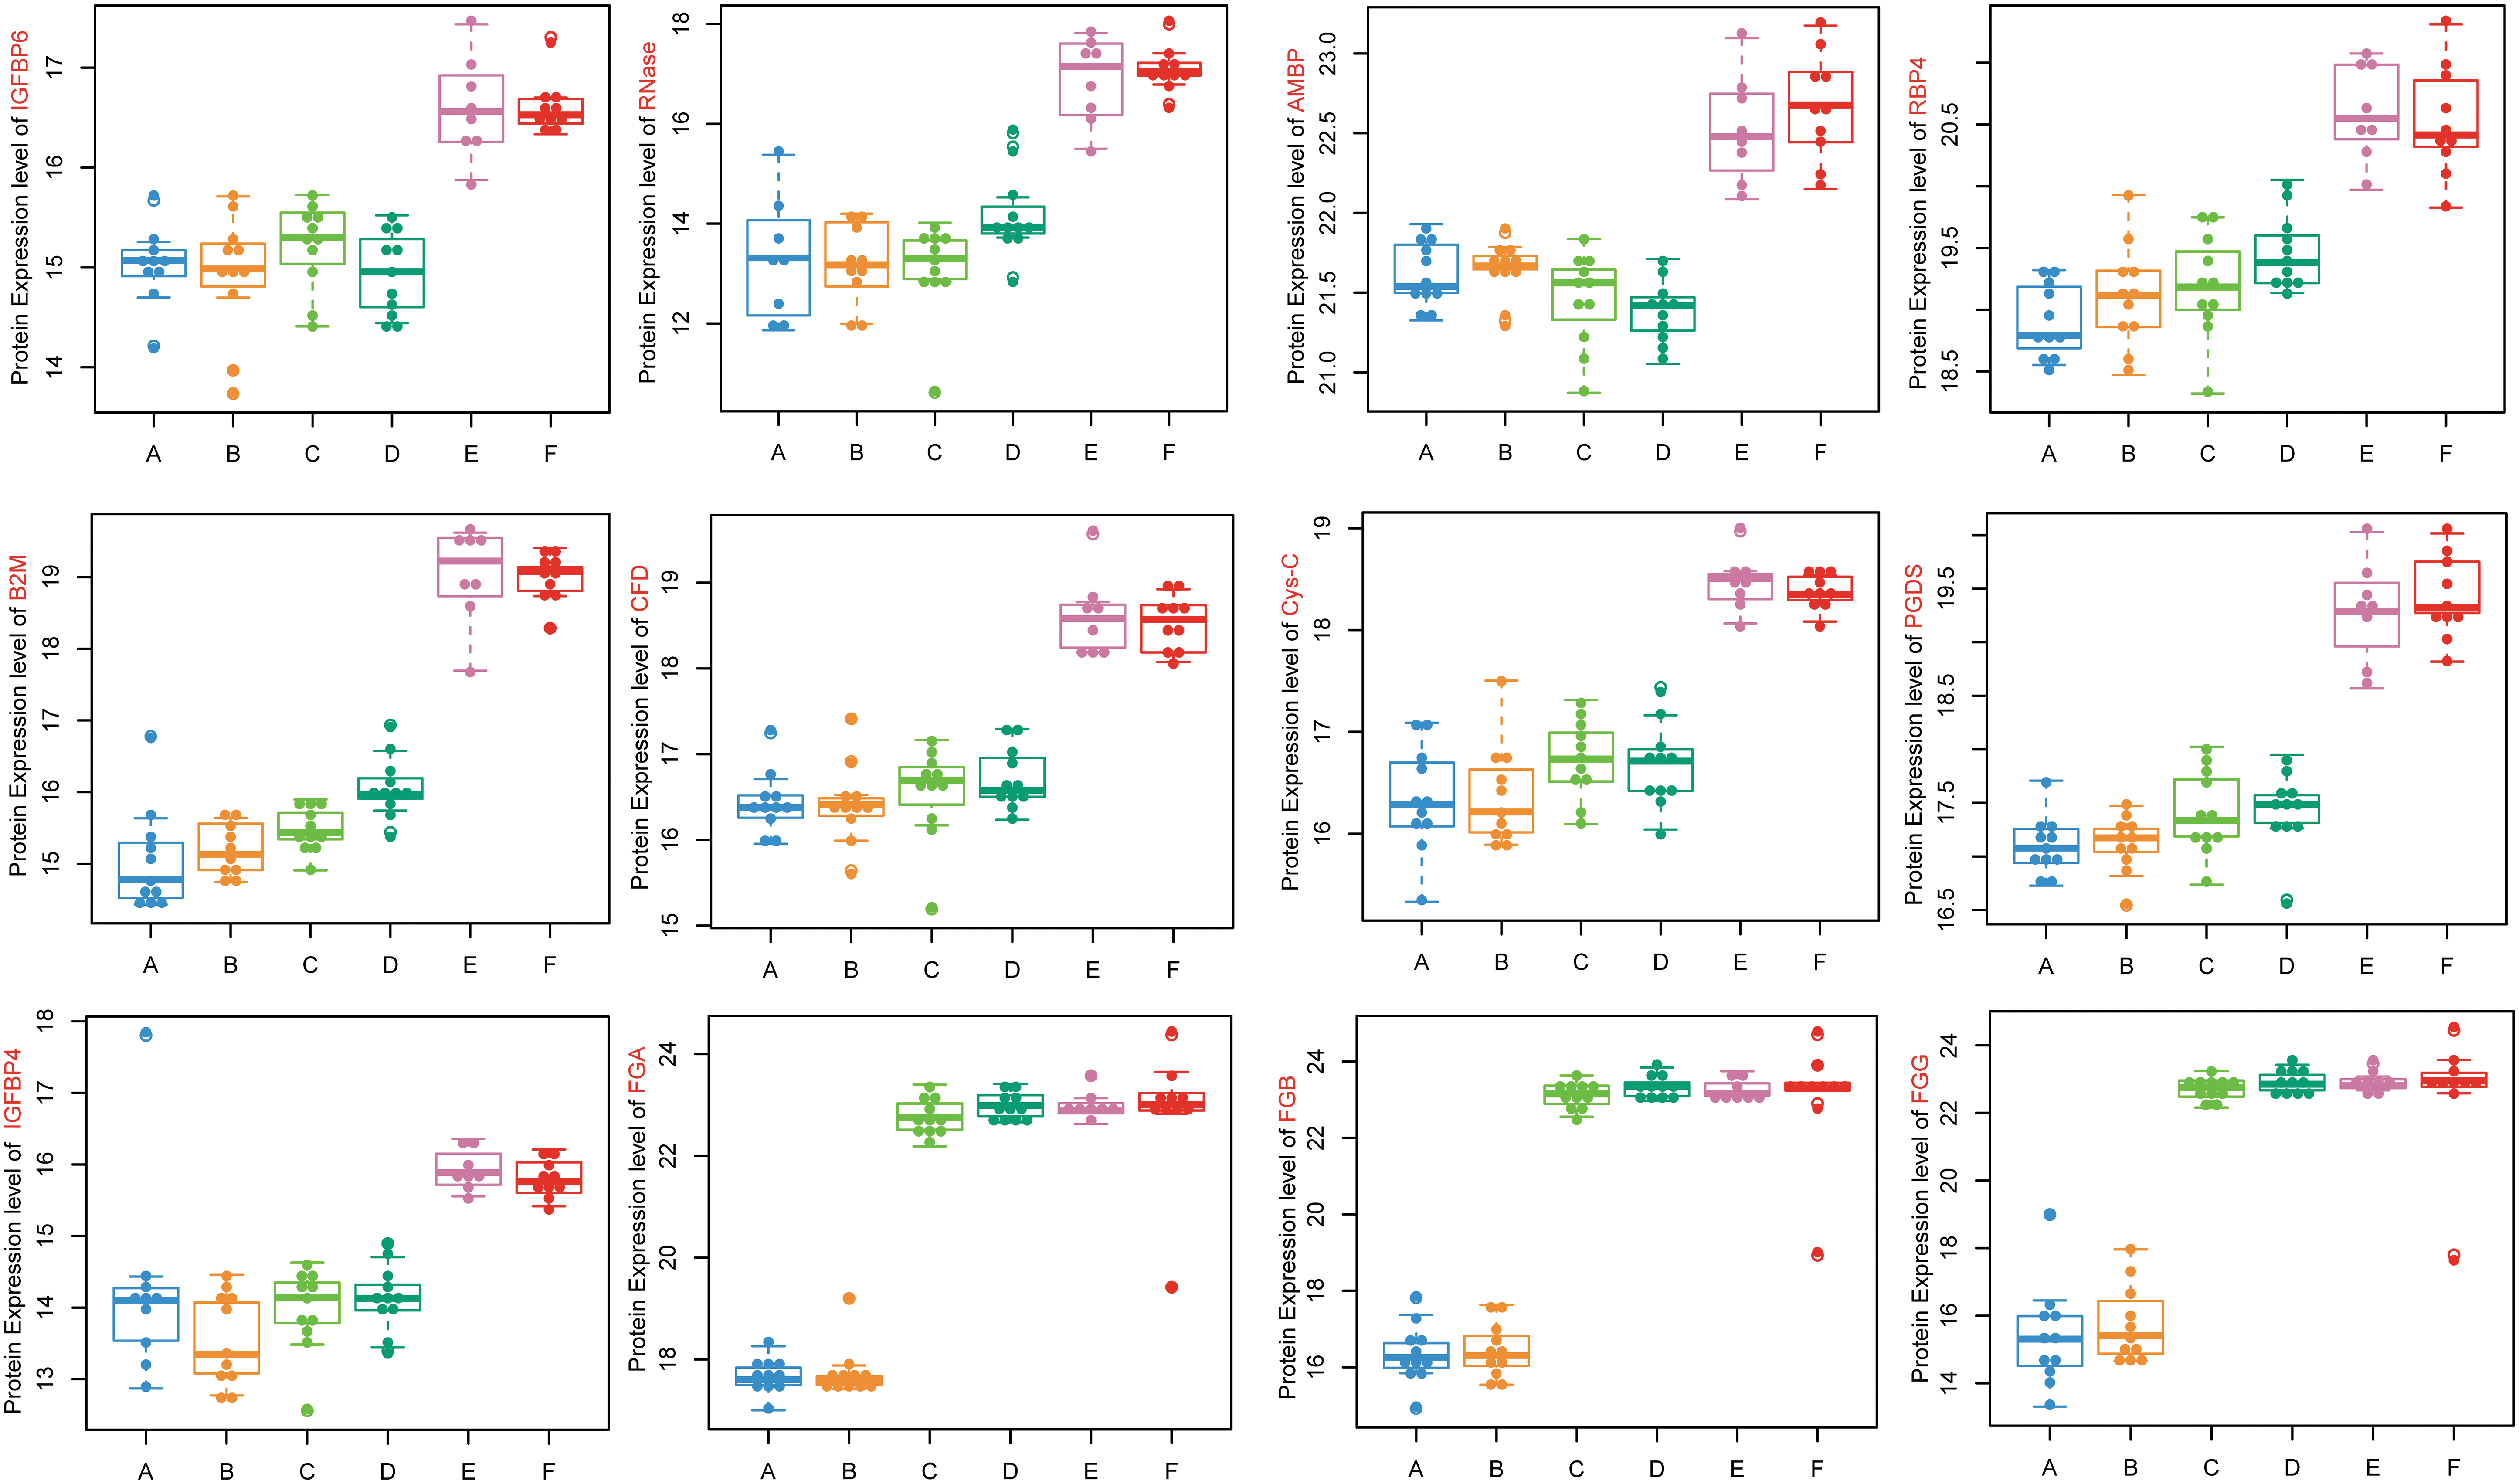
Relative abundance of 12 hub proteins differentially expressed in A–F groups, including 9 hub proteins in the yellow module (IGFBP4, IGFBP6, RBP4, PGDS, CFD, RNase, Cys-C, B2M, AMBP) and 3 hub proteins in the brown module (FGA, FGB, FGG). A, CKD1–2 without coronary atherosclerosis; B, CKD1–2 with coronary atherosclerosis; C, CKD3–4 without coronary atherosclerosis; D, CKD3–4 with coronary atherosclerosis; E, CKD5 without coronary atherosclerosis; F, CKD5 with coronary atherosclerosis. AMBP, alpha1-microglobulin/bikunin precursor; B2M, β2-microglobulin; CFD, complement factor D; Cys-C, cystatin-C; FGA, fibrinogen alpha chain; FGB, fibrinogen beta chain; FGG, fibrinogen gamma chain; IGFBP, insulin-like growth factor-binding protein; PGDS, prostaglandin-D2 synthase; RBP4, retinol-binding protein 4; RNase, ribonuclease.
Discussion
Patients with CKD are at high risk for CVD, and the main events observed in CKD include atherosclerosis (Go et al., 2004; Brunet et al., 2011; Gargiulo et al., 2015). The accelerated atherosclerosis associated with CKD was first described by Lindner et al. (1974). This observation was subsequently confirmed by several studies, which showed that the media thickness of coronary arteries and frequencies of advanced atherosclerotic lesions were significantly higher in CKD patients compared with non-CKD patients in autopsy samples (Schwarz et al., 2000; Nakano et al., 2010). Additionally, the carotid intima-media thickness was increased among young adult CKD patients (Oh et al., 2002). Animal studies in ApoE−/− mice also established that CKD could accelerate atherosclerosis (Buzello et al., 2003; Massy et al., 2005).
Although the close connection between CKD and atherosclerosis is indisputable, the frequency and severity of atherosclerosis is disproportionate to the high prevalence of traditional risk factors in CKD patients (Muntner et al., 2005; Kendrick and Chonchol, 2008; van der Zee et al., 2009). More nontraditional risk factors have been suggested to participate in the atherosclerosis process under CKD conditions. For example, our previous study revealed that one protein-bound uremic toxin retained under CKD conditions, p-cresyl sulfate, could promote uremic atherosclerosis (Jing et al., 2016). Interestingly, with coronary angiography tests, we also found that some CKD patients might possess noncoronary atherosclerosis even after decades of dialysis treatment, making this phenomenon more complicated. The exact causes of atherosclerosis in CKD remain poorly defined.
In the present study, to better understand the mechanism of CKD-related atherosclerosis, we focused on the alterations in protein abundance involved in CKD patients who had normal coronary arteries or severe coronary atherosclerosis based on a SS ≥22. It should be noted that to focus on the effect of kidney dysfunction on atherosclerosis, patients with normal kidney function were excluded in CKD1–2 groups in our study and only patients with mild CKD, defined as 60 ≤ GFR <90 mL/min/1.73 m2, were enrolled. In the groups with modest and severe CKD (CKD3–4 and CKD5), the underlying kidney diseases included 22 cases of hypertensive nephropathy, 13 cases of chronic glomerulonephritis, 2 cases of polycystic kidney disease, and 3 cases of other/unknown renal diseases. Patients with diabetes mellitus were excluded from the present study to avoid the interference of extra powerful atherosclerosis risk factors. After matching with traditional risk factors, including sex, age, BMI, smoking, hypertension, and hypercholesterolemia, we attempted to find specific atherosclerosis risk factors under CKD conditions.
With quantitative protein detection, several DEPs revealed in our pairwise comparative groups at the same kidney function stage have been reported to be associated with atherosclerosis, among which most are related to inflammation (A1BG, CD44, PF4V1, CD163, HP, HNPs, and IgG4). Given the prevalent inflammation status in CKD condition (Mihai et al., 2018) and knowing that atherosclerosis is thought to be an inflammatory disease (Ross, 1999), inflammation may play an important role in CKD-related atherosclerosis. DEPs revealed in our study are also involved in other processes, including the binding and metabolism of lipoproteins (AFM), blood complement and coagulation cascades (MASP1, c-Mpl), and the transport of iron (TRF), indicating the complex mechanism of CKD-related atherosclerosis. Detailed descriptions of interested DEPs are listed in Table 2.
Detailed Descriptions of Interesting Differentially Expressed Proteins Revealed by Quantitative Protein Detection
A1BG, alpha-1B-glycoprotein; AFM, afamin; DEPs, differentially expressed proteins; HNPs, human neutrophil peptides; HP, haptoglobin; IgG4, immunoglobulin G4; MASP1, mannan-binding lectin serine protease 1; MBL, mannan-binding lectin; PF4V1, platelet factor 4 variant 1; TRF, transferrin.
Our results are consistent with the results of previous studies, especially those from several studies by Luczak et al. (2011, 2015, 2016), which found that molecular mechanisms involved in the development of CKD-related atherosclerosis are involved in blood coagulation cascades, the transport, binding, and metabolism of lipoproteins, and inflammatory processes (Feldreich et al., 2020; Tracz and Luczak, 2021).
However, we believe that our study has novelty. First, in previous studies, atherosclerotic cardiovascular disease (ASCVD) was diagnosed mainly by medical history and was nonspecified. In our study, all patients underwent coronary angiography, ASCVD was confirmed in all patients, and the severity of ASCVD was quantified by the SYNTAX scoring system. These data are rare as CKD patients are usually hesitant to receive coronary angiographies due to the potential adverse renal effects from contrast agents. Second, previous studies used 2D electrophoresis and MS-based proteomics. In contrast, DDA and DIA MS assays were used in our study to get a wider range of proteomics information. Third, the WGCNA algorithm was utilized in our study for the analysis of the proteomic expression network since it is a well-integrated statistical tool.
With further WGCNA, our study confirmed that besides inflammation, proteins linked to complement and coagulation cascades also play an important role in CKD-related atherosclerosis. This might be the most important finding of our study.
The complement system bridges and regulates the balance between the coagulation and fibrinolysis system (Rittirsch et al., 2008), while thrombin activatable fibrinolysis inhibitors play a crucial role in the regulation of the complement system and can cause adventitial inflammation (Satoh et al., 2017). Growing evidence suggests that the alternative complement system plays a role in the regulation of atherosclerosis (Gursoy Calan et al., 2016; Ohtsuki et al., 2019). In CKD patients, abnormalities of coagulation occur and may cause blood hypercoagulability and thrombosis of the vascular access (Huang et al., 2017; Cheung et al., 2018). The reasons for these disorders are complex and involve hypoalbuminemia, hyperlipidemia, and fibrinolytic system dysfunction (Molino et al., 2006). The mechanisms and severity of complement and coagulation cascades affecting atherosclerosis development deserve further investigation.
Hub proteins belonging to the interested modules that might play important roles in CKD-related atherosclerosis were finally identified, some of which were particularly interesting. For instance, RBP4, a plasma transport protein that delivers retinol from the liver to the tissues, may play an important role in CAD through its involvement in the progression of inflammatory mechanisms in adipose and vascular tissues (Farjo et al., 2012). Numerous studies have reported similar results of elevated circulating RBP4 levels being related to CAD, and thus considered RBP4 as a biomarker for subclinical atherosclerosis (Ingelsson and Lind, 2009; Stuck and Kahn, 2009; Lambadiari et al., 2014; Liu et al., 2015; Guan and Yang, 2016; Sun et al., 2019). In vitro studies showed that elevated RBP4 levels promoted aberrant vascular smooth muscle cell proliferation and migration, which contributed to the formation of atherosclerotic plaques (Li et al., 2014).
Moreover, RBP4 activated cholesterol uptake to enhance foam cell formation, thereby accelerating the progression of atherosclerosis (Liu et al., 2017). Another study revealed that hub protein IGFBP has multiple functions for the pathological conditions of atherosclerosis by binding to IGFs with high affinity and specificity (Hoeflich et al., 2018). Studies have suggested that intact IGFBP4 is actively involved in the development of atherosclerosis (Postnikov et al., 2012; Hjortebjerg et al., 2015, 2017; Konev et al., 2015), with high expression levels in aortic lesions (Conover et al., 2010). Increased expression of IGFBP6 after prolonged hypoxia has been observed in vascular endothelial cells (Zhang et al., 2012), and IGFBP6 has been shown to be markedly downregulated in unstable human carotid plaques and plasma (Liu et al., 2020). Detailed descriptions of hub proteins are listed in Table 3.
Detailed Descriptions of Hub Proteins Revealed by Weighted Correlation Network Analysis
AMBP, alpha1-microglobulin/bikunin precursor; ANG, angiogenin; B2M, β2-microglobulin; CFD, complement factor D; eGFR, estimated glomerular filtration rate; Fg, fibrinogen chain; IGFBP, insulin-like growth factor-binding protein; PGDS, prostaglandin-D2 synthase; RBP4, retinol-binding protein 4; RNase, ribonuclease.
In conclusion, based on quantitative DIA MS proteomics and WGCNA, our study supports the idea that different mechanisms are involved in the formation of atherosclerotic plaque under CKD conditions—most interestingly, inflammation and the complement and coagulation cascades. The effects of DEPs and hub proteins revealed in our study on CKD-related atherosclerosis require further investigation. Increased knowledge on the pathogenesis of CKD-related atherosclerosis may open the possibility for its prevention.
Footnotes
Authors' Contributions
D.D., Z.Z., and S.F. performed the experimental research; Z.Z., J.Y., S.F., and J.Z. performed the clinical study (SS analysis, biochemical investigation); D.D., Z.C., and J.Z. analyzed data and prepared the article; H.L. and R.Z. designed the project. All authors read and approved the final version of the article.
Disclosure Statement
No competing financial interests exist.
Funding Information
This work was supported by the National Natural Science Foundation of China (81670389). The funders had no role in the study design, data collection, analysis, decision to publish, or preparation of the article.
Supplementary Material
Clinical Data
Supplementary Figure S1
Supplementary Figure S2
Supplementary Table S1
References
Supplementary Material
Please find the following supplemental material available below.
For Open Access articles published under a Creative Commons License, all supplemental material carries the same license as the article it is associated with.
For non-Open Access articles published, all supplemental material carries a non-exclusive license, and permission requests for re-use of supplemental material or any part of supplemental material shall be sent directly to the copyright owner as specified in the copyright notice associated with the article.