




Abstract
N-cadherin (cadherin-2 [CDH2]) is widely known as the promoter of prostate cancer (PCa) invasion and castration resistance. However, the biological mechanism of N-cadherin in PCa progression is unclear. In this study, we overexpressed N-cadherin in LNCaP cells and downregulated N-cadherin in PC3 cells by lentiviral transduction. Then, differentially expressed genes (DEGs) and dysregulated biological functions were investigated through RNA sequencing (RNA-seq) analyses. We found 13 long noncoding RNA (lncRNA) transcripts, 72 messenger RNA (mRNA) transcripts, and 3 integrated genes were dysregulated by N-cadherin. In the disease enrichment, bone cancer, and neurodegenerative and nervous system diseases were associated with N-cadherin in the circular RNA (circRNA; PC3 versus [vs.,/] LNCaP [PC3/LNCaP] comparison) and DEG analysis (LNCaP_oe_CDH2 vs. LNCaP_oe_NC [LNCaP_oe_CDH2/NC] comparison). Epigenetic reprogramming, such as nucleic acid binding, and chromatin and histone modifications, was enriched in Gene Ontology (GO) analysis (DEGs in LNCaP_oe_CDH2/NC and PC3_sh_NC/CDH2, and host genes of circRNA in PC3/LNCaP). Transcriptional misregulation in cancer, post-translational protein modification, gene expression, and generic transcription pathways were dysregulated in the pathway enrichment analysis (host genes of circRNA in PC3/LNCaP, and DEGs in LNCaP_oe_CDH2/NC and PC3_sh_NC/CDH2). Verifying DEGs through TCGA-PRAD dataset revealed six oncogenes (ARHGEF1, GRAMD1A, GTF2H4, MAPK8IP3, POLD1, and PTBP1) that were commonly upregulated by N-cadherin and in advanced PCa stages. In summary, we identified several oncogenes and biological functions associated with N-cadherin expression in PCa cells. N-cadherin may trigger epigenetic reprogramming in PCa cells to promote tumor progression.
Introduction
Prostate cancer (PCa) is a common malignant tumor in older men (Siegel et al., 2022). Most metastatic or locally advanced PCa has been treated primarily with androgen deprivation therapy (ADT). However, after a period of treatment, PCa progresses to castration-resistant PCa (CRPC), which is the main cause of cancer-specific death and lacks effective therapy. Further research is needed to elucidate the biological mechanism underlying PCa progression.
Transmembrane proteins such as Nectin-4 are related to oncogenesis in multiple cancers, including urothelial cancer, and they are the therapeutic target of enfortumab vedotin, which has been confirmed to produce high response rates in clinical trials (Samanta and Almo, 2015; Hurov et al., 2021; Yu et al., 2021). This finding suggests the crucial role of transmembrane proteins in human cancer progression and their extremely high application value in clinical treatment. N-cadherin (also known as cadherin-2, CDH2) is a transmembrane protein that mediates cell migration and cell–cell adhesion (Labernadie et al., 2017). In PCa, N-cadherin promotes cell migration and invasion and advances the epithelial to mesenchymal transition (EMT) (Jennbacken et al., 2010; Cui and Yamada, 2013; Wang et al., 2016).
After androgen deprivation, the expression of N-cadherin is significantly upregulated and subsequently induces PCa progression and a poor prognosis (Jaggi et al., 2006; Gravdal et al., 2007; Jennbacken et al., 2010; Tanaka et al., 2010; Nalla et al., 2011; Sun et al., 2012; Miao et al., 2017; Cai et al., 2020). In our previous study, N-cadherin promoted PCa progression, and the potential mechanism included the EMT and neuroendocrine PCa (NEPC) transformation by epigenetically regulating androgen receptor (AR)/NDRG1 signaling (Quan et al., 2021). Therefore, N-cadherin is a key regulator of CRPC progression, and several potential pathways may be involved in this process.
Although the crucial role of N-cadherin has been described in previous studies, few studies have elucidated the molecular mechanism regulated by N-cadherin. Wang et al. (2016) reported that N-cadherin promotes the expression of stemness factors such as c-Myc, Klf4, Sox2, and Oct4. Furthermore, N-cadherin activates the ErbB signaling pathway by inducing the expression of Grb2, pShc, and pERK1/2. In PCa, the lack of an N-terminus of α-catenin triggers N-cadherin-induced cell invasion (Cui and Yamada, 2013). Nalla et al. (2011) found that N-cadherin induces the expression of monocyte chemoattractant protein-1 (MCP-1) by PI3K/Akt signaling to mediate angiogenesis in PCa. According to our previous study, N-cadherin promotes CRPC progression through AR/NDRG1 signaling, which further promotes N-cadherin expression and forms a vicious cycle (Quan et al., 2021).
In this study, we hypothesized that, in addition to AR/NDRG1 signaling, diverse and complex pathways may be involved in N-cadherin-regulated PCa progression. We used a representative androgen-dependent PCa cell line (LNCaP) and a CRPC cell line (PC3) to further determine the complexity and heterogeneous biological mechanisms activated during PCa progression. LNCaP cells exhibit negligible expression of N-cadherin, and PC3 cells overexpress N-cadherin (Quan et al., 2021). We overexpressed N-cadherin in LNCaP cells and downregulated N-cadherin in PC3 cells through lentiviral transduction. Then we conducted RNA sequencing (RNA-seq) to analyze differentially expressed genes (DEGs) and further analyzed the dysregulated pathways and metabolism through enrichment analyses. The aim of this study was to screen and determine the crucial genes and biological mechanisms regulated by N-cadherin, which led to PCa progression.
Materials and Methods
Workflow of this study
In this study, N-cadherin was overexpressed in LNCaP cells (oe_CDH2, with oe_NC as the negative control and Ctrl as parental cells) and downregulated in PC3 cells (sh_CDH2, with sh_NC as the negative control and Ctrl as parental cells). The efficiency of gene regulation was confirmed in our previous study (Quan et al., 2021). Then we performed RNA-seq to extract the expression values and analyzed the DEGs at the comparisons between N-cadherin upregulation versus downregulation in circular RNA (circRNA), long noncoding RNA (lncRNA), and messenger RNA (mRNA) levels. The biological functions and signaling pathways were analyzed through the analysis of enrichment, circRNA-targeted microRNAs (miRNAs), and prediction of transcription factor binding sites. The screened key genes were finally verified using TCGA-PRAD dataset. The workflow of this study is summarized in Figure 1.
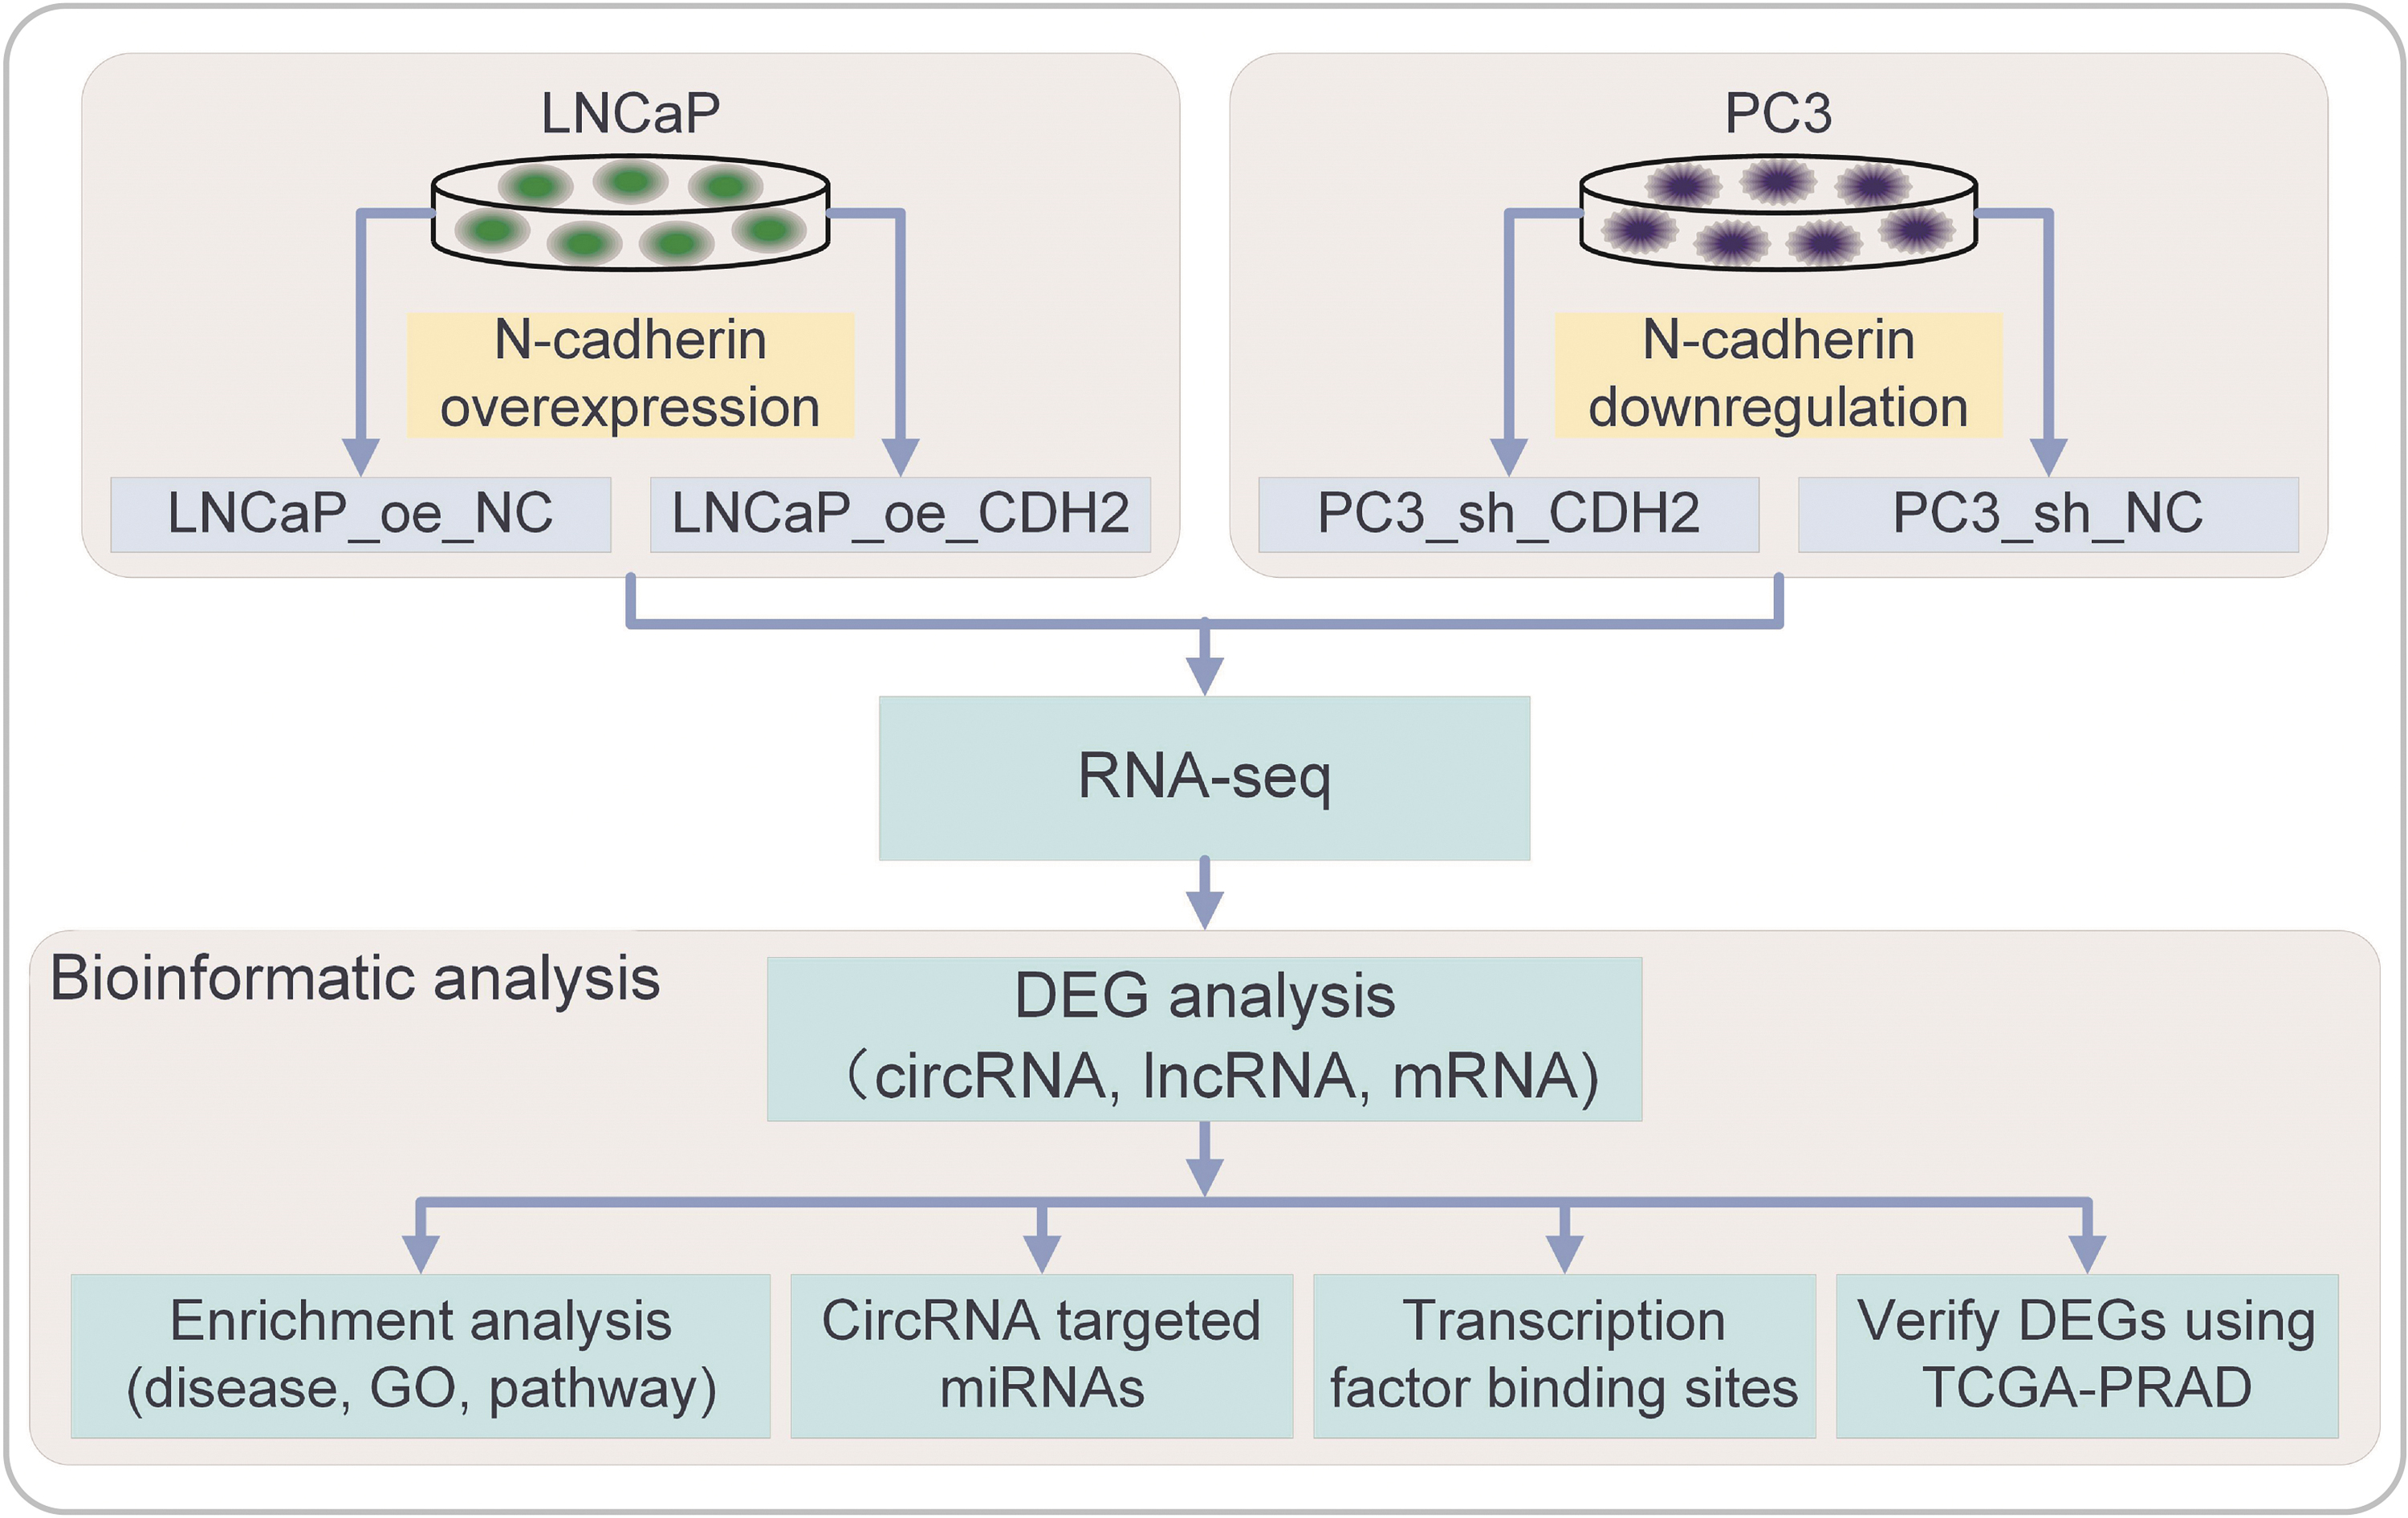
Workflow of this study. N-cadherin was overexpressed in LNCaP cells (oe_CDH2, with oe_NC as the negative control and Ctrl as parental cells) and downregulated in PC3 cells (sh_CDH2, with sh_NC as the negative control and Ctrl as parental cells). Then RNA-seq was carried out to extract the expression values and the DEGs were analyzed at the comparisons between N-cadherin upregulation versus downregulation in crcRNA, lncRNA, and mRNA levels. The biological functions and signaling pathways were analyzed through the analysis of enrichment, circRNA-targeted miRNAs, and prediction of transcription factor binding sites. The screened key genes were finally verified using TCGA-PRAD dataset. CDH2, cadherin-2; circRNA, circular RNA; DEG, differentially expressed gene; lncRNA, long noncoding RNA; miRNA, microRNA; mRNA, messenger RNA; RNA-seq, RNA sequencing.
Cell culture
The LNCaP and PC3 cell lines were obtained from American Type Culture Collection (ATCC, Rockville, MD). The cells were cultured in RPMI-1640 medium supplemented with 10% fetal bovine serum (FBS; HyClone, South Logan, UT) and 1% antibiotic-antimycotic (AA; Gibco, Grand Island, NY) at 37°C in a humidified atmosphere containing 5% CO2.
Gene regulation in PCa cell lines
Overexpression or downregulation of N-cadherin in PCa cells was induced through lentiviral transduction. Lentiviruses harboring N-cadherin gene vectors or specific short hairpin RNA (shRNA) sequences were generated by GENECHEM (Shanghai, China). LNCaP or PC3 cells were infected with lentiviruses using 5 μg/mL polybrene and selected with 1–2 μg/mL puromycin.
RNA extraction and quality evaluation
TRIzol™ reagent (Invitrogen, Carlsbad, CA) was used to extract total RNA. The RNA integrity was evaluated with an Agilent 2100 Bioanalyzer (Agilent Technologies, Santa Clara, CA). An RNA integrity number (RIN) ≥7.0 and a 28S:18S ratio ≥1.5 were regarded as qualified RNA, and subsequent experiments were then conducted. The RNA concentration was evaluated using a Qubit RNA Assay Kit with a Qubit Fluorometer (Invitrogen). The initial dose range of total RNA for library construction was 1–10 μg for small RNAs and 2–3 μg for mRNA.
RNA-seq analysis
As previously reported, RNA-seq analysis was performed by Beijing CapitalBio Technology Co., Ltd. (Beijing, China) (Li et al., 2018). Ribosomal RNA (rRNA) was removed using a Ribo-Zero™ Magnetic Kit (Epicentre Technologies, Madison, WI). The libraries for sequencing were constructed using the NEBNext Ultra RNA Library Prep Kit for Illumina (New England Biolabs [NEB]) according to the manufacturer's protocol. RNA was fragmented into pieces (∼300 base pairs [bp]) using NEBNext First Strand Synthesis Reaction Buffer (5 × ). First-strand complementary DNAs (cDNAs) were synthesized from the RNA fragments using reverse transcriptase and random hexamer primers. Second-strand cDNAs were synthesized with Second Strand Synthesis Reaction Buffer with dUTP Mix (10 × ).
The ends of cDNA fragments were subjected to an end repair process that included a single “A” base addition, followed by ligation of adapters. The second-strand cDNAs were digested using USER Enztme (NEB) after the ligation of Illumina sequencing adaptors to construct a chain-specific library. Then the libraries were purified and amplified using polymerase chain reaction (PCR), qualified by an Agilent 2100 instrument, and quantified using a KAPA Library Quantification Kit (KAPA Biosystems). Finally, paired-end sequencing was performed using libraries with paired-end 150 bp read lengths on an Illumina HiSeq sequencer (Illumina, San Diego, CA).
Bioinformatics analyses
The sequencing quality of raw data was assessed using FastQC software (v0.11.2) (Brown et al., 2017). NGSQC software (v2.3.2) was used to filter low-quality data (Dai et al., 2010). The filtered reads were aligned to the human reference genome (GRCh38/hg38) using TopHat2 software (v2.0.13) (Kim et al., 2013). The circRNAs were predicted using Find_circ (v1.0) (Jeck et al., 2013) and CIRCexplorer2 software (v2.3.0) (Zhang et al., 2016), and target miRNAs were predicted using miRanda (v3.3a) (Shen et al., 1997) and TargetFinder (Bo and Wang, 2005). In the lncRNA prediction, the assembled unknown transcript was used for further encoding capability filtering through Stringtie (v1.3.3) (Pertea et al., 2015) software. CPC (0.9r2) (Kong et al., 2007), Coding-Non-Coding Index (CNCI) (Sun et al., 2013), and HMMER (3.1b1) (Finn et al., 2011) were used to predict encoding capability. Novel lncRNA was identified if no encoding capability was predicted by all the three softwares.
In the DEG analyses, DESeq (1.28.0) (Anders and Huber, 2010) package was utilized for lncRNA and mRNA comparisons and edgeR (3.18.1) (Zhou et al., 2014) package was utilized for circRNA comparisons. Absolute value of log base 2 (log2) fold change (FC) (|log2 FC|) ≥1 and p-value ≤0.05 were used as statistical cutoffs to select DEGs. The Circos plot was drawn using Circos software (v0.67-7) (Krzywinski et al., 2009).
Disease, Gene Ontology (GO), and pathway enrichment analyses of DEGs were performed through KOBAS 3.0 (Wu et al., 2006; Xie et al., 2011) and related databases and the results with 30 lowest p value were listed as dot plot. In disease enrichment analysis, databases of OMIM (
The JASPAR database (Vlieghe et al., 2006) and R package of TFBSTools (v3.3.2) (Tan and Lenhard, 2016) were used to analyze transcription factor-binding sites. All interaction networks were constructed using Cytoscape software (Su et al., 2014).
The intersected N-cadherin-related genes were verified using data from The Cancer Genome Atlas (TCGA) database. TCGA database was downloaded from the GDC Data Portal (
Statistical analysis
Statistical analyses were conducted using R software (4.0.3) and GraphPad Prism 9.0 (GraphPad Software, La Jolla, CA). Categorical variables were analyzed using chi-square or Fisher's exact tests, and continuous variables were analyzed using Wilcoxon or Kruskal–Wallis tests. Pearson's and Spearman's correlation analyses were performed to assess the correlations between two variables. Survival was evaluated through the log-rank test of Kaplan–Meier analysis and hazard ratio (HR) of the univariate Cox regression analysis. p < 0.05 was identified as statistically significant.
Results
Differential expression profiles of circRNAs in PCa cells with different N-cadherin expression levels
We initially evaluated the different expression patterns of circRNAs regulated by N-cadherin and their biological functions in LNCaP and PC3 cells with different N-cadherin expression levels. A total of 2205 circRNAs were detected in 6 PCa cell lines. The Circos plot shows that the circRNAs were widely distributed in autosomes, but rarely located on sex chromosomes (Fig. 2A). An intercell correlation analysis based on the value of the correlation coefficient (R) of circRNAs was conducted and the results are shown in a heat map in which obvious correlations were observed in pairwise comparisons between LNCaP cells (but not in PC3) and N-cadherin-regulated cells (Fig. 2B).
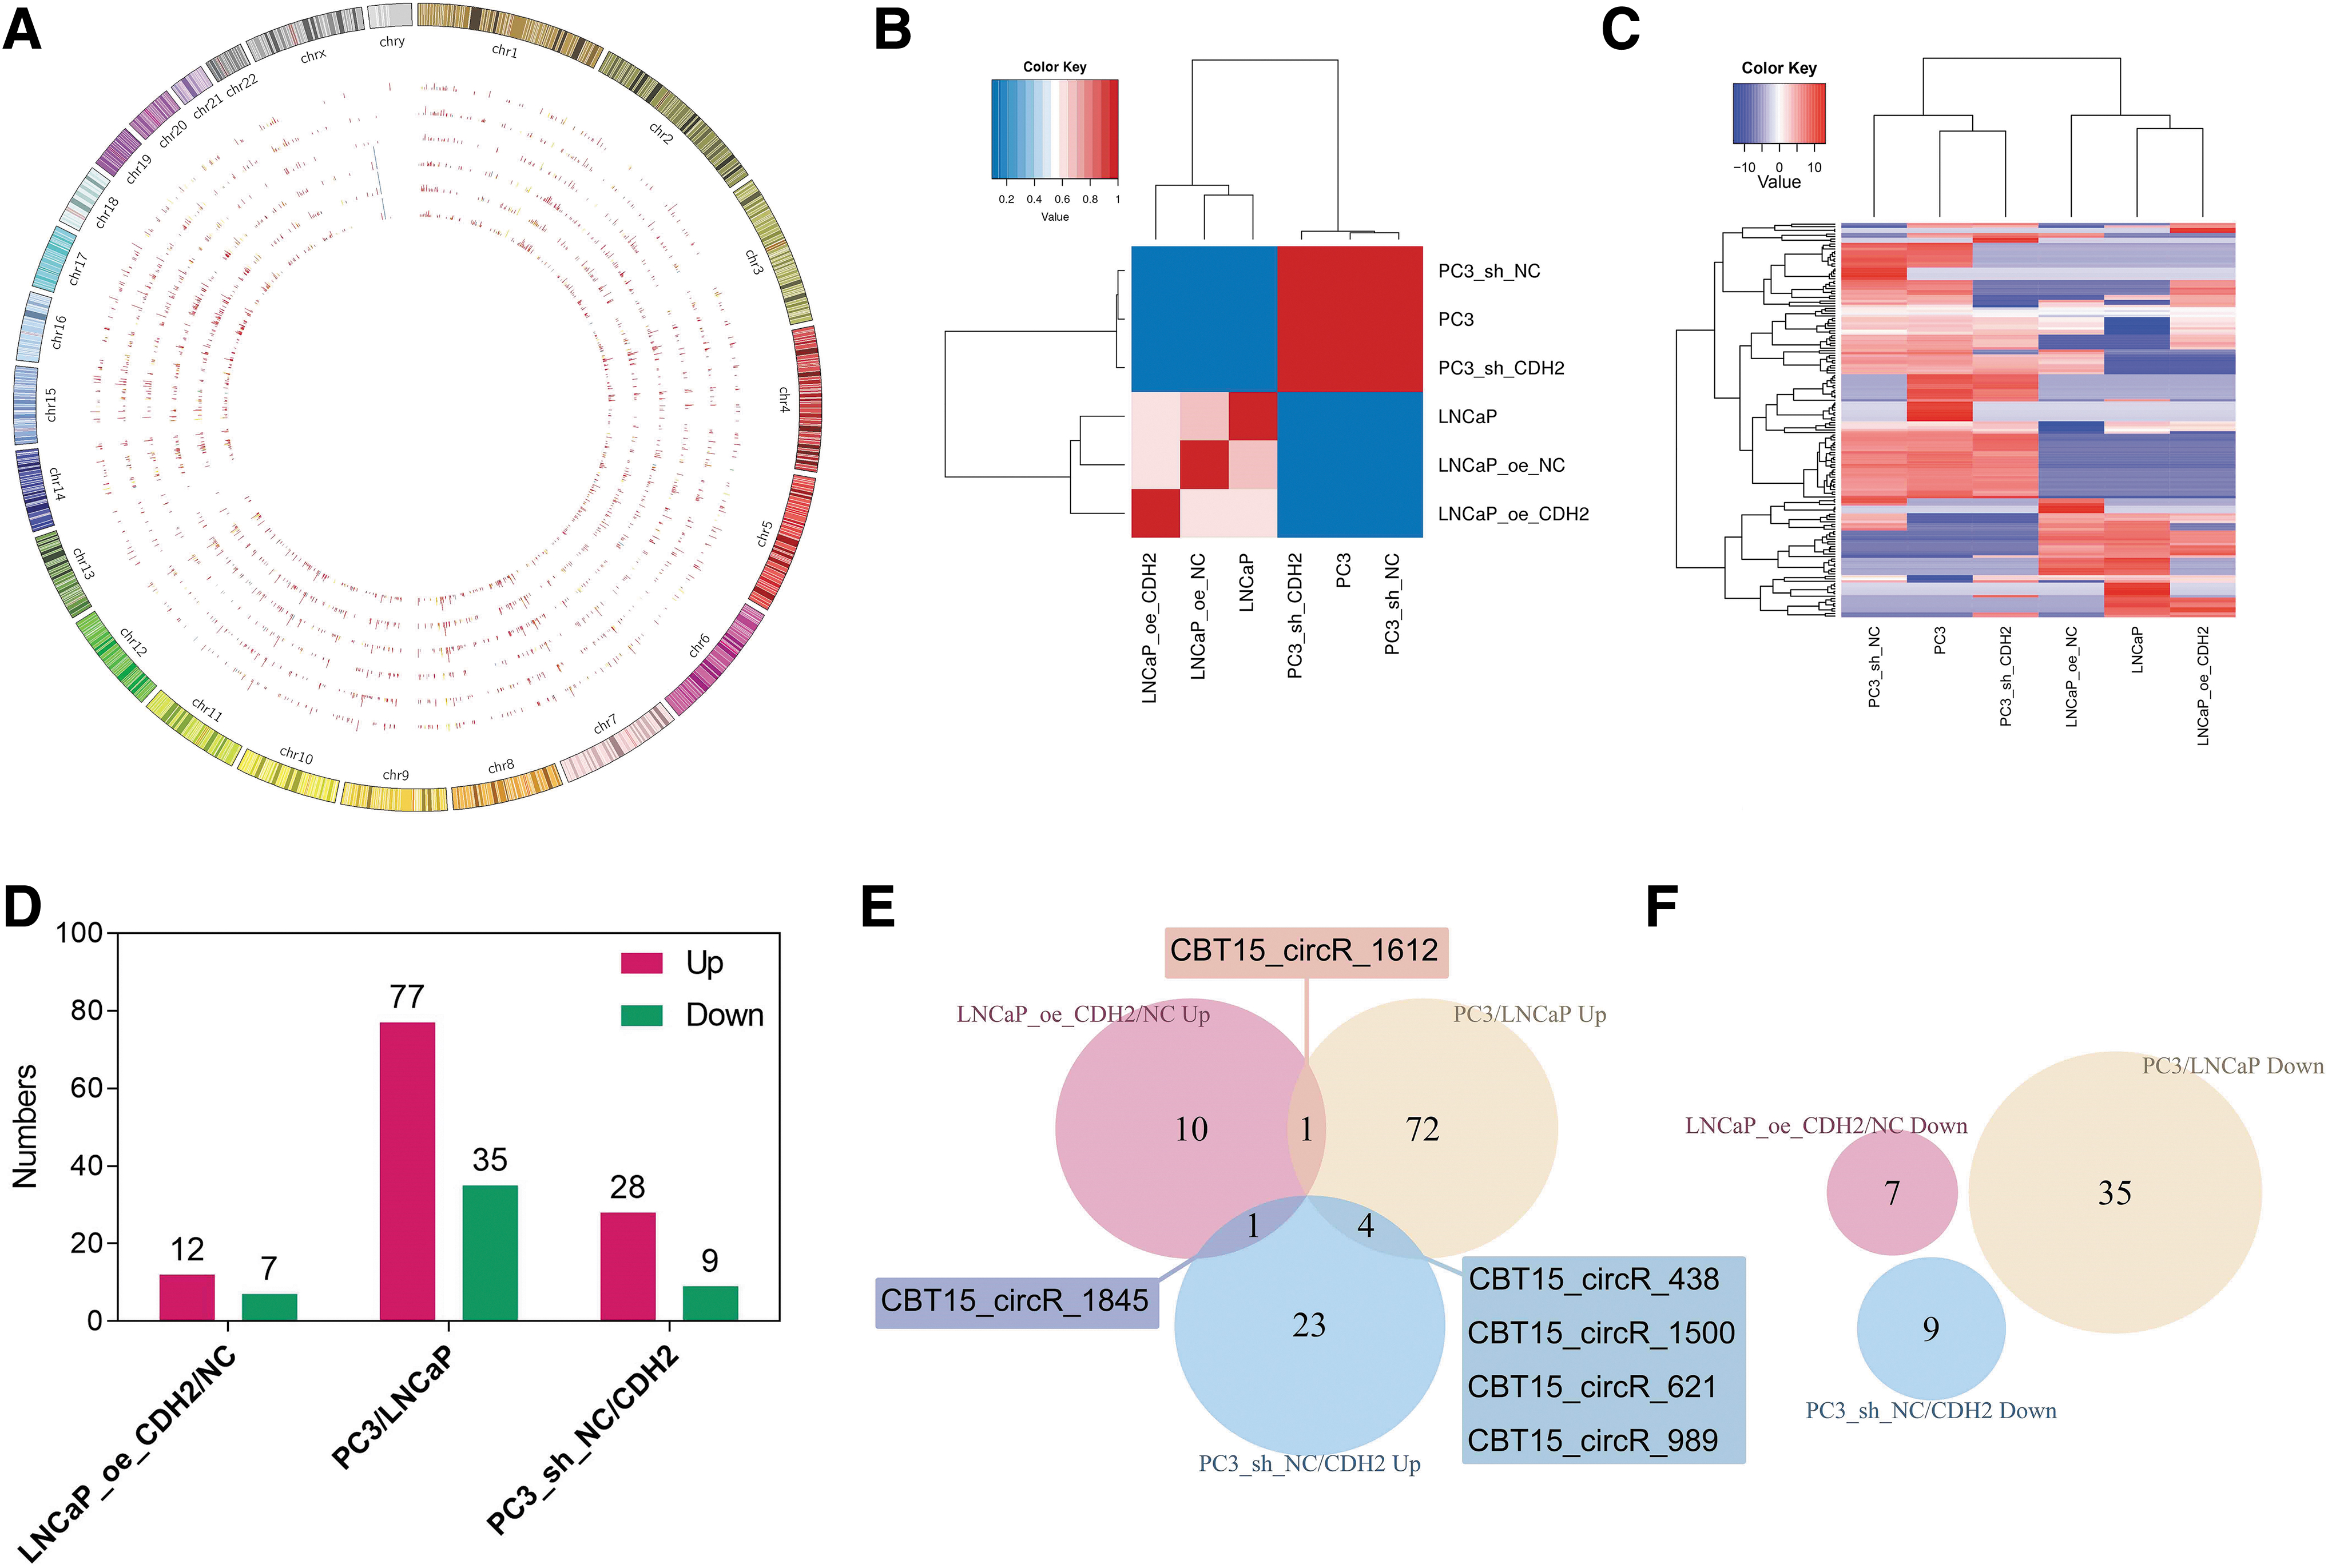
Differentially expressed circRNAs in PCa cells with altered N-cadherin expression.
N-cadherin-regulated LNCaP or PC3 cells were differently clustered with their respective negative control and parental cells (Fig. 2B), suggesting that the level of N-cadherin influences the whole correlation of circRNA levels in PCa cell lines. In the hierarchical clustering analysis based on the union of differentially expressed circRNAs in LNCaP_oe_CDH2 versus (vs., also shown as “/”) NC, PC3/LNCaP, and PC3_sh_NC/CDH2 comparisons, the expression patterns of circRNAs were distinguishable between LNCaP and PC3 cells, but not with their respective N-cadherin-regulated cells (Fig. 2C). Among the comparisons of increased and reduced N-cadherin levels (in the comparisons of LNCaP_oe_CDH2/NC, PC3/LNCaP, and PC3_sh_NC/CDH2), more circRNAs were upregulated in cell lines with N-cadherin overexpression (Fig. 2D).
The intersecting circRNAs were identified in a Venn diagram, but none of them intersected for the three comparisons, and six circRNAs (CBT15_circR_1500, CBT15_circR_1612, CBT15_circR_1845, CBT15_circR_438, CBT15_circR_621, and CBT15_circR_989) intersected in the upregulation of two comparisons (Fig. 2E, F). The expression level of CBT15_circR_1845 was upregulated in both LNCaP_oe_CDH2/NC and PC3_sh_NC/CDH2 comparisons (p < 0.05), and the log2 FC was 5.02 in the comparison of PC3 and LNCaP cells (p = 0.16). CBT15_circR_989 was also significantly upregulated in the comparison of PC3_sh_NC/CDH2 and PC3/LNCaP cells (p < 0.05), and the log2 FC in LNCaP_oe_CDH2/NC cells was 4.52 (p = 0.29). Thus, CBT15_circR_1845 and CBT15_circR_989 may be potential circRNAs that are positively regulated by N-cadherin, which warrant further verification. In summary, we screened several circRNAs whose expression was affected by N-cadherin.
CircRNA-miRNA interactions and enrichment analyses of differentially expressed circRNAs in LNCaP and PC3 cells
CircRNAs have been reported to function as miRNA sponges that adsorb miRNA and regulate gene expression (Liu et al., 2017; Han et al., 2018). Therefore, we predicted the target miRNAs of circRNAs using miRanda software (v3.3a) to evaluate circRNA-modulated miRNAs and their interactions. In the hierarchical clustering analysis described above, the expression of N-cadherin-dysregulated circRNAs did not distinguish the cluster of LNCaP or PC3 cells from their N-cadherin-regulated cells (Fig. 2C). The low number of differentially expressed circRNAs in the comparison of LNCaP_oe_CDH2/NC and PC3_sh_NC/CDH2 cells did not produce convincing results in the enrichment analysis (Fig. 2D and Supplementary Figures S1 and S2).
Therefore, we compared LNCaP and PC3 cells instead of comparing them with their respective N-cadherin-regulated cells. In the interaction network of differentially expressed circRNAs and their target miRNAs, most of miRNAs were targeted by CBT15_circR_402 and CBT15_circR_1809 (node degree >100) (Supplementary Fig. S3A and Supplementary Table S1).
Then, disease, GO, and pathway enrichment analyses of host genes of differentially expressed circRNAs were performed to evaluate the biological functions of these circRNAs. In the disease enrichment analysis, cancers of soft tissues and bone, which are related to PCa metastasis, were significantly associated with the host genes of differentially expressed circRNAs (Supplementary Fig. S3B and Supplementary Table S2).
The GO enrichment analysis showed that protein tyrosine kinase activity, chromatin modification and organization, and histone modification were the potential dysregulated functions (Supplementary Fig. S3C and Supplementary Table S3). The pathway enrichment analysis suggested that FoxO signaling, transcriptional misregulation in cancer, and post-translational protein modification were significantly associated with host genes of differentially expressed circRNAs in LNCaP and PC3 cells (Supplementary Fig. S3D and Supplementary Table S4). Therefore, alterations in the transcription of key PCa-related genes through histone and chromatin dysregulation mediated by differentially expressed circRNAs may be involved in PCa progression.
Differential expression profiles of lncRNA transcripts in N-cadherin-regulated PCa cells
The different expression patterns of lncRNA transcripts regulated by N-cadherin were evaluated to determine the potential biological functions involved during PCa progression. A total of 30,119 lncRNA transcripts were detected in 6 PCa cell lines. The differentially expressed lncRNAs in the comparison of LNCaP_oe_CDH2/NC, PC3/LNCaP, and PC3_sh_NC/CDH2 are shown in the Circos plot (Fig. 3A). The intercell correlation analysis of lncRNAs exhibited differences in clustering based on N-cadherin expression in both LNCaP and PC3 cells, suggesting that N-cadherin influences the correlation of these cells by modulating the expression of the whole lncRNA profile (Fig. 3B). Hierarchical clustering analysis with unions of differentially expressed lncRNAs in the comparison of cells with increased and reduced N-cadherin levels showed that N-cadherin expression determined the clusters in PC3 cells, but not in LNCaP cells (Fig. 3C).
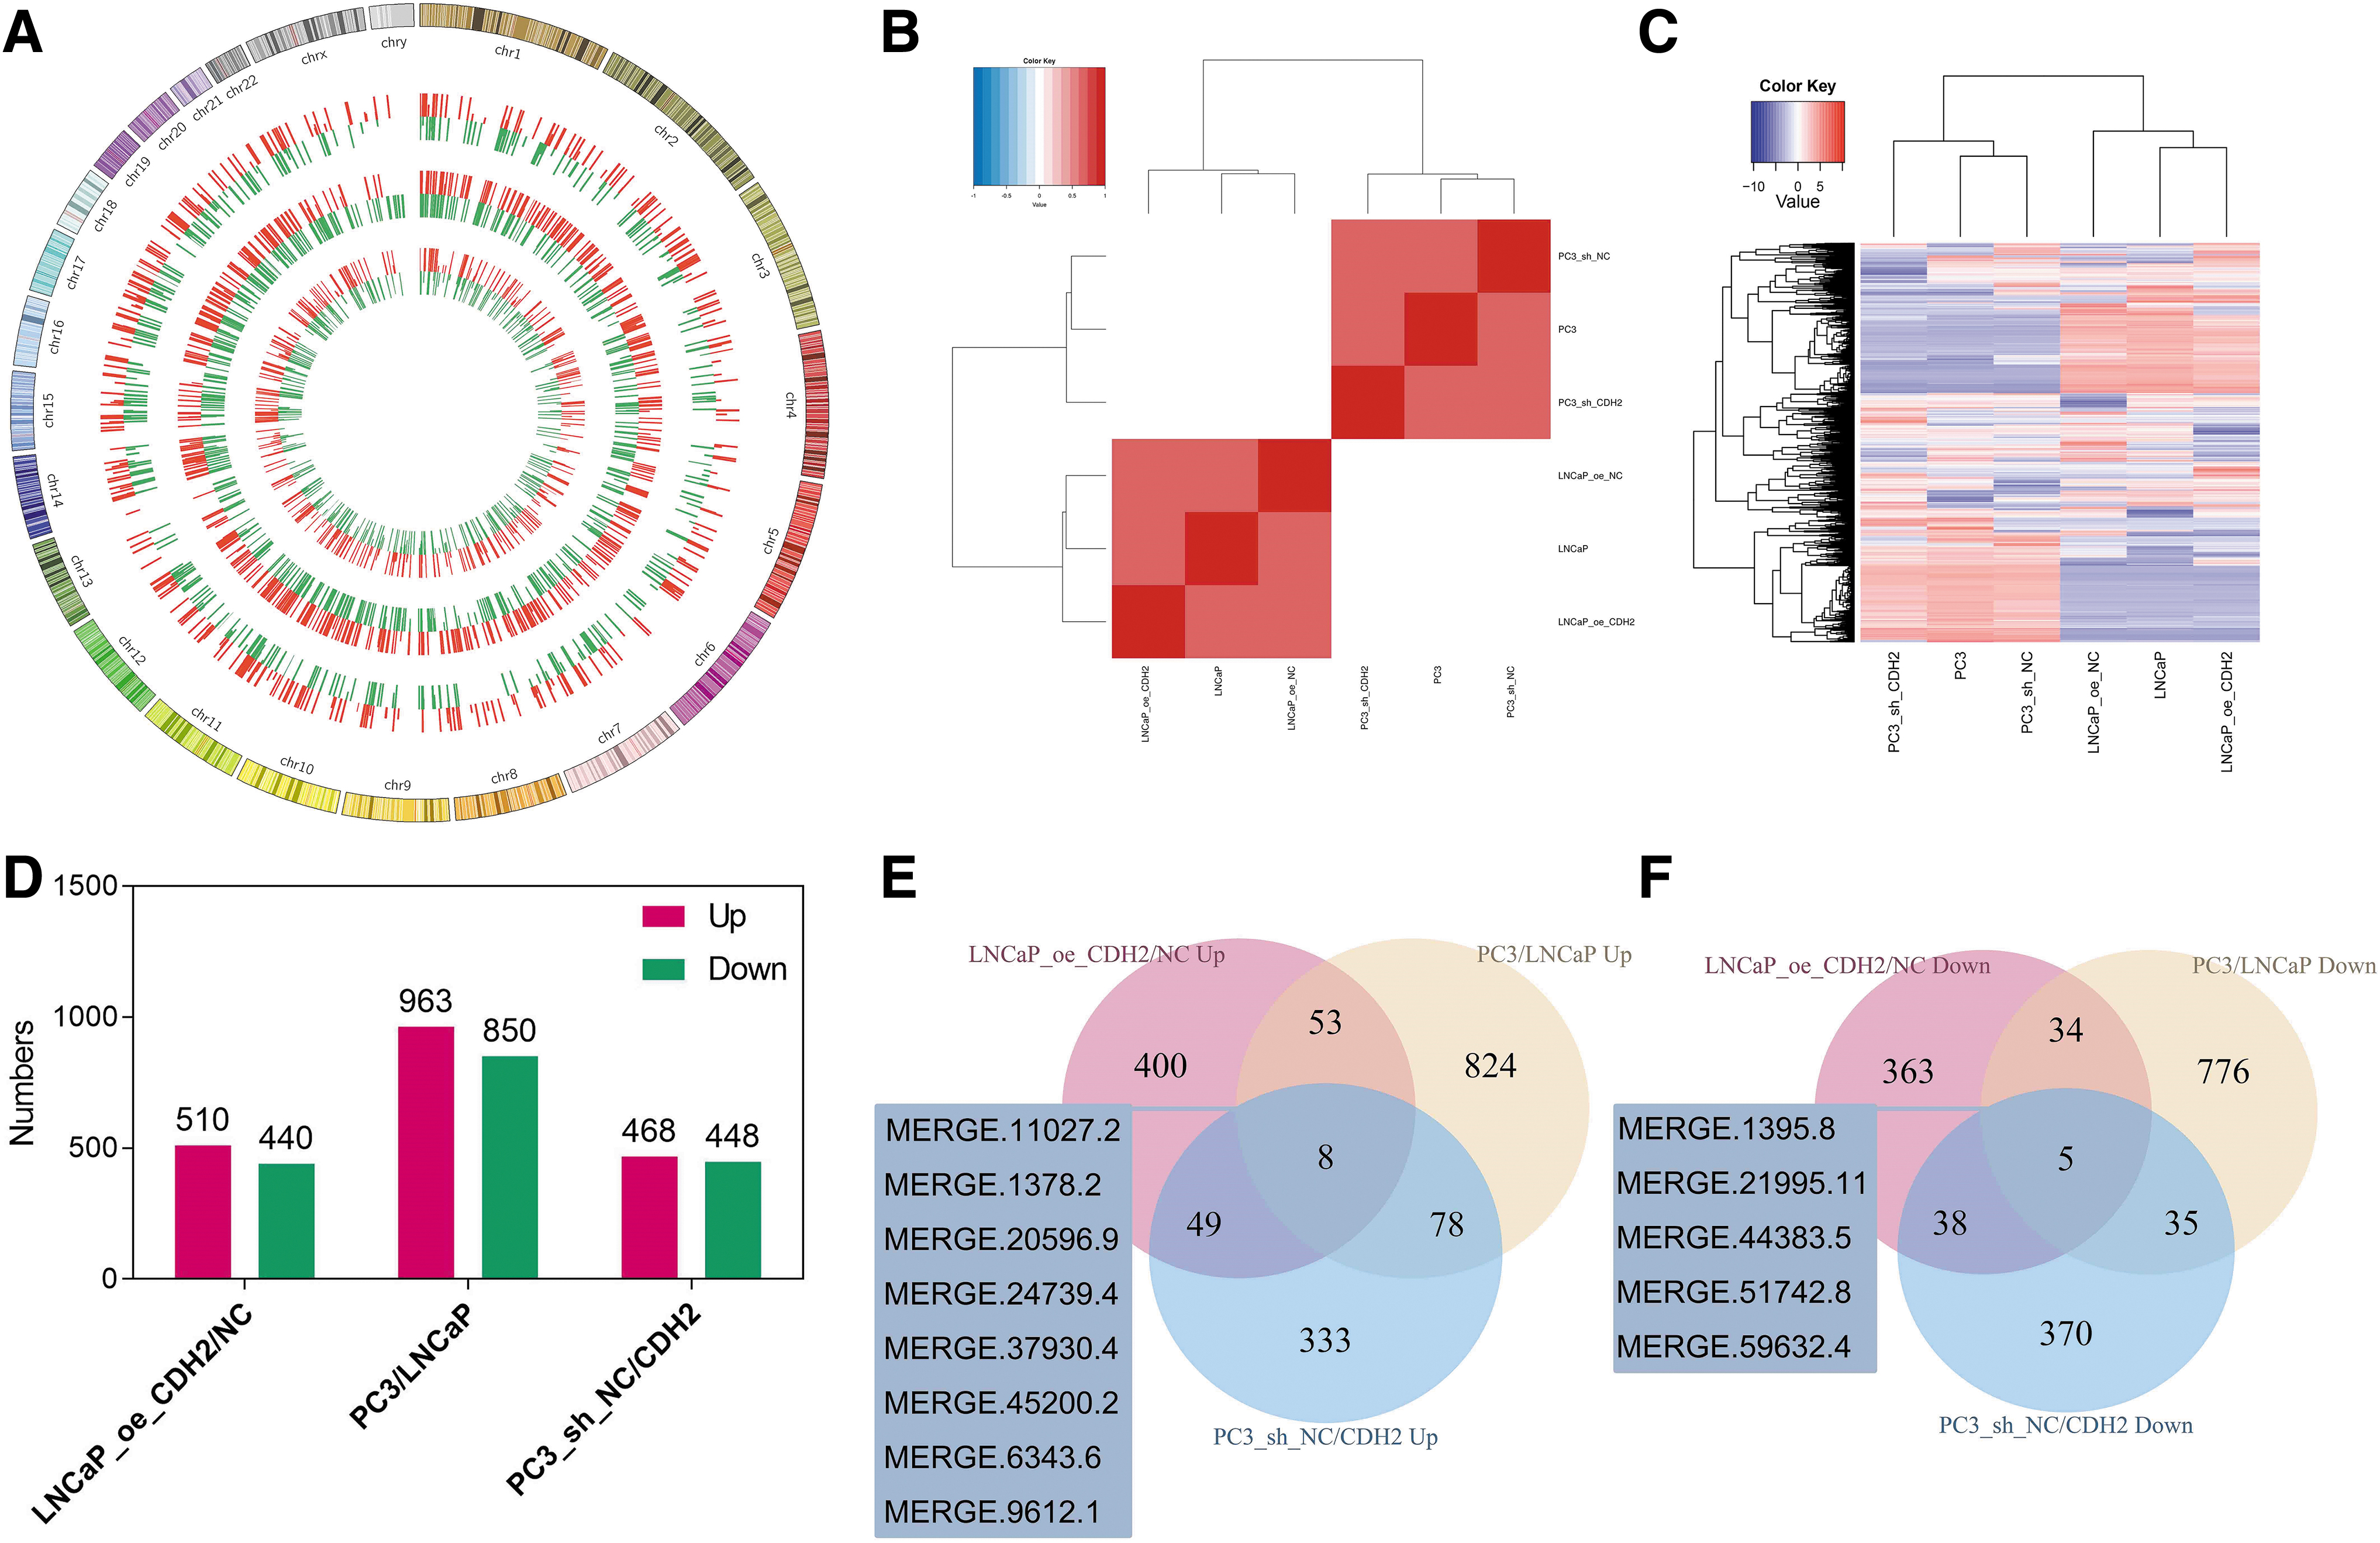
Differentially expressed lncRNA transcripts in PCa cells with different levels of N-cadherin expression.
Among the pairwise comparisons mentioned above, lncRNAs were equally upregulated or downregulated in cell lines by N-cadherin (Fig. 3D). Thirteen intersecting lncRNAs were identified in the three comparisons, among which eight (MERGE.11027.2, MERGE.1378.2, MERGE.20596.9, MERGE.24739.4, MERGE.37930.4, MERGE.45200.2, MERGE.6343.6, and MERGE.9612.1) were upregulated and five (MERGE.1395.8, MERGE.21995.11, MERGE.44383.5, MERGE.51742.8, and MERGE.59632.4) were downregulated following N-cadherin overexpression (Fig. 3E, F and Table 1). In summary, we screened several lncRNAs, and a subsequent mRNA analysis is needed to predict the biological functions of these lncRNAs in N-cadherin-mediated PCa progression.
Differentially Expressed Long Noncoding RNAs, Messenger RNAs, and Integrated Genes in the Comparison of Cells with N-Cadherin Upregulation and Downregulation
CDH2, cadherin-2; lncRNA, long noncoding RNA; mRNA, messenger RNA.
Differential expression profiles of mRNA transcripts in N-cadherin-regulated PCa cells
Most epigenetic modifications and gene mutations manifest as dysregulation of target mRNAs, which finally leads to dysfunction of translated proteins. The different mRNA expression patterns mediated by N-cadherin were estimated in this experiment. A total of 103,069 mRNA transcripts were detected in 6 PCa cell lines. A Circos plot of DEGs shows the wide distribution of mRNAs on autosomes and the X sex chromosome but rarely located on the Y sex chromosome (Fig. 4A). The intercell correlation analysis suggested that N-cadherin expression determined the clusters of six PCa cells based on the R values for total mRNA levels (Fig. 4B).

Differentially expressed mRNA transcripts in N-cadherin-regulated PCa cells.
Hierarchical clustering analysis with the differentially expressed mRNAs mentioned above also showed that the expression levels of N-cadherin separated the clusters in LNCaP and PC3 cells from their N-cadherin-regulated cells (Fig. 4C). Among the pairwise comparisons, 72 intersecting mRNAs were identified in the 3 comparisons, of which 49 were upregulated and 23 were downregulated upon N-cadherin overexpression (Fig. 4D–F and Table 1). These screened mRNAs and lncRNAs are useful for further predictions of biological dysfunction using correlation and enrichment analyses.
Analysis of lncRNA target genes and transcription factor prediction
The mechanism of PCa progression mediated by N-cadherin-regulated lncRNA–mRNA interactions was evaluated by analyzing predicted targets of lncRNAs through the construction of a coexpression network of differentially expressed lncRNAs and mRNAs (Supplementary Figs. S4–S6). In the comparison of LNCaP_oe_CDH2/NC cells, the lncRNA SNHG4 was associated with the most mRNAs (45), and mRNAs such as CHST12, VPS53, and PNPO were coexpressed with ≥9 lncRNAs (Supplementary Fig. S4A and Supplementary Table S5).
Then we predicted the biological processes in which the dysregulated lncRNAs and mRNAs were involved by performing enrichment analyses of mRNAs targeted by lncRNAs. In the disease enrichment analysis, cancers of soft tissues and bones were associated with differentially expressed lncRNA targets in the comparison of LNCaP_oe_CDH2/NC (Supplementary Fig. S4B and Supplementary Table S6). The GO analysis showed that EMT-related cellular components (CC), such as intracellular and membrane-bounded organelles, were enriched (Supplementary Fig. S4C and Supplementary Table S7), and proliferation-associated pathways, such as the cell cycle and mitotic were associated with lncRNA target genes (Supplementary Fig. S4D and Supplementary Table S8).
We also performed the same analysis by comparing PC3_sh_NC/CDH2 cells. Notably, mRNAs such as TBCCD1, EIF4E, and COPS7B were connected with ≥10 lncRNAs (Supplementary Fig. S5A and Supplementary Table S9). In the disease enrichment analysis, PCa was associated with differentially expressed lncRNA target genes (Supplementary Fig. S5B and Supplementary Table S10). The intracellular part and membrane-bounded organelle were the potential dysregulated CC in the GO enrichment analysis (Supplementary Fig. S5C and Supplementary Table S11), and the cell cycle and regulation of TP53 activity were identified in the pathway enrichment analysis as associated with differentially expressed lncRNA target genes (Supplementary Fig. S5D and Supplementary Table S12), similar to the result from the LNCaP_oe_CDH2/NC comparison. All enrichment analyses suggest that N-cadherin may promote PCa metastasis and proliferation by regulating the expression of lncRNAs involved in the epigenetic modification of key genes.
In addition, we wished to further assess the mechanism by which N-cadherin regulates lncRNA expression and hypothesized that transcription factors bind to the promoter regions of lncRNA genes and regulate their transcription. We predicted the transcription factors that bind to lncRNA gene sequences at sites ranging from −2000 to +500 bp using the JASPAR database and RFBSTools (Supplementary Fig. S7A–C). In the comparison of LNCaP_oe_CDH2/NC cells, the differentially expressed lncRNAs were mostly regulated by the transcription factors ZNF354C, RHOXF1, ISX, SHOX, DLX6, and MZF1 (node degree ≥80) (Supplementary Fig. S7A and Supplementary Table S13).
The transcription factors were ZNF354C, RHOXF1, MEIS1, FOXL1, and MZF1 in the comparison of PC3_sh_NC/CDH2 cells (node degree ≥80) (Supplementary Fig. S7B and Supplementary Table S14). Most transcription factors (17/20; ZNF354C, RHOXF1, ISX, SHOX, DLX6, MZF1, MEIS1, FOXL1, LHX9, RAX2, UNCX, PDX1, FOXD2, FOXI1, FOXO4, FOXP3, and FOXO6) with a node degree ≥60 were identified in the comparisons of PC3_sh_NC/CDH2 and LNCaP_oe_CDH2/NC cells (Supplementary Fig. S7D). This finding suggests a high consistency and latent possibility of transcription factors that regulate N-cadherin-mediated changes in lncRNA expression in different PCa cell lines.
Differential expression profiles of integrated genes in the N-cadherin-regulated PCa cells
All the lncRNAs and mRNAs analyzed above were based on the levels of transcripts (ensemble transcripts). A gene encodes several transcripts, and we integrated transcript expression and conducted the same analysis at the DEG level. Based on the results, 33,294 genes were detected in 6 PCa cell lines. In the Circos plot of DEGs mentioned above, the genes were widely distributed on autosomes and the X sex chromosome, but rarely located on the Y sex chromosome (Fig. 5A). The intercell correlation analysis and hierarchical clustering analysis mentioned above suggested that the levels of N-cadherin determined the clusters in LNCaP and PC3 cells along with their N-cadherin-regulated cells (Fig. 5B, C).

Differential expression profiles of integrated genes in N-cadherin-regulated PCa cells.
Among pairwise comparisons, genes were equally up regulated or downregulated in cell lines with altered N-cadherin expression (Fig. 5D). Three intersecting genes were identified in the three comparisons, among which one (N-cadherin) was upregulated and two (NUDT4 and ZNF84) were downregulated after N-cadherin overexpression (Fig. 5E, F). N-cadherin was identified as the upregulated intersecting gene, indicating the accuracy of RNA-seq analysis in this study. This analysis identified two stable genes that were negatively regulated by N-cadherin: NUDT4 and ZNF84.
Enrichment analysis of integrated DEGs upon alterations in N-cadherin expression
Enrichment analyses were performed to predict the changes in biological functions induced by N-cadherin-regulated integrated DEGs in the comparison of cells with increased and reduced N-cadherin levels (LNCaP_oe_CDH2/NC, PC3_sh_NC/CDH2 and PC3/LNCaP comparisons) (Supplementary Fig. S8A–I). In the disease enrichment analysis, neurodegenerative diseases and nervous system diseases were associated with DEGs in the LNCaP_oe_CDH2/NC comparison (Supplementary Fig. S8A and Supplementary Table S15). In the PC3_sh_NC/CDH2 comparison, tumors of the reproductive system, such as PCa, penile cancer, and ovarian cancer, were associated with N-cadherin expression (Supplementary Fig. S8B and Supplementary Table S16).
Epigenetic reprogramming is a crucial pathway that is dysregulated in the progression of CRPC (Xiao et al., 2018). We previously reported that epigenetically activating AR/NDRG1 signaling through modifications of histone and DNA methylation suppresses PCa progression (Quan et al., 2020, 2021). In the GO enrichment analysis, nucleic acid binding and nucleoside monophosphate metabolic processes were associated with DEGs in the LNCaP_oe_CDH2/NC comparison, and nucleic acid binding, RNA metabolic processes, and gene expression were dysregulated by DEGs in the PC3_sh_NC/CDH2 comparison (Supplementary Fig. S8D, E and Supplementary Tables S17 and S18). In the pathway enrichment analysis, gene expression and generic transcription pathways were dysregulated by DEGs in comparisons of both LNCaP_oe_CDH2/NC and PC3_sh_NC/CDH2 cells (Supplementary Fig. S8G, H and Supplementary Tables S19 and S20). Thus, N-cadherin may promote PCa progression through the mechanism of transcriptional modification of key genes by DEGs.
The expression patterns of N-cadherin-regulated genes and their association with various clinicopathological characteristics and prognoses of patients in TCGA-PRAD
The N-cadherin-induced differentially expressed mRNA transcripts and integrated genes were verified using TPM of TCGA-PRAD database to make the conclusions of this study more convincing. We summarized 72 intersecting mRNAs that were commonly dysregulated by N-cadherin in LNCaP and PC3 cell lines. Then we conducted DEG analyses by comparing different clinicopathological characteristics (GS and pT stages) and evaluated the prognosis of RFS by performing a survival analysis (Supplementary Tables S21–S24).
The representative commonly dysregulated genes among the four comparisons listed above are shown in Figure 6. Compared with normal tissues, 49 of 72 mRNAs were significantly dysregulated in PCa, among which 10 (20.41%) were downregulated and 39 (79.59%) were upregulated (Fig. 6A and Supplementary Table S21). Patients with PCa presenting a GS ≥7 were confirmed to have an aggressive disease that results in a worse prognosis (Eggener et al., 2011; Kozminski et al., 2016). Patients in TCGA-PRAD were divided into three groups based on the GS (GS <7, GS = 7, and GS >7), and then the expression levels of 72 N-cadherin-regulated mRNAs were evaluated.
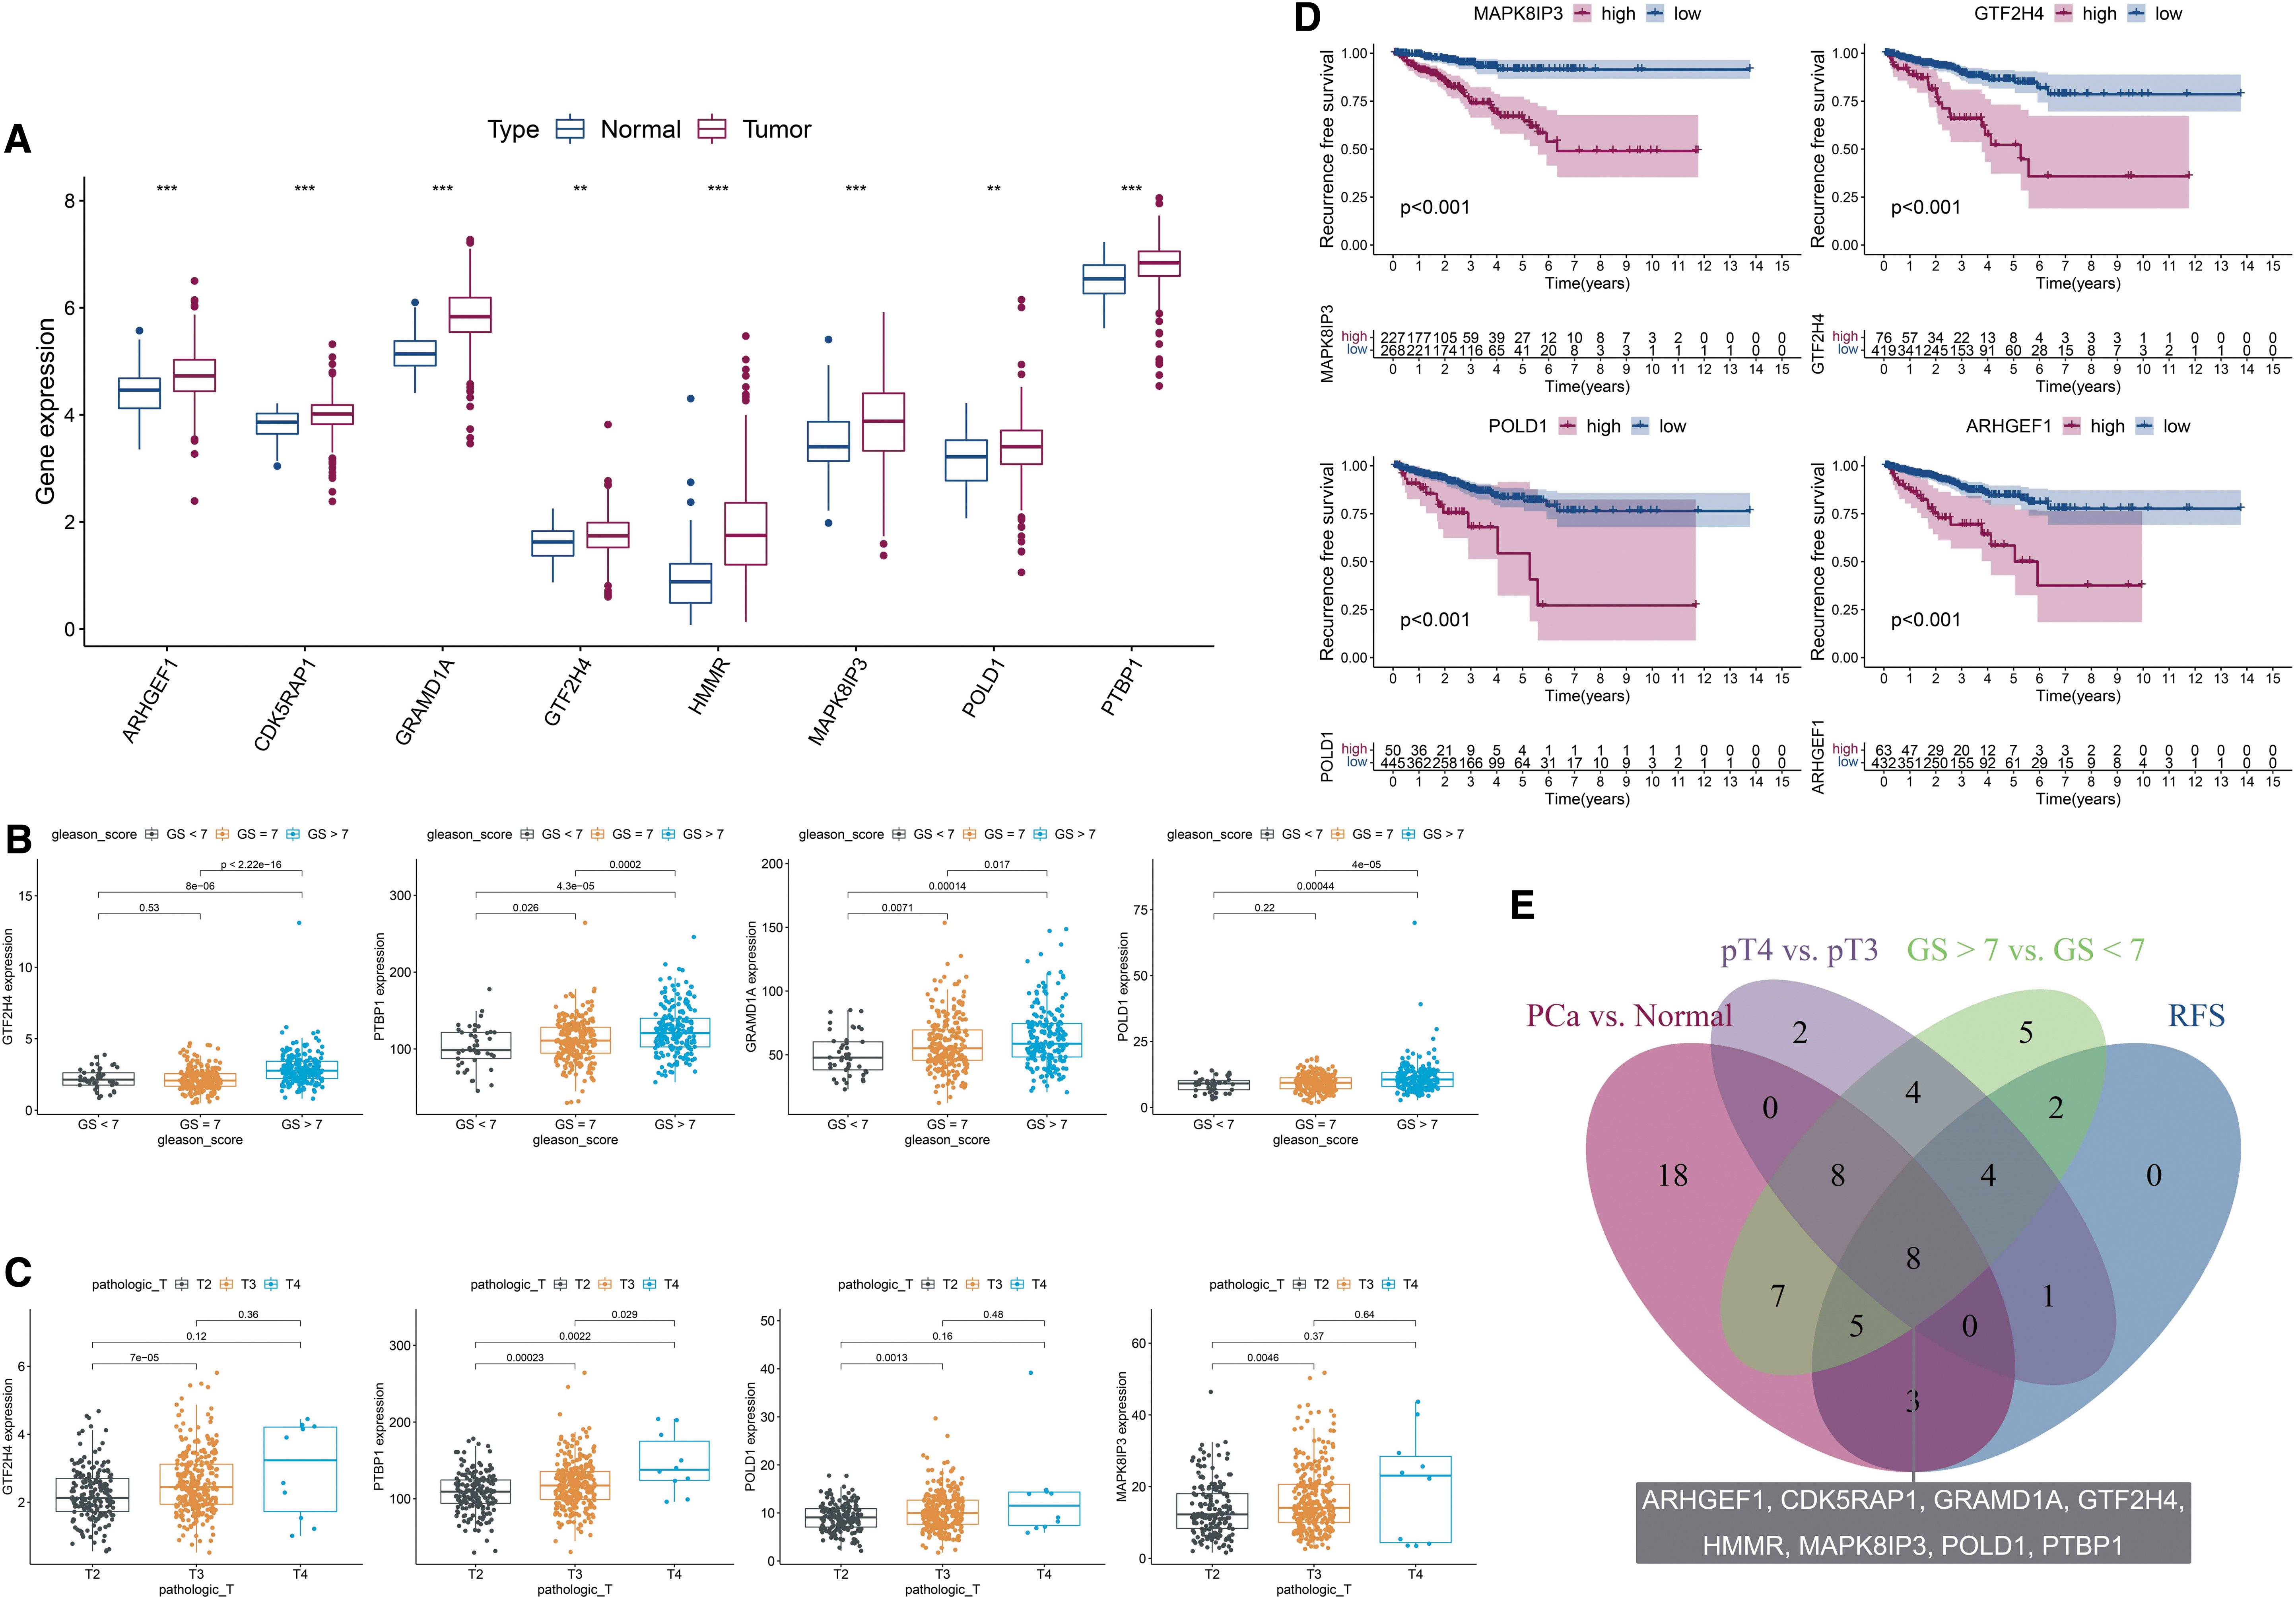
The associations of expression patterns of N-cadherin-regulated genes with various clinicopathological characteristics and prognoses of patients in TCGA-PRAD.
Based on the result, 43 mRNAs were dysregulated in the comparison of the GS >7 and GS <7 groups, among which 41 (HMMR, NRP1, INPP4A, GTF2H4, PTBP1, DERL1, etc.) were upregulated and 2 (WFS1 and P4HB) were downregulated in the GS >7 group (p < 0.05) (Fig. 6B and Supplementary Table S22). In the comparison of pT stages, we compared pT3 and pT2 (pT4 was excluded because the number of patients was only 10) and found that 27 of 72 mRNAs were significantly dysregulated, among which 23 (HMMR, NRP1, INPP4A, GTF2H4, FANCB, ZWILCH, etc.) were upregulated and 4 (P4HB, WFS1, NOL3, and ATP6V1D) were downregulated in pT3 (p < 0.05) (Fig. 6C and Supplementary Table S23).
In the survival analysis, patients with PCa were divided into two groups according to the optimum threshold segmentation of gene expression, which had the lowest log-rank p value in the Kaplan–Meier analysis. High expression levels of 21 genes (HR >1 and p value of the Cox regression analysis <0.05, such as MAPK8IP3, GTF2H4, POLD1, CDK5RAP1, ARHGEF1, and STK36) and low levels of 2 genes (HR <1 and p < 0.05, ATP6V1D and TP53) were associated with low RFS rates (Fig. 6D and Supplementary Table S24). The intersecting DEGs among the comparisons of PCa and normal, GS >7 and GS <7, pT3 and pT2, and RFS groups (p < 0.05) are shown in a Venn diagram (Fig. 6E).
Eight genes (ARHGEF1, CDK5RAP1, GRAMD1A, GTF2H4, HMMR, MAPK8IP3, POLD1, and PTBP1) were commonly dysregulated in these four comparisons, and all genes were consistently upregulated in groups with parameters associated with an advanced stage (in the PCa, GS >7, pT3, and HR >1 groups). The interesting result was that six of these genes (ARHGEF1, GRAMD1A, GTF2H4, MAPK8IP3, POLD1, and PTBP1) were positively correlated and two (CDK5RAP1 and HMMR) were negatively correlated with N-cadherin expression. Based on these findings, N-cadherin may promote epigenetic reprogramming in PCa cells and differentially regulate oncogene expression to form a complex network and dysregulate biological functions to modulate PCa progression (Fig. 7).
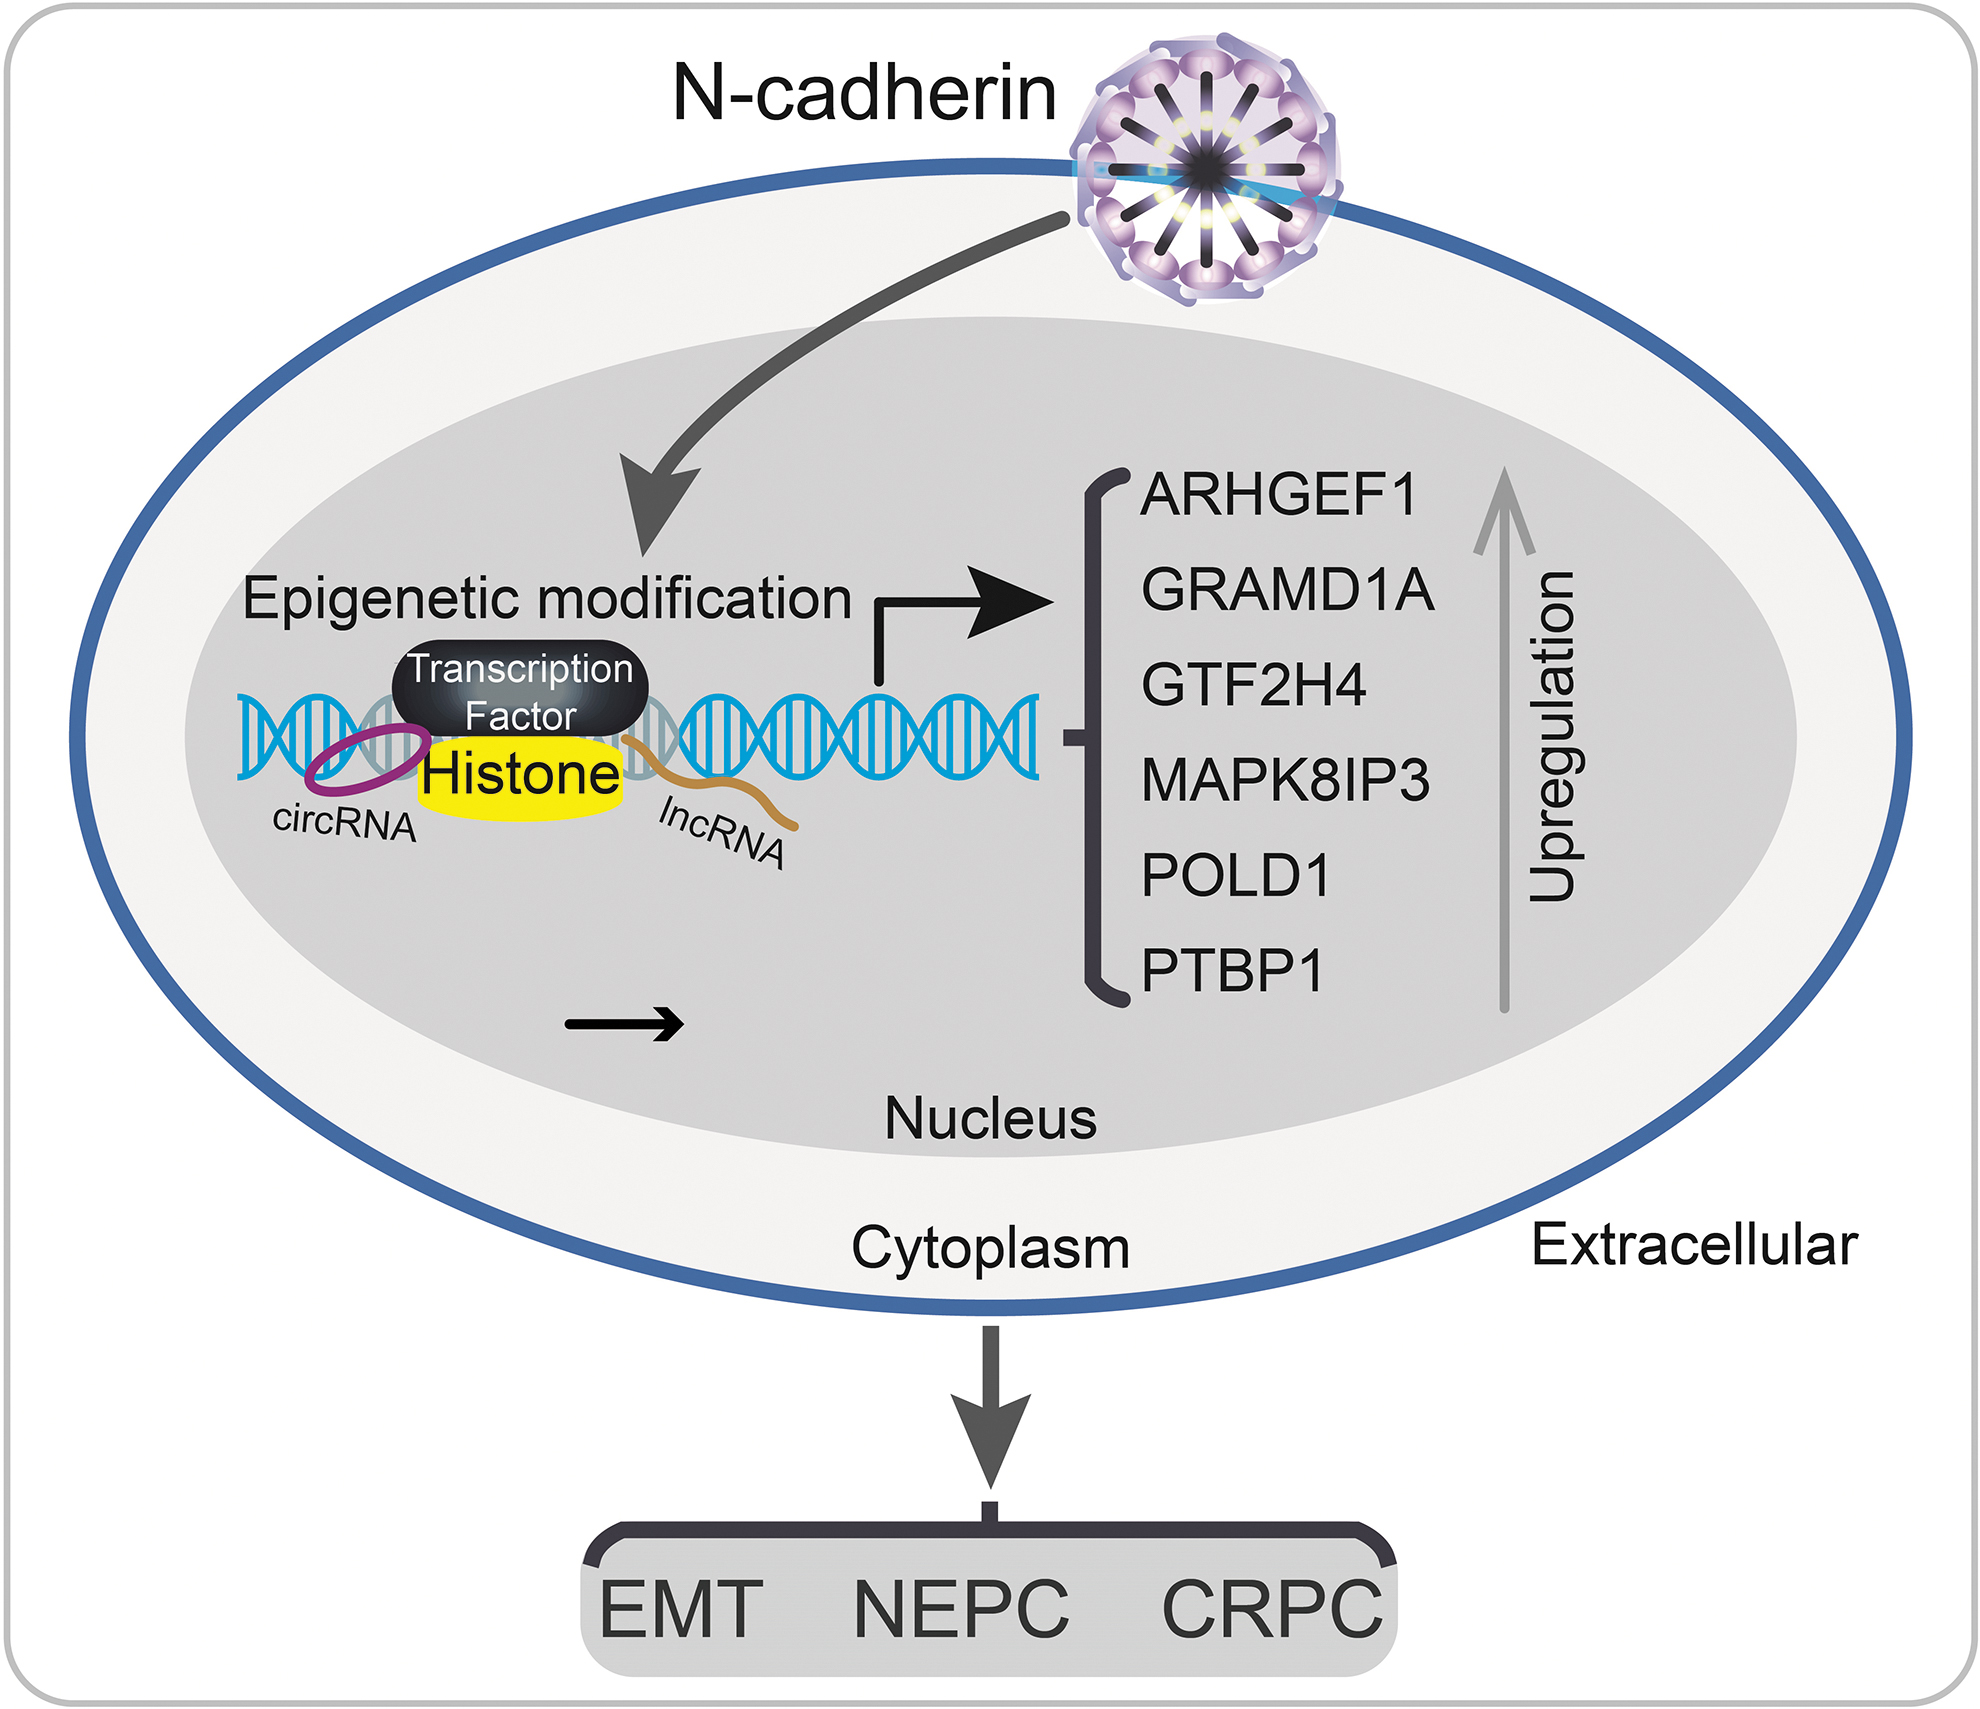
Schematic model of the potential mechanisms involved in PCa progression by N-cadherin regulated genes. N-cadherin may promote circRNA- and lncRNA-induced epigenetic reprogramming in PCa cells to dysregulate crucial gene (ARHGEF1, GRAMD1A, GTF2H4, MAPK8IP3, POLD1, PTBP1, and so on) expression and biological dysregulation, further promotes PCa progression to CRPC, NEPC, and bone metastasis. CRPC, castration-resistant PCa; NEPC, neuroendocrine PCa.
Discussion
In this study, we comprehensively analyzed the role of N-cadherin in PCa by performing bioinformatics analyses of RNA-seq data. The N-cadherin-regulated DEGs were screened, and the associated cellular processes and potential pathways were subsequently analyzed by performing enrichment analyses.
LNCaP and PC3 cells are the most acknowledged and representative androgen-dependent prostate cancer (ADPC) and CRPC cell lines, respectively, and are widely used in PCa studies. LNCaP cells have been reported to have features of prostatic adenocarcinoma with high expression of luminal differentiation markers AR and PSA, while PC3 cells have features typical of small-cell neuroendocrine carcinoma (SCNC), which has negligible expression of AR and high expression of NEPC markers (chromogranin A [CgA] and neuron-specific enolase [NSE]) (Buchanan et al., 2004) and EMT markers (N-cadherin, Slug, Snail, Vimentin, and ZEB) (Quan et al., 2021). We used LNCaP and PC3 cells in this study to comprehensively analyze the biological functions associated with PCa progression.
Transmembrane proteins have been reported to play crucial roles in multiple human cancers, and Nectin-4-targeted therapy has been successfully applied in clinical trials (Samanta and Almo, 2015; Hurov et al., 2021; Yu et al., 2021). Our study focused on another transmembrane protein, N-cadherin, which was also confirmed to have a crucial oncogenic role in PCa. N-cadherin was reported to promote PCa invasion by advancing the EMT (Jennbacken et al., 2010; Cui and Yamada, 2013; Wang et al., 2016). N-cadherin expression is significantly upregulated after ADT, which subsequently induces CRPC progression (Jaggi et al., 2006; Gravdal et al., 2007; Jennbacken et al., 2010; Tanaka et al., 2010; Nalla et al., 2011; Sun et al., 2012; Miao et al., 2017; Cai et al., 2020).
We subsequently showed that overexpression of N-cadherin in LNCaP cells promotes the expression of other EMT markers and NEPC markers, and the opposite results are obtained in PC3 cells with N-cadherin knockdown (Quan et al., 2021). This finding suggests the potential mechanism by which N-cadherin promotes CRPC progression through the EMT and NEPC transformation (Quan et al., 2021). Tanaka et al. (2010) reported that a monoclonal antibody targeting N-cadherin inhibits PCa metastasis and castration resistance. However, little is known about the biological mechanism by which N-cadherin influences PCa progression.
This study aimed to identify potential pathways involved in this process using RNA-seq. RNA-seq is a developed technology that comprehensively obtains the sequences and expression information of transcripts in cells and tissues. This study screened the differentially expressed circRNAs, lncRNAs, and mRNAs in LNCaP and PC3 cell lines along with their N-cadherin-regulated cells. Further enrichment analyses of related diseases, cell processes, and signaling pathways were performed.
CircRNAs are covalently closed noncoding circRNAs with potential biological functions in various tumors (Shang et al., 2019). Emerging evidence suggests that circRNAs such as circAMOTL1L, circ_0005276, and circ_0004296 regulate PCa cell proliferation, invasion, and the EMT (Feng et al., 2019; Yang et al., 2019; Mao et al., 2021). Our study found that none of the circRNAs was significantly upregulated among the three comparisons. However, the expression of circRNAs such as CBT15_circR_1845 and CBT15_circR_989 may be positively regulated by N-cadherin, which warrants further verification. Predictions of dysregulated biological functions by host genes of N-cadherin-regulated circRNAs revealed that epigenetic reprogramming through chromatin and histones induces transcriptional and post-translational modification of key genes during PCa progression and invasion into bones.
We found that N-cadherin positively promoted the expression of c-Jun, which epigenetically suppresses NDRG1 transcription through DNA methylation, further forming a vicious cycle to promote CRPC progression (Quan et al., 2021). However, we could not exclude other biological mechanisms involved in N-cadherin-regulated PCa progression. We analyzed the differentially expressed lncRNAs and mRNAs to research other mechanisms influenced by N-cadherin. Among the comparisons of LNCaP_oe_CDH2/NC, PC3/LNCaP, and PC3_sh_NC/CDH2 cells, TP53 and REST were included in the commonly downregulated mRNAs. TP53 mutation in PCa results in shorter radiographic progression-free survival (rPFS) and time to CRPC (Deek et al., 2021). Our pathway enrichment analysis also showed that TP53 regulatory activity was significantly associated with N-cadherin-regulated lncRNA–mRNA networks in PC3 cells.
According to this association, we hypothesize that N-cadherin may participate in the potential process of TP53 inactivation or mutation during PCa progression. REST was originally identified as a transcriptional repressor for neuron-specific genes, such as CgA and synaptophysin (Syn), in neuronal progenitor and non-neuronal cells (Schoenherr and Anderson, 1995). Inactivation of REST in PCa cells enhances NEPC transformation (Svensson et al., 2014; Zhang et al., 2015; Chang et al., 2018; Flores-Morales et al., 2019). Our previous study suggested that N-cadherin expression in LNCaP and PC3 cells promotes the expression of CgA, Syn, and NSE (Quan et al., 2021). REST has also been confirmed to be a crucial regulator of EMT-like phenotypes in hormone-refractory PCa (Chang et al., 2017). This finding suggests the potential mechanism of NEPC transformation by N-cadherin-regulated REST.
LncRNAs epigenetically regulate gene expression through transcriptional and posttranscriptional modifications (Li et al., 2021). Mutation or abnormal expression of lncRNAs leads to physiological abnormalities and tumors. Therefore, we predicted mRNAs targeted by lncRNAs by constructing a coexpression network. PC3 cells were derived from a human prostatic adenocarcinoma metastasis to bone (Kaighn et al., 1979). Bone cancer was associated with overexpression of N-cadherin in LNCaP cells, implying the possibility that differentially regulated lncRNA–mRNA networks at early stages of PCa may have a potential role in the progression to bone metastasis.
N-cadherin may promote PCa metastasis and proliferation through the dysregulated function of intracellular and membrane-bound organelle- and cell cycle-related pathways, which were associated with N-cadherin-regulated lncRNA–mRNA networks in both LNCaP and PC3 cells. We previously elucidated that N-cadherin promotes PCa cell invasion, but not proliferation, by altering c-Jun/NDRG1 signaling (Quan et al., 2021). This study reported highly consistent transcription factors that bind to the promoters of differentially expressed lncRNAs, suggesting the conserved function of N-cadherin-regulated transcription factors in different PCa cell lines.
Next, we analyzed gene expression by integrating the transcript levels. NUDT4 and ZNF84 were negatively regulated by N-cadherin. ZNF84 alleles were reported to be lost in several human cancers, and this protein functions as a transcriptional repressor (Rosati et al., 2001; Strzeszewska-Potyrała et al., 2021). As shown in this study, epigenetic modification-related biological functions, such as nucleic acid binding metabolic, gene expression, and generic transcription pathways, were dysregulated by DEGs in both LNCaP_oe_CDH2/NC and PC3_sh_NC/CDH2 comparisons. Combining the above result, we hypothesize that epigenetic dysregulation of key genes by N-cadherin potentially modulates PCa aggressiveness.
Finally, we assessed the associations between the expression of 72 mRNAs dysregulated by N-cadherin and various clinicopathological characteristics or prognoses using TCGA-PRAD dataset to make the conclusions more convincing. In the comparisons of PCa and normal, GS >7 and GS <7, PT3 and PT2, and RFS groups (p < 0.05), we identified eight intersecting genes (ARHGEF1, CDK5RAP1, GRAMD1A, GTF2H4, HMMR, MAPK8IP3, POLD1, and PTBP1), which were consistently upregulated in advanced stages (in the PCa, GS >7, pT3, and HR >1 groups). Among them, six mRNAs (ARHGEF1, GRAMD1A, GTF2H4, MAPK8IP3, POLD1, and PTBP1) were positively regulated, and two mRNAs (CDK5RAP1 and HMMR) were negatively regulated by N-cadherin. HMMR and PTBP1 were previously studied in PCa (Gust et al., 2009; Huang et al., 2021).
The HMMR protein was overexpressed in metastatic PCa compared with localized PCa or benign tissue. However, higher HMMR expression was associated with better clinical outcomes, such as lower PSA serum levels, a favorable T stage, and no lymph node metastasis (Gust et al., 2009). The potential negative correlation between HMMR and N-cadherin expression observed in our results may contribute to these inconsistent results, which warrant further verification. Higher PTBP1 expression was correlated with PCa aggressiveness and a poor prognosis and influenced the response to ADT in patients with PCa (Huang et al., 2021). In summary, these results suggest that complex molecular mechanisms are regulated by N-cadherin during PCa progression.
In this study, we observed different results in LNCaP and PC3 cells compared with N-cadherin-regulated cells. Authoritative studies have shown that AR functional silencing and N-cadherin activation are major causes of CRPC progression (Niu et al., 2008a, 2008b; Mendiratta et al., 2009; Jennbacken et al., 2010; Tanaka et al., 2010; Sun et al., 2012; Qin et al., 2014; Huo et al., 2015; Chen et al., 2017a, 2017b; Miao et al., 2017; Jia et al., 2018; Tsai et al., 2018; Cai et al., 2020). In our studies, AR/NDRG1 signaling suppressed the expression of N-cadherin and N-cadherin suppressed AR expression through a potential mechanism where c-Jun competitively repressed AR transcriptional activity (Quan et al., 2020, 2021).
However, the efficiency of N-cadherin-regulated AR expression is not substantial (Quan et al., 2021) and we did not observe significant inverse correlations of N-cadherin and AR expression in LNCaP and PC3 cells compared with their N-cadherin-regulated cells through RNA-seq. The insufficient accuracy of RNA-seq data and lack of AR regulatory efficiency by N-cadherin may account for the inconsistent results observed in the two cell lines. Other important factors that form complex networks with AR and N-cadherin may also exist to synergistically dysregulate this relationship.
There have several limitations in this study, which warrant further research. First, only two cell lines (LNCaP and PC3) were used and the conclusions are extremely limited based on the RNA-seq analysis. Second, several N-cadherin-regulated crucial genes were simply verified using TCGA-PRAD dataset, without performing experimental validation on patient samples. Finally, enrichment analysis found that epigenetic reprogramming was dysregulated by N-cadherin, but the specific mechanism needs further research to clarify the biological function during PCa progression.
Conclusions
In this study, we analyzed the role of N-cadherin in LNCaP and PC3 cells by performing RNA-seq and bioinformatics analyses. Several key N-cadherin-regulated genes (ARHGEF1, GRAMD1A, GTF2H4, MAPK8IP3, POLD1, PTBP1, etc.) were associated with PCa aggressiveness and the prognosis. In the enrichment analyses, potential pathways involved in epigenetic regulation, such as histone modification, transcriptional and post-translational modification, nucleic acid binding, and generic transcription pathways, were dysregulated by N-cadherin-associated genes. PCa cell metastasis and proliferation were potentially dysregulated by the mechanism of intracellular and membrane-bound organelle and cell cycle-related pathways associated with differentially expressed lncRNA–mRNA networks in both LNCaP and PC3 cells. In summary, N-cadherin may promote epigenetic modification in PCa cells to dysregulate crucial gene expression, further promoting PCa progression.
Data Availability Statement
The RNA-seq data supporting the findings of this study are provided in the Science Data Bank (
Availability of Data and Materials
The data and materials supporting the conclusions of this study are included within the article and its additional files.
Ethical Approval and Consent to Participate
None.
Consent for Publication
All authors read and approved the final article for publication.
Footnotes
Authors' Contributions
H.P. and Y.Q. designed this study. Y.Q. and M.W. performed the bioinformatics and statistical analyses. H.P. and X.Z. reviewed the data. Y.Q. wrote the article, which was approved by all authors.
Disclosure Statement
The authors have no competing interests to declare.
Funding Information
This study was supported by the National Natural Science Foundation of China (Grant Nos. 82072833 and 82272864 to H.P.).
Supplementary Material
Supplementary Figure S1
Supplementary Figure S2
Supplementary Figure S3
Supplementary Figure S4
Supplementary Figure S5
Supplementary Figure S6
Supplementary Figure S7
Supplementary Figure S8
Supplementary Table S1
Supplementary Table S2
Supplementary Table S3
Supplementary Table S4
Supplementary Table S5
Supplementary Table S6
Supplementary Table S7
Supplementary Table S8
Supplementary Table S9
Supplementary Table S10
Supplementary Table S11
Supplementary Table S12
Supplementary Table S13
Supplementary Table S14
Supplementary Table S15
Supplementary Table S16
Supplementary Table S17
Supplementary Table S18
Supplementary Table S19
Supplementary Table S20
Supplementary Table S21
Supplementary Table S22
Supplementary Table S23
Supplementary Table S24
References
Supplementary Material
Please find the following supplemental material available below.
For Open Access articles published under a Creative Commons License, all supplemental material carries the same license as the article it is associated with.
For non-Open Access articles published, all supplemental material carries a non-exclusive license, and permission requests for re-use of supplemental material or any part of supplemental material shall be sent directly to the copyright owner as specified in the copyright notice associated with the article.
