




Abstract
The common broad-spectrum protectant fungicide known as Dithianon is utilized in agriculture to manage pests; however, it could pose risks to human health. Dithianon may be associated with health problems due to its affinity for DNA. The interaction between Dithianon and calf thymus DNA (CT-DNA) was examined using UV–Vis absorption, fluorescence spectroscopy, and viscosity measurements with Neutral Red (NR) dye as a spectral probe in a physiological buffer. Dithianon, intercalated in DNA (K [DNA–Dithianon] = 2.3 × 10⁵ M−1), causes the displacement of the NR dye from the NR–DNA complex. The binding constants (Kf), the number of binding sites (n ≈ 1), and thermodynamic parameters of the interaction of DNA–Dithianon were determined using the fluorescence quenching method at various temperatures. Dithianon’s ability to intercalate in DNA base pairs was further supported by the variations in CT-DNA base stacking observed in circular dichroic spectrum measurements and the rise in viscosity of the CT-DNA solution. The interaction energy between Dithianon and the DNA was primarily due to hydrophobic Van der Waals interactions. This study offers a comprehensive understanding of how dithianon interacts with CT-DNA, providing insights into the toxic effects of the fungicide.
Introduction
Dithianon (2, 3-dicyano-1, 4-dithio-anthraquinone, Fig. 1A) belongs to a class of sulfur-containing quinone, nitrile, and heterocyclic compounds. Since its introduction in 1963, it has been used as a broad-spectrum pesticide (marketed as Activan, Delan, and Cluster) to manage scab on apples, pears, and other fruits (Halasz et al., 2012; Harteveld et al., 2014; Ticha et al., 2008). Dithianon is a non-systemic fungicide that effectively controls pomes fruit foliar disease. It is on the list of goods that growers, and farmers are permitted to use. It is advised for apple and pear scabs due to its sustained action and great efficiency (Verma et al., 1999).
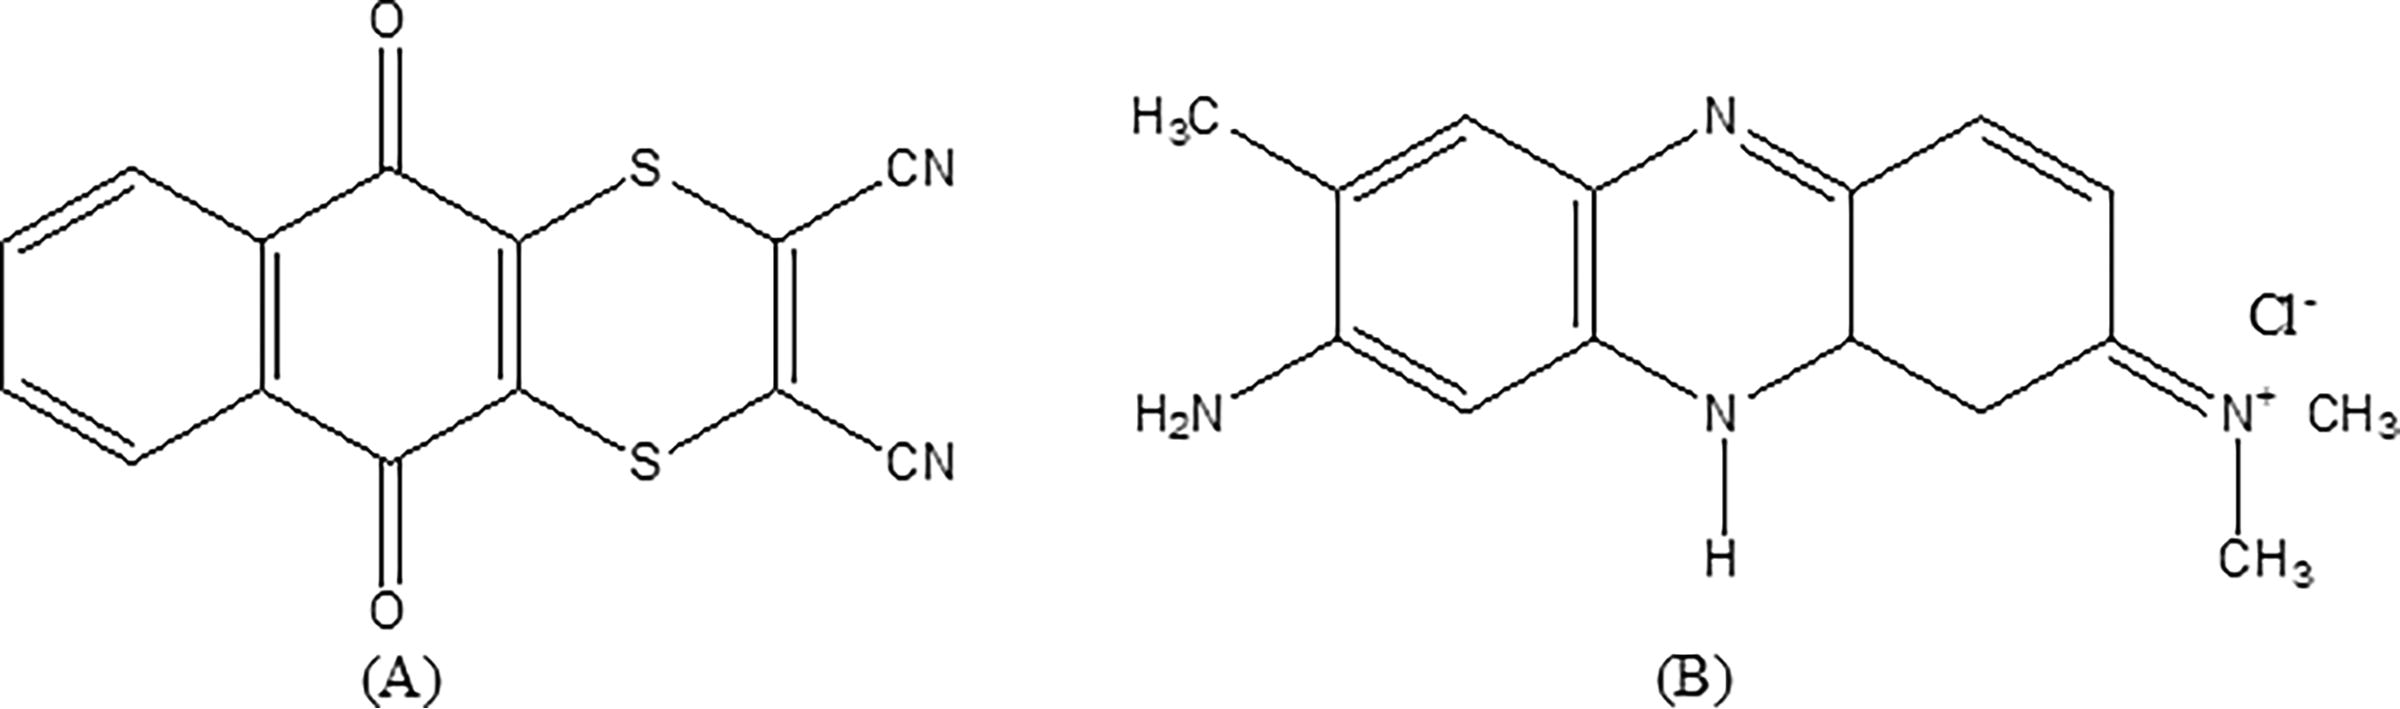
Molecular structure of Dithianon
In the USA, Dithianon is registered for dried cones, grapes, pome fruits, and hops, with maximum residue limits (MRLs) ranging from 3 to 100 mg/kg. Conversely, the EU permitted the use of Dithianon in pepper with a 0.6 mg/kg MRL. The maximum residue levels (MRLs) for Dithianon in 20 crops in the Republic of Korea vary from 0.1 to 5.0 mg/kg. the MRL for red pepper is 2.0 mg/kg (Jang et al., 2014).
Dithianon has been widely employed to prevent and treat a wide range of fungal diseases, particularly the anthracnose disease (Xue et al., 2015). Dithianon attaches firmly to the leaf surface, has strong persistence after drying, and is comparatively rainfast. Rain and runoff have the ability to reactivate the compound on Earth’s surface, providing a certain degree of protection for newly emerging plants. Dithianon functions as a multi-site inhibitor of protein synthesis and alters the sulfhydryl groups present in the cysteine residues of numerous proteins. The suppression of this protein stops the growth of the germ tube and spore germination (Smit and van Veen, 2008). Dithianon is mostly used to treat pear illnesses such as scab, ring rot, and anthracnose (Tashiro et al., 2012).
Dithianon is presently labeled as Xn, R22, indicating harmful if ingested. It is also under consideration for reclassification as T, R23, which means toxic when inhaled at a lethal concentration (LC50) of 0.31 mg/L of air for males. Dithianon causes kidney tumors in female rats after prolonged oral administration at a dose of 30 mg/kg body weight per day, the highest dose tested. It has been proposed for classification as a Carcinogen Category 3 with the designation R40: “Limited evidence of a carcinogenic effect.” However, Dithianon has not been shown to be a reproductive or developmental toxicant (Anastassiadou et al., 2020). It is listed among the approved products for use by farmers and growers. Known for its prolonged action and high efficacy, it is recommended for controlling scab in apple and pear crops (Jang et al., 2014). Dithianon exposure induces oxidative stress and mitochondrial malfunction in C. elegans, which results in dopaminergic neurotoxicity. The neurotoxic potential of Dithianon is better understood as a result of these observations (Lee et al., 2023).
Because of the possible threats to human health, there is a great deal of interest in the interaction between dangerous compounds and DNA. Since DNA is the main genetic information carrier and is essential for gene transcription, mutagenesis, and gene expression, many hazardous substances cause harm by affecting DNA. Multiple environmental contaminants frequently target DNA as their primary molecular target. Certain dangerous chemicals, like pesticides, have the ability to enter healthy cells and create DNA adducts, which can cause drastic modifications that increase the risk of gene mutations and cancer. Therefore, understanding and characterizing these interactions is crucial for comprehending toxicity mechanisms and assessing damage levels.
Despite being essential to contemporary agriculture, pesticides are among the most dangerous substances. They can build up in plants, soil, food, and water sources and are readily absorbed. Because pesticides can contaminate food and water, exposure to their genotoxicity is a major problem. In recent years many pesticides have been found to have possible carcinogenic qualities (Tao et al., 2016).
The use of pesticides can have chronic negative effects on human health. Several pesticides have been found to have genotoxic activity and can cause neoplastic transformation in cells. The formation of complexes between DNA base components and various xenobiotic molecules is recognized as a primary source of genotoxicity in biological organisms. These complexes can inhibit DNA replication and transcription. The binding interaction with DNA is also the initial step in the DNA-damaging actions and genotoxic processes of many xenobiotic molecules, including pesticides. Therefore, understanding the binding modes of these molecules to DNA is crucial (Garbellini et al., 2013; Kang et al., 2013).
Pesticides, despite their benefits and widespread use, are among the most toxic environmental contaminants. Overuse can degrade water quality and harm both terrestrial and aquatic biodiversity. Residues in food pose significant health risks to humans, potentially causing allergies, chronic diseases, and cancer. The World Health Organization (WHO) reports around three million pesticide poisonings annually, resulting in 220,000 deaths globally. Therefore, monitoring pesticide residues in food, especially raw fruits and vegetables, is crucial for public health and trade safety (Golge and Kabak, 2015; Kovacova et al., 2014; Walter et al., 2007).
The indiscriminate use of pesticides causes these compounds to accumulate in the environment, disrupting soil ecosystems and leading to environmental pollution (Madhavi et al., 1994).
The potential of Dithianon to affect biomarkers related to non-genotoxic cocarcinogenesis was investigated. Researchers examined various CYP-dependent reactions in liver, kidney, and lung microsomes from male and female Swiss Albino CD1 mice treated intraperitoneally. Dithianon showed a complex pattern of CYP enzyme induction and suppression in different tissues and sexes, suggesting possible toxic, cotoxic, and co-carcinogenic effects (Paolini et al., 1997). Dithianon’s cytotoxic and cell-transforming properties were assessed in vitro using the BALB/c 3T3 cell transformation test. The tests were conducted with and without the S-9 mix as a bioactivation system. Dithianon showed cytotoxic effects in both scenarios, indicating toxicity without the S-9 mix and with metabolic activation. Moreover, Dithianon induced cell transformation to varying extents when the S-9 mix was absent (Perocco et al., 1993).
Genotoxicity is a major health concern due to the extended time between exposure and noticeable effects. While numerous pesticides have shown genotoxic properties, there is a paucity of studies exploring the molecular mechanisms underlying this characteristic (Blasiak et al., 1995).
However, there are some in vitro studies investigating the genotoxic effects of pesticides. Kashanian et al. investigated the interactions of DNA with three pesticides using spectroscopic and electrochemical techniques including diazinon (an organophosphorus pesticide) (Kashanian et al., 2008b), clodinafop-propargyl (an organochlorine herbicide) (Kashanian et al., 2008a), and 2,4-Dichlorophenoxyacetic acid (a genotoxic organochlorine herbicide) (Ahmadi and Bakhshandeh, 2009). Additionally, other studies have examined the genotoxic effects of specific pesticides, such as the carboxamide fungicide boscalid (Shi et al., 2018b) and fenhexamid (Kou et al., 2019), which preferentially bind to the minor grooves of B-DNA. In contrast, the sulfonylurea herbicide shows low affinity for calf thymus DNA (CT-DNA), resulting in minimal conformational damage to DNA (Shi et al., 2018a). Their research revealed significant impacts on DNA structure and DNA damage caused by pesticides. However, the paucity of in vitro studies on Dithianon’s genotoxic effects, along with limited information on its interaction with DNA, motivated us to conduct this investigation. The present study aims to examine the interaction between Dithianon and CT-DNA and assess potential carcinogenic and damaging effects associated with this interaction. The study involves analyzing Dithianon–DNA interaction in 10 mM HCl-Tris aqueous solutions at physiological pH 7.4, utilizing spectroscopic techniques, such as UV–Vis, circular dichroism (CD), and fluorescence. Neutral Red (NR) is a flat phenazine dye similar in structure to other planar dyes such as acridine, thiazine, and xanthene. Recent studies have confirmed its interaction with DNA through spectrophotometric and electrochemical methods. Compared to the widely used fluorometric probe ethidium bromide (EB), NR offers lower toxicity, greater stability, and ease of use, with solutions remaining stable for up to two years. Therefore, NR was selected as the probe for this study (Zhang et al., 2010).
Materials and Methods
Materials
Highly polymerized CT-DNA, Dithianon, and Tris-HCl were obtained from Sigma Co. All solutions were meticulously prepared using double-distilled water. A stock solution of Neutral Red dye (1.0 × 10⁻³ mol/L, Merck product) was prepared by dissolving its crystals in water and subsequently dilusting to the desired concentration. The Tris-HCl buffer solution [tris-(hydroxymethyl)-aminomethane and hydrogen chloride] was adjusted to pH 7.4. DNA was dissolved in 10 mM Tris-HCl buffer at pH 7.4 and dialyzed extensively against the same buffer for 24 h. The DNA solution was stored at 4°C and used in 5 days. The CT-DNA solutions showed a UV absorbance ratio at 260/280 nm greater than 1.8, indicating minimal protein contamination (Shahabadi et al., 2015). The nucleotide concentration was assessed through UV absorption spectroscope with a molar absorption coefficient (ε = 6600 M−1cm−1) at 260 nm. A Dithianon stock solution (1 × 10⁻³M) was prepared by dissolving the appropriate amount of compound in Tris-HCl buffer/DMSO (90:10%). It was confirmed that the low percentage of DMSO added to the DNA solution does not disrupt the nucleic acid structure (Kashanian and Dolatabadi, 2009).
Instrumentation
Absorbance spectra were recorded using an HP spectrophotometer (Agilent 8453) equipped with a thermostated bath (Huber polysat cc1). The experiments were conducted in two ways: initially, the concentration of DNA was kept constant while Dithianon was gradually added. In the next step, the concentration of Dithianon was held constant, and DNA was added. Absorption titration experiments were conducted by maintaining a constant Dithianon concentration (60 μM) while varying the DNA concentration from 0 to 80 μM (ri = [DNA]/[Dithianon] = 0.0–1.3). Equal small aliquots of DNA stock solution were added to both Dithianon and reference solutions to neutralize the effect of DNA absorbance. Absorbance at 356 nm was recorded for Dithianon subsequent to DNA addition. Fluorescence measurements were conducted using a JASCO spectrofluorimeter (FP 6200), maintaining a constant Dithianon concentration (40 μM) while varying the DNA concentration from 0 to 30 μM (ri = [DNA]/[Dithianon] = 0, 0.1, 0.25, 0.37, 0.5, 0.62, and 0.75). Emission spectra were captured within the 400–600 nm range. All measurements were conducted at a temperature of 25°C. The competitive interaction between the NR dye and Dithianon with DNA in fluorescence measurements was conducted using the following parameters: excitation wavelength of 541 nm, emission wavelength of 618 nm, and excitation and emission slits set at 10 nm each. The experiment took place in 10 mM Tris–HCl at pH 7.4 in aqueous media. Constant amounts of NR and DNA were titrated with increasing quantities of Dithianon solution. Changes in absorbance values or fluorescence intensities were monitored against a blank everytime Dithianon was added (Ni et al., 2006).
Viscosity measurements were performed using a viscometer (SCHOT AVS 450) maintained at 25 ± 0.5°C in a temperature-controlled bath. The DNA concentration was fixed at 5 × 10⁻⁵ M, and flow time was recorded using a digital stopwatch. The mean values obtained from three replicate measurements were used to calculate the viscosity (η) of the samples. Relative specific viscosity values (η/η0)1/3, where η0 and η represent the specific viscosity contributions of DNA in the absence (η0) and presence of Dithianon, were plotted against ri = [Dithianon]/[DNA] = 0.0, 0.5, 1.0, 1.2, 1.5, 1.8, and 2.0. CD measurements were conducted using a JASCO (J-810) spectropolarimeter, maintaining a constant DNA concentration of 8 × 10⁻⁵ M while adjusting the Dithianon concentration from 0 to 5.6 × 10⁻⁵ M (ri = [Dithianon]/[DNA] = 0.0, 0.1, 0.2, 0.4, and 0.7).
Docking study
The computational study of drug interactions with DNA at the atomic level was performed using the AutoDock package version 4.2 (http://autodock.scripps.edu). To this end, the structure of Dithianon was mapped using the ACD/LAB software (https://www.acdlabs.com), followed by 3D structure preparation and optimization using Avogadro (https://avogadro.cc). In addition, the 3-D structure of DNA was obtained from the PDB protein database with the PDB code of 1DJD. The coordinate files containing partial changes and the Autodock atoms types were prepared in MGLtools package (http://mgltools.scripps.edu). As for the DNA molecule, the water in the crystallographic file was first manually removed, and then the partial charges of all atoms were calculated through the Gasteiger method. In the case of the Dithianon molecule, after adding atomic changes, the non-polar hydrogens were combined with the corresponding carbons. The search space was selected to allow Dithianon molecule to explore all parts of the macromolecule. Preparation of atomic energetic maps for ligand atom types was done in AutoGrid. Eventually, 250 runs were fitted using the Lamarckian genetic algorithm embedded in the AutoDock to find the low-energy conformation of Dithianon–DNA complex (Göktürk et al., 2023; Guo et al., 2011; Tang et al., 2017).
Results and Discussion
To evaluate the interaction between pesticides and genetic material, an in vitro system that examined the direct impact of pesticides on purified DNA was employed. This approach offers several advantages. First, it is organism-independent, meaning it does not rely on the biology of a specific organism to detect interactions with DNA. Second, it eliminates the need to consider DNA damage masking by the repair system (Blasiak et al., 1995).
Absorption spectra studies
Absorption spectra of NR dye–DNA interaction
Electronic absorption spectroscopy is a widely used method for studying compound interactions with DNA (Shi et al., 2015b). The terms “hyperchromic” and “hypochromic” refer to spectral characteristics of DNA in relation to its double helical structure. Hypochromism occurs when DNA is compressed along its helical axis, accompanied by conformational changes in its structure. In contrast, hyperchromism signifies damage to the DNA double helix (Shi et al., 2015a; Shi et al., 2006).
As shown in Figure 2A, the absorption spectra of DNA increase with rising concentrations of Dithianon. This increase demonstrates the “hyperchromic” effect, indicating that the binding of Dithianon to DNA—through intercalation—leads to the disruption of its double helical structure.
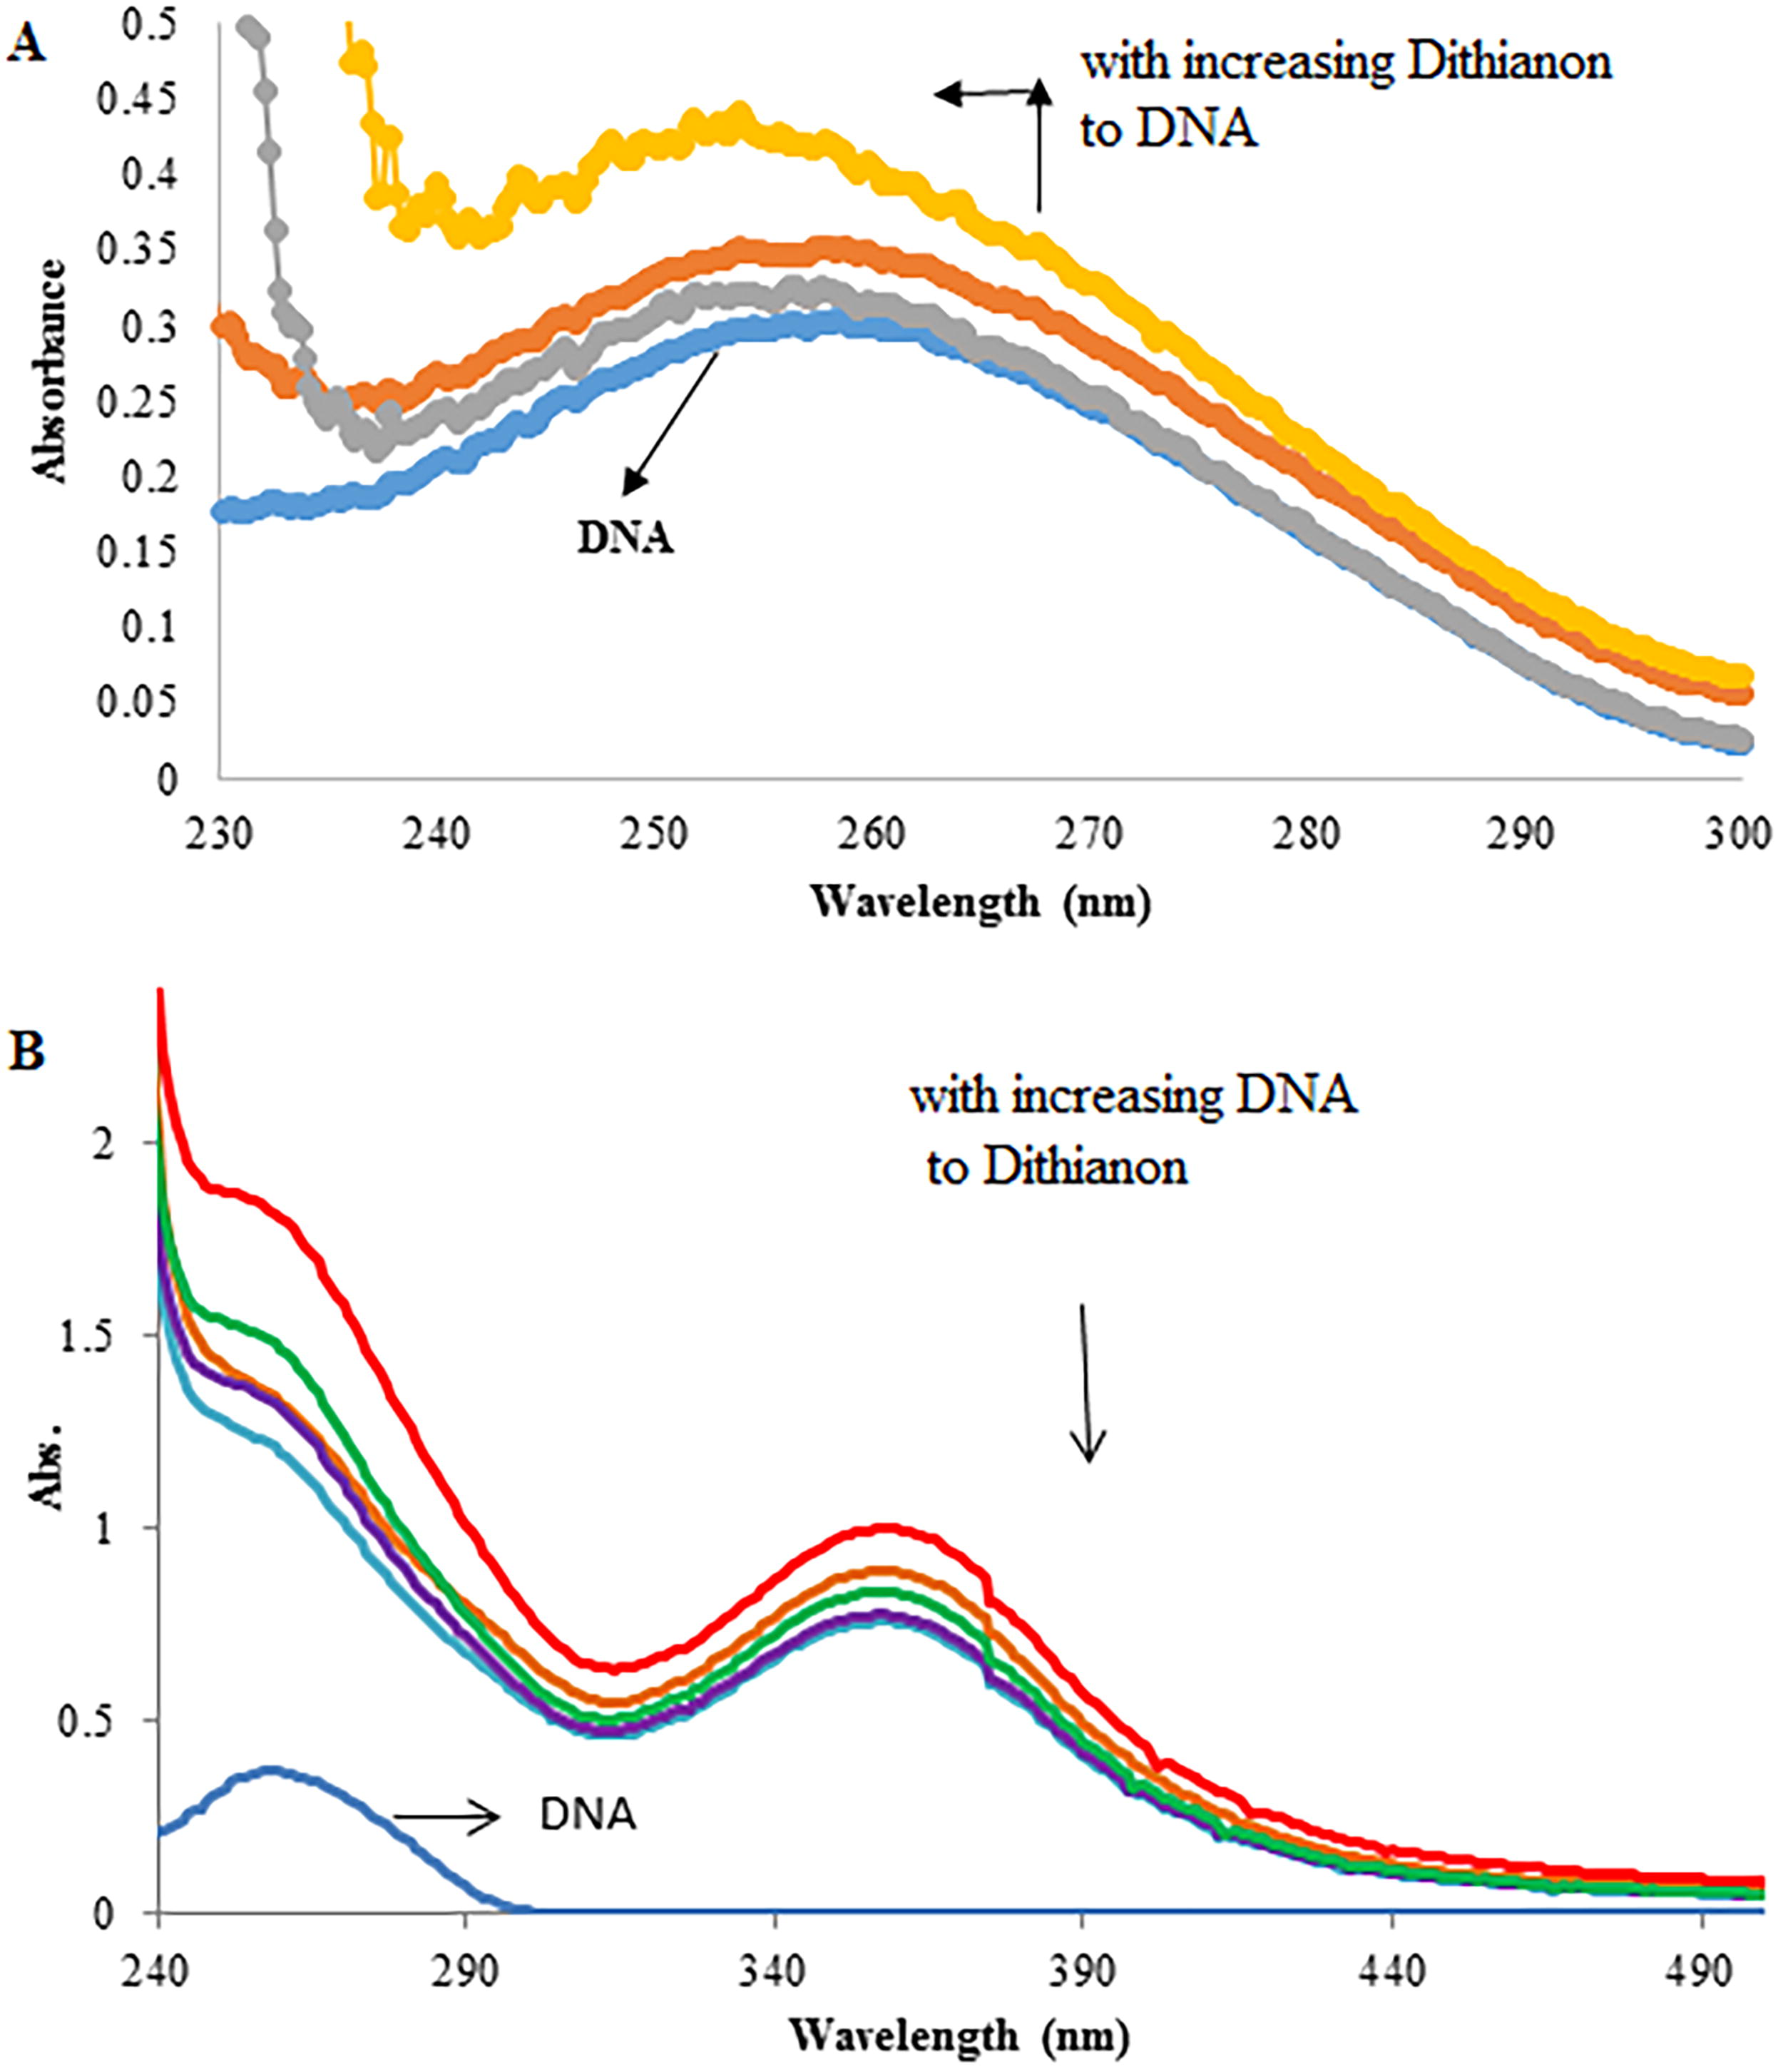
Figure 2B shows the absorption spectra of Dithianon with and without CT-DNA, where Dithianon was held at a constant concentration ([Dithianon] = 60 μM).
Upon titration of CT-DNA into Dithianon, spectral changes were observed. Notably, the bands at 356 nm exhibited significant hypochromism, reaching up to 22.5% saturation at [DNA]/[Dithianon] = 1.3. This substantial hypochromism in Dithianon’s absorption bands in the presence of DNA typically signifies intercalation into DNA base pairs. This indicates a strong π–π stacking interaction between Dithianon’s aromatic chromophore and the DNA base pairs, suggesting that Dithianon most likely binds to CT-DNA through intercalation (Wang et al., 2006; Wu et al., 2005). It is important to highlight that the absence of a significant effect on the absorption bands of the molecule in the presence of double helical DNA is a characteristic of a groove binder (Wei et al., 2006). The degree of hypochromism at λ = 356 nm was quantified using Equation 1, yielding a value of H% = 22.5%.
These findings suggest that Dithianon binds to DNA via intercalation, facilitated by a robust stacking interaction between its planar aromatic chromophore and the DNA base pairs.
Absorption spectra of NR dye–DNA interaction
Planar dye molecules like acridine dye, known for their ability to interact with DNA through “intercalation,” have been extensively studied using various methods. Neutral red (NR), depicted in Figure 1, possesses a planar structure. It was shown that the interaction of NR with DNA is influenced by the values of R (R is defined as the ratio of the concentration of NR to that of CT DNA) and pH of the solution. NR intercalated into CT DNA base pairs at lower R value (R <2.4) and following by NR aggregating along the helical surface of DNA at higher R value (R >2.4). While in pH 7.0 solution, NR bound with CT DNA through intercalation and electrostatic interactions (Jiang et al., 2005). NR exhibits a distinctive ability to intercalate uniquely into the base pairs of double helix DNA (Zhang et al., 2004), Hence, NR was utilized as a molecular probe in this study. Additionally, further evidence supporting the binding mode between Dithianon and DNA is provided through the competitive interaction of Dithianon and NR with DNA (Shahbazy et al., 2017; Zhang et al., 2010).
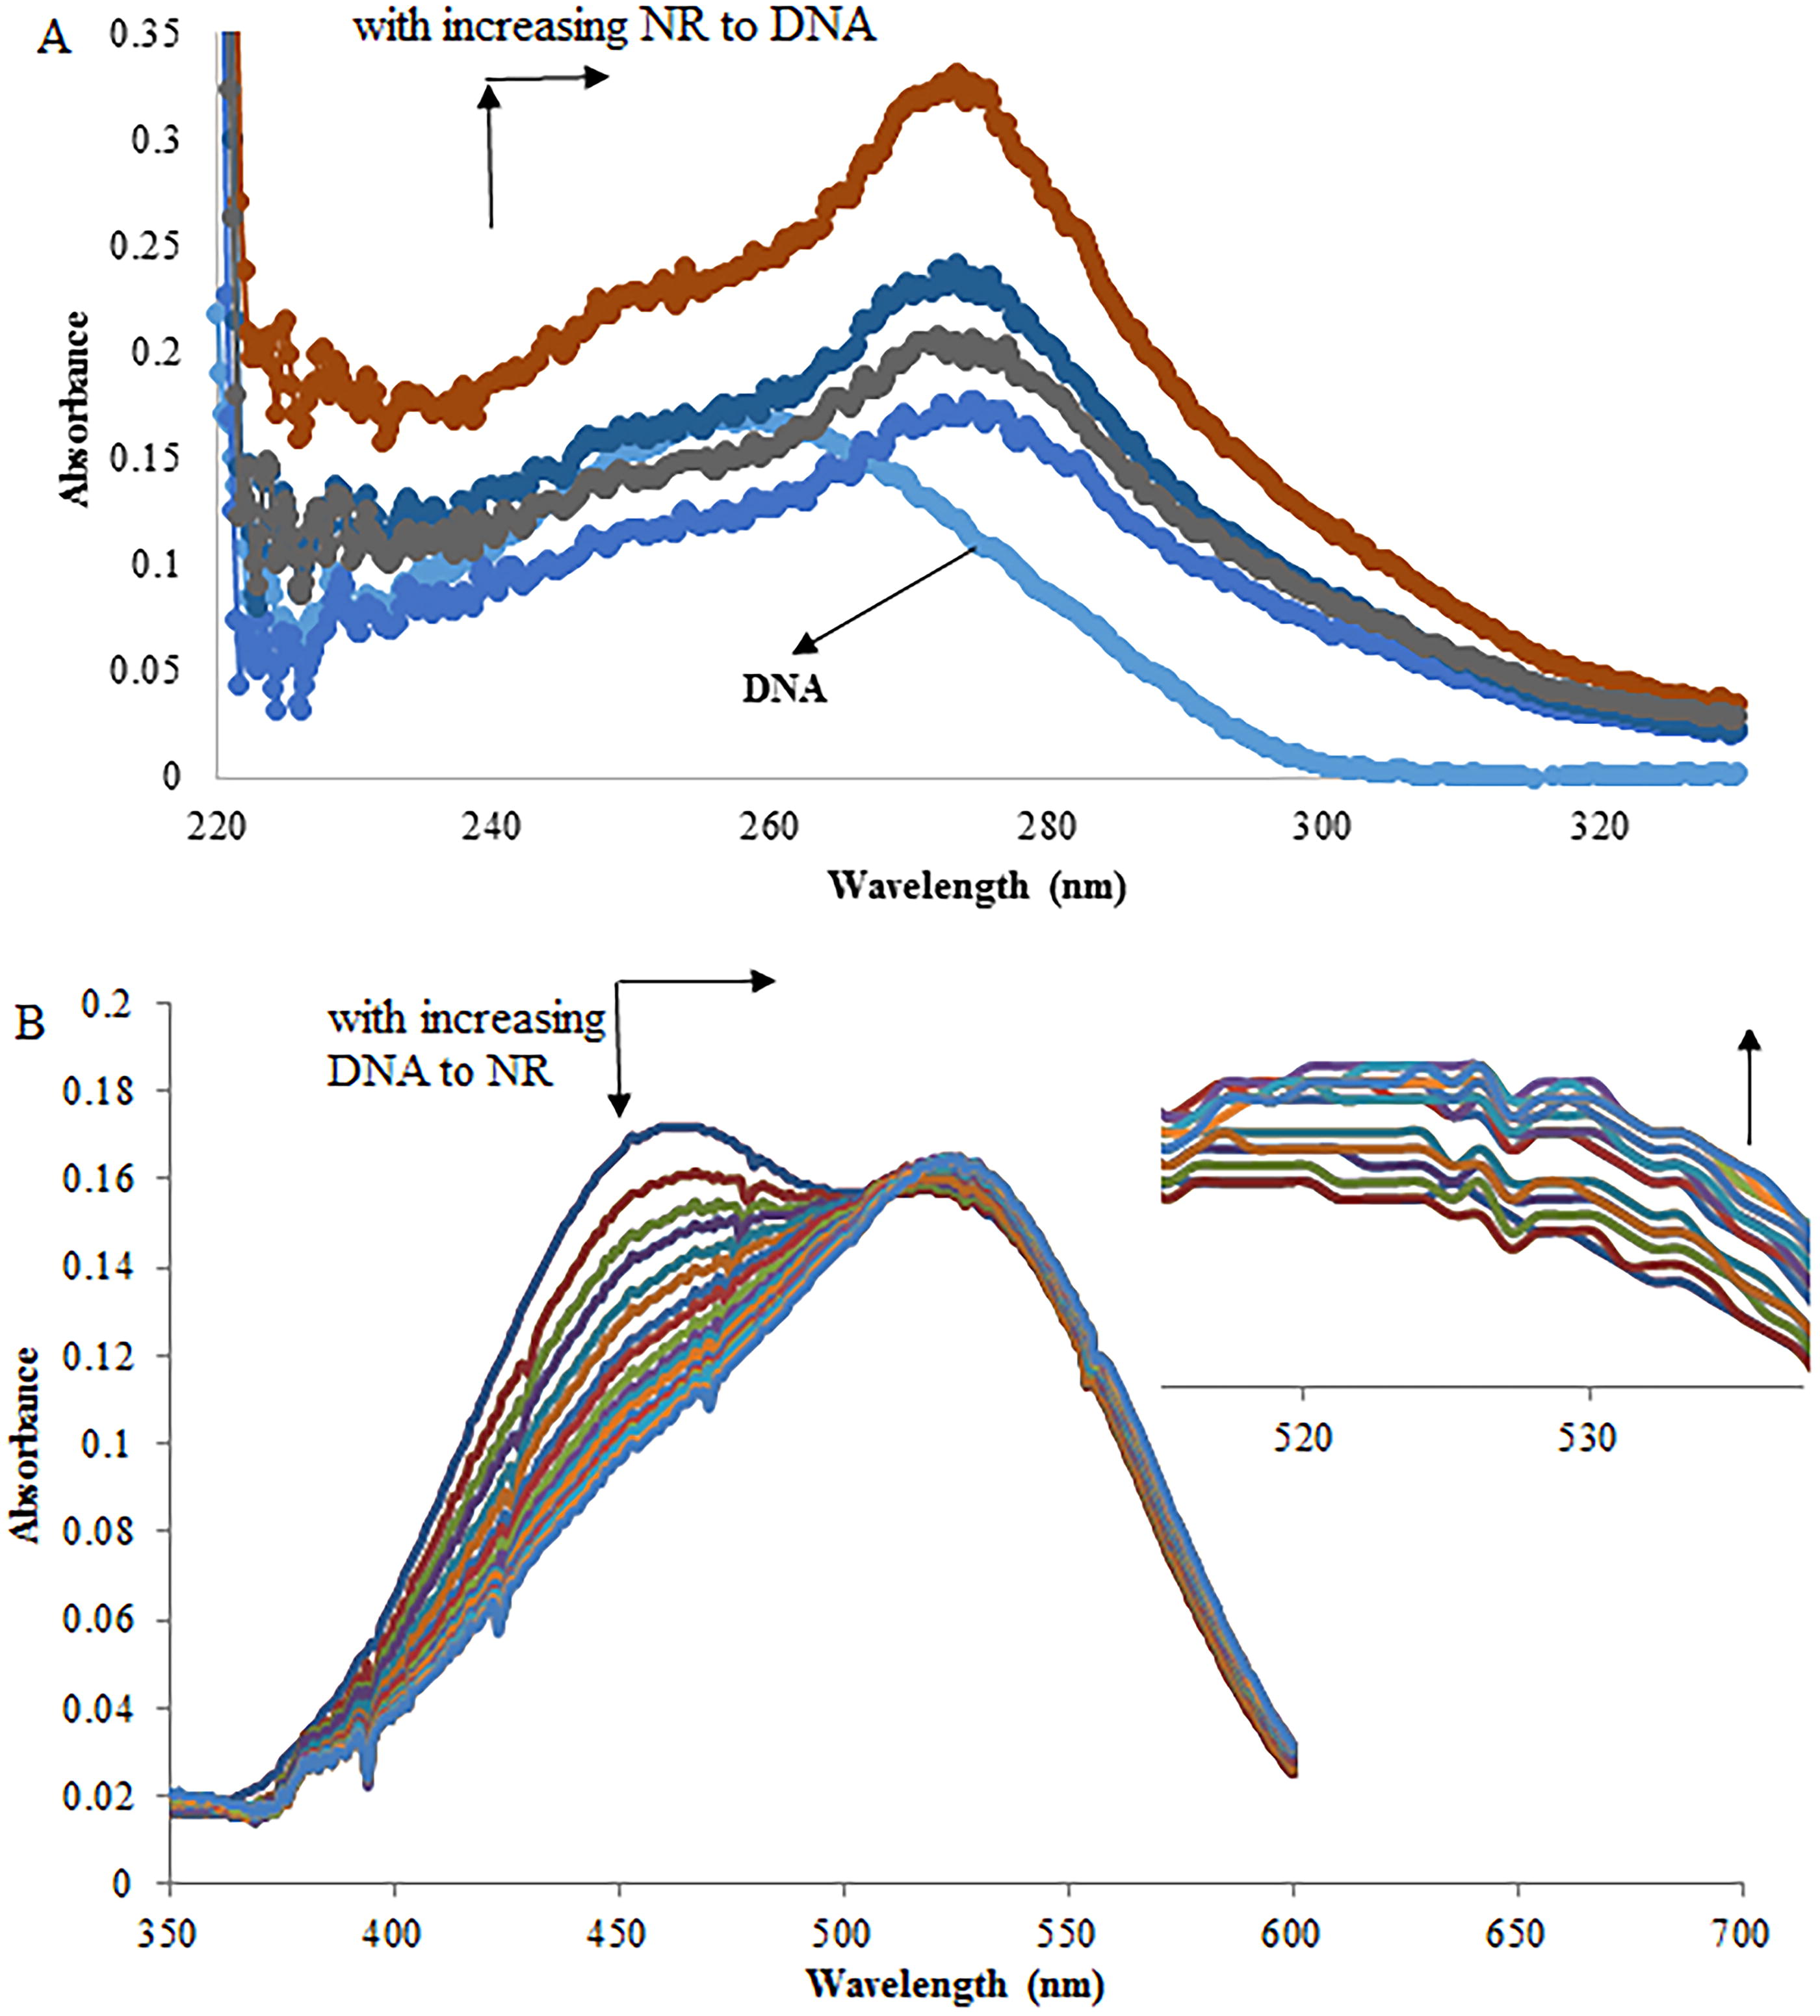
In the UV absorption spectra of DNA obtained with increasing concentrations of NR (Fig. 3A), notable hyperchromic effects and a red shift centered around 258 nm were observed. These findings suggest that the binding of NR to DNA leads to damage of the double-helix conformation. This damage is attributed to intercalation reactions, indicating that the dsDNA helix undergoes unwinding (Chen et al., 2015; Kashanian et al., 2008). Xu and his colleagues investigated the absorption spectra of NR under varying pH conditions. In the absence of DNA, the absorption peak for NR occurs at approximately 452 nm at pH 8.0. As the pH decreases, a significant bathochromic shift in absorption is observed, with an isosbestic point at 478 nm. At pH 5.0, the absorption peak for the protonated form (NRH+) is found at around 535 nm. These absorption spectra demonstrate that the presence of NR and/or NRH+ in aqueous solutions is pH-dependent (Xu et al., 2016).The absorption spectra of the NR dye, with and without DNA (pH 7.4), showed a peak at 458 nm (Fig. 3B). As DNA concentration increased, the absorption peak gradually decreased, and a new band appeared at 519 nm. The presence of an isosbestic point at 485 nm indicated the formation of a new NR–DNA complex (Xu et al., 2016). Typically, hypochromism and a red shift are indicative of molecular intercalation into the DNA base stack (Long and Barton, 1990). These observed spectral effects were attributed to the robust interaction between the electronic state of the intercalating chromophore and that of the DNA bases. It is anticipated that the strength of this electronic interaction diminishes as the cube of the distance between the chromophore and the DNA bases decreases (Huang et al., 2001). The significant spectral hypochromism observed during the interaction of the NR dye with DNA strongly suggests a short distance between the intercalated NR dye and the DNA bases. This aligns with the notion that upon intercalation of the NR dye into DNA, the π electrons of the NR dye interact with those of the DNA bases, while the vacant π* orbital of the NR dye pairs with the π orbital of the bases. This leads to a reduction in the energy of the π–π* electron transition, resulting in the observed red shift. Concurrently, the vacant π* orbital is partially filled by electrons, decreasing the probability of the π–π* transition, thereby contributing to the discussed hypochromic effect (Ni et al., 2005; Zhang et al., 2010).
Absorption spectra of competitive interaction of dithianon and NR with DNA
As the concentration of the Dithianon pesticide increased, the observed band of the NR–DNA complex at 519 nm gradually decreased in intensity. This band shifted toward the blue end of the spectrum, with a new peak emerging at 458 nm that progressively increased in intensity (Fig. 4). The appearance of an isosbestic point at 485 nm indicated the formation of a new species during the competitive interaction, confirming the reaction’s homogeneity. Compared to the absorption spectra of the NR dye in the absence or presence of DNA at pH 7.4 (Fig. 3), the results in Figure 4 showed a reverse process. The changes in band intensity and position with increasing Dithianon concentration in the NR–DNA solution (Fig. 4) suggested that Dithianon intercalated into the DNA double helix, displacing the NR fluorophore dye probe.
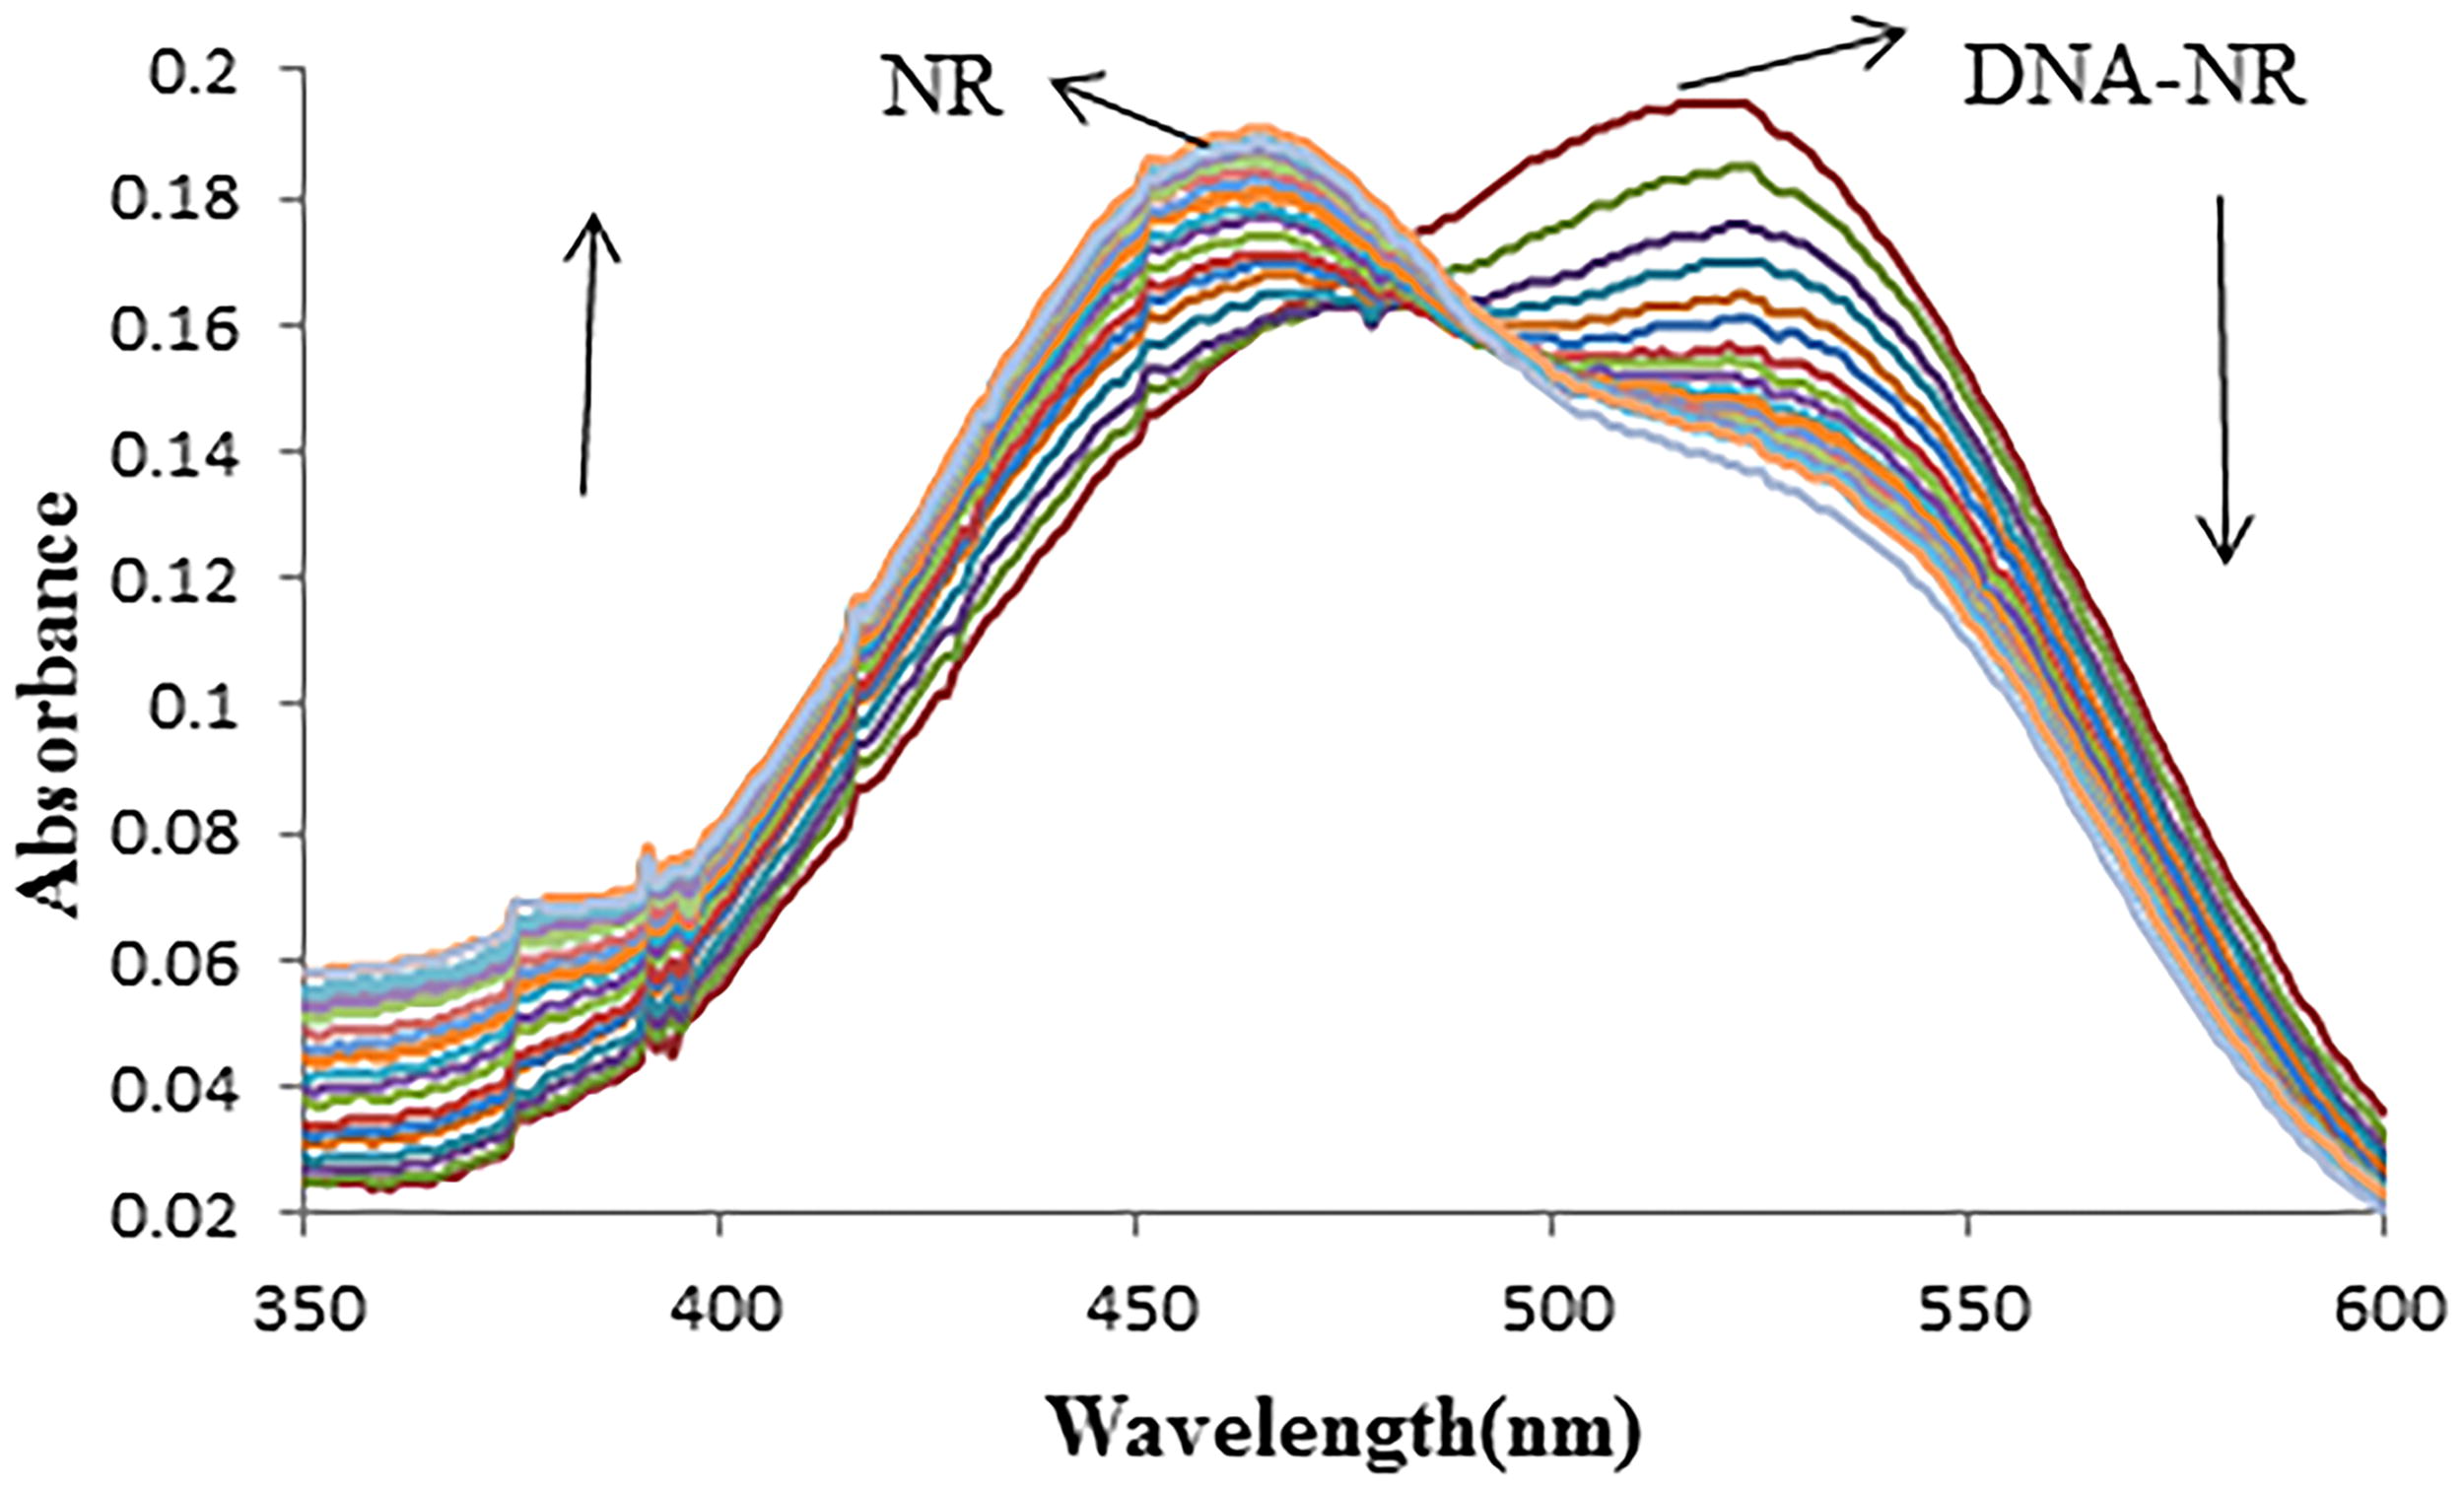
Effect of Dithianon on absorption spectra of NR–DNA: CDNA = 8 × 10⁻⁵ M, CNR = 2.00 × 10⁻⁵ M, and CDithianon = 0.0, 0.39, 1.5, 2.3, 3.4, 4.9, 7.5, and 11.5 × 10⁻⁵ M, corresponding to the curves, respectively.
Fluorescence spectroscopic studies
Fluorescence spectra of dithianon interaction with DNA
Since Dithianon exhibits luminescence, its interaction with DNA can be monitored using direct fluorescence emission methods. To investigate the interaction mode between Dithianon and CT-DNA, fluorescence titration experiments were conducted. Dithianon emitted luminescence in Tris-HCl buffer within the range of 400 to 500 nm, with a peak wavelength around 428 nm. Figure 5 shows the emission spectra of Dithianon both in the absence and presence of varying amounts of CT-DNA. The emission intensity of Dithianon decreased with increasing DNA concentration, indicating an interaction between DNA and Dithianon (Kashanian et al., 2010; Kožurková et al., 2008).
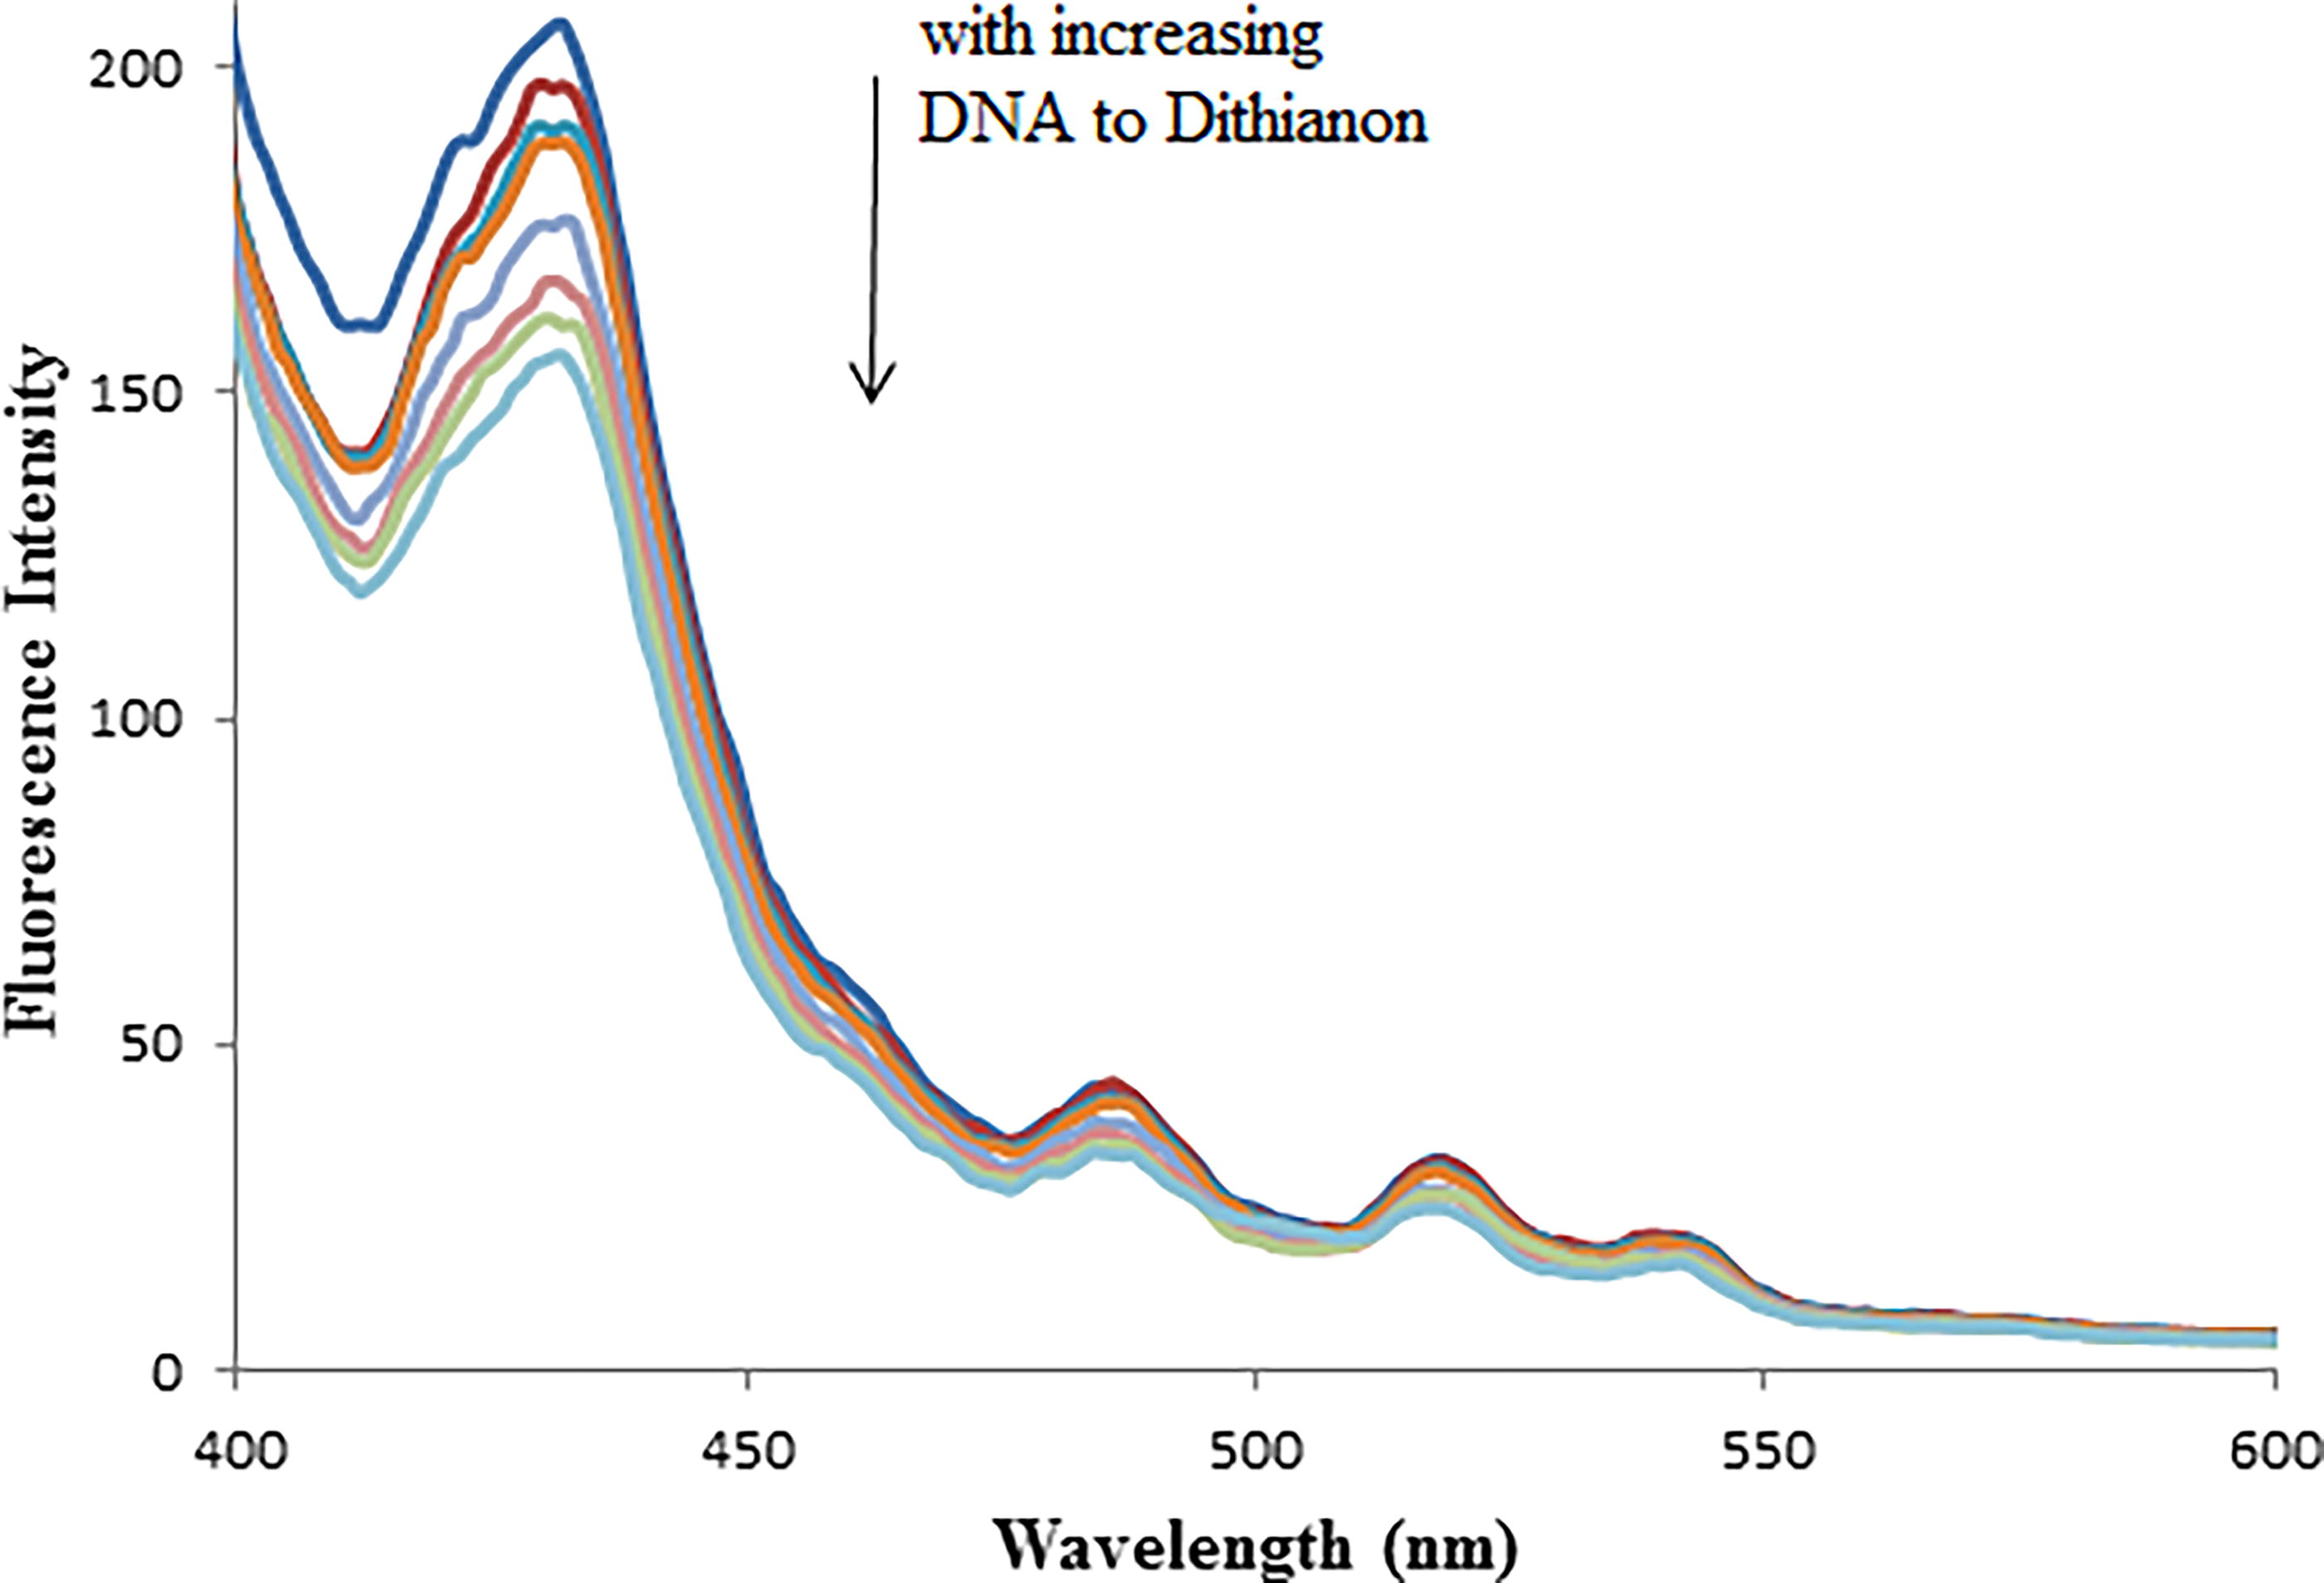
Fluorescence spectra of the Dithianon (40 μM) in the absence and presence of increasing amounts of CT-DNA (0.0, 5, 8, 10, 15, 20, 25 and 30 μM; subsequent spectra). Arrow shows the emission intensity changes upon increasing DNA concentration. λex = 380 nm.
To quantitatively assess the binding affinity of Dithianon molecules to DNA, a Scatchard plot was created by plotting log [(F0–F)/F] against log [DNA], based on Equation (2) (Arshad et al., 2016; Kashanian et al., 2010).
Where Kb represents the binding constant and n denotes the number of binding sites. F0 and F are the fluorescence intensities of the fluorophore in the absence and presence of varying concentrations of CT-DNA, respectively.
The Scatchard plot of log [(F0−F)/F] versus log [DNA] showed a good linear correlation (Fig. 5). Based on the line slope, the binding constant of Dithianon–DNA, Kb, was obtained equal to 2.3 × 10⁵ M−1, with n ≈ 1.28.
The values of Kb (2.3 ×10⁵ M−1) clearly indicate the remarkably high affinity of Dithianon for DNA. Comparing the calculated Kb value for Dithianon and CT-DNA interaction with those of known intercalators confirmed that Dithianon binds to DNA through intercalation (Dimitrakopoulou et al., 2008; Giri and Kumar, 2008; Kashanian and Dolatabadi, 2010).
Characteristics of fluorescence spectra of interaction between dithianon and DNA–NR
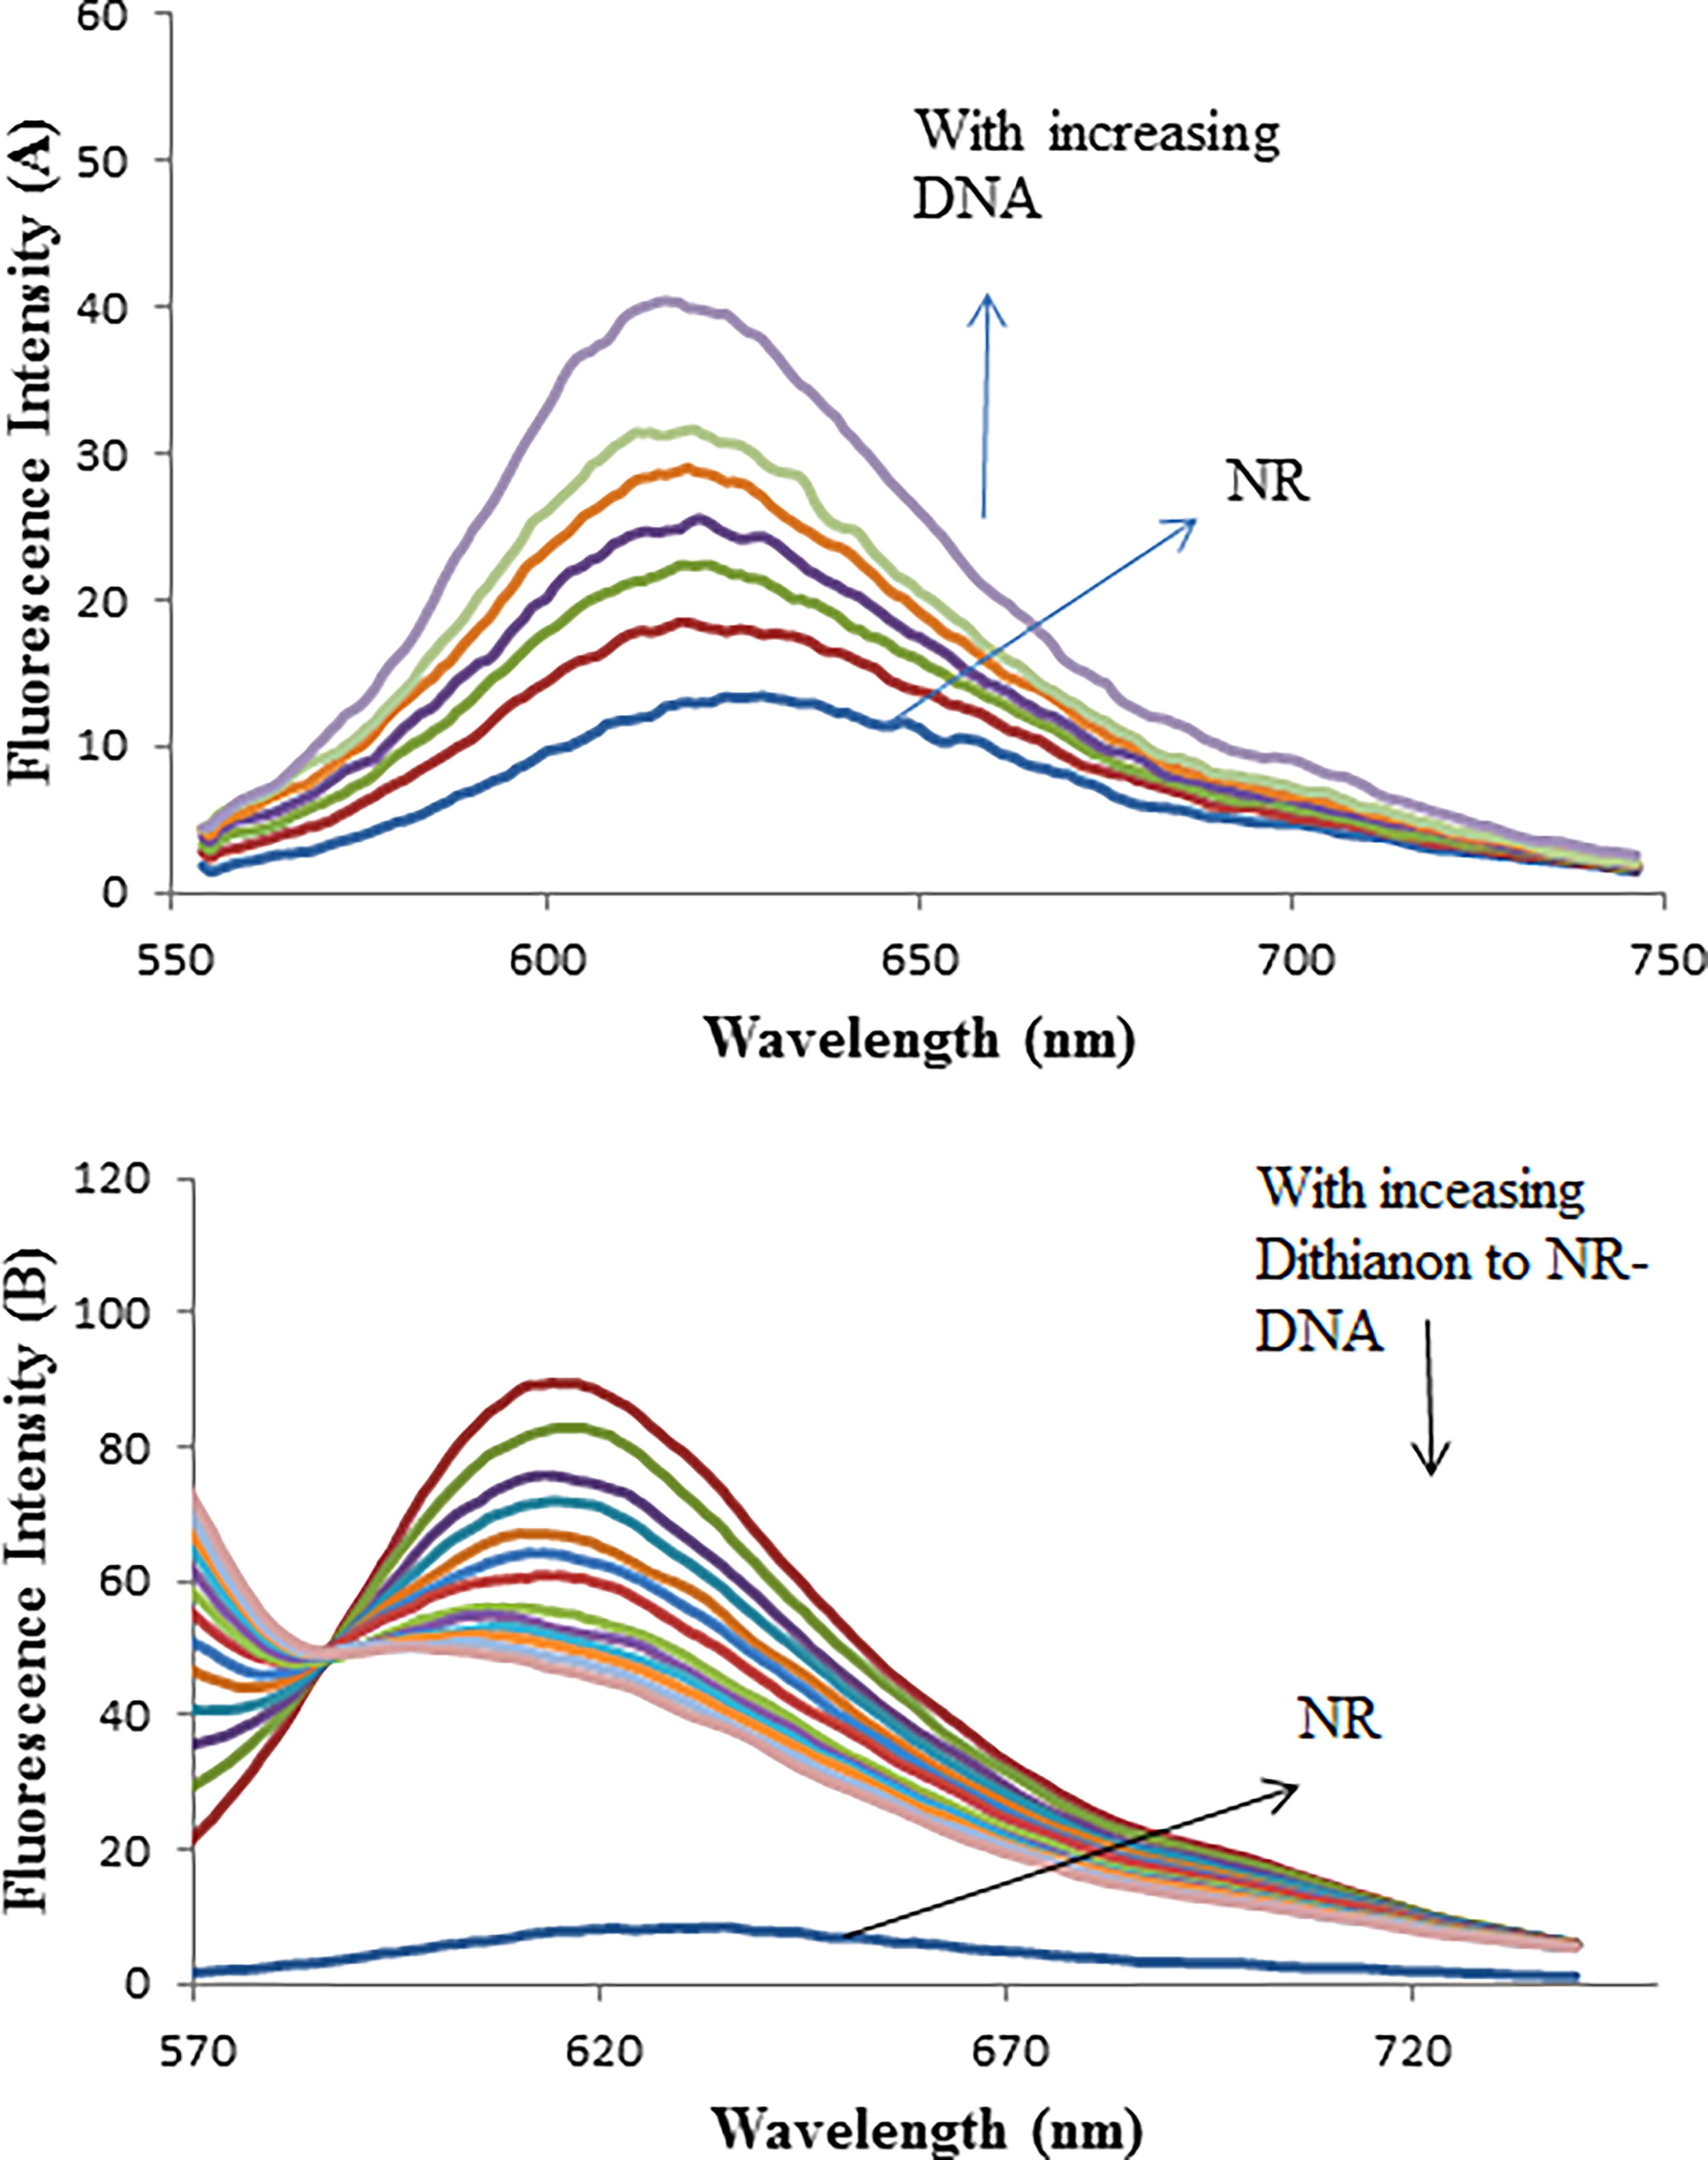
The interaction of NR with CT-DNA at pH 7.4 was characterized using fluorescence spectra (Zhang et al., 2004). The results indicated that NR initially exhibited weak fluorescence in the Tris–HCl buffer due to quenching by the solvent molecules. However, as the concentration of DNA increased, the fluorescence intensity of NR significantly increased due to its intercalation into the DNA base pairs (Fig. 6A). These spectral changes are similar to those observed during the interaction between ethidium bromide (EB) and DNA (Arjmand and Aziz, 2009). Ethidium bromide (EB) is a well-known intercalator that exhibits weak fluorescence, which is significantly enhanced in the presence of DNA due to strong intercalation between adjacent DNA base pairs. In the present study, adding Dithianon to a DNA–NR solution released some NR molecules into the solution after being displaced by Dithianon. This displacement resulted in fluorescence quenching (Fig. 6B), indicating interactions between DNA–NR and Dithianon and suggesting the formation of a DNA–Dithianon complex. Two primary mechanisms for quenching are dynamic (collisional) and static. Dynamic quenching occurs when the quencher (Dithianon) contacts the fluorophore (NR–DNA) in its excited state, causing the excited fluorophore to lose energy through collision without forming a new chemical species. Static quenching, however, involves the formation of a complex between the quencher and the fluorophore in the ground state. These mechanisms can be distinguished by examining the effect of temperature on the quenching constants and analyzing the temperature dependence of fluorescence lifetime and viscosity (Li et al., 2005).
Increasing the temperature diminishes the stability of products resulting from static quenching, as higher temperatures encourage increased collisions, thereby promoting dynamic quenching. Additionally, in static quenching, the lifetime of the excited state of the fluorophore remains unaffected despite elevated temperatures due to interactions with the ground state of the fluorophore, whereas in dynamic quenching, the lifetime is significantly reduced. Given these considerations, the Stern–Volmer equation is commonly employed to explore the quenching mechanism (Jalali and Rasaee, 2015):
The KSV of NR–DNA fluorescence by Dithianon at different temperatures (290, 298, 303 and 310 K) was obtained and the results are shown in Figure 6 and Table 1. These results show that Dithianon can quench NR–DNA fluorescence in a static quenching procedure, because the Ksv is decreased by temperature rising (Shahabadi et al., 2009).
The Quenching Constants of Neutral Red–DNA by Dithianon at Different Temperatures
Based on literature findings, with a fluorescence lifetime (τ) of approximately 10−8 s, Kq was determined to be 1.14 × 10¹² at 310 K. This value exceeds the limiting diffusion rate constant of biomolecules (2.00 × 10¹⁰), suggesting that static quenching took place in the quenching of NR–DNA by Dithianon (Ling et al., 2008; Zhang et al., 2010).
Binding constant and binding sites
When small molecules independently bind to equivalent sites on a macromolecule, the equilibrium between free and bound molecules can be described by Equation (2). The values of K and n were determined, using this equation, as summarized in Table 2. The binding constant decreased with increasing temperature, indicating an exothermic reaction. A value of n close to 1 suggests the presence of a single binding site in DNA for Dithianon. Under these conditions, where the neighbor exclusion parameter, n, equals 1, it is assumed that Dithianon molecules intercalate between all interbase spaces.
Binding Constants, Number of Binding Sites and Relative Thermodynamic Parameters of IBT-DNA System
ΔG, free energy change; ΔH; enthalpy change; Kf, binding constants; n, binding sites; ΔS, entropy change.
The thermodynamic parameters and nature of the binding forces
Given the correlation between binding constant and temperature, it is inferred that a thermodynamic process governs the formation of the complex. Consequently, an analysis of temperature-dependent thermodynamic parameters was conducted to delve deeper into the interaction forces between Dithianon and DNA. These forces encompass hydrogen bonding, van der Waals interactions, hydrophobic forces, and electrostatic interactions, among others. Thermodynamic parameters of the binding reaction serve as primary evidence in substantiating the binding forces.
If there is minimal variation in the enthalpy change (ΔH) across the temperature range under examination, both its value and that of the entropy change (ΔS) can be ascertained using the van’t Hoff equation (Pakravan and Masoudian, 2015):
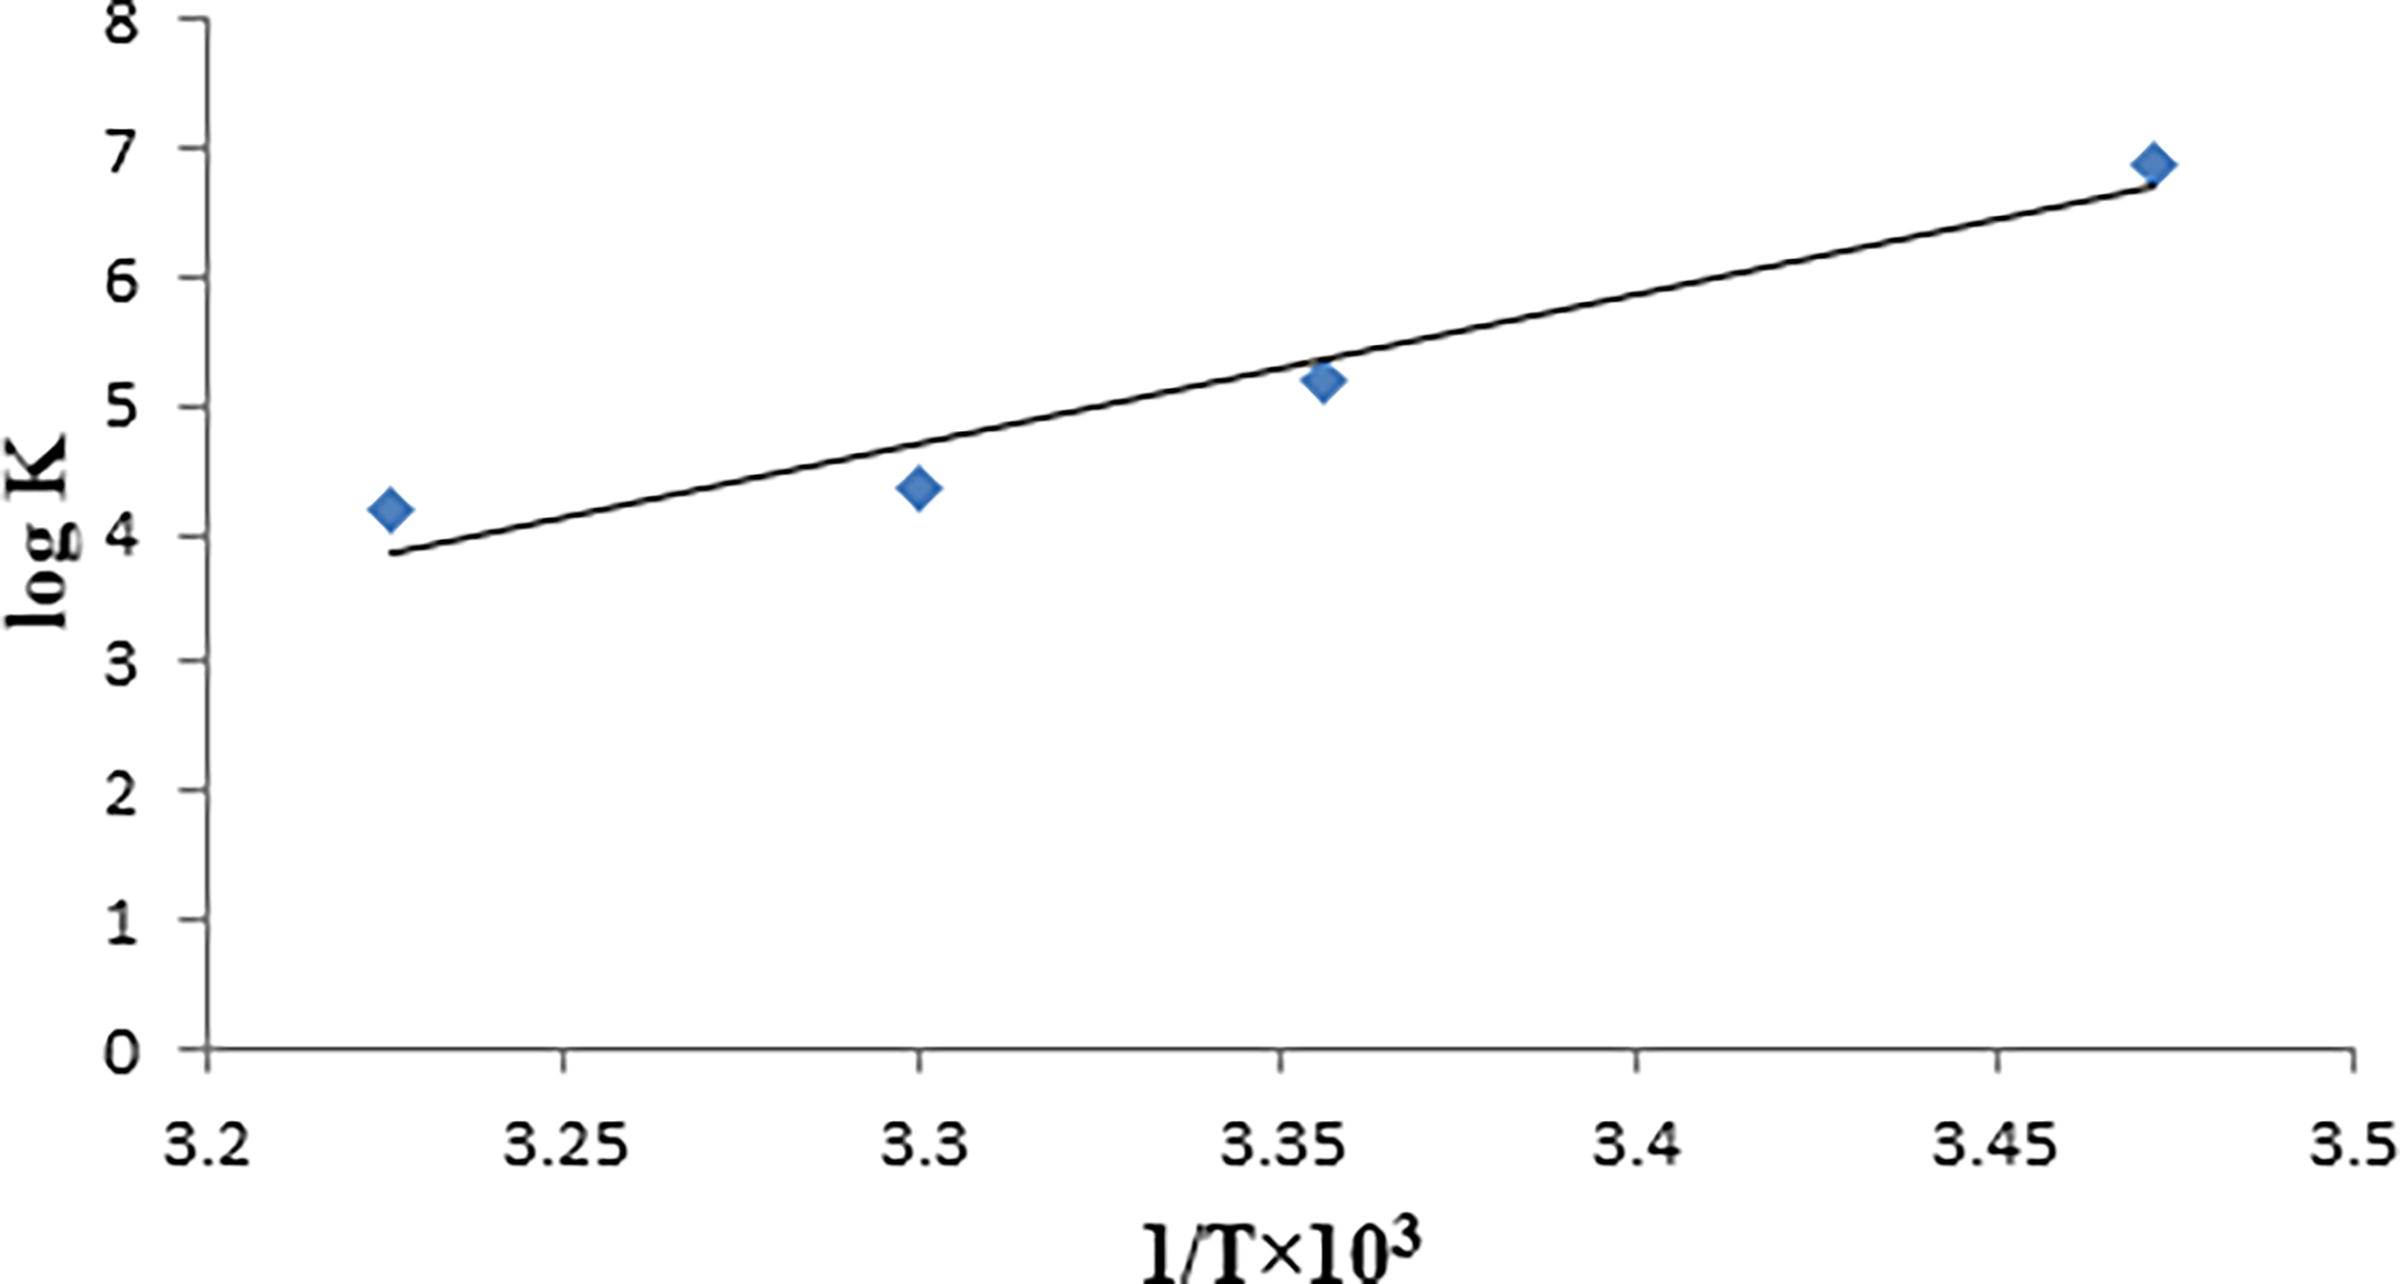
Van’t Hoff plot for Dithianon–DNA complex by plotting log Kf at four different temperatures (288, 295, 303, and 310 K) versus 1/T.
Typically, small molecules adhere to biomacromolecules through four primary binding modes: hydrogen bonding, van der Waals interactions, electrostatic interactions, and hydrophobic interactions. The most important indicators for identifying bond formation are thermodynamic parameters, including enthalpy change (ΔH), entropy change (ΔS), and free energy change (ΔG) (Fu et al., 2014).
The interaction between a small molecule and a macromolecule in an aqueous environment primarily involves van der Waals and electrostatic interactions, along with the hydrophobic effect. This effect entails the liberation of water molecules from their solvation shells into the bulk solvent. Ross and Subramanian (Ross and Subramanian, 1981) elucidated the correlation between the sign and magnitude of thermodynamic parameters and the binding force. They established that when ΔH < 0 or ΔH ≈ 0 and ΔS >0, the predominant binding force was electrostatic in nature. In cases where ΔH < 0 and ΔS < 0, the primary binding force was attributed to van der Waals forces or hydrogen bonds. Conversely, when ΔH >0 and ΔS >0, the primary binding force was associated with the hydrophobic effect (Bi et al., 2012). The significant negative values of the free-energy changes (ΔG) observed in Dithianon–DNA interactions indicate a strong association between them. This suggests that van der Waals interactions or hydrogen bonds primarily facilitate the binding of Dithianon to CT-DNA, with intercalation binding mode. Moreover, the negative entropy change is attributed to the intercalation of Dithianon between CT-DNA bases, leading to the loss of translational and rotational degrees of freedom. It’s noteworthy that groove binding is primarily driven by entropy, while intercalation is driven by enthalpy.
Viscosity measurements
A notable characteristic of the traditional intercalation model, initially introduced by Lerman, is the elongation of the DNA helix as the ligand binds, causing the separation of base pairs (Suh and Chaires, 1995). It’s established that compounds like Hoechst 33258, which bind to the DNA grooves, do not elongate the DNA helix and thus do not affect its relative viscosity. Conversely, cisplatin, known for covalently binding to DNA and causing kinks, shortens the axial length of the double helix, leading to a decrease in relative viscosity. Partial intercalators also reduce axial length, resulting in decreased relative viscosity. In contrast, classical organic intercalators like ethidium bromide elongate the DNA helix, making it more rigid and increase the relative viscosity (Jin and Yang, 1997; Kashanian et al., 2012; Shahabadi and Mohammadi, 2012).
The connection between the alteration in contour length (from Lo to L) and the shift in intrinsic viscosities (from η0 to η) of both unbound and bound DNA is expressed as follows (Das and Kumar, 2008):
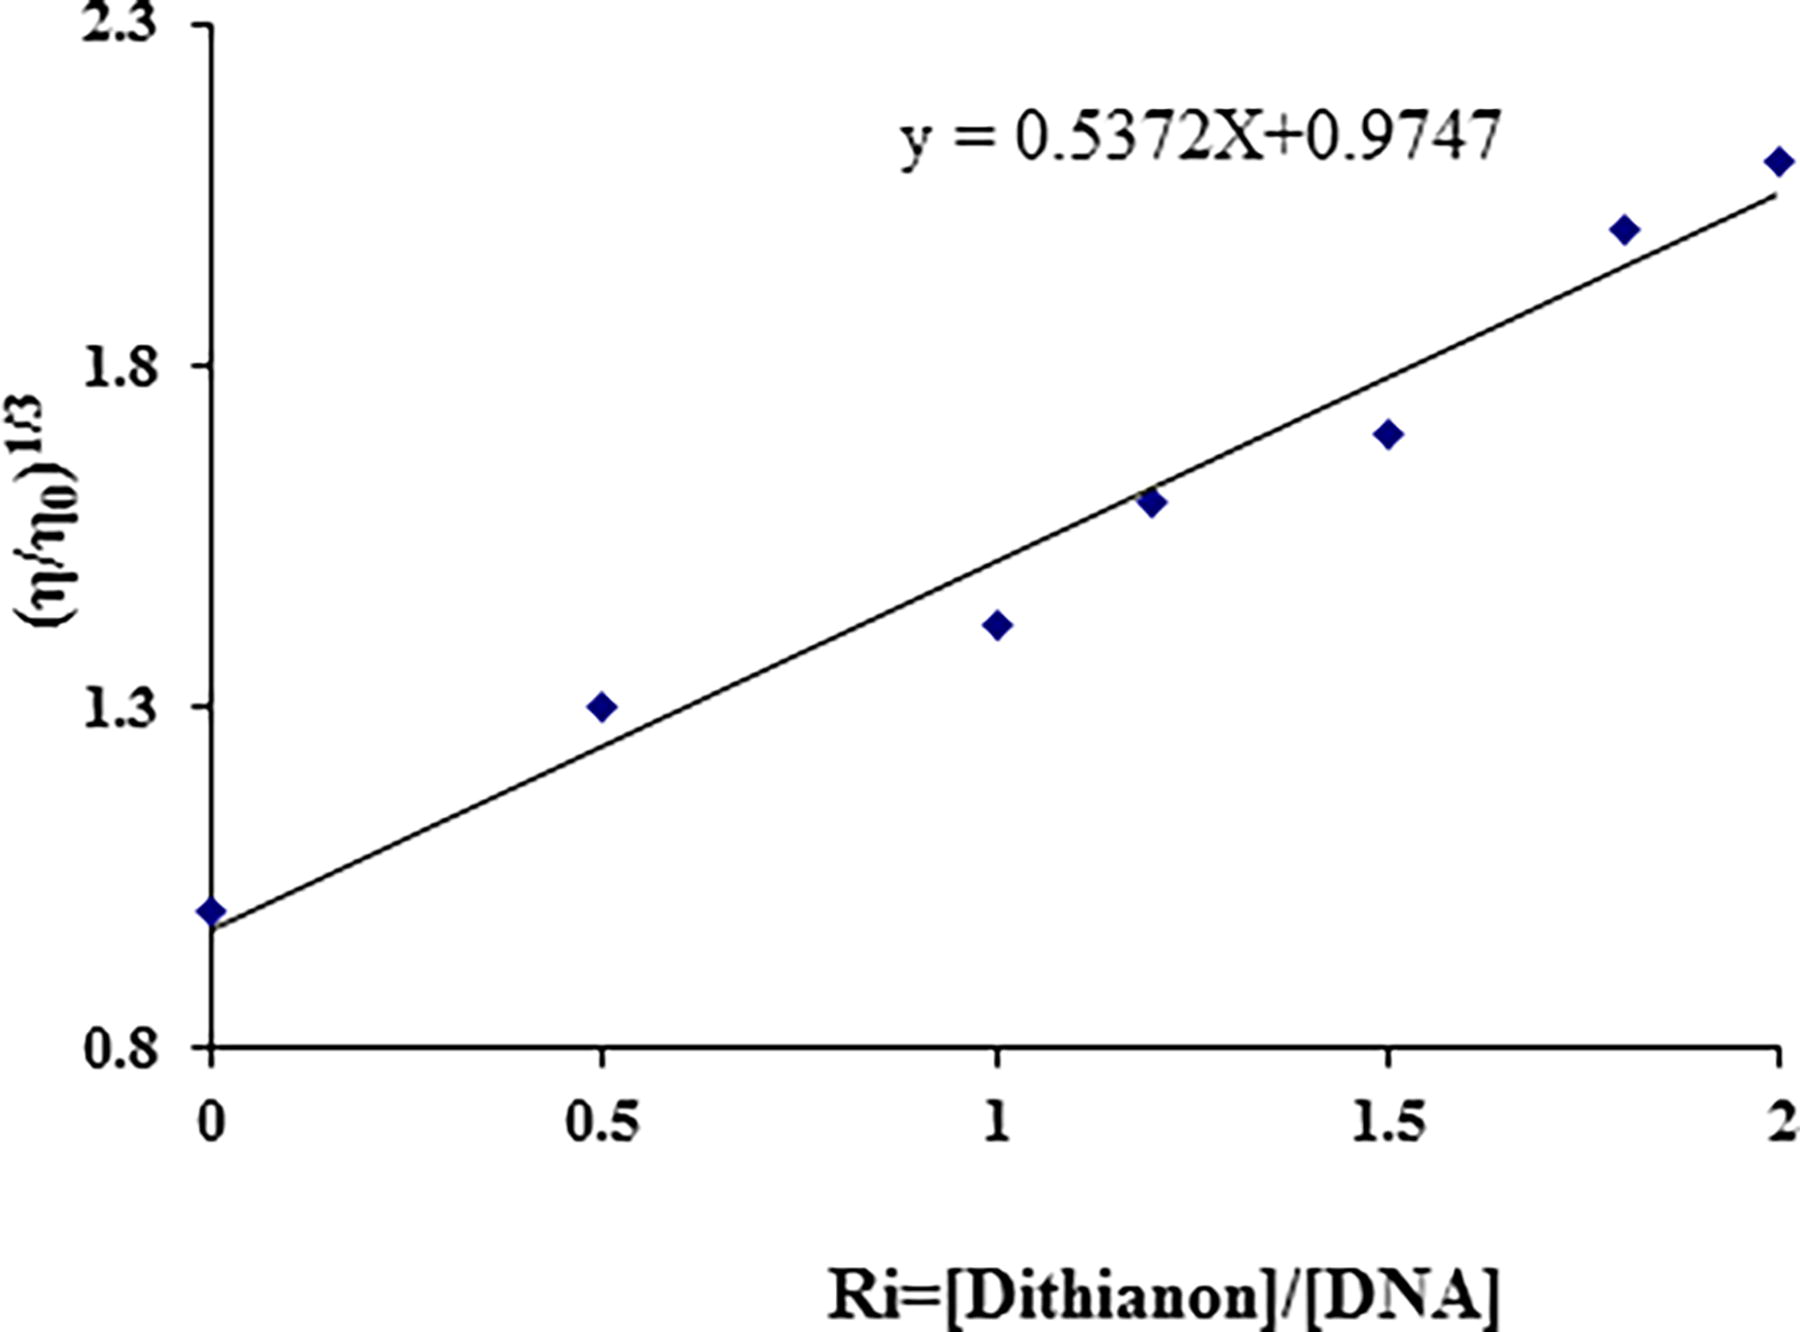
Effect of increasing amounts of Dithianon on the viscosity of CT-DNA (5 × 10⁻⁵ M) in 10 mM Tris–HCl buffer (pH 7.4) at 298K (ri = 0.0, 0.5, 1, 1.2, 1.5, 1.8, and 2).
Circular dichroism spectral studies
CD spectroscopy stands out as a potent tool for showing alterations in DNA structure amid interactions with ligands. This sensitivity to DNA conformation renders CD spectroscopy highly informative in the field of ligand-DNA interactions (Tao et al., 2016).
CD absorption spectroscopy is highly attuned to alterations in the secondary structure of DNA at a local level. It discerns variations in the absorption of left- and right-handed polarized light, offering insights into structural asymmetry. The CD spectrum of CT-DNA typically shows a positive band at 275 nm, attributable to base stacking, and a negative band at 245 nm, indicative of its right-handed B form helicity. Interestingly, Dithianon did not exhibit any CD signal in the UV region spanning 230–300 nm, as illustrated in Figure 9 (Chen et al., 2009).
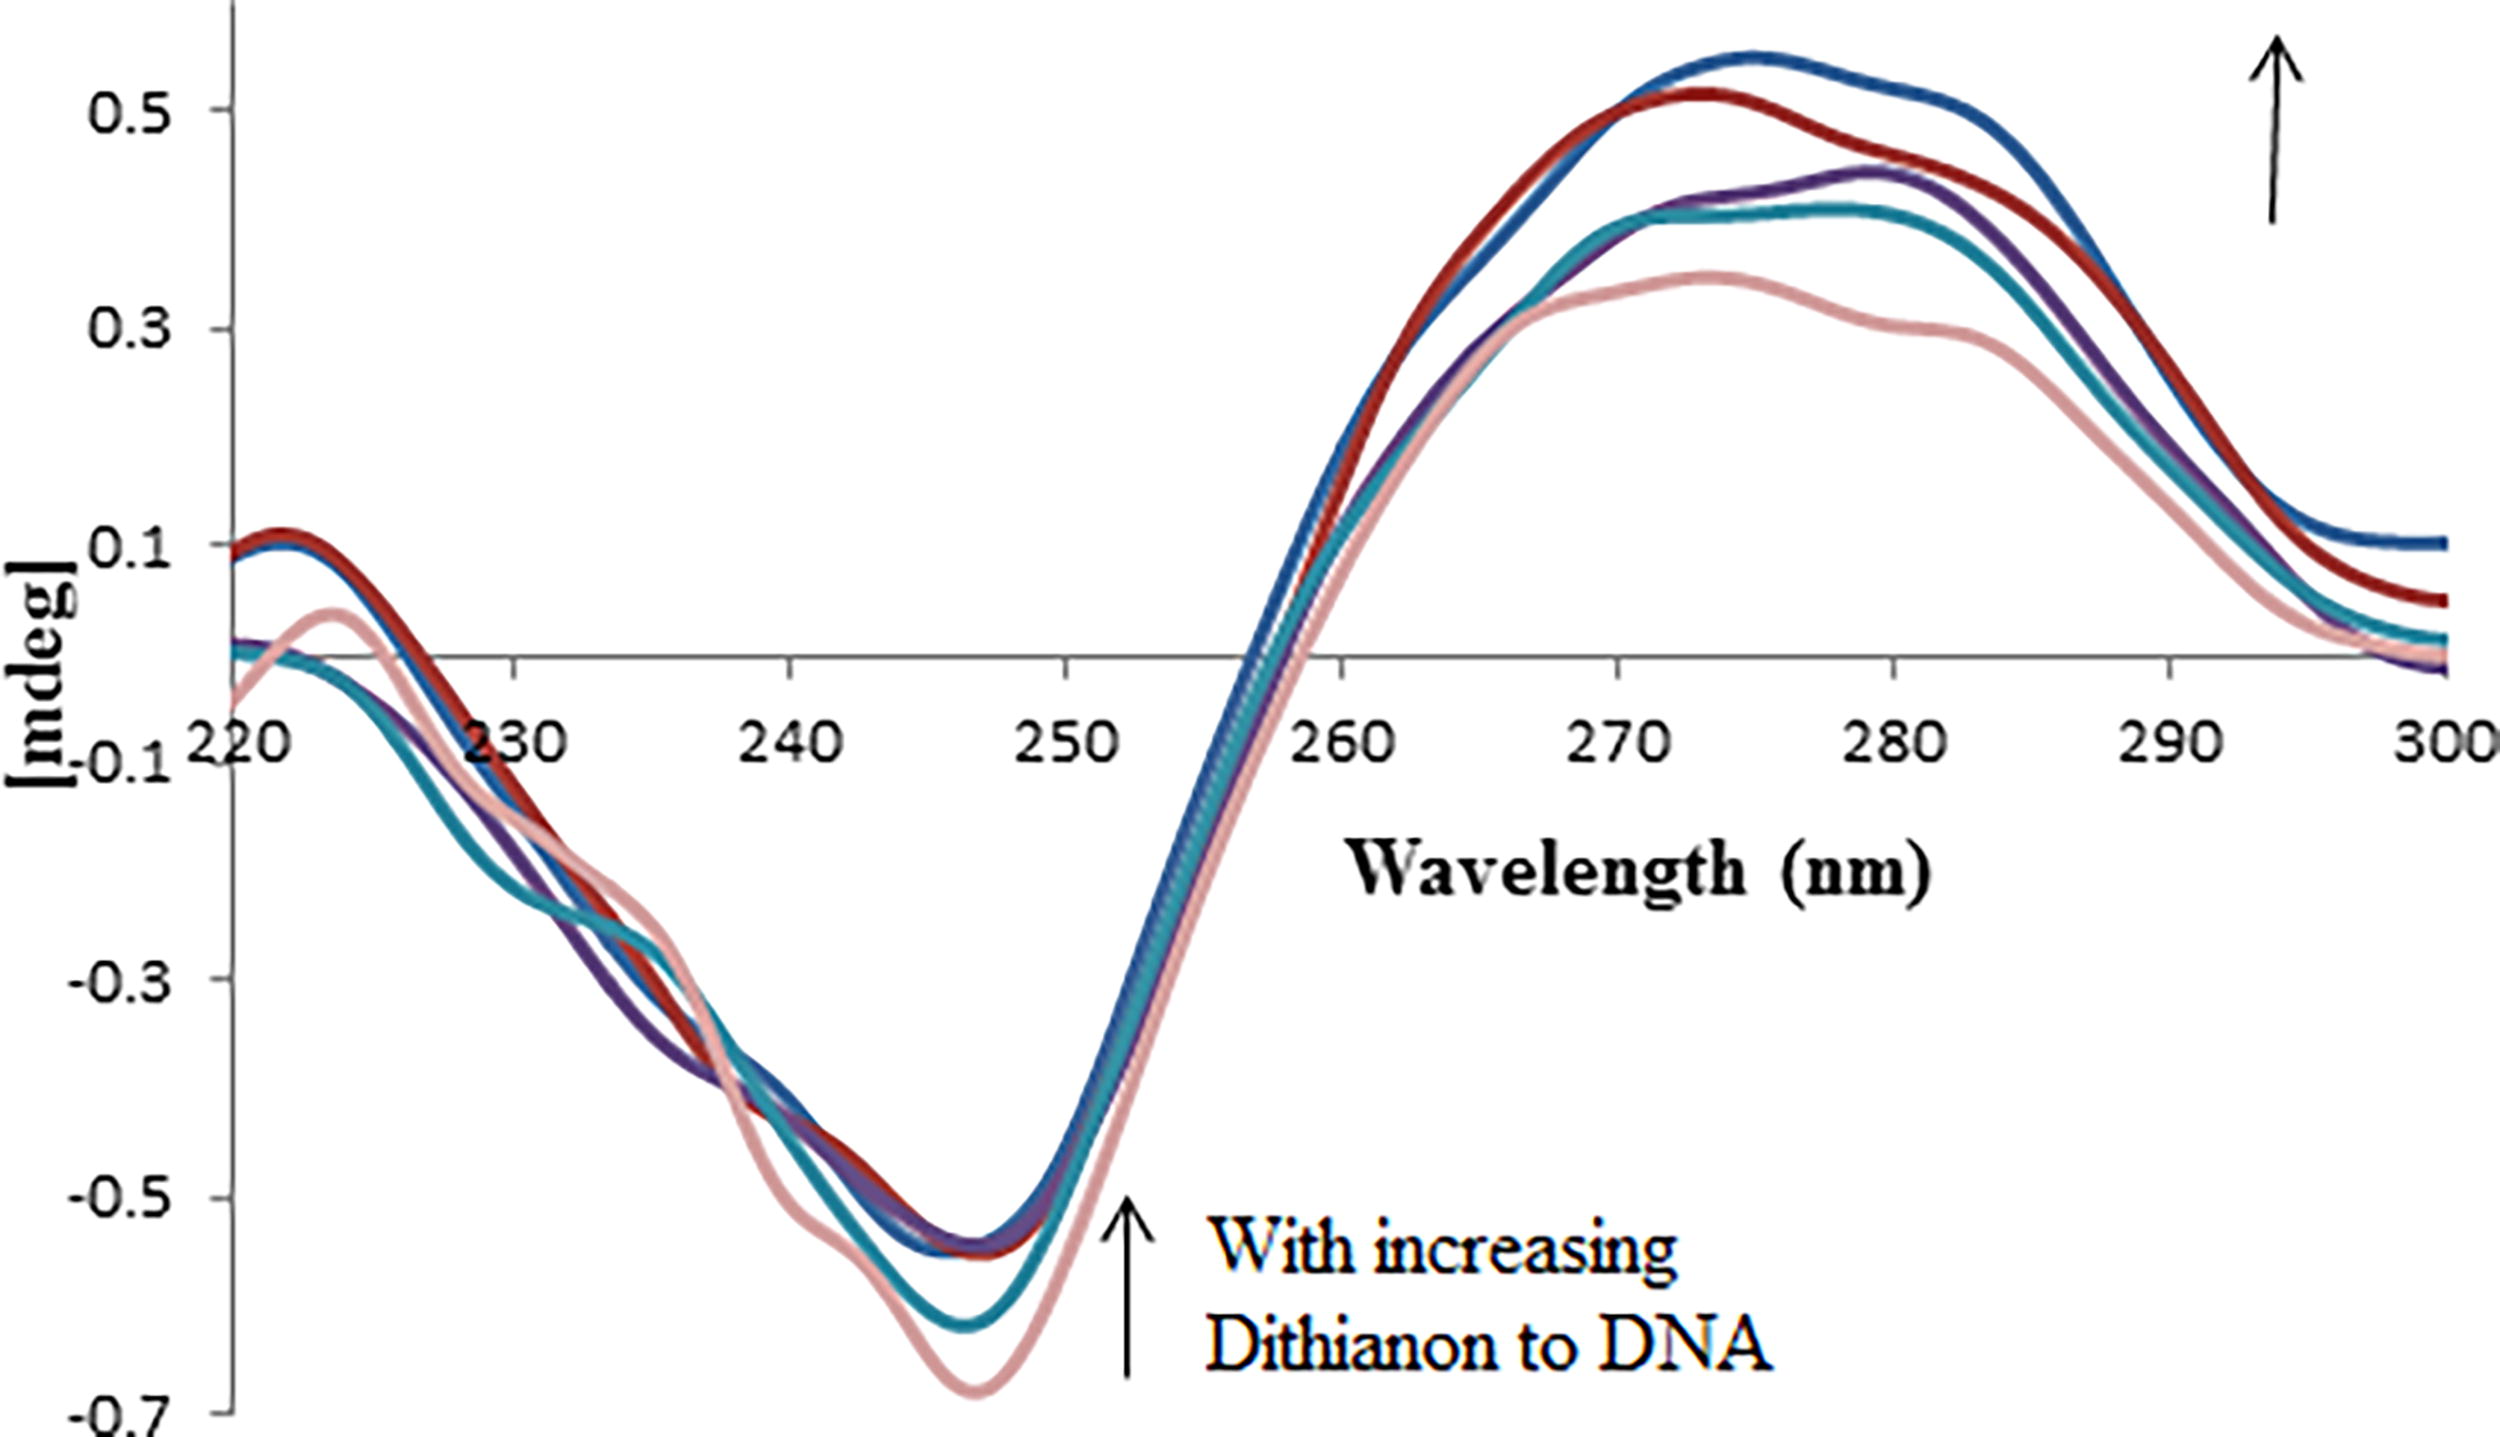
Circular dichroism spectra of DNA (6.0 × 10⁻⁵ M) in 10 mM Tris-HCl buffer, in the presence of increasing amounts of Dithianon (ri = [Dithianon]/[DNA] = 0.0, 0.1, 0.2, 0.4, and 0.7).
The CD investigations demonstrated that the presence of Dithianon could indeed influence the conformation of DNA (Fig. 9). Notably, there was a discernible decrease in the negative peak, with a simultaneous rise observed in the positive peak, indicating a shift towards the zero level (Dorraji and Jalali, 2013).
As the concentration of Dithianon increased progressively, the positive band exhibited a rise in molar ellipticity without significant shifting in the band maxima. These findings strongly suggest the intercalative mode of Dithianon binding, wherein the molecules stack between the base pairs of DNA, thus intensifying the positive band. Furthermore, the CD spectrum indicated a reduction in helicity upon Dithianon binding, leading to a conformational shift in CT-DNA from a more B-like to a more A-like structure, i.e., characteristic of intercalative binding (Pakravan et al., 2013).
Similar observations were noted with [Co(bipy)2(ip)]3+ and specific Ru(II) complexes interacting with CT DNA (Shahabadi and Mahdavi, 2013).
The alterations in CD signals of DNA interacting with a complex can frequently be linked to the corresponding modifications in DNA structure. Basic groove binding or electrostatic interaction of a component typically induces minimal to no disturbance in base stacking and helicity. Conversely, when a complex intercalates into DNA, it tends to reinforce the helix conformation of CT-DNA.
Electrochemical interaction of dithianon with CT-DNA
Utilizing electrochemical techniques to investigate DNA interactions offers a valuable supplement to conventional methods like UV–Vis spectroscopy and viscosity measurements. The electrochemical behavior of Dithianon was scrutinized at pH 7.4. The appearance of a wave/peak is associated with the reduction of the quinone group to its hydroquinone counterpart in a two-electron process. In cyclic voltammetry, an anodic peak (a) emerges during the reverse scan, likely indicating the oxidation of the resultant hydroquinone to its corresponding quinone form. Representative voltammograms are depicted in Figure 10.
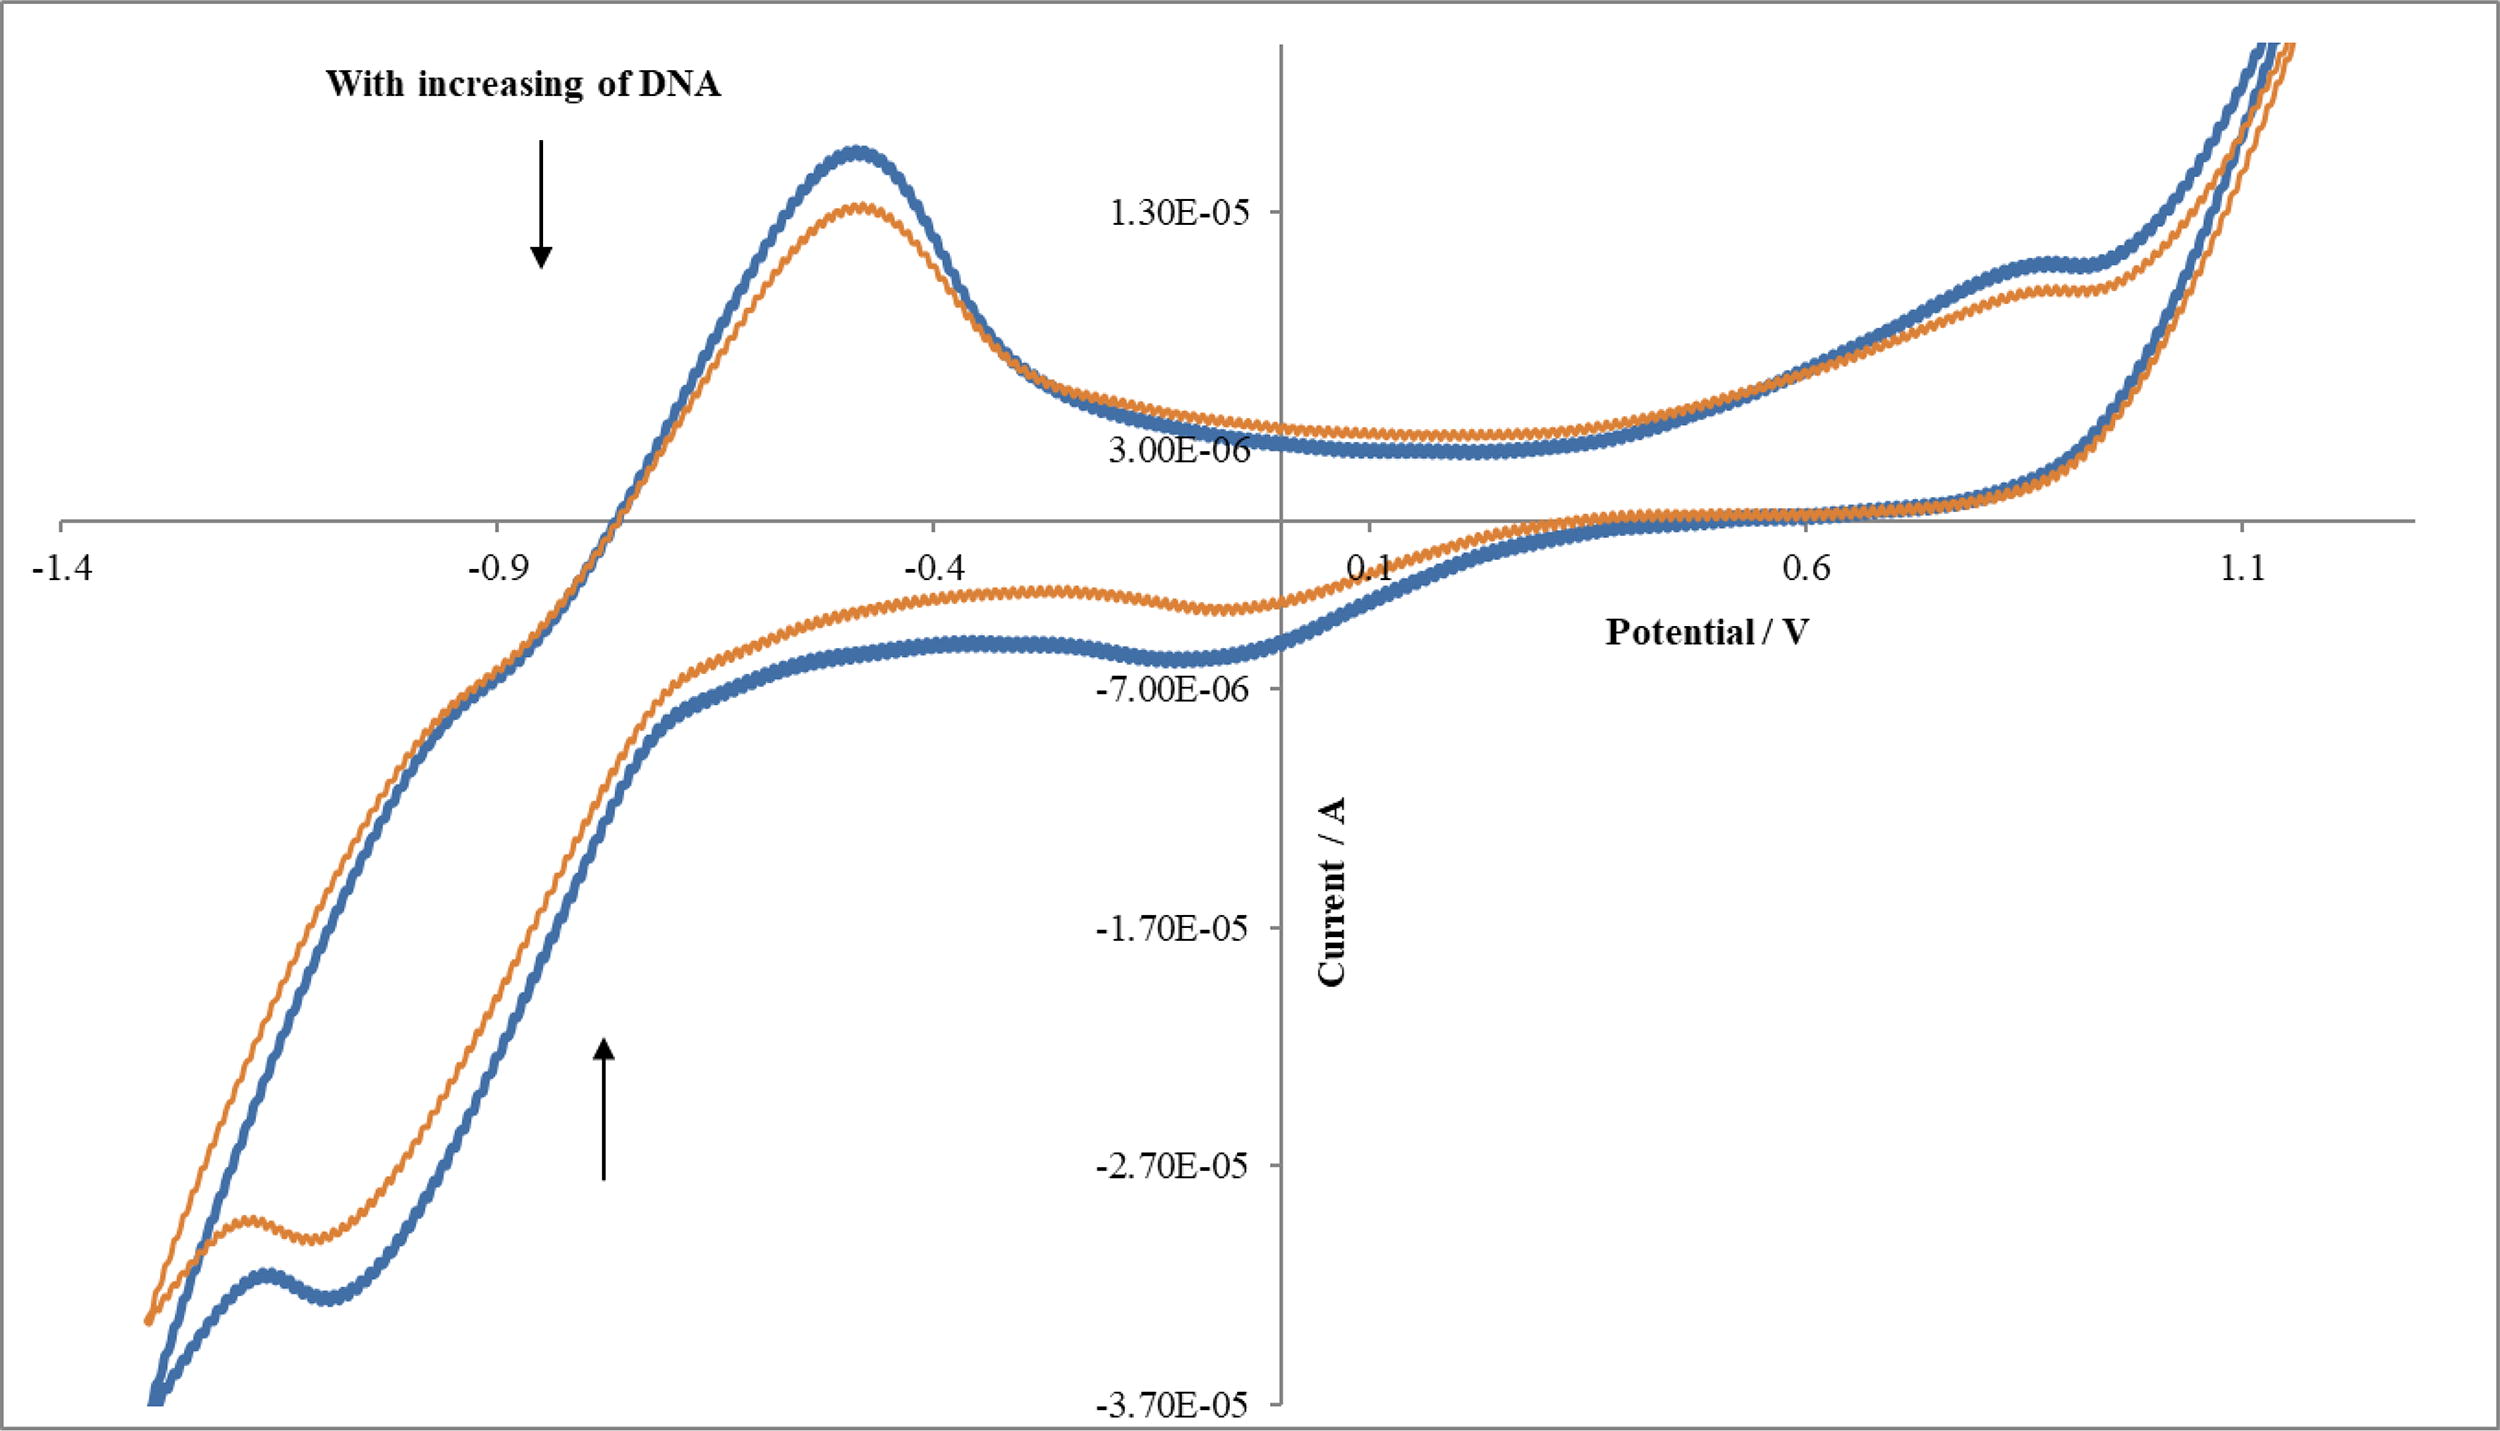
Cyclic voltammogram of 2 × 10⁻⁴ mol L−1 of Dithianon with addition of DNA (0.0, 9 μM) in DMSO-Tris-HCl buffer solution (pH 7.4).
A plausible reduction mechanism for the compound across the entire pH spectrum can be proposed (Fig. 11):

Reduction mechanism of Dithianon.
In this study, these approaches were employed to elucidate the interaction between DNA and Dithianon. Figure 10 illustrates typical cyclic voltammetry curves for 2 × 10⁻⁴ M Dithianon in Tris-HCl/NaCl buffer (pH 7.2), with and without DNA presence. The results from cyclic voltammetric measurements indicate a consistent decrease in both the anodic and cathodic peak currents of Dithianon with increase in the amounts of added DNA. These findings are indicative of Dithianon intercalating into the DNA molecule (Kashanian and Dolatabadi, 2009).
The electrochemical behavior of Dithianon is a well-known phenomenon, and it was observed in this study that it is significantly influenced by the electrode material. A distinct and sensitive peak was discerned in solutions containing Dithianon when a Pt electrode was employed, as opposed to a Glassy carbon electrode. Thus, a Pt electrode was selected for this investigation. By adding CT-DNA to a Dithianon solution, both the anodic and cathodic peak current heights exhibited a consistent decrease with increasing DNA concentrations (Fig. 10). Furthermore, as DNA was added, there was a marginal positive shift observed in the anodic peak potential (Epa), cathodic peak potential (Epc), and E1/2 (averaged from Epc and Epa). Such positive shifts are indicative of Dithianon intercalating into the DNA molecule, attributed to hydrophobic interactions. The cyclic voltammetric measurements also suggest that the primary mode of interaction between Dithianon and DNA is intercalation, with the electrostatic mode playing a minimal role in their interaction (Kashanian and Dolatabadi, 2009; Ni et al., 2006).
Stabilization energies of the Dithianon–DNA
Computational molecular modeling techniques were employed to elucidate the precise atomic-level details of Dithianon–DNA interactions (Fig. 12, Table 3). It is evident that the Dithianon predominantly interacts with base pairs, engaging both the major and minor grooves and establishing connections at these specific base pair locations. In this context, the interaction energy between Dithianon and DNA primarily arises from π–π stacking and Van der Waals forces. Dipole-dipole interactions, π–π stacking, and hydrogen bonds between the DNA base pairs and ligand are responsible for the stability of the docked poses (Shukla et al., 2022). Experimental evidence suggests that as the reaction progresses and the Dithianon becomes intercalated within the base pairs, the nature of interaction forces likely transitions to hydrophobic Van der Waals interactions. The binding energy of the Dithianon–DNA complex is −7.59 kcal/mol. It suggests that Dithianon binds with maximum strength with DNA.

Binding sites of Dithianon–DNA.
The Docking Results of the Dithianon–DNA
Conclusions
The interaction between Dithianon and CT-DNA under physiological buffer conditions (pH 7.4) was investigated using various spectroscopic techniques. Based on the results obtained from UV and fluorescence spectroscopy, CD, and viscosity measurements, it was concluded that Dithianon binds to CT-DNA with high affinity through intercalation, potentially causing damage to CT-DNA. This conclusion is supported by several key findings:
(i) The absorption spectrum of Dithianon exhibited significant hypochromism as the concentration of DNA increased, indicating a strong stacking interaction between the aromatic chromophore of Dithianon and the DNA base pairs.
(ii) The decrease in emission intensity of Dithianon with increase in DNA concentration suggested an interaction between DNA and Dithianon. The observed intrinsic binding constant (Kb = 2.3× 10⁵ M−1) was comparable to that of other intercalators.
(iii) Competitive reaction experiments involving Neutral Red (NR) dye, DNA, and Dithianon showed displacement of intercalated NR from the DNA–NR system by Dithianon.
(iv) The positive slope in the Van’t Hoff plot indicated that the reaction between Dithianon and DNA was enthalpy-favored (ΔH = −220.069 kJ mol−1) and entropy-disfavored (ΔS = −635.21 J mol−1 K−1).
(v) The viscosity of the CT-DNA solution increased with the addition of increasing amounts of Dithianon.
(vi) An evident intensity increase was observed in the positive band of CT-DNA in the CD spectrum.
The insights gained from this study will aid in further understanding the potentially harmful mechanism of Dithianon binding to DNA and will be valuable for the design of new pesticides with lower toxicity.
Footnotes
Acknowledgment
The author gratefully acknowledges the financial support from the Islamic Azad University, Zanjan Branch.
Author Disclosure Statement
The author declares that there is no conflict of interest.
Funding Information
No external funding was received for this article.