
Abstract
As humanity becomes increasingly urbanized and disconnected from the nonhuman world, nature-based sonic environments are receiving increased attention from physicians and psychologists for their potential therapeutic attributes. Such benefits include helping to increase focus, speeding recovery from stress, and reducing healing time from trauma. Comparing, identifying, and understanding how and which sets of features from sonic environments hold therapeutic relevance however remains unclear. Mel (short for melody) frequency cepstral coefficients (MFCCs)—a popular digital signal processing (DSP) representation that engages auditory perception—may be helpful in addressing this need. In this article, we conduct a preliminary comparative analysis of four recorded natural environments by extracting perceptually salient sets of derivative feature signals from their audio tracks. These feature signals are widely used in the music and audio information retrieval community and move beyond the sonic dimensions illustrated in standard log-frequency spectrograms. We then apply principal component analysis to visually represent the relative importance of these feature sets in each environment's audio, demonstrating that perceptually linked MFCC features can play a significant role in signal-based discrimination between natural environments. To conclude, we discuss applications of DSP advances to research in acoustic ecology and nature-based sonic therapy and provide suggestions for future research that can inform short- and long-term interventions aimed at promoting psychological and physical healing.
Introduction
A rapidly expanding area of evidence-based research has empirically demonstrated that contact with multisensorial outdoor natural spaces (places with minimal human influence) has measurable positive effects on people's mental, physical, and emotional health (Bratman, Hamilton, & Daily, 2012; McMahan & Estes, 2015; reviewed in van den Bosh & Bird, 2018). This field of research has even greater relevance today, due to the steady rise in global urbanism (United Nations, 2018), and quarantines due to the COVID-19 pandemic. Both phenomena have required people to sequester indoors and/or self-isolate during outdoor activities (Wright, 2020).
For populations relegated to indoor activities (e.g., urban dwellers, incarcerated individuals, hospitalized patients, and assisted living populations), contact with the natural (nonhuman built) world is often only accessible through digitally delivered means. Although digitally delivered (technological) audio and visual nature experiences are not as multisensorial as outdoor experiences (Browning, Saeidi-Rizi, McAnirlin, Yoon, & Pei, 2020), they can offer broad exposure to diverse environments and measurable physical and psychological benefits (Kahn, 2011; Kahn, Severson, & Ruckert, 2009).
Nature based imagery and sonic environments span a broad diversity of habitats. Deciphering the specific content that may provide optimal therapeutic benefit is an area of active research. Most experimental studies have focused on visual imagery (Hägerhäll et al., 2018; Kahn, 2018; Ulrich, 1984; Ulrich, Lunden, & Eltinge, 1993; Velarde, Fry, & Tveit, 2007).
Nature-based sound therapies, however, are receiving growing attention from physicians and psychologists for their ability to reduce stress, increase well-being, restore attention, and reduce healing times and recovery from stressful events (reviewed in Erfanian, Mitchell, Kang, & Aletta, 2019; Supplementary Table S1).
Nature-based sounds are also considered culturally neutral with the capacity for broad appeal (Cullum, 1997). Audio inputs can more strongly influence environmental comfort levels than visual inputs (Preis, Kocinski, Hafke-Dys, & Wrzosek, 2015). An added value of digital nonvisual sonic therapies is the ability to spark the imagination in powerfully different and beneficial ways than purely visual stimuli (Bates, Hickman, Manchester, Prior, & Singer, 2020).
The concept of using nature-based sounds for therapeutic benefits has deep roots. In the 1860s, the German physician and physicist, Hermann von Helmholtz, wrote that sounds of the wind and sea could benefit human psychological health (Koenigsberger, 1906). Inspired by Helmholtz, American sound technician, Irving Teibel, and neuropsychologist Louis Gerstman created a set of albums titled Environments. Distributed by Atlantic Records, the Environments records featured soothing, ambient, engineered, and outdoor sound recordings that catalyzed interest in synthesized nature-based environmental recordings, New Age music, and ambient electronic music, a genre that eventually grew into a multimillion-dollar industry (How Nature Sounds Became A Multi-Million Dollar Industry, 2018).
The Canadian composer, Shafer (1977), wrote The Tuning of the World that popularized the term soundscape and described the power of environmental sound to impact well-being. Today, a multitude of nature-based sound-generating machines are marketed to the public as sleep and calming devices and are popular in online marketplaces. However, nature-based sonic therapy interventions are still relatively uncommon compared with nature-based visual interventions (Kang and Schulte-Fortkamp, 2016).
Rigorous comparisons between the therapeutic value of different nature-based sound stimuli remain challenging because of the wide variety of stimuli, stressors, and proxies used to gauge physiological and cognitive effects (Supplementary Table S1). The number and diversity of natural sound environments that have been used for potential therapeutic benefits are limited. Expanding the quantitative measures that can facilitate efficient and machine-readable feature comparisons between stimuli in psychologically and perceptually meaningful ways is central to advancing research and understanding of nature-based sonic therapies.
Recently, the desire for automated speech, speech recognition, voice-to-text translations, and music information retrieval (MIR) tasks (Müller, 2007) has led to the creation of increasingly sophisticated digital signal processing (DSP) representations including the Mel (short for melody) scale and Mel frequency cepstral coefficients (MFCCs). This widely used DSP representation, however, remains underutilized by acoustic ecologists and sonic therapists. In this article, we suggest that MFCCs can provide two benefits: (1) a bridge between physical and perceptual sound measurements and (2) a machine-friendly method to extract sets of features from natural sonic environments.
These extracted feature sets may not be easily detected by spectrograms but could hold therapeutic and ecological relevance. When analyzed across a large number of recordings of a particular environment, MFCCs could afford quantitative, reproducible and comparable abstractions of a natural environment's sonic signature, expressed as a collection of perceptually salient time-varying signals.
Bridging physical, physiological, and perceptual measurements
Hearing is a physiological and physical experience with the body registering sound waves as they hit the eardrum (Javel and Mott, 1988). Natural sonic environments present a complex mixture of biophony (sounds from nonhuman organisms, e.g., birds and insects), geophony (geophysical sounds, e.g., wind and waves), and anthrophony (human-generated sounds, e.g., traffic, voices, and sirens) (Krause, 1987). Environmental sounds also vary according to external conditions, for example, temperature, humidity, and light levels. Commonly measured physical metrics include pressure level (amplitude), spectrum, and rhythm.
Hearing is also a perceptual experience requiring both semantic and physical understanding. Van Hedger et al. (2019) report that listeners' aesthetic responses to nature sounds do not depend solely on the acoustic properties of the sound but also on the context in which the sounds are framed. They report that nature sounds are aesthetically preferred over urban sounds only when they can be recognized and associated within the framework of nature. On a physical level, our skull, ears, and evolutionary history introduce nonlinearities and distortions into the physical acoustic signals we receive, perceive, and process. Because we do not perceive frequencies on a linear scale, a sound's measured amplitude may differ considerably from the loudness we perceive.
The range of human hearing lies between 20 Hz and 20 kHz, but for evolutionary reasons, we perceive equal amplitudes more loudly in a band of frequencies centered around our speech (85–255 Hz). As frequency increases above the level of human speech, for example, >400 Hz, sounds of equal physical amplitude are perceived as less loud. Likewise, the human ear perceives a doubling of frequency as a lower and higher pitch of the same pitch class (“the same note”), a relationship known as an octave, without comparable sensitivity to change in linear hertz.
For example, although frequency differences from 500 to 1000 Hz and from 8000 to 8500 Hz both span 500 linear hertz, the ear hears 500 and 1000 Hz as equivalent in pitch class, because of the doubling in frequency, whereas 8000 and 8500 Hz would not be perceived as equivalent in pitch class (although 8000 and 16,000 Hz would).
Octave doublings span more and more linear hertz as they ascend the range of audible frequencies, and a given fixed change in linear hertz becomes a smaller and smaller change in perceived pitch as it ascends the audible range of frequencies (Monson, Hunter, Lotto, & Story, 2014). Despite these inherent processing limitations, high frequencies contain important information for deciphering sound qualities such as naturalness and overall intelligibility (see table 2 in Monson et al., 2014).
A well-established tool for quantifying physical aspects of natural sonic environments is the spectrogram, which shows a continuum of active frequencies changing in amplitude on a linear scale (Pijanowski, Farina, Gage, Dumyahn, & Krause, 2011a; Pijanowski et al., 2011b). A log-frequency spectrogram illustrates the short-time Fourier transform (STFT) representation of an audio signal and describes the spectrum of an audio window as a set of linearly spaced nonoverlapping frequency bins' power magnitudes. Additional spectral features from the STFT data, such as spectral centroid and spectral roll-off, divide the continuum of audible frequencies into equally spaced bandwidths along a linear scale, which can then be compared across environments.
Log-frequency spectrograms versus Mel spectrograms
The Mel [Stevens, Volkmann, and Newman (1937)] frequency scale can more accurately represent the way humans perceive higher frequencies and approximate more closely the ear's frequency and loudness perception. Mel scales (Stevens et al., 1937) do this by acknowledging the nonlinear perceptual aspect of human hearing. They create a pitch unit wherein quantitatively equal distances in pitch sound equally distant to the listener.
When compared with the spectrogram, the Mel spectrogram's y-axis displays the power magnitudes of widening and overlapping filters, with center frequencies that are increasingly spaced in linear hertz (Suzuki & Takeshima, 2004). The y-axis of a log-frequency spectrogram on the other hand displays the power magnitudes for equally spaced and sized frequency bins along a linear hertz scale. Adjacent Mel filters average together distinct overlapping sets of linearly spaced frequency bins, much like the ear's spectrum analyzer perceives frequency through 24 overlapping filter regions along the basilar membrane (Long, 2014). Depending on the normalization technique employed, increasingly high Mel filters may also decrease in relative amplitude, roughly approximating the frequency-dependent loudness perception of humans (McFee et al., 2015).
MFCCs: a machine friendly feature extraction methodology
Although Mel spectrograms better align with human perception than log-frequency spectrograms, the highly correlated overlapping nature of the Mel filters introduces a problem for machine learning. Many learning algorithms perform best with less dependent and fewer overlapping features. To alleviate this issue, the Mel filter magnitudes' logs can be analyzed as a sum of cosine waves known as MFCCs. In other words, MFCCs correspond to the discrete cosine transform of a Mel frequency spectrogram and provide an alternative representation. They can be placed into principal component analyses (PCAs) from which feature contribution heatmaps can be generated and compared.
MFCCs are widely used as signal features in automatic speech, speaker recognition, and MIR (Davis and Mermelstein, 1980). However, they have rarely been used in the field of acoustic ecology. A handful of studies have reported on their utility, for example, identification of a variety of animal calls from different species of singing insects including crickets and katydids to frog calls and birdsongs (Lee, Chou, Han, & Huang, 2006; Le-Qing and Zhen, 2012; Noda, Travieso-González, Sánchez-Rodríguez, & Alonso-Hernández, 2019; Ramirez, Ramirez, de la Rosa Vargas, Valdez, & Becerra, 2018). This article offers a valuable case study of four different natural environments (forest with birdsong, rippling stream, mountain winds, and ocean waves) analyzed with Mel scale and MFCCs to reveal quantitative and perceptually meaningful differences. Using these sound parameterizations, feature extraction analyses can augment our current analytic toolkits and help identify sets of features that can be tested for their potential sonic therapeutic effects.
Methods
Stimuli
Recordings were selected from the National Geographic Society archives representing four natural sonic environments (forests with birdsong, rippling streams, mountain winds, and ocean shorelines). The qualitative content selections were based on past research of therapeutic potential (Supplementary Table S1). Three representative samples from each environment were chosen based on their sonic stasis, the absence of sudden disruptive sounds, and minimum duration of ∼1 min. Each audio sequence was encoded with Advanced Audio Coding compression (ISO/IEC, 2001) and is available at the Center for Open Science (https://osf.io/vhaxf/files/). All data and analysis code can be found on GitHub at (https://github.com/jefftrevino/nature-nurtures).
Analysis
All audio analyses were undertaken with the libROSA Python package for music and audio analysis (McFee et al., 2015). Each audio track included three discrete 1 min samples of each specific environment, separated by ∼1 s of silence, and ∼1 s fades at the endings and entrances. For each of the four environments, the stereo audio files were mixed down to monaural audio and downsampled to 22,050 samples per second.
The monaural file was then analyzed as time series data (as a digital representation of a time-varying electrical signal) to extract feature data from the audio of the entire environment's three-segment file. The applied Fourier analysis algorithm treated the audio signal as a sequence of overlapping frames, and derived values for equally spaced frequency bins for each frame. All features other than MFCCs were extracted with a hop length of 512 samples and a frame length of 2048 samples, or about a 10th of a second.
Feature description and extraction
Audio selections were analyzed as a time-varying electrical signal to derive 25 new audio signal features* including 20 MFCCs and 5 physical spectral features: root mean square, spectral centroid, spectral bandwidth, spectral roll off, and spectral novelty (Table 1). Spectral features describe how the sound's energy is distributed and concentrated among the various audible frequencies in each analysis window. These features are relative magnitudes and, after extraction, were normalized to zero mean and unit variance.
Spectral Audio Feature Definitions
Creation of log-frequency and Mel spectrograms
After the spectral features were extracted from the signals, log-frequency spectrograms were made by applying STFTs to each environment's audio. Each analysis window contains magnitude data for 1025 equally sized frequency bins, which are linearly spaced in the frequency domain. The Fourier data were then translated into Mel spectrogram data—representing the Fourier data as power magnitudes of a bank of 128 overlapping Mel-scaled filters by averaging overlapping sets of Fourier frequency bin magnitudes per filter. From an audio classification perspective, this also decouples the data representation from particular frequencies, which increases the chance of matching similar sounds with their different particular frequencies.
MFCC diagrams, PCA, and heatmaps
From the Mel spectrogram, MFCC features were extracted to make MFCC diagrams (Figs. 1A–D). In contrast to the hertz displayed on the y-axis at the top figure, the Mel spectrograms show the activation of frequency bins spaced according to the perceptually correlated logarithmic Mel-frequency scale. Below the Mel spectrogram, the MFCC plots, which are not human legible in the same way as spectrograms, represent the Mel spectrogram as a set of harmonically related cosine waves that independently vary their amplitudes from moment to moment.
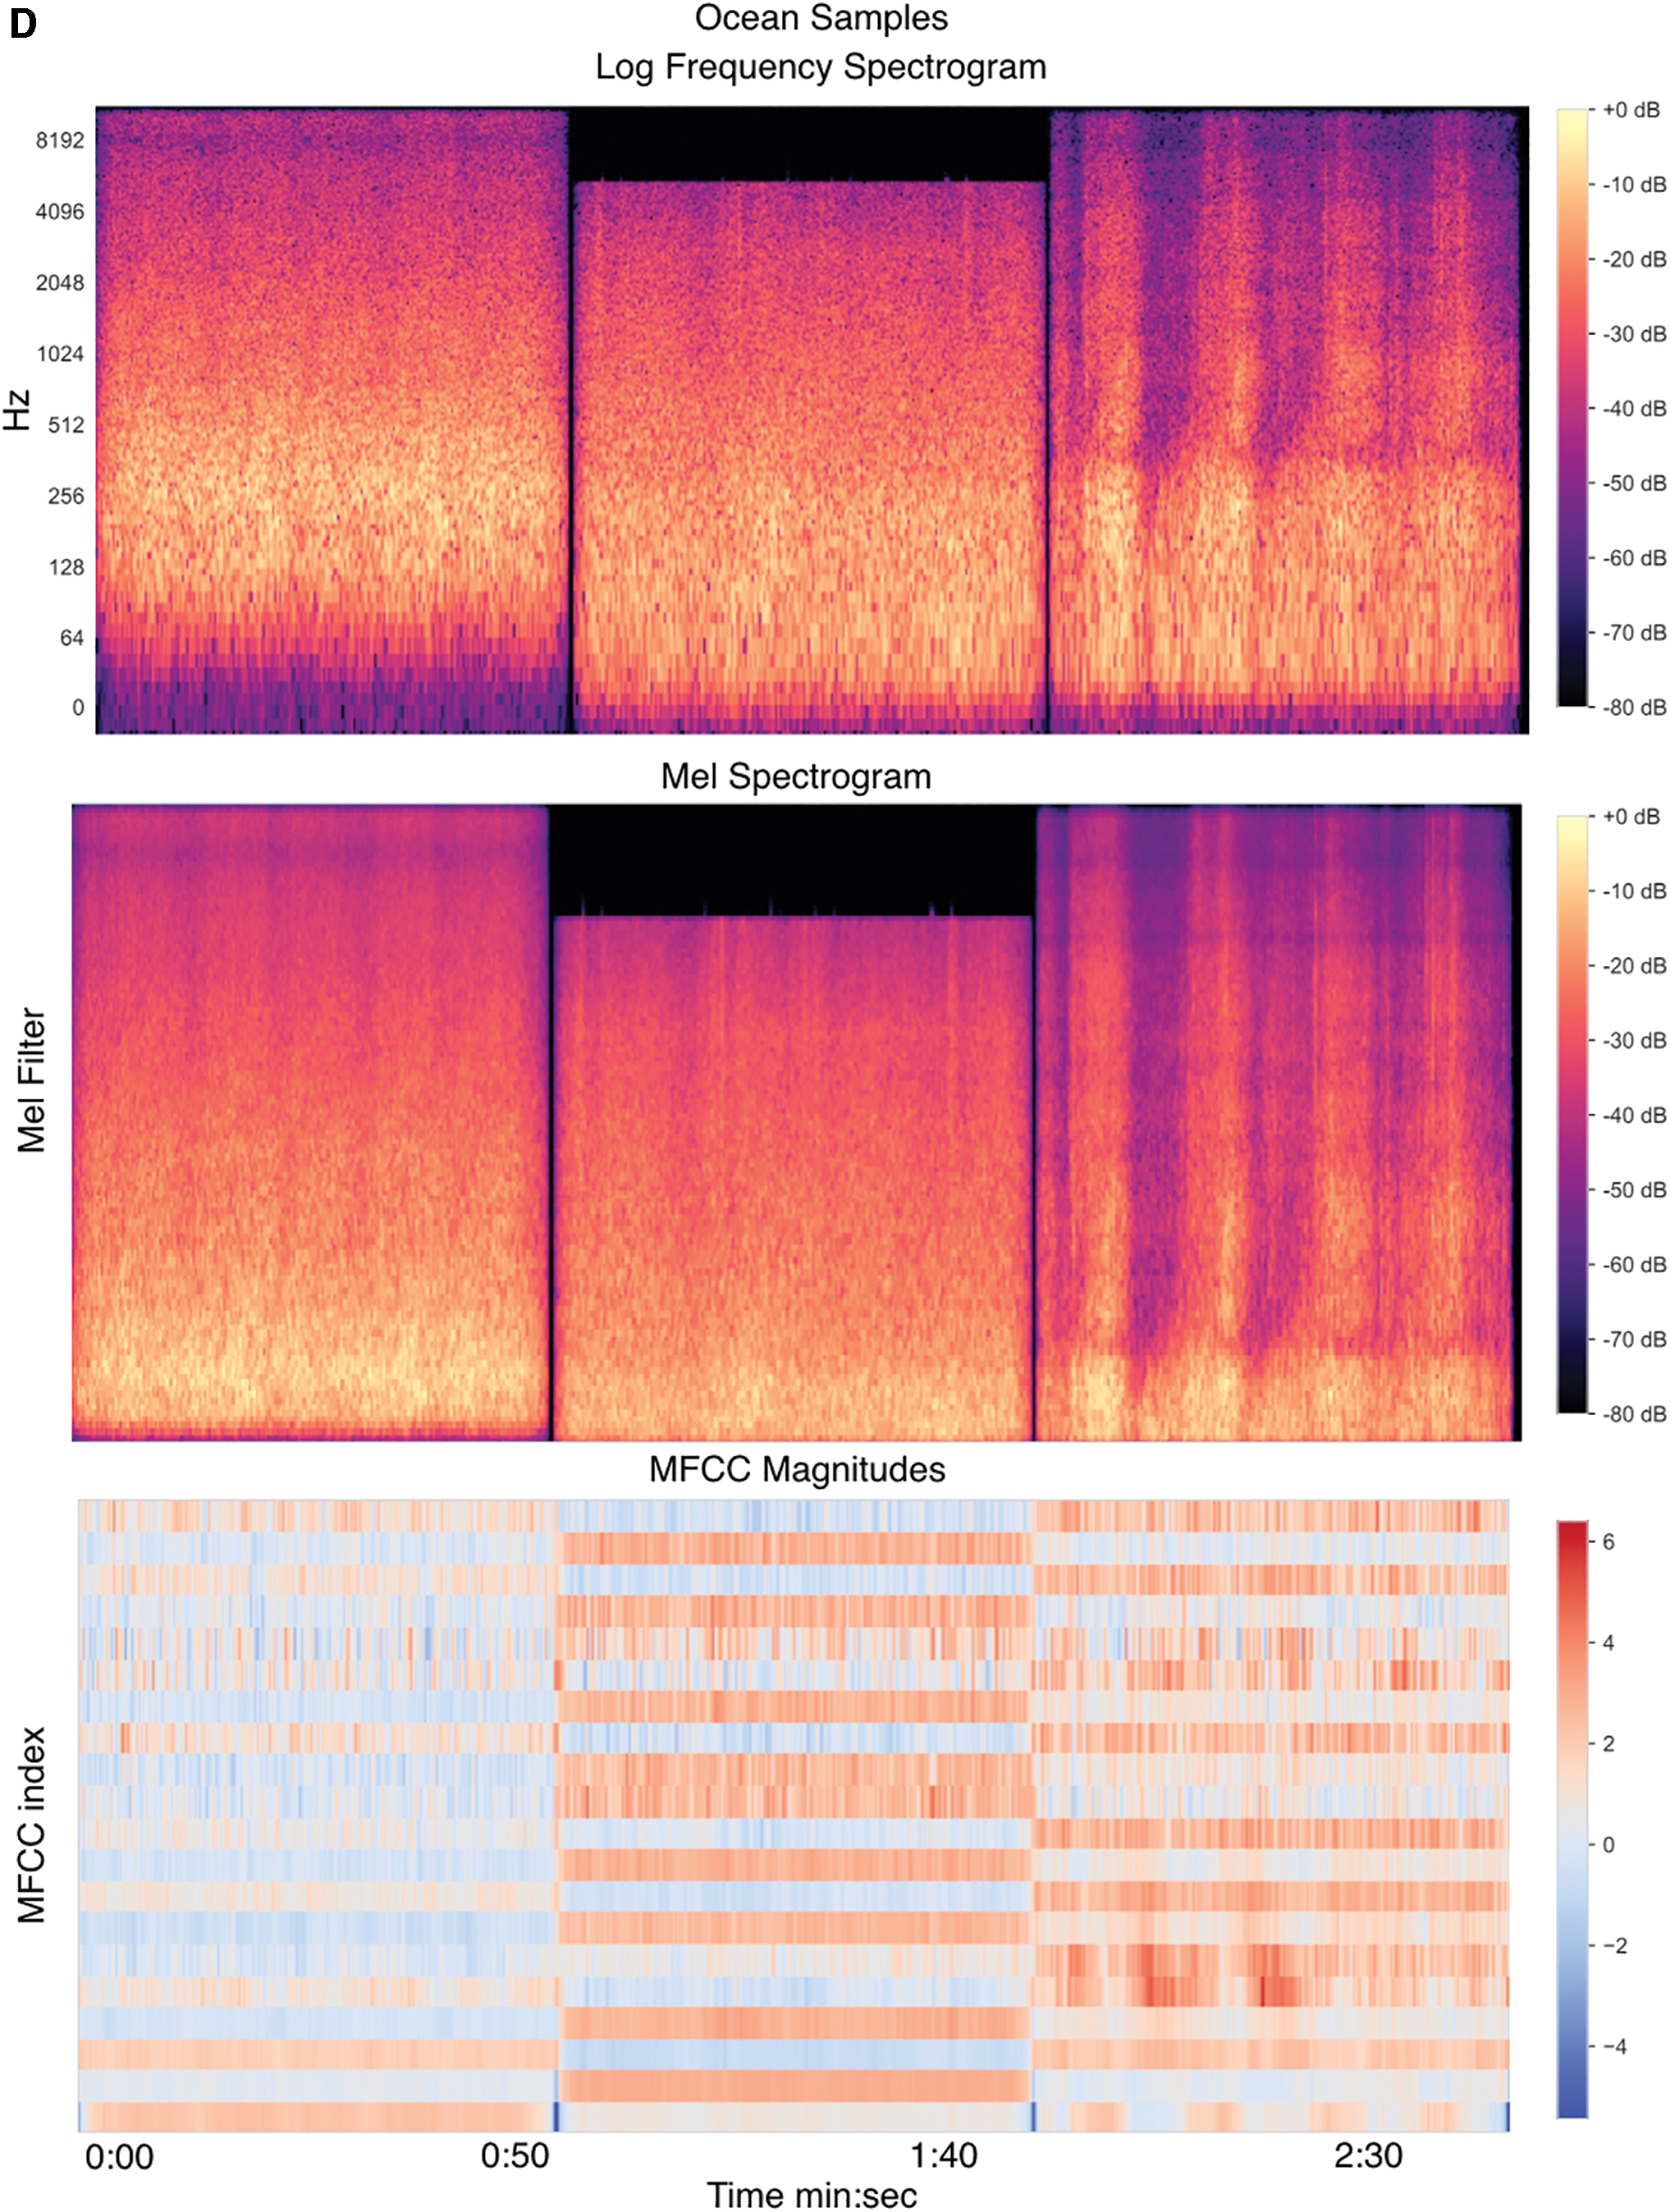
Log frequency spectrograms, Mel spectrograms and MFCC magnitudes of four natural environments.
We combined spectral features with MFCC features into a feature vector and input those values into a two-component PCA. † PCA (Pearson, 1901) is a dimensionality-reduction method that transforms data sets with a large number of variables into a smaller variable while retaining most of the information found in the larger set. It creates new uncorrelated variables that can successively maximize variance (Jolliffe and Cadima, 2016).
From the PCA, we generated feature significance heatmaps that facilitated comparisons of relative feature significance across the 25 features extracted from each recording. The PCA also reduced each audio frame's 25 features to two components. We generated scree plots to help visualize data dimensionality by illustrating each principal components' cumulative variance. For each environment, the first two components explained a total of between approximately one-third and three-fourths of the environment data's total variance (Fig. 2).

Scree plots of explained variance for additional analysis components.
Results
The variety of spectral characteristics shown in Figure 1 indicates that different soundscapes offer measurably different sonic components. Darker colors (blues vs. reds in the case of MFCCs) indicate lower magnitude values. Values in the red/pink range are closest to noise, that is, the equal presence of all frequencies. MFCC feature magnitudes, however, are not easily human legible and represent a Mel spectrogram as a summation of cosine wave magnitudes.
PCA reveals the relative importance of 25 features between the forest, mountain, stream, and ocean environments (Fig. 3). For PCA1, all four environments can be characterized by changes in spectral bandwidth and roll-off, less so for centroid and not by novelty. The additional MFCC features give each environment a distinct feature significance fingerprint. For the forest environment (Fig. 3A), MFCCs 3, 8, and 10 help distinguish it from the other environments. The stream environment (Fig. 3B) is characterized by MFCCs 3, 5, 10, and 12, the mountain environment (Fig. 3C) mainly by lower MFCCs (3–5, 7, and 9), whereas the ocean environment (Fig. 3D) is distinguished by low and high MFCCs (1–3, 8, 10, 11, 13, 16, and 18). PCA2 explains much less of the variance (Fig. 2).
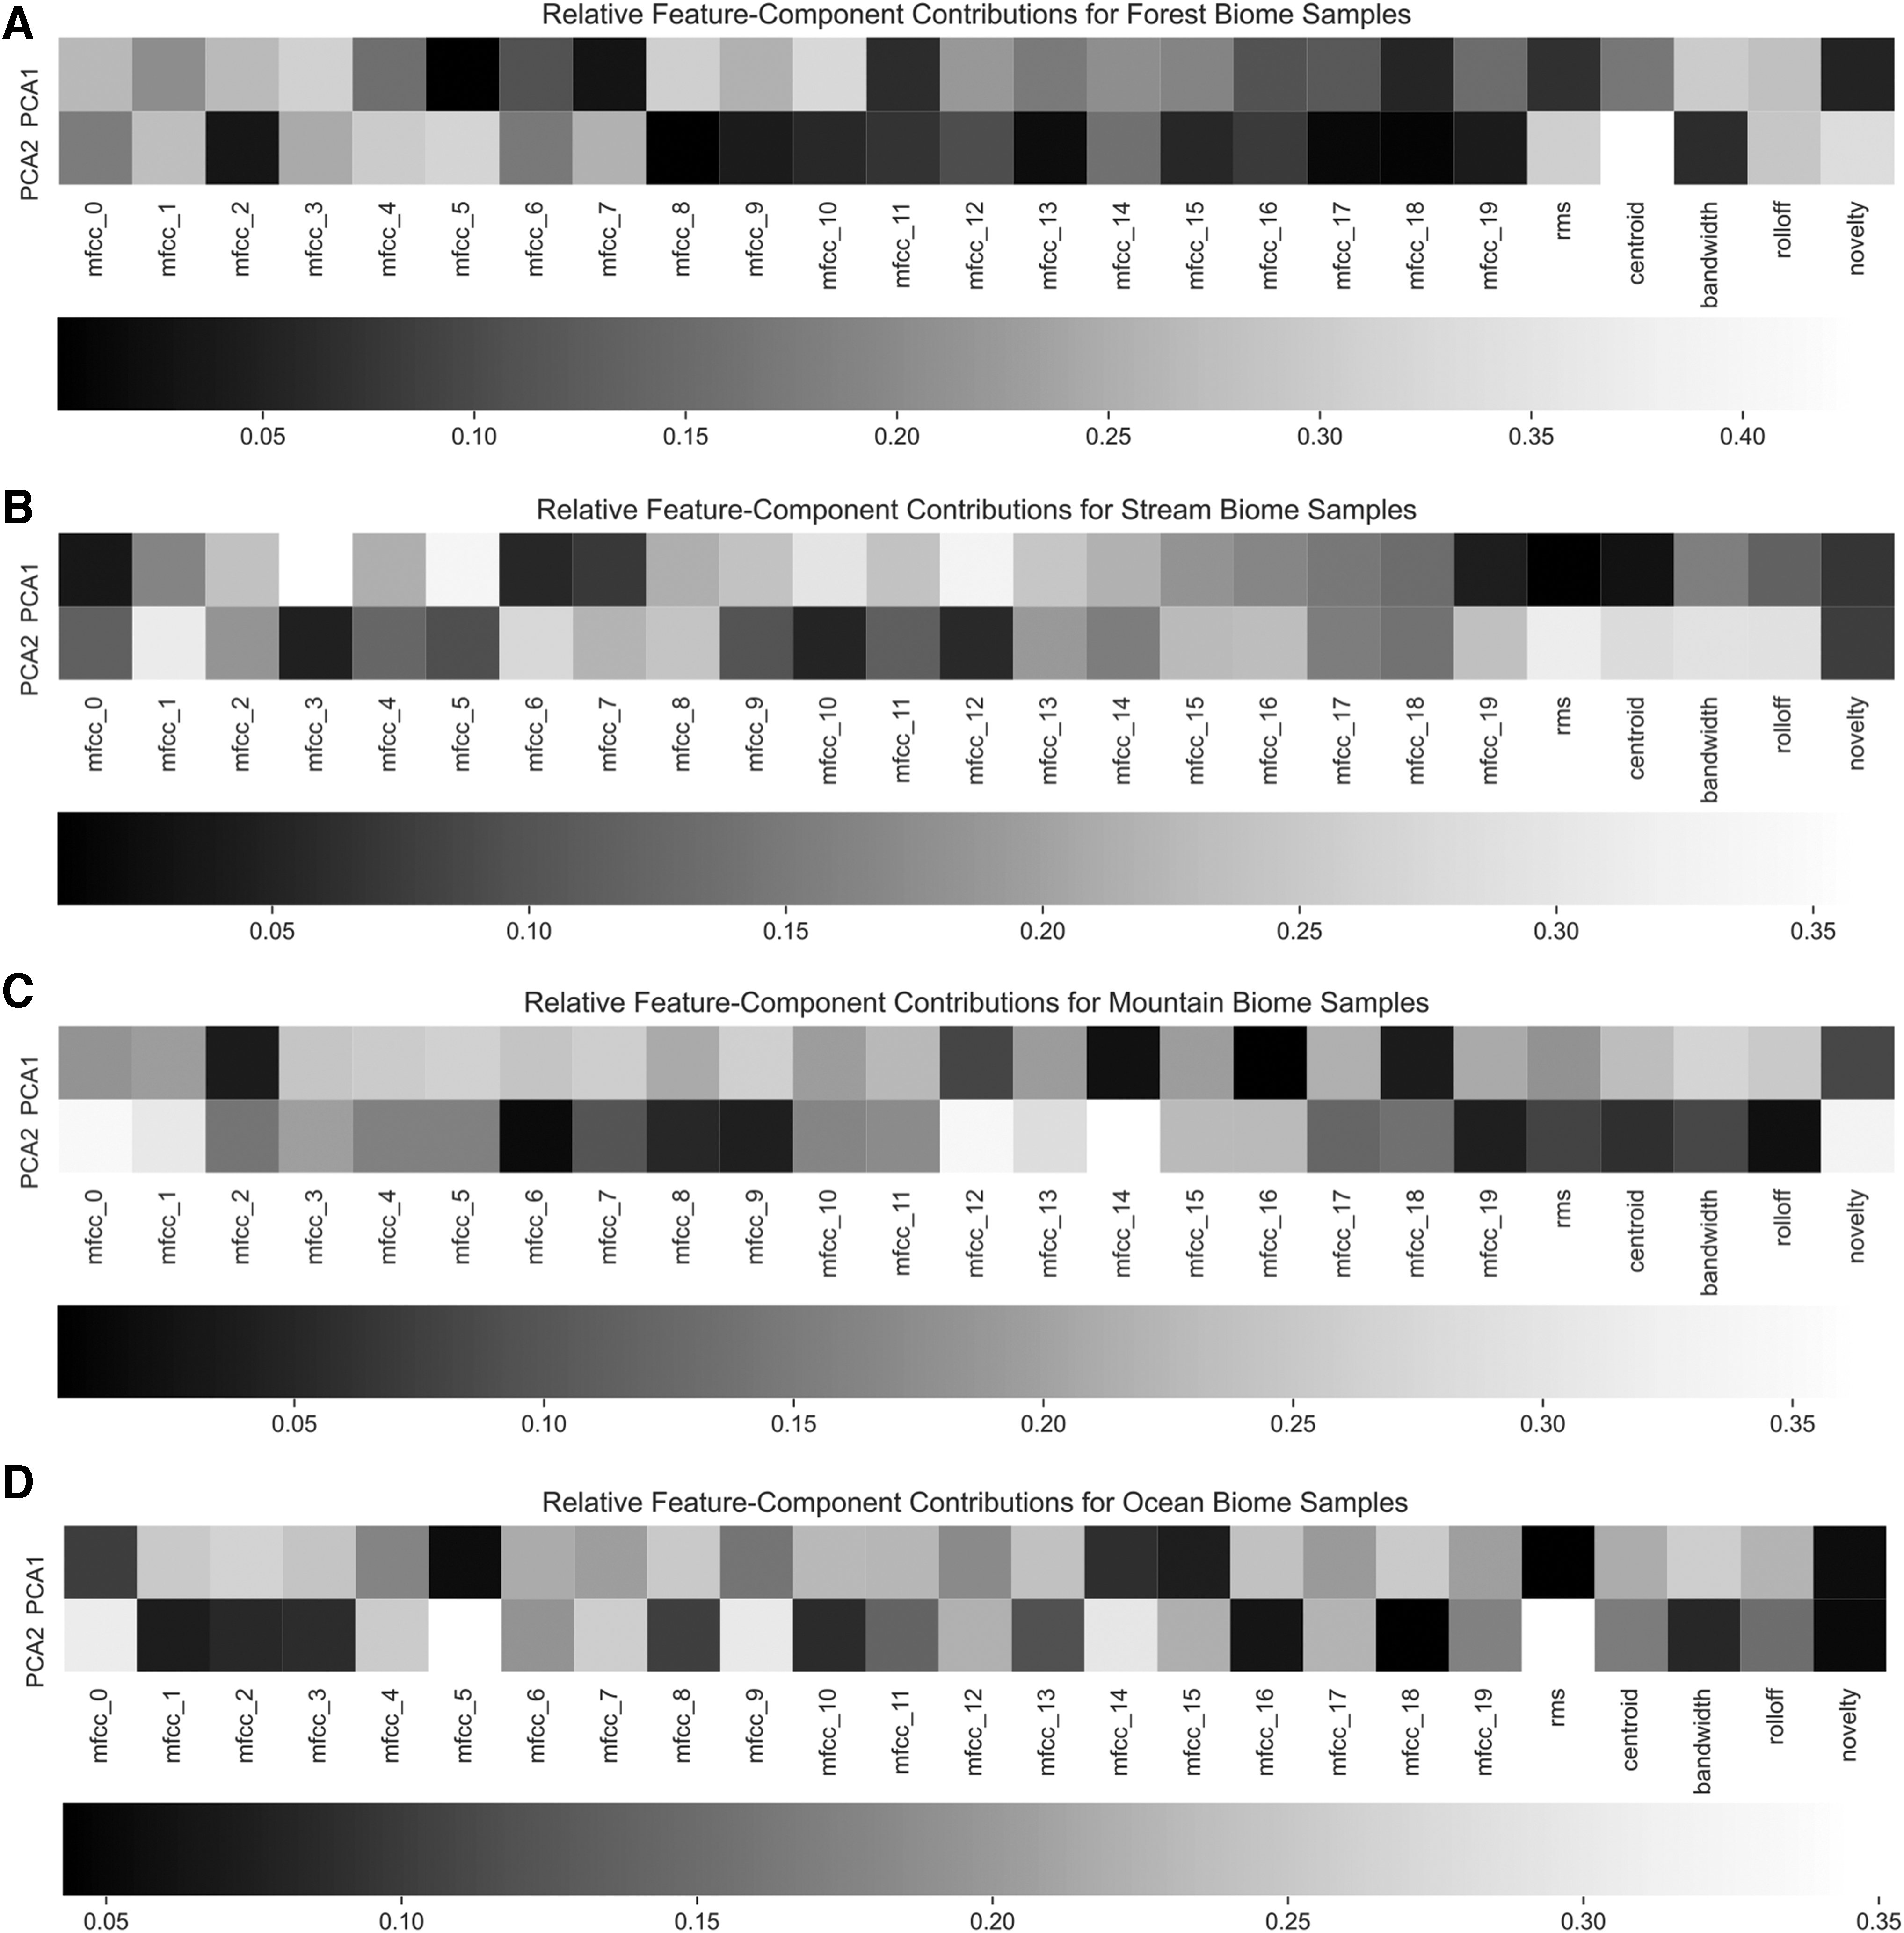
Two-component principal component analysis. Feature contribution heatmaps.
Discussion
The audio features analyzed in this study reveal new commonalities and differences across natural sonic environments. These may have been possible to hear, but would have gone unnoticed if only traditional spectrogram methodology were used. For example, both the stream and ocean environments were characterized by prominent contributions from band-constrained unpitched noise, in the low- and mid-high frequency registers. For the ocean, the root mean square energy varied significantly. This feature explains much less variance for the ocean, however, than for other environments, because the total amplitude change in time was much closer to noise for ocean than it was for other environments. Fourier analysis represents noisy signals poorly, because noise is defined as the equal presence of all frequencies, and Fourier analysis represents signals as a sum of single-frequency sinusoidal functions. Despite this limitation, spectral features that average frequency energy can be helpful in characterizing noisy signals. For example, spectral centroid should strongly characterize signals that behave like various colored noises, that is, white, brown, and pink noise.
Our findings complement those of Van Hedger et al. (2019) who found that the conceptual identification of a sound as natural or urban fundamentally alters the way in which listeners use acoustic cues to arrive at their aesthetic judgment. Their findings reveal a consistently large preference for identified nature sounds with a mean aesthetic rating ranking over 3 SD higher than the mean aesthetic rating for urban sounds and support long held beliefs that human affiliation with, and affection for, natural environments is innate and part of our evolutionary history (Wilson, 1984). Similarly our study explores multiple acoustic features (spectral centroid, spectral roll-off, spectral bandwidth, root mean square, and novelty; see Table 1) and also offers a means of exploring many more additional features in the form of MFCCs, thus allowing for a deeper analysis of differences and similarities within natural sound that may be of therapeutic relevance.
Although humans have become increasingly urban and physically removed from the natural (nonhuman built) world, we simultaneously have greater access to the widest array of digitally delivered nature sights and sounds in history. Libraries of natural sonic environment recordings, such as the Center for Global Soundscapes Project, are expanding with a steady stream of new recordings from community scientist-driven apps such as Record the Earth. Adding DSP representations, such as Mel scales and MFCCs that bridge perceptual, physiological, and physical aspects of hearing, can help pinpoint meaningful differences and similarities between these myriad natural sound environments. With this knowledge, we can better discover and compare feature sets that may correlate with beneficial physiological and cognitive effects and work toward creating more inclusive and effective nature-based sound therapies.
Limitations and future directions
The aim of this preliminary study was to illustrate the utility of this multidisciplinary analytic approach and provide a procedural outline to help focus the search for therapeutic audio from natural environments. It is limited in having only three recordings from the four selected environments. To make accurate diagnostic recommendations, many more recordings from each environment are needed. Additional recordings could also allow for the calculations of bootstrap confidence intervals for the loadings to demonstrate which features are most significant. For example, researchers could conduct random samplings of 10,000 n-second long chunks of audio, identify feature significances for each chunk, and then construct confidence intervals, or legible Bayesian credibility intervals, to illustrate whether a particular feature explained a chunk's variance more or less across the many samples of a selected sonic environment. A meta-heatmap of feature significance intervals could then be created to showcase the higher per-chunk significances.
Further research avenues could include a greater diversity of natural environments and sounds, and clip lengths as well as additional analyses. Emerging experimental DSP techniques such as inverse MFCCs and matching pursuit algorithms supplement MFCC features and have been reported to yield higher machine recognition accuracy for environmental sounds (Chu et al., 2009; Ramirez et al., 2018). Other similarity metrics and applied statistics could also be undertaken such as canonical correlation analysis (CCA)—a multivariate constrained ordination technique (McGarigal, Cushman, & Stafford, 2000). Using CCA, the 25 extracted auditory features would function as independent variables, whereas the four sonic environments would be dependent variables.
The cross-pollination of DSP with investigation into nature-based sonic therapeutics and acoustic ecology can offer numerous benefits. It can strengthen existing quantitative methods for comparing diverse natural environments (Paine, 2017) and make data sets more machine readable, facilitating investigations of correlated beneficial responses. Such methods can also be applied to improving measurements and tracking myriad human-driven sonic alterations to our natural (Pijanowski, 2016) and urban environments (Southworth, 1969).
As the percentage of humanity living in urban environments rises, our detrimental impacts to the rich and diverse sounds of our natural environments also continue to escalate. The body of experimental evidence supporting the ability of nature sounds to beneficially influence our endocrine and autonomous nervous systems grows (Thoma, Mewes, Nater, 2018, & Ratclliffe, 2021; Supplementary Table S1), however, we are still in the early stages of deciphering how and which sonic elements are most deeply involved in these complex processes. It is hoped that the machine-friendly methods such as those detailed in this study will help to streamline comparisons of diverse natural environments and ideally inform broader implementation measures.
The widespread potential for applying such benefits is encouraging and exciting, from health care to in-home design and urban planning. Examples include reducing anxiety intraoperatively as seen in Arai et al. (2008), speeding recovery from stressful events (Annerstedt et al., 2013), creating restorative environments to offset and reduce impacts of mechanical and human-created sounds created during COVID quarantines and social distancing (Dzhambov et al., 2021), and promoting feelings of well-being and serenity for harried travelers, for example, playing natural sounds (including those from the Aurora Borealis) through 27 loudspeakers at the Helsinki-Vantaa Airport in concert with nature imagery projected onto a 4K wraparound screen (Campos, 2020). One can only hope that the speed at which we can analyze, identify, and hone the implementation of natural sonic environments for therapeutic purposes can outpace the rate at which we are degrading these valuable sonic assets.
Footnotes
Acknowledgments
Author Disclosure Statement
No competing financial interests exist.
Funding Information
Funding was provided by a grant from the National Geographic Society (HJ-101R-17) and an anonymous donor.
References
Supplementary Material
Please find the following supplemental material available below.
For Open Access articles published under a Creative Commons License, all supplemental material carries the same license as the article it is associated with.
For non-Open Access articles published, all supplemental material carries a non-exclusive license, and permission requests for re-use of supplemental material or any part of supplemental material shall be sent directly to the copyright owner as specified in the copyright notice associated with the article.