
Abstract
The COVID-19 pandemic has led to the introduction of a series of recommendations to safeguard public health that must be applied in public spaces. This research analyzes the effects that these recommendations have had on levels of stress experienced by the population when out in public spaces. It starts from measurements of Heart Rate Variation that were carried out on the same individuals both before and during the COVID-19 pandemic. The results obtained point, in most cases, to an increase in the level of stress suffered, particularly in contexts in which there is an important presence of population or where people have not followed health care recommendations.
Introduction
The COVID-19 crisis has implied important changes in the behavior of the majority of the population. These have been particularly evident with regard to activity in public spaces, associated with the obligation to wear a mask, maintain social distance, queue outside shops, and increase measures to ensure public hygiene. These are changes that can also affect the way in which people perceive public space (Valentine, 1989; Xu, 2018).
This research examines how these changes can influence the level of stress that people feel in public spaces. It, therefore, forms part of a line of research that seeks to characterize emotions in public spaces. Such research is based on how citizens perceive their physical and social environment (Kim & Fesenmaier, 2015).
The objective of this study was to compare the levels of stress experienced in public spaces both before and after the application of measures to combat COVID-19. To do this, we used physiological measurements and spatiotemporal data obtained in public spaces. More specifically, we analyzed Heart Rate Variation (HRV) to identify changes in the emotional state of our subjects.
The results obtained point to significant differences in levels of stress experienced in public spaces within the same city before and after the application of measures to combat COVID-19. Our objective was to analyze the extent to which such measures could be relevant for anticipating social, urban planning, and health care problems related to human welfare.
Methods
This study was carried out in the city of Lleida (population 139,000 in 2019). A group of students independently followed a route through the historic center of the city (Fig. 1). They made their first walks in November 2019, before there were any restrictions related to COVID-19. Their second walks took place in November 2020, when several measures to combat COVID-19 were in force, including the obligation to wear a mask and limitations on the number of people in shops. The participants followed all the public health recommendations in force at the time of our study.
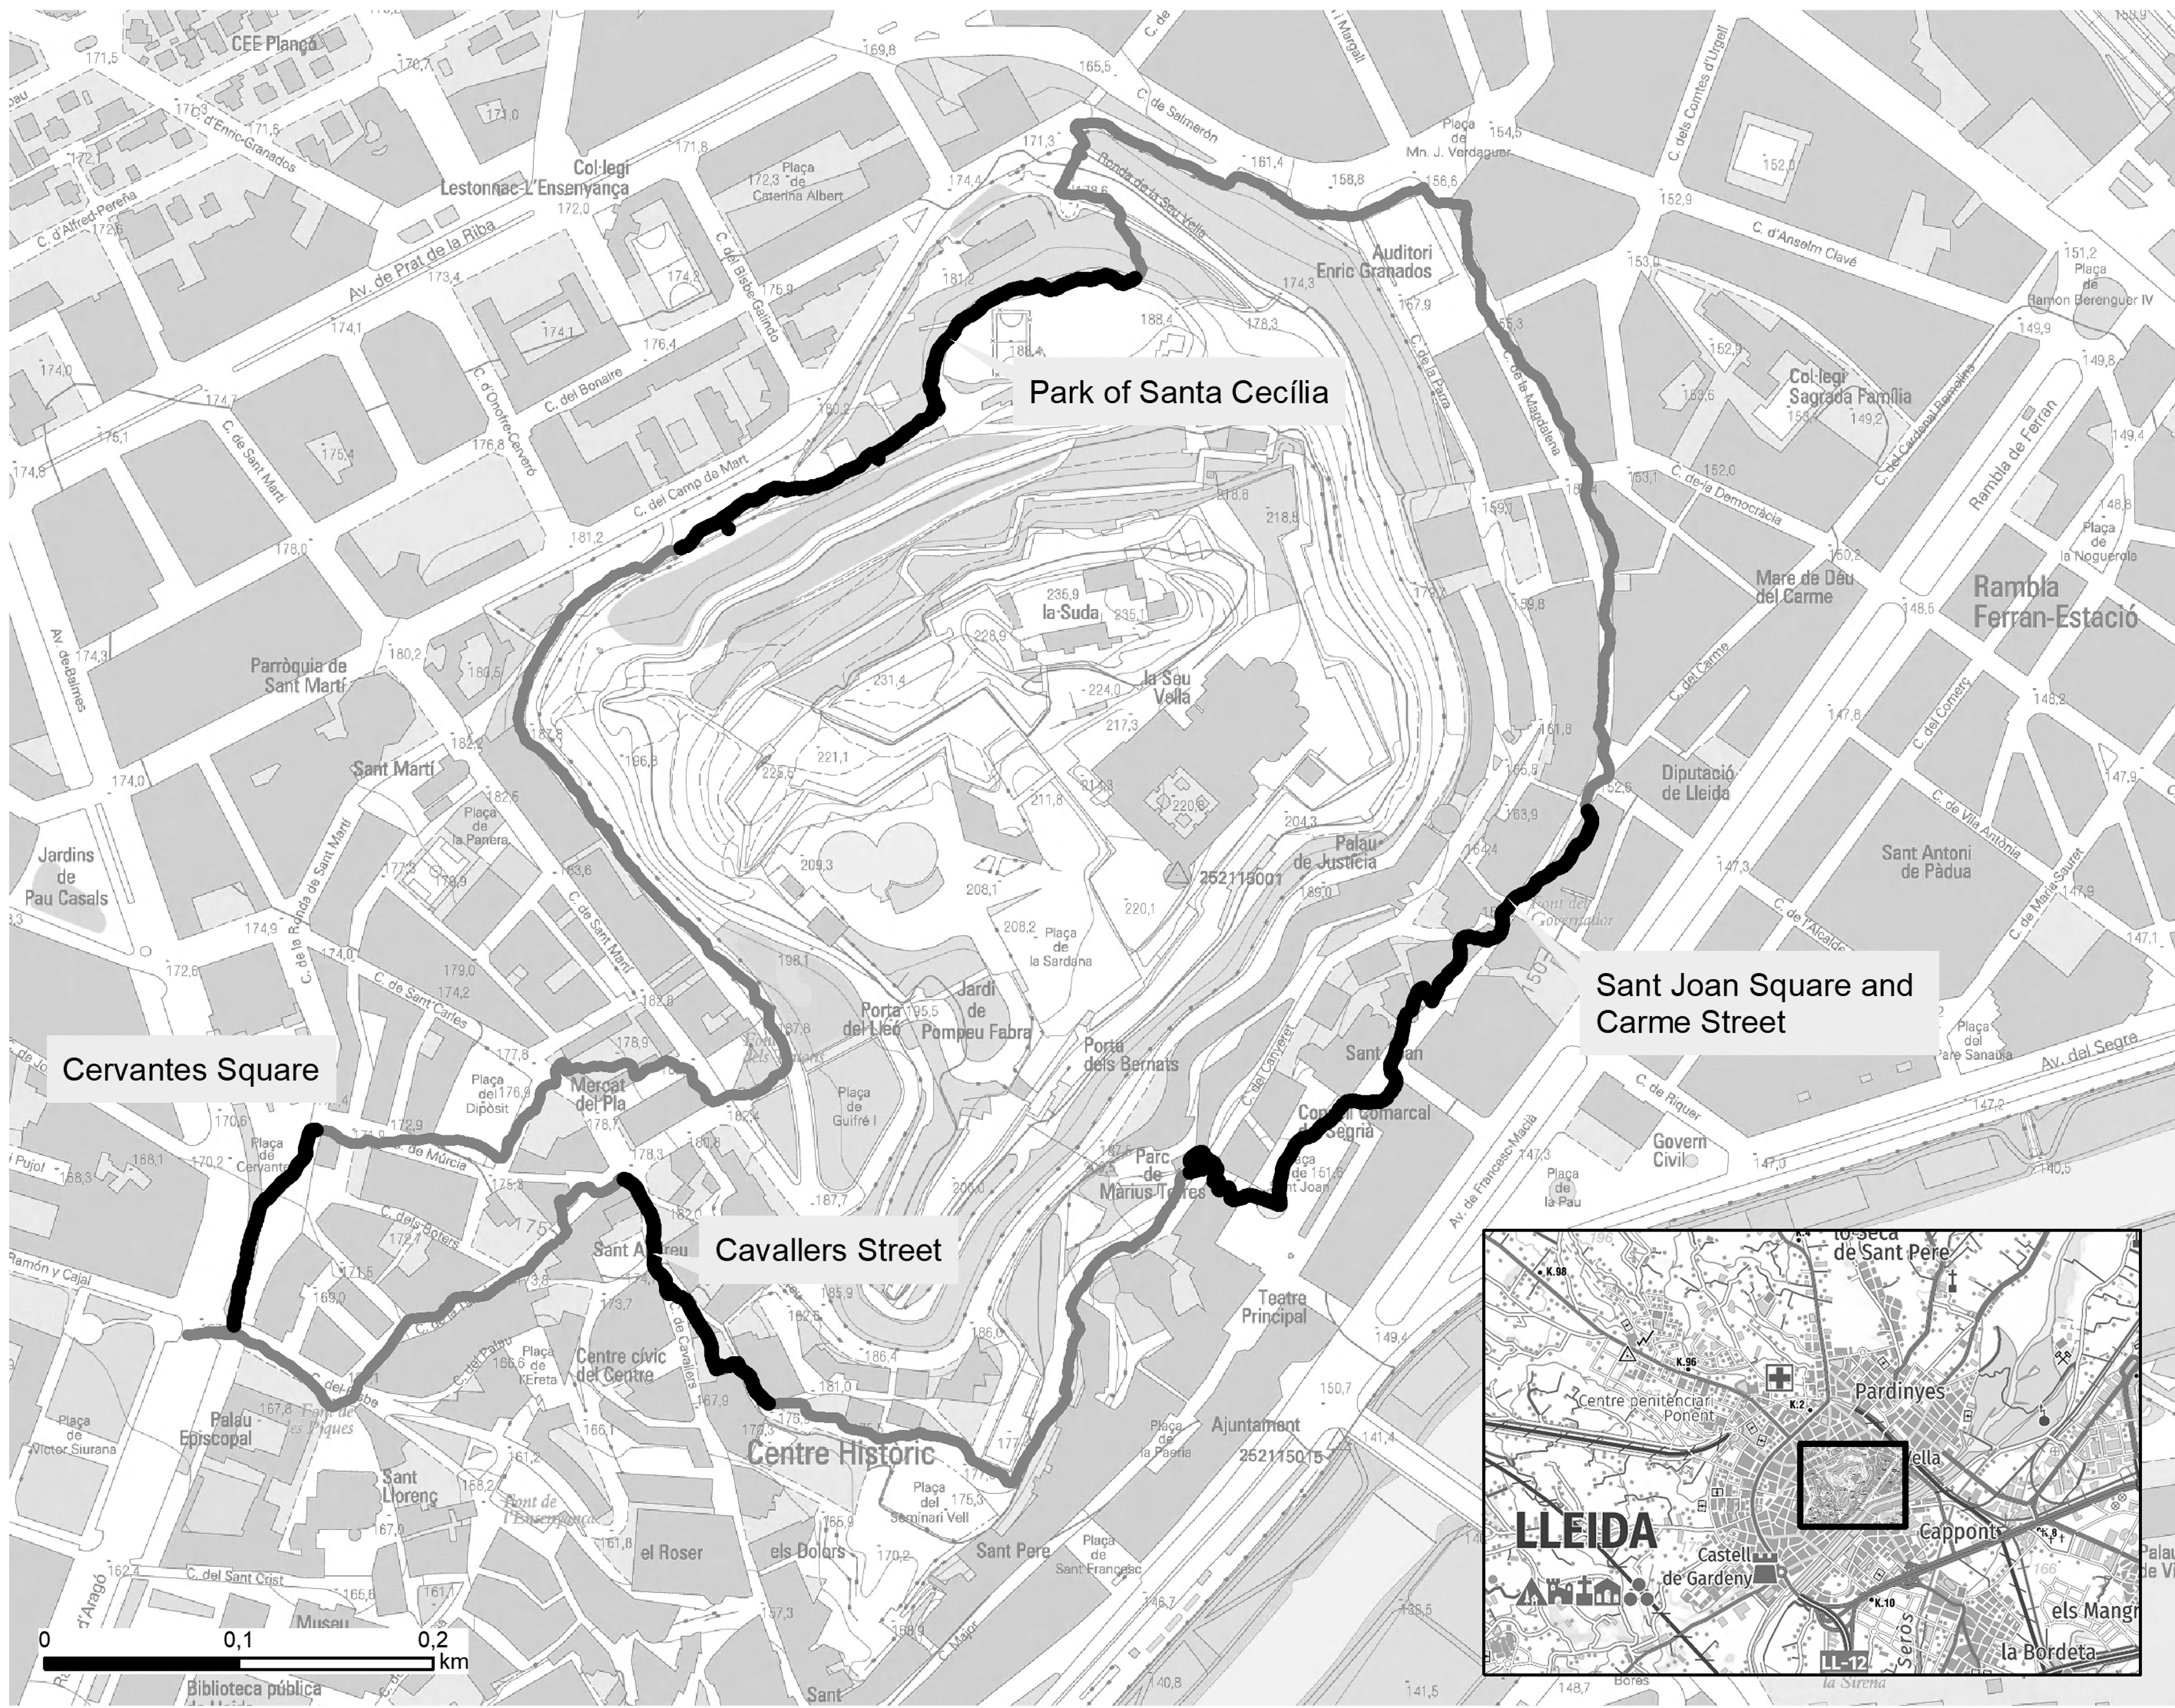
The route through the historic center of Lleida, which was followed by the volunteers. Cartographic basis: Institut Cartogràfic i Geològic de Catalunya (www.icgc.cat).
In November 2019, there were no special public health measures in force in Lleida. A year later, the city was undergoing a period of rapid growth in the number of registered COVID-19 cases. In fact, on November 1, 2020, the risk of contagion was extremely high: 640, the Rt was 0.97 and the percentage of positive PCR tests for antigens was 12.26 (Generalitat de Catalunya, 2021). As a result of these data, certain control measures were reimposed, such as the closure of some types of premises, a return to distance learning at universities, and a reduction in the number of people allowed in certain premises. Finally, it is necessary to underline the fact that, at the time, the vaccination process had not yet started and, as a result, neither the participants, nor other citizens, were vaccinated.
The routes and the times of day of the two walks were the same in each case. Both the route of 2019 and that of 2020 were followed during the week, and they were made as comparable as possible. All the routes were walked under climatic conditions that were typical of the time of year (temperatures of between 10°C and 15°C). The route walks were never analyzed on days when it rained or when the temperature was unusually high or low.
The volunteers were students studying different degree courses at the Universitat de Lleida who had previously participated in an earlier study conducted in 2019 (that study was conducted with 45 participants). They were sent an e-mail inviting them to do the route again and we received a total of 10 positive responses. We considered this number positive given the limitations on mobility between different settlements, which prevented some of the volunteers from taking part in the study.
The consent of all the subjects was obtained after providing them with an explanation of the experiment. The data exploitation process was carried out anonymously.
Six of the students were female and four were male, aged 22–25 years, and all of them lived in the city. When making their first route the volunteers filled in an information sheet, which was used to check that they did not have any pathologies that might affect their cardiac rhythm.
During their walks, we (1) registered their location, using an Android smartphone dedicated exclusively to this task; (2) monitored the time between their heart beats, in milliseconds, which was obtained using a Polar Electro H7 Heart Rate Sensor band; and (3) made a video of the route, using video glasses, to verify that the volunteers followed the route correctly and that they fully complied with all the safety measures to combat COVID-19.The three registers all incorporated the time of the readings; this made it possible to interrelate them using the approach designed by Paül i Agustí, Rutllant, and Lasala Fortea (2019).
We used geolocation to ensure that the study was limited to the heartbeats measured within the target area. This approach allowed us to obtain 128,824 measurements from the participants (Paül i Agustí, 2021).
The indicator used to analyze emotions was HRV. This method has been widely used and cited in the academic literature as it provides an objective tool for assessing emotional responses (Valenza , Lanata, & Scilingo, 2012). HRV allows various measurements associated with the interval between heartbeats. The time intervals between consecutive heart beats are measured in the electrocardiogram from the beginning of the Q, R, and S waves (QRS complex) to the beginning of the next QRS complex, so they are conventionally named RR intervals and are measured in milliseconds (ms). Among the resulting measurements, we used the Root Mean Square Successive Difference (RMSSD) or the square root of the average values of the sum of the differences to the square of all the consecutive RR intervals. Following the study of Michels et al. (2013), we associated low RMSSD values with situations of stress; this has been generally recognized as the most suitable measurement for making associations with subjective feelings (Levenson et al., 2017).
To collect this information, all the participants were equipped with a Polar Electro H7 Heart Rate Sensor (HRS) and an Android smartphone, which had been specifically prepared to take these measurements. To avoid any possible interference, the first 15 min of the exercise were treated as a “warm-up period” (Kim & Fesenmaier, 2015).
Participants' heartbeats were monitored to the millisecond and transmitted to an IoTool application installed on a smartphone. This was done in real time, using Bluetooth technology, with the application serving as a datalogger. The IoTool also acted as a geo-localizing device, registering both latitude and longitude through a GPS mechanism incorporated into the mobile phone. The heartbeat and geolocation data were then exported in the form of Comma-Separated Values (CSV) rows. The HRS registers were subsequently processed (using Matlab R2016b) to obtain the RMSSD. To avoid excessive variability in the RMSSD values, the metrics calculations were based on 60-s window values, which moved at a rate of ∼1 s per RR. The GPS and RMSSD values were finally re-synchronized using the “time” field.
The georeferencing of the RMSSD data made it possible to compare the two routes. To do this, we divided the route into a series of 200-m stretches. We verified that the time taken by the volunteers to complete the different stretches were comparable for the 2 years analyzed (e.g., we checked that they did not stop or make contact with any other people) and we calculated the average RMSSD values.
At the end of the two routes, the volunteers were asked to make a short report listing the main things that had caught their attention along the way. They were also asked to draw a mental map. However, the results obtained were very descriptive of the physical, whereas hardly any of the students described their feelings. As a result, we have not considered these results in this part of our research.
In the case of the statistical methods used, the quantitative variable (RMSSD) was expressed using mean values. Differences between RMSSD readings for the routes, and at specific points, both before and during the COVID-19 pandemic, were analyzed using the Wilcoxon signed-ranks test and the nonparametric Student's t-test for paired data, based on a small sample of only 10 participants. The statistical tests were two-sided at a significance level of <0.05. Statistical analysis was carried out using the SPSS software.
Results
A comparison of the results for the routes followed before the COVID-19 pandemic and during the crisis revealed important differences (Fig. 2). The RMSSD values obtained along the routes during the COVID-19 crisis tended to be noticeably lower than those obtained during the 2019 route walks. As can be seen from Table 1, for 8 of the 10 participants, the RMSSD values corresponding to the route during the COVID-19 pandemic were clearly lower than those obtained along the same route before the COVID-19 crisis. This would seem to indicate that a year later, following the same itinerary and at the same time of day, the participants experienced levels of stress that were noticeably higher than before. This occurred despite the fact that it was the second time that the volunteers were doing this route and that they, therefore, knew it better than before.
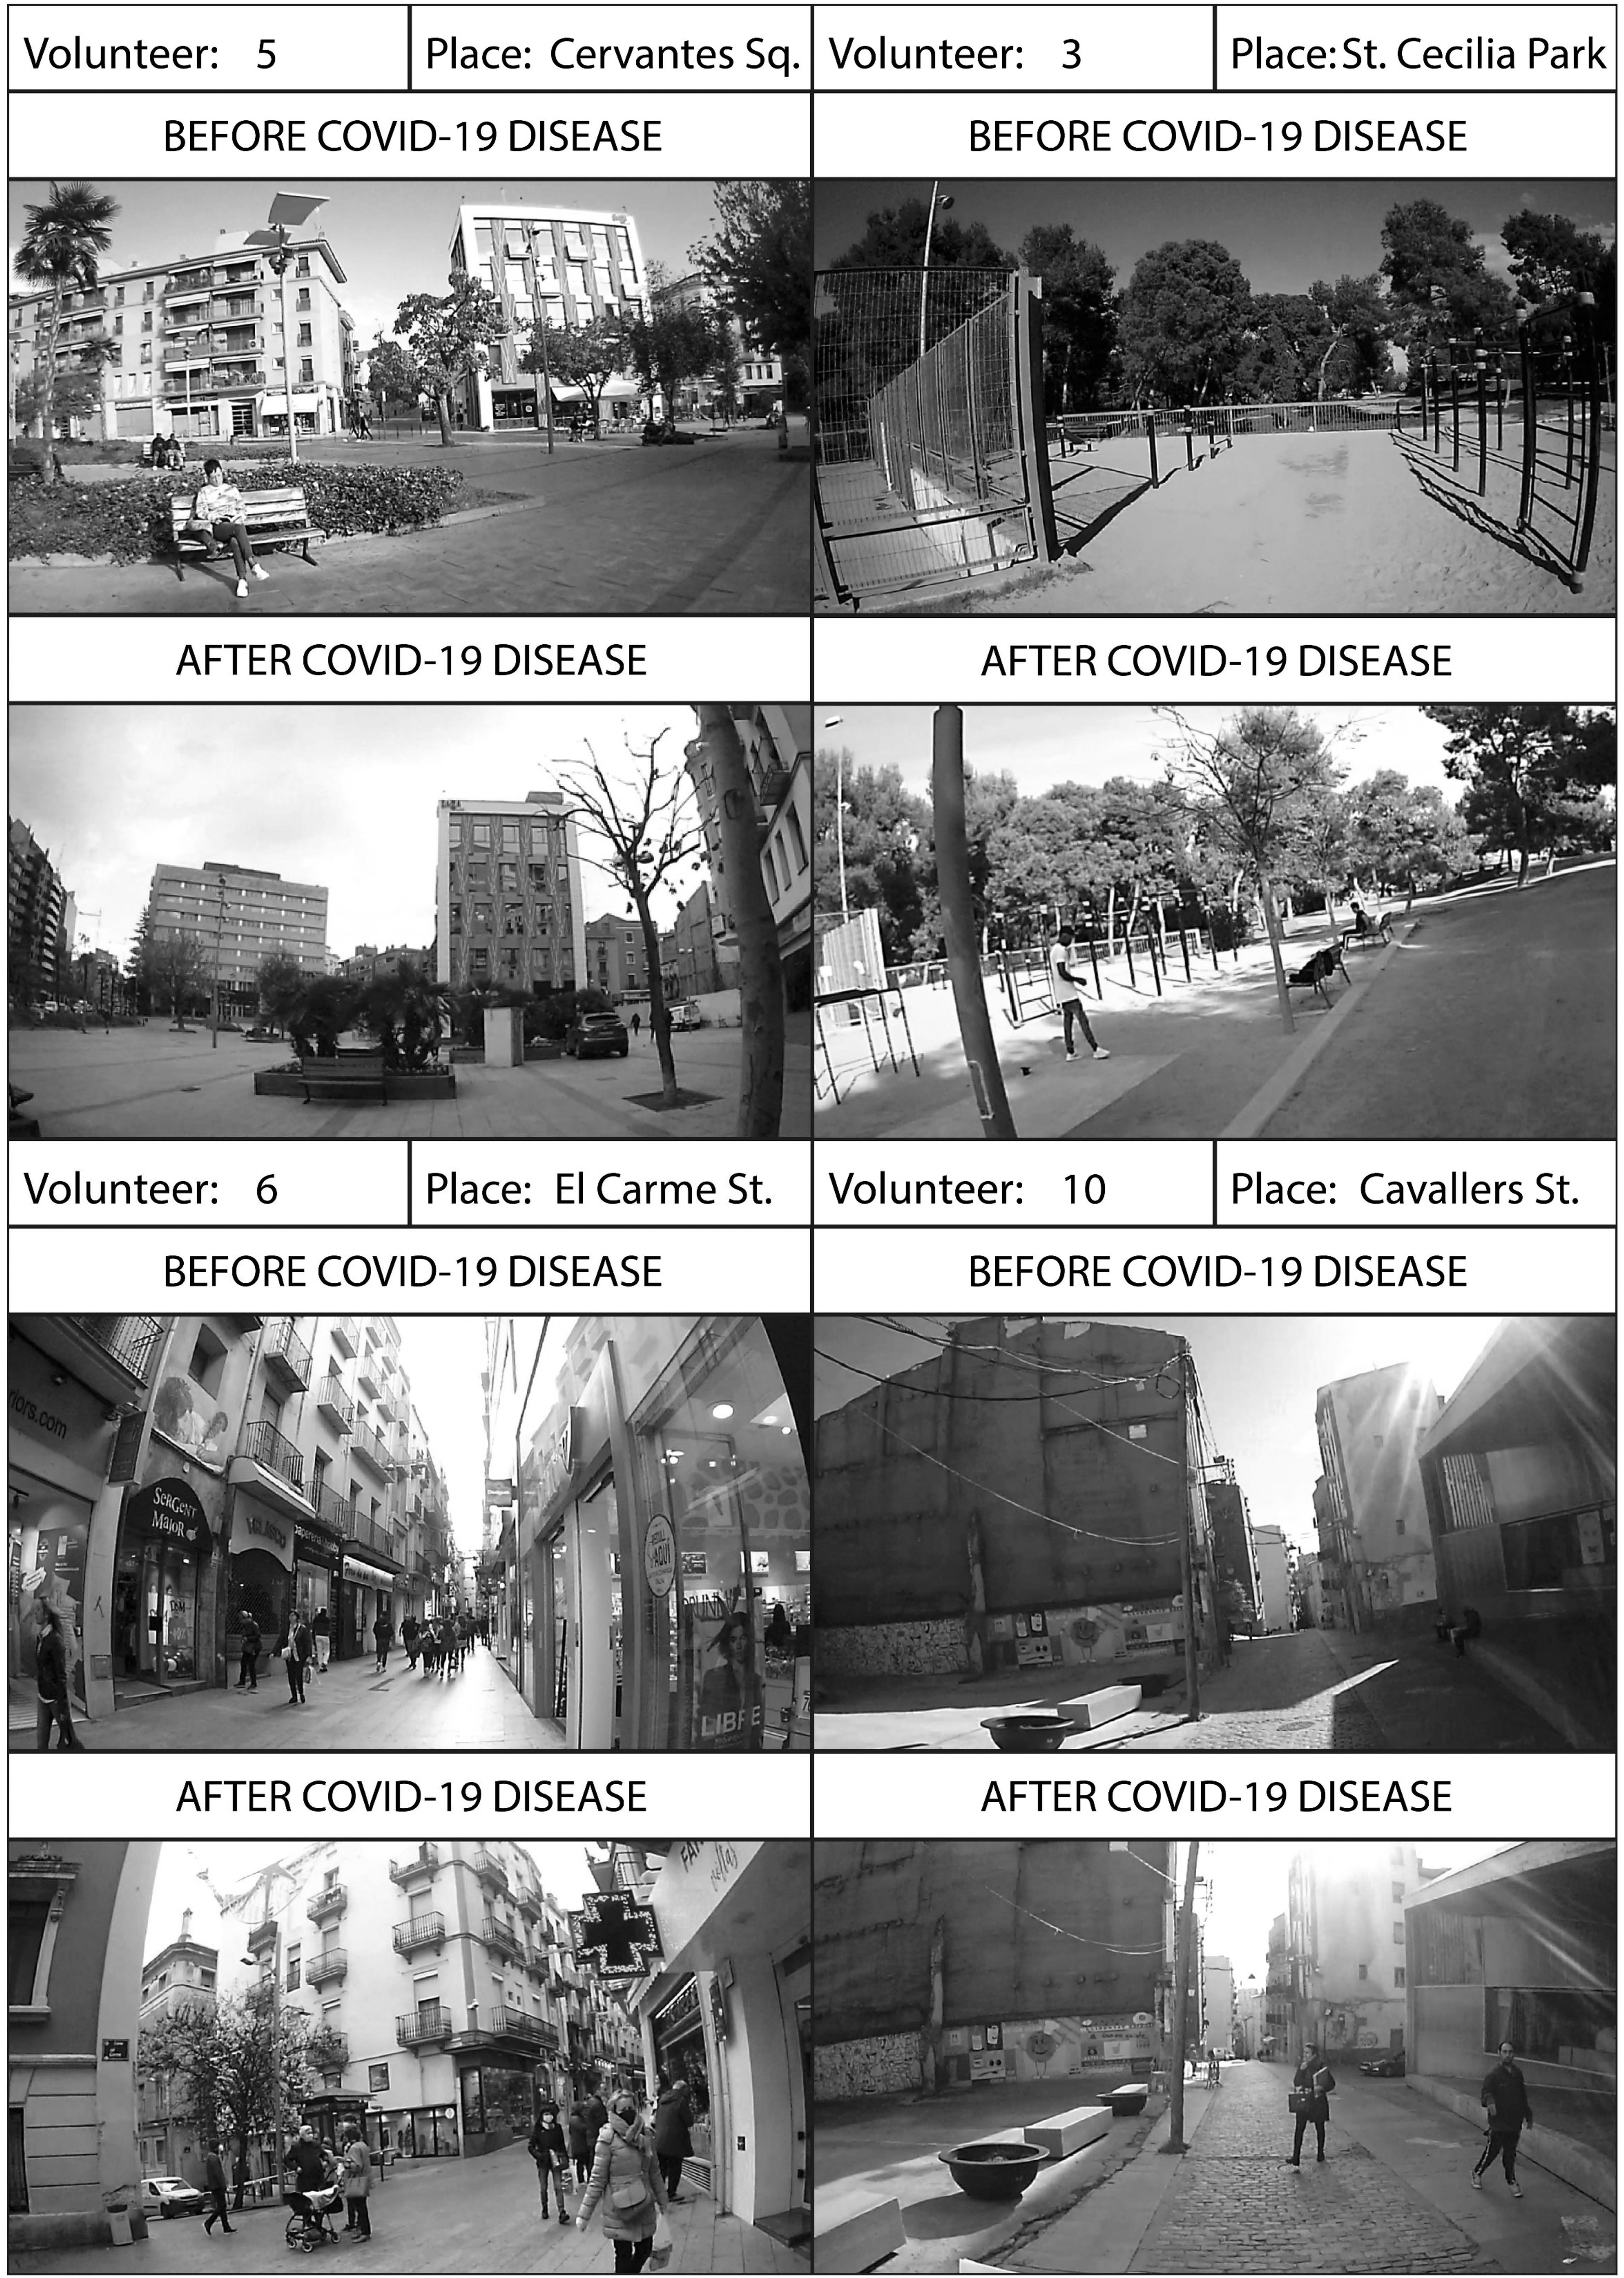
Images of the different specific points analyzed starting from the images taken by the volunteers. Source: video glasses taken by the volunteers.
Comparison of Individual Root Mean Square Successive Difference Readings for Routes and at Specific Points Before and During the COVID-19 Pandemic
RMSSD, root mean square successive difference.
This increase in the level of stress was observed in 8 of the 10 volunteers (Table 1). These volunteers showed average RMSSD values that were between 18% and 55% lower than before, showing a clearly greater level of stress. In contrast, volunteers number 8 and 10 showed clearly higher RMSSD values, indicating that they experienced a lower level of stress than when they first walked the route.
When we eliminated the findings for volunteers 8 and 10, whose behavior was different from that of the rest of the participants, from our analysis, we found statistically significant differences for the route in general (p = 0.012), and also for the majority of the stretches of the route (Table 2).
Comparison of Average Root Mean Square Successive Difference Readings for Routes and at Specific Points Before and During COVID-19, After Eliminating Cases 8 and 10
However, this increase, or decrease, in stress was not experienced at a constant level throughout each route. When we analyzed the RMSSD behavior, we noticed how it was possible to observe significant differences along certain specific stretches of the route. This was particularly evident at the following points:
A. Plaça Cervantes: A 6000 m2 public square. The video images showed that at the time of the walk, there were not many people and not much activity there. On the walk undertaken during the COVID-19 crisis, there was a fall in the RMSSD, signifying an increase in the level of stress. However, in the majority of cases, this increase was only moderate. The differences were statistically significant (p = 0.012).
B. Parc de Santa Cecília: A 35,000 m2 public park with abundant vegetation. At this point, it was possible to observe some clear differences. Volunteers 1 and 2 had similar levels of stress over the two routes. In contrast, volunteers 3 and 4 displayed notably higher levels of stress the second time. Watching the video enabled us to observe that there were more people around, with many of them doing sport and not wearing masks, when volunteers 3 and 4 did the route. The differences were not statistically significant (p = 0.069).
C. Plaça Sant Joan and Carrer del Carme: A 200-m stretch of pedestrian street dedicated to commercial activity, which is from 6 to 12 m wide and highly transited. The majority of the people there were wearing masks, but did not observe social distancing. At this point, the levels of stress experienced by the volunteers tended to be higher than at the previously mentioned points. The differences were not statistically significant (p = 0.050).
D. Carrer Cavallers: A 200-m stretch of pedestrian street, which is from 5 to 7 m wide, without shops, but with quite a large presence of people. Many of these people were not wearing masks. This was the point with the most important changes in the levels of stress experienced. The differences were statistically significant (p = 0.036).
Discussion
The results obtained from the majority of the RMSSD scores showed increases in the levels of stress perceived by the volunteers when they did the route during the COVID-19 pandemic. These increases were greatest in the least open spaces (narrow streets) and in those with the greatest presence of people. We similarly detected increases in levels of stress at points where an important number of people congregated (Carrer Cavallers) and when there were people who did not respect the public health recommendations made by the health authorities (relating to the use of masks, the prohibition of large groups, and social distancing). In contrast, in open spaces, such as squares and public parks, and particularly when there were not many people present, the levels of stress fell.
The observed increases in stress levels were particularly relevant as this was the second time that the volunteers had done the designated route. A priori, there should have been an adaptation effect (as volunteers already knew the route), which would have resulted in a decrease in stress. However, higher RMSSD values (indicating less stress) were only observed in the cases of volunteers 8 (female) and 10 (male). However, we did not observe any significant differences in their videos or routes either before or during the COVID-19 crisis, in terms of mask wearing or social distancing, or a combination of both measures. These findings could perhaps point to a period of adaptation to protective measures (such as masks and safety distances) occurring a few months after the start of the pandemic. These two volunteers may have demonstrated the ability of citizens to adapt to the new situation.
Limitations
The main limitation on the research was the relatively small number of cases used to compare the situation both before and during the COVID-19 pandemic. This meant that the number of cases studied was limited. Even so, it was still comparable with the numbers used in other exploratory studies conducted in the field of analyzing emotions, such as that based on electrodermal activity in two tourists visiting Philadelphia (Kim & Fesenmaier, 2015). We must be aware of the fact that a given situation may generate different responses in different people. This study focused on a single type of visitor. It is now necessary to extend the sample to include profiles relating to other social and cultural contexts to see whether the impact of COVID-19 has been the same for them. Similarly, the sample used was based on a relatively young and healthy population. It would be interesting to extend the sample, incorporating new analyses based on other age groups and/or including people with other health characteristics (e.g., people who had had COVID). Finally, it could be interesting to analyze the changes experienced by people once they had been vaccinated. In this way, it would be possible to see whether the changes described in this exploratory study were case specific or could have had an important temporal influence.
Conclusions
The results obtained showed a significant change in the level of stress experienced by 8 of the 10 volunteers analyzed when they walked through public spaces and we compared the emotions that they experienced before and during the COVID-19 crisis. During the period between the two itineraries, the physical spaces visited were not subject to any significant changes. Furthermore, the participants did not report having suffered any illnesses that could have affected their cardiac rhythms. Everything would, therefore, seem to suggest that their current health status would not have been responsible for the significant increases in the levels of stress that were observed.
This could have important implications for the use that people make of public spaces. The public health situation means that activities that were previously regarded as healthy and beneficial, such as interacting with others or going shopping, are now perceived as situations of risk. This could have two important repercussions: (1) affecting people's quality of life, by increasing their levels of stress; and (2) influencing the use that citizens make of certain urban spaces, which has an indirect impact on commercial activity and the restaurant and catering sector.
Having a better understanding of the effects of the measures taken against COVID-19, which include the levels of stress that they cause people, should be used to improve their application and to anticipate potential problems affecting both people and activities undertaken in public spaces.
Footnotes
Author Disclosure Statement
No competing financial interests exist.
Funding Information
This study was supported by the Institut de Desenvolupament Social i Territorial (INDEST)—Universitat de Lleida and the Spanish National Plan—European Union RTI2018-094142-B-C21.