




Abstract
Connection with nature is essential for human well-being and has been correlated to lower stress. Following the onset of the COVID-19 pandemic, stress levels and connection with nature changed for many employees in the United States who became fully remote. In this article, we present results from a latent profile analysis (LPA) on a longitudinal study conducted at three timepoints from December 2020 to March 2022 among remote workers. We use LPA to identify latent subgroups characterized by their exposure to both indoor and outdoor sources of nature to better understand how the associations between nature and stress vary across latent subgroups not traditionally considered in research. Conducting a profile-based analysis is important, as literature has shown differences in the associations between nature and stress based on individual characteristics. We discover that the number and characteristics of subgroups change over time as does the connection of nature exposure with stress within these subgroups. Specifically, we find that our population falls within a decreasing number of profiles over time, and that there are significant differences in stress levels between some profiles. We also find that different sources of nature exposure might be important for certain subgroups even if not for the entire population and vice-versa. We discuss potential reasons for these variations and offer implications for future research in this domain. The findings highlight the dynamic nature of stress patterns in response to nature exposure in the context of the COVID-19 pandemic. These differences emphasize the need for further work to identify how different subgroups are affected by the associations between nature and stress.
Introduction
Exposure to nature is considered essential to human well-being (Fromm, 1964; Wilson, 1984) and being in the presence of nature is linked to lower stress (Ulrich et al., 1991). Recent reviews have reinforced the well-being benefits of nature exposure (James et al., 2016; Crouse et al., 2017; Hansen et al., 2017; Antonelli et al., 2019). Most research exploring the psychological benefits of the natural environment has focused on direct exposure to the outdoors. However, people spend most of their time indoors, particularly in office buildings. Natural elements in the workplace (e.g., access to sunlight) have been linked to improvements in well-being and prevent declines in well-being measures (Dreyer et al., 2018). However, COVID-19 modified the traditional patterns of behavior and physical contexts.
Work done before has established that (Fig. 1):
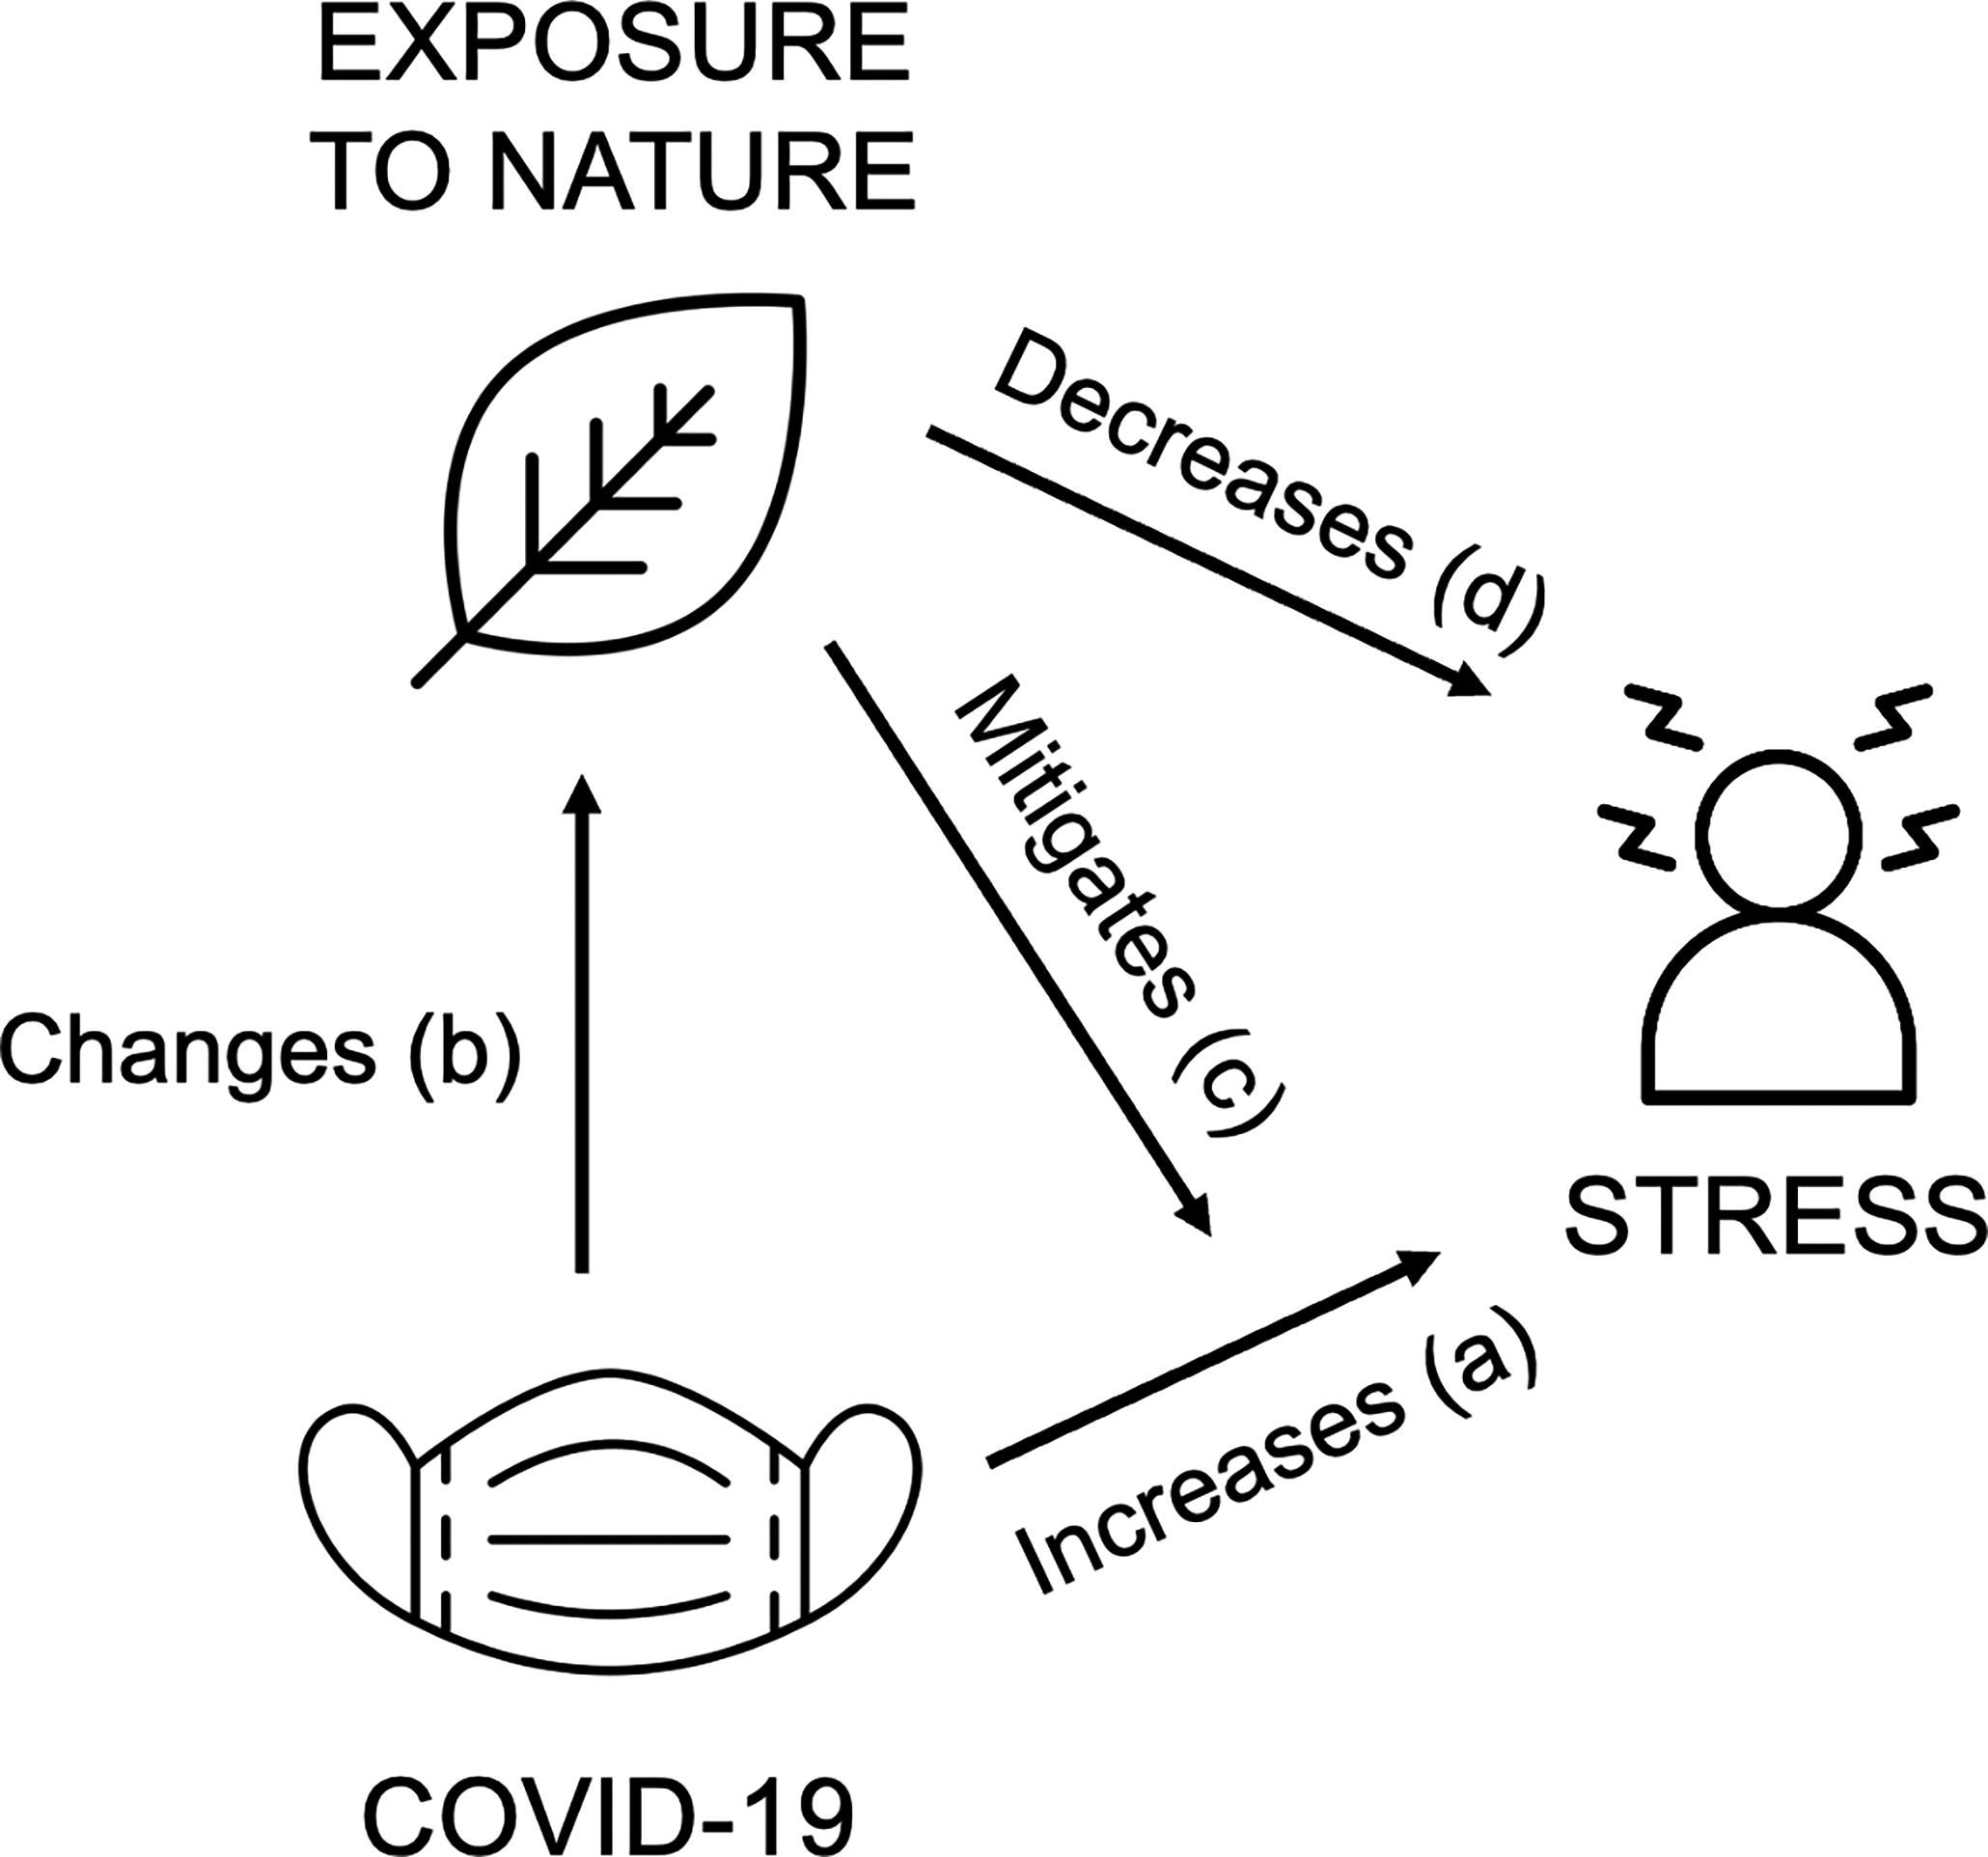
Diagram showing the relationships between the COVID-19 pandemic, exposure to nature, and individual stress. The a, b, c, and d notations refer to the four relationships found by work done before as mentioned. All of the relationships shown vary in intensity for different people as shown by work before.
COVID-19 is associated with higher stress at the population level compared with pre-pandemic levels,
COVID-19 is linked to changes in indoor and outdoor nature exposure compared with pre-pandemic levels,
nature exposure mitigates the effect of COVID-19 on stress, and
increased nature exposure is connected to lower stress, particularly during COVID-19-related restrictions.
Each of the four relationships shown in Figure 1 varies in intensity depending on unique individual characteristics. These differences limit the interpretability of prior findings on associations between nature and stress as they may overlook the heterogeneity of these associations among unobserved subgroups. In addition, these assessments are based on short periods of time and often neglect the combined effect of exposure to natural elements.
In this article, we employ latent profile analysis (LPA) to identify latent subgroups of remote workers during the COVID-19 pandemic based on two factors: their exposure to outdoor and indoor sources of nature. LPA is a probabilistic clustering method that categorizes individuals into groups with similar patterns of responses on multiple variables (Mathew and Doorenbos, 2022). Defining subgroups of nature exposure and investigating their associations with stress is important for personalizing nature interventions based on their efficacy for different types of people beyond the use of traditional demographics. LPA has been used to study a variety of behavioral and epidemiological questions concerning mental health (Rose et al., 2017) and exposures (Weller and Small, 2015). In previous work, the effectiveness of interventions has been linked to different latent classes (Weller et al., 2013).
We pursued three aims. Our first aim was to explore whether there are different classes of nature exposure when considering both indoor and outdoor nature exposure during the COVID-19 pandemic (RQ1). Our second aim was to identify differences in stress within these population subgroups (RQ2). Our third aim was to identify potential differences in the relationship between nature exposure and perceived stress across subgroups during the pandemic (RQ3). Our work aims for an understanding of how different subgroups seek and benefit from exposure to different types of nature with implications for more equitable policy and decision-making.
Background
Exposure to nature and stress
Outdoor nature
The biophilia theory posits that humans have an innate attraction to other forms of life (Fromm, 1964; Wilson, 1984). Many scholars have researched how this psychological need can affect well-being outcomes. The stress-reduction theory (Ulrich et al., 1991) posited that nature can significantly reduce stress. Many studies have focused on the effect of natural, outdoor environments on well-being (Jones et al., 2021; Yao et al., 2021) and have observed that such exposure is associated with lower stress (Antonelli et al., 2019; Olafsdottir et al., 2020; Fu et al., 2022; Song et al., 2022; Gao et al., 2023a) including exposure to photographs (van den Berg et al., 2015; Bianchi et al., 2024) or video (Ulrich et al., 1991; Parsons et al., 1998; Laumann et al., 2003; Bianchi et al., 2024).
The amount of nature that people are exposed to also matters. One study found that those who spent at least 2 h per week in nature had higher life satisfaction (White et al., 2019). Visits to outdoor green spaces of at least 30 min per week were associated with a 9% reduction in high blood pressure (Shanahan et al., 2016). One study found that nature exposure of 20–30 min, three times per week, reduced salivary cortisol and alpha-amylase concentrations, which are two biomarkers of physiological stress (Hunter et al., 2019).
Indoor natural elements
Indoor natural features can also affect well-being (Kellert et al., 2011; Browning et al., 2014). Presence (Hassan et al., 2020; Toyoda et al., 2020) or images (Beukeboom et al., 2012) of plants, views of nature (Ulrich, 1984; Li and Sullivan, 2016; Jiang et al., 2022), natural materials such as wood (Tsunetsugu et al., 2007; Burnard and Kutnar, 2020; Douglas et al., 2022), and natural light (Leather et al., 1998; Douglas et al., 2022; Jiang et al., 2022) were all associated with lower stress of building occupants.
Differences in biophilia among individuals
Prior work supports that the influence of nature on well-being varies across individuals. For example, work on the relationship between percentage tree cover and stress recovery found differences in associations by gender (Jiang et al., 2014). Other factors such as education, age, employment (de Vries et al., 2003), and childhood experiences (Olvera Alvarez et al., 2020) were found to change the intensity of the associations between nature and well-being outcomes. In addition, there is evidence that access to nature is unevenly distributed among groups with socioeconomically disadvantaged (Shanahan et al., 2014) and minority groups (Landau, McClure and Dickson, 2020; Rowland-Shea, 2020) having less access to green spaces. Individual characteristics therefore have the potential of both influencing one’s exposure to nature and its connection to well-being.
Nature and health during COVID-19
The importance of nature for health after the onset of the COVID-19 pandemic was reinforced by several studies (Pouso et al., 2021; Labib et al., 2022). During confinement periods, indoor plants, natural light, and green views were associated with positive emotional well-being (Pérez-Urrestarazu et al., 2021), decreased levels of depression and anxiety (Amerio et al., 2020; Dzhambov et al., 2021; Soga, Evans, Tsuchiya, et al., 2021; Wortzel et al., 2021; Zhang et al., 2023), and additional psychological outcomes (Spano et al., 2021). Public green spaces were also associated with lower stress (Cindrich et al., 2021; Ribeiro et al., 2021) and depression and anxiety (Bustamante et al., 2022). A systematic analysis concluded that nature could mitigate the negative psychological impact of COVID-19 (Nigg et al., 2023).
COVID-19 and time spent in nature
Globally, pandemic restrictions were associated with changes in time spent in nature (Robinson et al., 2021; Labib et al., 2022). In the United States, study respondents reported spending more time outdoors (Grima et al., 2020; Tomasso et al., 2021). Studies in additional countries (e.g., Germany (Derks et al., 2020), Norway (Venter et al., 2020), Italy (Ugolini et al., 2021), South Korea (Heo et al., 2021), Australia (Berdejo-Espinola et al., 2021), United Kingdom (Burnett et al., 2021; Robinson et al., 2021)) found changes in time spent in nature after lockdowns, in multiple directions, potentially owing to differences in data collection periods (Labib et al., 2022). A study identified three possible pathways responsible for these changes (Soga, Evans, Cox, et al., 2021): changes in opportunity (e.g., more free time), in motivation (e.g., fear of disease), and in capability (e.g., mental functioning). Further, preexisting inequalities in green space access (related to, e.g., age, socioeconomic status) may have worsened after the onset of the pandemic (Shoari et al., 2020; Astell-Burt and Feng, 2021; Gao, Zhai, and Fu, 2023b), further widening the gap in nature access across groups. The pandemic therefore played a significant role in shifting time spent in nature.
Stress during COVID-19
The COVID-19 outbreak was characterized as a chronic stressor (Pfefferbaum and North, 2020; Pfeifer et al., 2021). A meta-analysis found that the prevalence of stress increased by almost 30% between March and April 2020 (Mahmud et al., 2022). Studies found that perceived stress levels were significantly related to gender, age (Douglas et al., 2020; Mazza et al., 2020; O’Connor et al., 2020, 2021), health (Douglas et al., 2020; O’Connor et al., 2020, 2021), race or ethnicity (Douglas et al., 2020; O’Connor et al., 2020), employment (Douglas et al., 2020; Mazza et al., 2020), and home situation (Mazza et al., 2020; Fornara et al., 2022). The COVID-19 pandemic therefore had a significant impact on stress, with variations in intensity across individuals, and impacted the mitigating effect of nature on mental health between demographic factors. For example, women were more likely than men to report that green spaces benefited their mental health during restrictions (Burnett et al., 2021), whereas greenery was linked to lower COVID-19-related worries for younger populations (31–38 years old; Wortzel et al., 2021).
Methods
Data collection
We collected data through three online surveys created with Qualtrics and distributed on Prolific, an online crowdsourcing platform. Our target population was full-time remote workers in the United States who used to work on-site before the COVID-19 outbreak as we sought to reach a population whose main work environment had changed after the onset of the pandemic. We conducted a 1 min screening online survey (n = 3,000) and identified 603 people meeting these criteria. These participants were invited to take a 30 min survey in December 2020 (S1) and 455 responded. Subsequently, all participants of S1 were invited to take Survey 2 (S2), which was identical to S1 and released in March 2021, regardless of whether they were still working remotely (n = 305). Similarly, S1 participants were invited to complete Survey 3 (S3) in March 2022 (n = 228).
Study variables
We collected data on two types of nature exposure: outdoor nature and indoor nature. For outdoor nature, we asked participants how many days per week they spent some time in nature and, on such days, how many hours on average from 0 to 12 h. We then calculated their outdoor nature exposure in hours per week (i.e., days per week times hours per day).
For exposure to indoor nature, we asked participants the number of natural elements present at their home office, from “Not Present” to “4+ sources.” Specifically, we inquired about sources of “natural light,” “views of nature/outside,” “natural materials (e.g., in furniture and flooring),” “indoor plants,” and “decor with nature elements (e.g., in paintings, photography, sculpture)." We asked respondents to indicate how many days per week they worked from home, and for how many hours per workday. These variables allowed us to compute their number of working hours per week, which we multiplied by the sum of all types of natural elements at their office, with people having indicated “4+ sources” all being assigned four natural elements. The unit for this variable was natural elements hours per week.
Stress scores were obtained using the Perceived Stress Scale (PSS; Cohen et al., 1994), which consists of 10 questions asking respondents how often they felt a certain way over the previous month (e.g., “In the last month, how often have you been able to control irritations in your life?”). Participants answered on a 5-point Likert scale from “Never” to “Very Often.” The scores of each question were inverted where applicable and summed with aggregate PSS scores ranging from 0 to 40.
Statistical analysis
We excluded from our analysis participants who exhibited indications of not paying full attention, such as patterned responses to Likert-scale questions or suspected bot activity, resulting in four exclusions for S1, three for S2, and none for S3. We removed participants working from home less than 3 days per week as we had no data on nature exposure at their site office, leading to sample sizes of 419, 262, and 155. We used t-tests to assess the significance of changes over time of stress and exposure to nature, and Pearson correlation to understand correlations between these variables.
Our primary aim was to generate a typology of nature exposure during the pandemic to understand trajectories of nature exposure and stress during the COVID-19 pandemic. We used LPA to identify latent subgroups profiles in our target population of remote workers during the COVID-19 pandemic based on two factors: their exposure to outdoor and indoor sources of nature. Before the creation of these typologies, we applied linear regression models to predict stress from exposure to indoor and outdoor nature at each timepoint, and ran mixed-effects multilinear regressions to evaluate the influence of indoor and outdoor nature on stress while considering the effect of time and individual clustering. These nonlinear models were first run without and then with covariates added (age, gender, race).
Outliers with particularly high or low exposure to nature were then removed based on z-score (z < −3 or z > 3; 13 outliers for S1, 6 for S2, 4 for S3; all with z > 3). We conducted a LPA using the mclust package in R, selected the top-performing model type, and identified the optimal number of profiles. Additional profile selection details are available in Supplementary Material (Supplementary Fig. SA1, SA2, SA3). Once the subgroups were identified, we used analysis of variance (ANOVA) to determine if stress was significantly different between profiles to answer RQ2. We conducted linear regressions using outdoor nature exposure and indoor nature exposure as individual predictors of self-reported stress in each profile to answer RQ3.
Results
Descriptive statistics
We observed an attrition in the sample size between S1 and S3, with only 37% of our original sample completing the last survey (Table 1). This attrition rate is similar or better than typical response rates to similar surveys (<20%; Sax et al., 2003). However, our demographic distribution remained stable across timepoints with 51.6–56.5% of participants identifying as men, 61.5–63.2% identifying as white, and a mean age of 35–39 years old.
Demographics after Exclusions for Surveys 1, 2, and 3, Including Only Participants Working from Home 3 Days per Week or More. Participants Who Did Not Answer the Demographic Questions or Chose “Prefer Not to Answer” Are Not Shown in the Demographic Breakdown but Still Counted in the Survey Sample Size
We found low correlations between exposure to indoor and outdoor nature for each timepoint, which suggests that there is no simple relationship between the two. Our ANOVA revealed that, at the population level, time spent in outdoor nature did not significantly change over time, but that time spent in indoor nature significantly decreased over time (p = 0.001**). Tukey tests revealed that exposure to indoor nature was significantly higher in S1 than S2 (p < 0.005**), with on average 40 natural element hours per week more in S1; and statistically higher in S1 than S3 (p = 0.015*), with 50 natural elements hours per week more in S1. More specifically, we found that the number of natural elements at participants’ home offices decreased significantly over time (p < 0.001***), with an average decrease of 1.5 natural elements from S1 to S2 (p < 0.001***) and of 1.2 elements S1 to S3 (p = 0.013*), whereas the weekly number of hours worked by participants at their home office did not significantly change. Finally, we found that PSS significantly decreased over time (p = 0.03*) and post-hoc tests confirmed that scores were significantly higher in S1 compared with S2 (p = 0.04*) by one point on average.
Using linear regression models, we examined how outdoor and indoor nature exposure individually relate to PSS at each timepoint. We found that for every additional hour in nature, participants reported PSS scores lower by 0.15 (±0.06) points in S1 (p = 0.01*), 0.23 (±0.08) points in S2 (p < 0.007**), and −0.46 (±0.19) points in S3 (p = 0.02*). We found that more indoor nature exposure was associated with lower stress for S1, with 0.004 (±0.02) fewer points on the PSS for every additional natural elements hour (p = 0.06†). We found no association at S2 (p = 0.20) or S3 (p = 0.72).
We ran two mixed-effects multilinear regressions (Supplementary Table SA1) to further understand the associations between outdoor and indoor nature exposure and stress while accounting for the effect of time (fixed effect) and individual clustering (random effect). We again found that, as exposure to nature increased, PSS scores were lower by on average 0.086 (±0.04) points for every additional hour in nature (p = 0.04*). We found that the survey timepoint was associated with stress reductions of greater magnitude than exposure to outdoor nature, with 1.15 (±0.34) points lower on the PSS scale in S2 compared with S1 (p < 0.001***), and 1.10 (±0.43) points lower in S3 (p = 0.01*). When adding covariates to the models (age, gender, race), we found that outdoor nature and survey timepoints remained significantly associated with lower stress scores with changes in coefficient estimates (Outdoor nature: β = −0.12 (±0.05), p = 0.009**; S2: β = −1.13 (±0.35), p = 0.002**; S3: β = −0.91 (±0.44), p = 0.04*). We found that age was associated with stress, with on average 0.16 (±0.04) fewer points on the PSS for every additional year of age (p < 0.001***). Gender was also associated with stress (p < 0.001***) with 2.66 (±0.69) more points of perceived stress for participants not identifying as men.
When running the same models with indoor nature as a predictor, we did not find a significant association of this predictor with PSS scores. We again found associations between survey timepoint and stress, with 1.17 (±0.35) points lower on the PSS scale in S2 compared with S1, and 1.16 (±0.44) points lower in S3. With covariates included in the model, exposure to indoor nature remained unassociated with PSS scores (p = 017), whereas timepoint remained significantly associated with lower stress (S2: β = −1.13 (±0.36), p = 0.002**; S3: β = −0.93 (±0.45), p = 0.04*). Age was significantly associated with stress scores (p < 0.001***) with 0.16 (±0.04) fewer points on the PSS for every additional year of age, whereas participants who did not identify as a man had on average 2.67 (±0.69) more points of perceived stress (p < 0.001***).
Latent profile analysis
Profile characteristics
Our profile selection process yielded five profiles at S1, four at S2, and three at S3 (Fig. 2) with different levels of indoor and outdoor nature exposure (Table 2). Additional demographic information per profile can be found in Supplementary Material (Supplementary Table SA2, SA3, SA4).
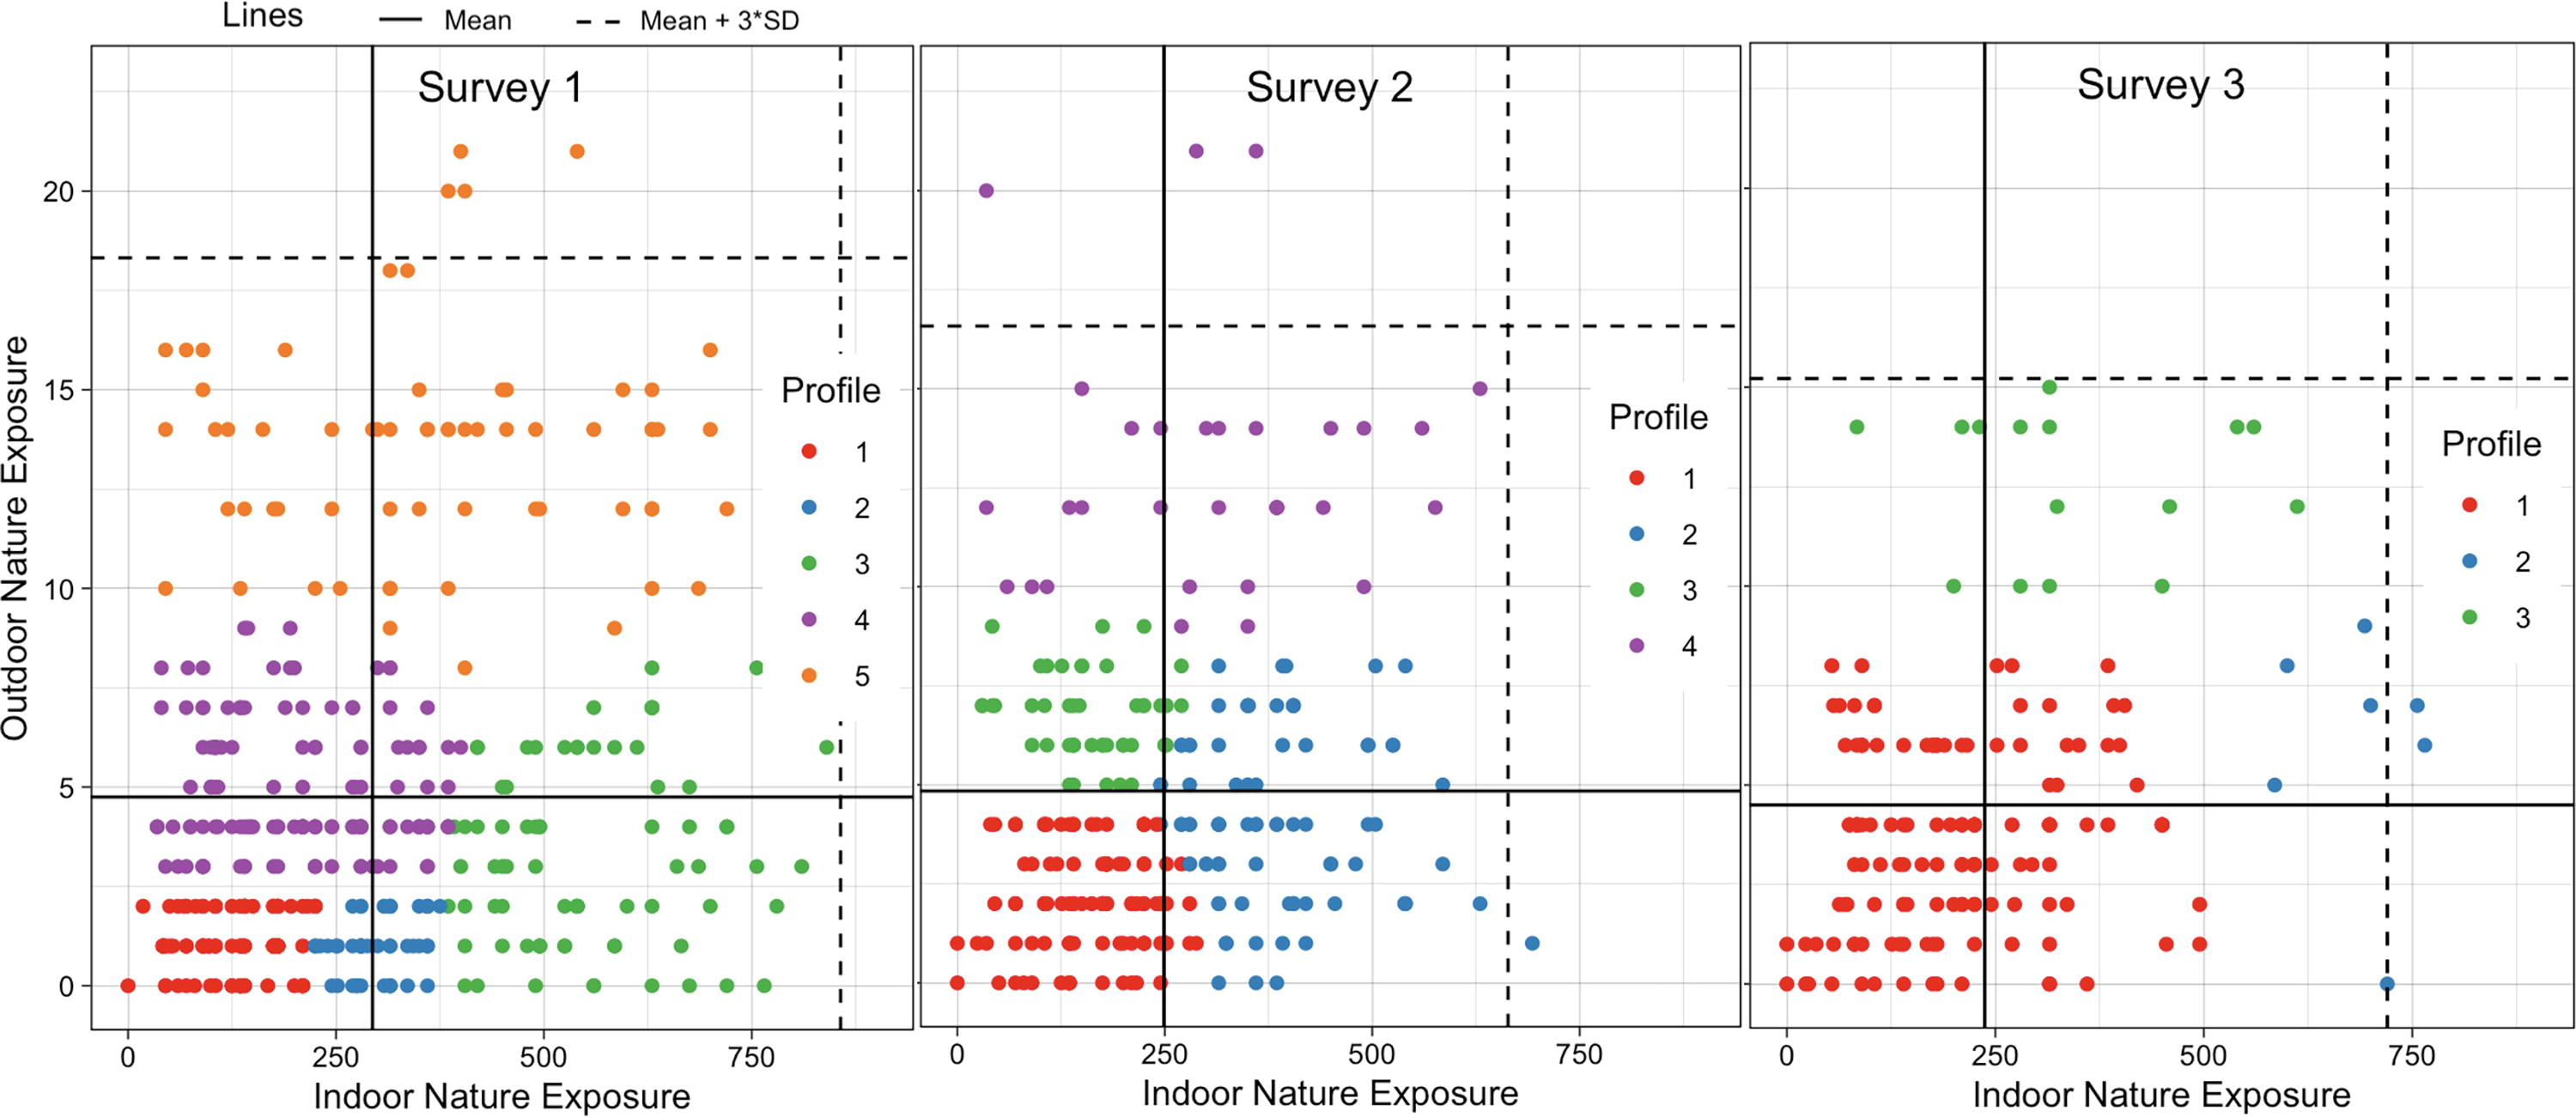
Visual breakdown of profiles using latent profile analysis across our three surveys. Different profiles are shown in different colors as indicated by the legend for each survey. Identical profile colors across surveys do not indicate identical profile characteristics (Table 2).
LPA Profile Breakdown (Size, Scores of Nature Exposure) for Participants Who Completed Survey 1 (Using a VEI5 Model: variable Volume, Equal Shape, Diagonal Distribution along the Coordinate Axes), Survey 2 (VEI4 Model), and Survey 3 (EII 3 Model: spherical, Equal Volume)
LPA needs responses in all study variables to be conducted. We therefore excluded participants who had provided no answer regarding their exposure to indoor and/or outdoor nature. As a result, we have a lower sample size compared with that presented in Table 1.
LPA, latent profile analysis.
In S1, Profile 1 had low exposure to both types of nature. Profile 2 had low exposure to outdoor nature and medium exposure to indoor nature. Profile 3 had high exposure to indoor nature and medium exposure to outdoor nature. Profile 4 had medium exposure to outdoor nature and low-to-medium exposure to indoor nature. Profile 5 had high outdoor nature exposure and low-to-high indoor nature exposure.
Reaching a certain threshold of outdoor nature exposure (10+ h) seemed to make the indoor nature exposure irrelevant as participants with this level of outdoor nature were clustered in the same profile regardless of their indoor nature exposure. This relationship was not observed for participants with high levels of indoor nature exposure: they belonged to either Profile 3 or Profile 5 depending on their exposure to outdoor nature. However, the number of indoor natural elements recorded per participant was capped at “4+ sources,” meaning we did not capture differences in the number of natural elements beyond four sources.
In S2, Profile 1 had low exposure to both types of nature. Profile 2 had low-to-medium exposure to outdoor nature and high exposure to indoor nature. Profile 3 had medium exposure to outdoor nature and low exposure to indoor nature. Profile 4 had high exposure to outdoor nature and low-to-high exposure to indoor nature. Once again, any participant with more than 10 h per week of exposure to outdoor nature belonged to this subgroup, regardless of their indoor nature values.
In S3, Profile 1 had low to-medium exposure to both types of nature. Profile 2 had low-to-medium exposure to outdoor nature and high exposure to indoor nature. Profile 3 had high exposure to outdoor nature and low-to-high exposure to indoor nature. Any participant with 10 h or more of weekly exposure to outdoor nature belonged to this profile.
Stress differences between profiles
With our latent profiles identified, we compared stress across profiles (Fig. 3). Using ANOVA, we found significant differences in mean stress in S1 between profiles (F = 3.57, ηG2 = 0.04, p = 0.007**): perceived stress in participants fitting Profile 1 (M = 19.4 ± 8.12) was significantly higher than that of participants in Profile 4 (M = 16.2 ± 7.56, p = 0.02*) and Profile 5 (M = 15.7 ± 8.01, p = 0.03*). For S2, we found significant differences (F = 3.68, ηG2 = 0.04, p = 0.013*) between the stress levels of Profile 1 (M = 17.6 ± 7.60) and Profile 3 (M = 14.1 ± 7.30, p = 0.04*). We also found differences between Profile 1 and Profile 4 (M = 13.9 ± 8.23, p = 0.07†), with stress being higher in Profile 1. No significant differences in profile stress levels were observed for S3 (p = 0.139).
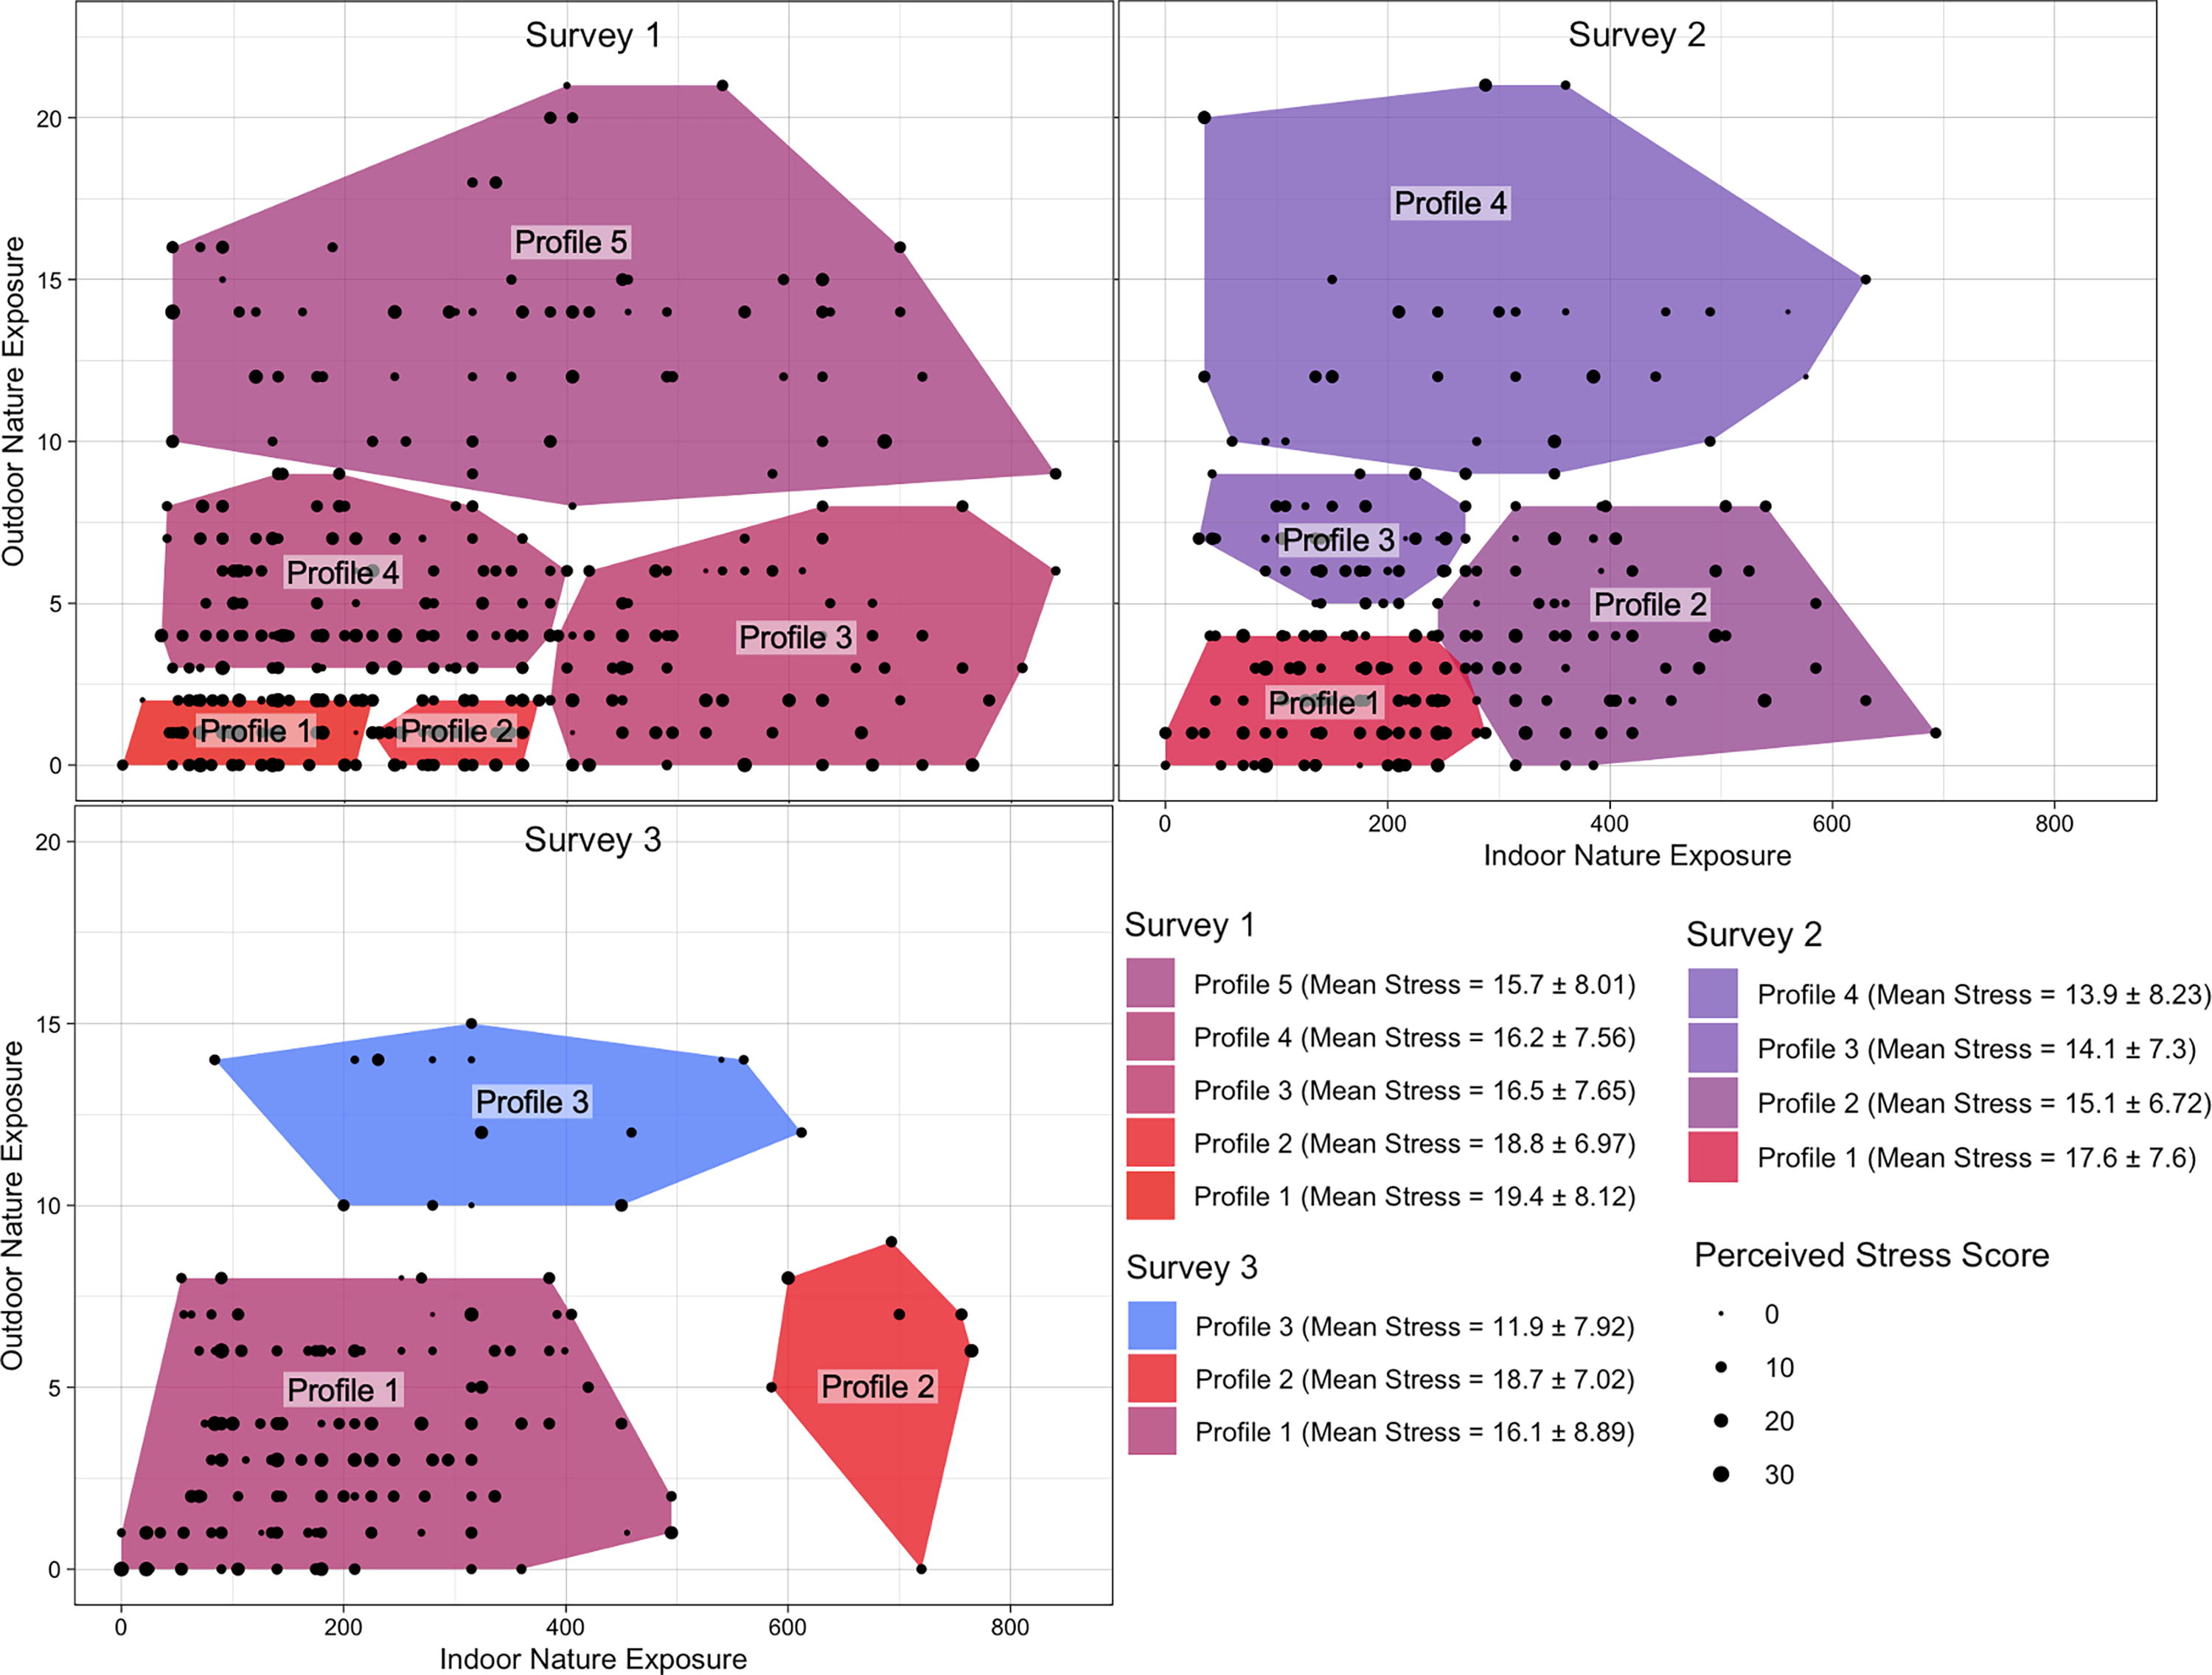
Mean perceived stress scores per participant and per profile across each survey timepoint.
Connection between nature and stress across profiles
To answer RQ3 and evaluate if the relationships between exposure to nature and perceived stress is different across subgroups compared to the population level, we conducted linear regression models within each profile using outdoor exposure and then indoor exposure as individual predictors (Table 3). We found that increased exposure to outdoor nature was associated with significantly lower perceived stress in Profile 3 of S1. We also find associations between increased nature exposure and lower stress in Profile 4 for S1 (p = 0.06†) and S2 (p = 0.04*).
Linear Regression Results Using Exposure to Outdoor Nature and Exposure to Indoor Nature as Individual Predictors of Stress within Each LPA Profile Across Each Timepoint
p-Value significance: <0.1
LPA, latent profile analysis.
Discussion
Linear regressions and mixed-effects models
Similar to prior work, we found that greater exposure to outdoor sources of nature was associated with lower perceived stress scores when running linear regression at each survey timepoint (Table 3) and when running a mixed-effects model accounting for the effect of time and covariates. These results suggest that outdoor nature was important for stress management regardless of the stage of the COVID-19 pandemic and for all genders, ages, and racial identities. However, while more indoor sources of nature were associated with lower stress in S1 (Table 3), we found no such association for other timepoints or in our mixed-effects models. It is possible that the potential effect of indoor nature on stress became less important as the pandemic progressed.
LPA outputs across timepoints
There was a consistent reduction of one profile at each timepoint (Fig. 2). Changes in the number of profiles could be linked to physical or behavioral changes across timepoints and the policies influencing these changes, which we will elaborate further in our Discussion section. The percentage of participants with shelter-in-place orders decreased by 50% between S1 and S2, and by 75% from S2 to S3 (Table 1). Changes in remote work and increases in allowable activities could have altered the opportunities for exposure to nature, which may have led to a reduction in profiles, as people’s experiences in nature became more homogenous and home offices setups became less influential.
Regardless of the number of profiles, all surveys had one group defined solely by their high exposure to outdoor nature (10+ h), regardless of their exposure to indoor nature (Fig. 2). Each survey also had one profile with low exposure to both types of nature (Fig. 2). However, we noticed differences in how participants were grouped into this profile across surveys (Table 2). More specifically, the thresholds of exposure to both types of nature increased for the members of this profile (Fig. 2): in S1, members of Profile 1 had values below the sample mean for both types of exposure, but in S3, Profile 1 received exposure to outdoor and indoor nature of up to one standard deviation higher than the mean. This change could suggest that, as the pandemic evolved (Table 1), the differences between people who have low and medium exposure became less distinct, leading to the creation of a single profile for all of them.
Stress differences between profiles
Our results showed that groups with increased exposure to outdoor nature had lower stress in line with work done before (Ulrich et al., 1991). We did not find such association with indoor nature exposure, which differs from research done before (Kellert et al., 2011). In S1, significant differences in stress levels were observed as exposure to outdoor nature increased (e.g., from Profile 1 to Profile 4 and to Profile 5). This observation did not hold for exposure to indoor nature. We observe a similar process in S2. This observation is in line with the linear regression conducted for the full samples at each time point (Table 3) and the mixed-effects models (Supplementary Table SA1) which showed no association of stress with exposure to indoor nature, and a significant association of stress with exposure to outdoor nature.
Connections between nature and stress across profiles
To investigate the differential association between nature exposure and stress between profiles, we ran within-profile linear regressions. We compare the value of our within-profile linear regressions to those obtained when running linear and mixed-effects regressions on full samples (Table 3). In S1, an additional hour spent in outdoor nature is associated with −0.15 (±0.06) fewer points on the PSS across our full sample. An identical change in outdoor nature for Profile 3 corresponds to stress levels lower by −1.63 (±0.35) points. These results suggest that, in S1, Profile 3 benefited from a 10 times more beneficial relationship between exposure to outdoor nature and stress reduction, a difference that would have been missed without LPA.
We found an association between indoor nature exposure and stress for S1 (p = 0.06†), and no associations for S2 or S3 (Table 3). In S1, we found that an increase of one natural elements hour per week was associated with stress scores lower by −0.012 (±0.006) points for Profile 4, which is a three times stronger association than for the entire sample. In S2, we found that members of Profile 4 had stress scores significantly lower by −0.019 (±0.009) points for every additional natural elements hour of indoor nature, thus suggesting that this exposure might be important for certain subgroups even if not for the entire population.
We did not find significant associations between exposure to nature and stress for any profile in S3. This absence of results could come from sample attrition. It is also possible that, as COVID-19 restrictions eased up, participants accessed alternative stress-relieving activities (e.g., spending time with friends, attending events), thus reducing the magnitude of the hypothesized associations between stress and nature.
Potential mechanisms behind profile changes
There are multiple mechanisms that might explain the changes in nature exposure, number of profiles, and the relationship between nature and stress over time. Our hypothesized mechanisms include changes in policy, physical location, and behavior.
Policy changes
The COVID-19 pandemic period was governed by local, regional, and federal policies that may have affected participants’ exposure to nature. Restrictions (i.e., shelter-in-place, park closures) changed across our survey timepoints (Table 2). With policies in place restricting where people could go, participants may have spent more time at their home office and less time in public green spaces, thus affecting their exposure to nature. The Supplementary Material for this article includes further information on restrictions and compliance across profiles (Supplementary Table SA2, SA3, SA4). Policy changes also potentially influenced the connection of nature exposure to stress across profiles: more restrictions could have led to a stronger appreciation for outdoor nature, and thus a stronger stress reduction effect of this type of exposure (Berdejo-Espinola et al., 2021).
Physical work location changes
Our analysis of indoor nature exposure relied on the number of natural elements present at home offices reported by participants. There might have been individual variations in the number of days that our participants were working from home over time, which could have affected their indoor nature exposure and subsequent profile grouping. In addition, physical changes in one’s working environment could have resulted in changes in opportunities to receive exposure to outdoor nature, as discussed in work done before (Soga, Evans, Cox, et al., 2021), owing to changes in commuting frequencies (e.g., no longer having a commute through a park as because of remote work) and changes in the amount of free time available.
Behavioral changes
The amount of time people choose to spend in nature depends on their personal preferences and behavior. Work done before suggests that people’s motivation to spend time in nature changed throughout the pandemic with, for example, increased motivation to spend time outdoors to compensate for stay-at-home orders (Soga, Evans, Cox, et al., 2021). Moreover, over time, these individual particularities can change regardless of external factors (Roberts and Mroczek, 2008; Soto et al., 2011).
Limitations and future work
While our analysis excluded participants not working remotely at least 3 days per week, some participants were not fully remote. As we did not collect data on their site office or their home outside of their home office, we omitted two additional sources of indoor nature in our analysis. In addition, we capped our indoor natural element scale to “4+ sources,” meaning that participants with four or more elements would all have the same indoor nature exposure score, thus affecting the grouping of participants with high exposure to indoor nature.
While longitudinal studies allow for a better understanding of relationships over time, a limitation of such an approach is sample attrition. With small samples, obtaining statistically significant results is challenging. LPA involves dividing samples into subgroups, further reducing the sample size. We found that the optimal number of profiles per survey decreased over time. Although this trend could be owing to the mechanisms discussed above, it could also be driven by a reduction in our sample size.
We recommend that future work include gathering larger samples of participants to populate the profiles and confirm the associations between nature and stress across profiles more robustly. Experimental studies in controlled environments where one type of nature exposure is varied while the other type is held constant would allow researchers to understand how different types of nature interact with each other and with stress. Although this article hypothesized on potential explanations for profiles changing over time, further causal research is needed to understand reasons behind profile variations. Finally, future work could also provide more insights on the effect of nature on stress compared with other stress-relief strategies with considerations for different causes of stress and different types of activities that can be conducted in nature.
Conclusion
Our study highlights the dynamic interplay between exposure to different sources of nature and stress during the COVID-19 pandemic. The identification of subgroups and changing patterns of nature exposure highlights the complexity of individual stress during this period. Overall, this analysis represents a step toward understanding the different profiles of people who seek or receive exposure to outdoor and indoor nature and how these behaviors relate to stress in a pandemic context. Our key contributions include:
We found that there were three to five different profiles of people defined by their combined exposure to indoor and outdoor nature depending on the time point. We observed that the optimal number of profiles for our samples decreased linearly over time, which we hypothesize could be linked to the concurrent easing of COVID-19 restrictions. While the number of optimal profiles is not consistent across time points, we observed some similarities in profile characteristics, such as, the existence of a profile solely defined by high exposure to outdoor nature in all surveys. We found significant differences in stress outcomes across subgroups based on differences in exposure to outdoor nature, which confirmed findings from our linear analyses showing that outdoor nature exposure is associated with lower stress. Across the profiles, the relationships between nature and stress varied. We found that one type of exposure to nature may be associated with lower stress across an entire population but not within subgroups and vice-versa.
Conducting LPAs may provide greater insight into the specific and dynamic connections between nature and stress on subgroups compared to traditional methods. Although our models at the population level showed that exposure to indoor nature was not significantly linked to lower stress, our LPA results highlight that exposure to indoor nature was important for some profiles at some timepoints. These findings emphasize the need for personalized approaches to understanding the impact of nature on well-being. By embracing this complexity, we can better inform equitable strategies that promote mental health and resilience.
Footnotes
Acknowledgments
Lucy Z Bencharit: Conceptualization; James A Landay: Conceptualization and funding acquisition; Merrick A Howarth, Dunia N Karzai: Data curation and investigation.
Authors’ Contributions
E.B.: Methodology, data curation, formal analysis, writing–original draft, visualization, and writing–review and editing. L.S.P.B.: Conceptualization, methodology, supervision, and writing–review and editing. B.A.: Data curation. N.A.S.: Conceptualization, writing–review and editing. E.L.M.: Conceptualization, methodology, funding acquisition, and writing–review and editing. S.L.B.: Conceptualization, funding acquisition, methodology, supervision, project administration, and writing–review and editing.
Author Disclosure Statement
No competing financial interests exist.
Funding Information
This work was supported by the COVID-19 Crisis Response grant and the Center for Integrated Facility Engineering at Stanford University. These funders had no part in the conceptualization, design, data collection, analysis, decision to publish, or preparation of the article.

References
Supplementary Material
Please find the following supplemental material available below.
For Open Access articles published under a Creative Commons License, all supplemental material carries the same license as the article it is associated with.
For non-Open Access articles published, all supplemental material carries a non-exclusive license, and permission requests for re-use of supplemental material or any part of supplemental material shall be sent directly to the copyright owner as specified in the copyright notice associated with the article.
