
Abstract
Abstract
Textural changes can manifest in emplaced barrier materials for contaminants in response to their stabilization with aqueous polymers against desiccation stresses that can induce cracking. In this Part II of the two-part article, experimental studies of clay and sand/clay barrier materials were performed to determine their shrinkage, drying rate (DR), and cracking patterns when admixed with aqueous polymers such as polyvinyl alcohol, polyethylene oxide, carboxymethyl cellulose, and chitosan. Aqueous concentrations used were in the range of 0–5 g/L, and DR tests were performed at 25°C and 30% relative humidity. Shrinkage tests were performed at 75°C. As evident in the shrinkage results for chitosan and polyethylene oxide with 90:10 mixture of sand:montmorillonite, high aqueous polymer content may not necessarily translate to greater resistance to barrier material shrinkage. Results show that almost all polymer-amended barrier samples exhibit better shrinkage characteristics (low shrinkage ratio and high shrinkage limit) than those mixed with distilled water. Polymer chain length does not correlate positively with shrinkage parameters. The DR curves show greater retention of aqueous polymer solutions than distilled water in desiccating barrier materials after 10 h of drying. At any concentration between 0 and 5 g/L, only polyvinyl alcohol can be considered to be a crack inhibitor.
Introduction
In the third stage of drying, there is no major change with respect to cracking, but further evaporation ensues (Abu-Hejleh and Znidarčić, 1995). Fine-grained soils are more prone to developing cracks than coarse-grained soils under soil suction because they trap larger volumes of air per unit volume (Miller et al., 1998). Shrinkage and cracking are likely to occur upon drying of clays because of their high specific surface areas. Barriers are usually clay dominated because of the need for low hydraulic conductivity. Further, fine-grained soils with high specific areas tend to have high capillary pressures (Cohen et al., 1990). Capillary pressure starts to form when menisci are initiated in the smaller pores. Crack development in soil matrices has been studied in great detail by various investigators. Nishimura (2005) has studied the development of cracks in cohesive soils due to compression and found that soils with low water content tend to crack more. For clay-cohesionless soil mixtures similar to those that are often used as barriers, Blatz et al. (2007) have found that the clay component dominates the soil mixture at suction levels below 30 MPa, whereas sand dominates above 30 MPa. This pattern also translates to swelling, for which Azam (2007) found that mixtures with clay fractions ranging from 10% to 40% (by weight) show a corresponding transition from sand-like behavior to clay-like behavior. The introduction of polymer solutions as stabilizers for barrier materials produces physico-chemical interactions, particularly with the clay component, with manifestations on the texture of the barrier material. The latter aspect has been confirmed by Chen et al. (2000) in their investigation of pore fluid effects on kaolinite, a clay mineral that has been used in barrier mixes. The growth of secondary minerals, which may happen in barrier materials of nonneutral pore fluid chemistry, can induce changes in barrier porosity or even promote cementation as demonstrated experimentally by Inyang et al. (2006).
Shrinkage upon drying is not as pronounced for sandy soils as it is for clays because sandy soils have higher air permeabilities than clays, even when the soil is just starting to dry and there is not much pore water tension yet. Also, as there is not much repulsion between sand particles, unlike between clay particles, wet sand may initially compact to its densest practical state. Sandy loams and loamy sands can undergo some shrinkage upon drying because of their clay content. Clays usually adhere to sand grains and shrink onto them in sand-dominated soils, causing no overall shrinkage. However, if there are clay bridges between the sand grains, there will be overall shrinkage. Fortunately, in clayey barriers for contaminant containment, these clay bridges are usually destroyed during compaction. The amount of overall shrinkage depends on how strong these clay bridges are. Some break easily, whereas others only at high pore water tensions (Mullins and Panayiotopoulos, 1984).
In the presence of water, the clay fraction of barriers is expected to swell and fill internal pore spaces to constrain fluid/contaminant flow. Indeed, Marcial et al. (2006) have investigated and confirmed this healing capacity in a highly compacted high-level radioactive waste barrier. However, drying reverses this desirable phenomenon and leads to cracking of materials that were previously plastic per investigations by Nishimura (2005), Deng and Shen (2006), Mal et al. (2007), and Sadhukhan et al. (2007).
Networking of the cracks that develop due to desiccation have implications on barrier hydraulic conductivity. Essentially, continuous cracks are more conductive than dead-end cracks. For the purpose of confirmation of the effectiveness of methods used to inhibit cracking of barriers, it is desirable to determine the density and depth of cracks before and after treatments. Invariably, this requires the use of image capture and analysis techniques such as those used and described by Liu et al. (2005) and Anderson et al. (1990). Image analysis is used in the present article to assess cracking of clay following treatment with aqueous polymer solutions and application of desiccation stresses.
Cracking Patterns and Damage Parameters
To analyze the effectiveness of aqueous polymer additives with respect to suppressing the cracking of barrier materials, a number of barrier damage parameters have been selected for use in pretreatment and posttreatment comparative analyses in the present article.
Shrinkage ratio and shrinkage limit
Shrinkage ratio (SR) measurements are herein presented to determine the amount of shrinkage that various soil samples go through upon drying. The SR of a soil is the ratio of its volume change to water content change upon complete drying. SR can be calculated through the following equation:
where SR is shrinkage ratio (unitless), Ms is mass of the dry soil sample (g), ρw is density of water (g/cm3), and Vf is final volume of the soil sample (cm3). The shrinkage limit of soil samples is also used as a material characteristic in the present article. Shrinkage limit is the water content below which a soil does not shrink any more upon further drying. It can be calculated using equation (2).
where ws is shrinkage limit of soil sample (weight %), wo is the original water content of the soil sample (weight %), and Vo is the original volume of the soil sample (cm3).
Drying rate
Drying rate (DR) is the difference between the masses of water of a soil sample at two time instants divided by the initial surface area of the soil sample and the time it took for the interval to occur.
where DR is drying rate (mg/[mm2 h]), t1 is a specific time after onset of drying (h), t2 is a specific time after t1 (h),
Crack areal density
It is necessary to estimate the relative area of cracks in an exposed cross-section of a barrier soil. The extent of desiccation cracking of soils can be quantified through the following formula (Miller et al., 1998):
where CAD is crack areal density (%), Ac is surface crack area (L2), and At is total surface area (L2). In the present article, CAD is determined for soil samples, and Ac and At are measured in mm2.
Soils composed of uniformly sized grains dry at a fairly constant rate (Cohen et al., 1990). Soils with small particles dry slower than soils with large particles (Ben-Hur et al., 1985). As it was mentioned earlier, water evaporates from larger pores at first and then from the smaller ones. When menisci begin to form in the smaller pores, capillary tension pressure increases. Thus, less cracking will take place. According to Cohen et al. (1990), the rate of water evaporation cannot predict intensity of crack formation, but it can provide information about drying intensity. For example, for concrete, a drying intensity of 1.0 kg/(m2 h) is considered damaging.
Materials and Experiments
Soil characterization tests
Two types of soils were tested in this research. The first type was pure clay, and the second type was a sand–clay mixture. The clay was purchased from the University of Missouri-Columbia, Source Clay Minerals Repository. The pure clay was Na-montmorillonite from Crook County, Wyoming, with the designation SWy-2. It was chosen because it is usually used in barriers because of its high expansivity (fills pores to reduce barrier permeability to water and contaminants) and high sorptive capacity for contaminants. Further, testing of this pure clay enables its intrinsic reactivities to be established prior to its mixture with other materials that are needed to satisfy barrier functional requirements in the field. Its chemical composition is 62.9% SiO2, 19.6% Al2O3, 0.090% TiO2, 3.35% Fe2O3, 0.32% FeO, 0.006% MnO, 3.05% MgO, 1.68% CaO, 1.53% Na2O, 0.53% K2O, 0.111% F, 0.049% P2O5, and 0.05% S and the rest is loss on ignition. Cation exchange capacity is 76.4 meq/100 g. The principal exchange cations are Na and Ca. The specific surface area is 31.82 ± 0.22 m2/g (source: Clay Minerals Repository, 1999). The second kind of soil that was used was composed of 90% sand and 10% clay. This is more representative of barrier mixes in the field than pure clay. Sand improves the barrier strength but introduces many more uncertainties and variabilities into physico-chemical interactions of the polymer and barrier. The sand was purchased from Holliston Sand and Gravel Company (Slaterville, RI). Information provided by the vendor indicates that it was extracted from natural sand deposit. Precisely, 33.3% of the sand passed US#40 sieve and was retained on the US#60 sieve. Then, 66.7% of the sand passed the US#60 sieve and was retained on the US#100 sieve. The majority of the particles were round to subangular quartz as revealed through microscopic studies at 10–20× magnification. The sand also contained a small amount of pyrite. The clay that was mixed with the sand was the aforementioned clay.
Shrinkage tests
Shrinkage tests were performed for both soil samples mixed with aqueous polymer solutions at concentrations of 0.1 and 3 g/L. Polymer solutions were prepared using the protocols described in Part I of this article (Inyang et al., 2009). After the soils were mixed either with polymer solutions or with water or acetic acid/ethanolamine solution, they were left to hydrate for 26 h. After hydration and placement of samples into the shrinkage dishes, the samples were left to air dry for 26 h. After air drying, the samples were placed into an oven. The ASTM standards specify an oven temperature of about 110°C for 10+ hours for shrinkage tests. Prior to the shrinkage tests, dry polymer powders of each kind were placed into the oven to see how their textures would change with heat. After 22 h, all white polymer powders turned slightly yellow and the slightly yellow chitosan (CHT) flakes turned darker yellow. When the same polymer powders were placed in the oven at 75°C, even after 3 days, the polymer powders remained white, just like the control samples that were left at room temperature. Also, the CHT flakes kept their light yellow color at this temperature, even after 3 days. Therefore, the oven temperature of 75°C was chosen to minimize the cracking of the clay due to forceful evaporation of moisture through flow channels in the clay. The samples were kept in the oven for 54 h to ensure the evaporation of all moisture.
For the sand–clay soils, the mercury method of shrinkage testing was used in accordance with ASTM D 427 (1998), with the exception of a different oven temperatures as mentioned previously. For pure clay, the shrinkage test was done similarly, but the final volume was measured differently. Clay samples shrank to 1/5 or 1/6 of their original moist size upon drying, which makes sense, because for this type of clay, the liquid limit is 670% (Daniels, 1997). The diameters of the shrunken samples were all smaller than the distance between prongs on the glass plate used for the submersion of the dried soil samples into the mercury. Therefore, the prongs on the glass plate were not able to submerge the clay samples into the mercury without trapping air bubbles between the plate and the sample.
To solve the problem of excessively shrinking clays, the final volumes of dried clay samples were found through the use of an alternate method. Sibley and Williams (1989) found final volumes of brown, highly plastic clays after being dried using toluene as the displacement fluid with an error of 0.09%. In the present study, mineral oil was used to provide the final volume of the soil sample. The density of the oil was determined by weighing a specific volume of oil before the sample was submerged into the mineral oil. The mass of soil divided by the density of the oil gave the final volume of the soil. The balance that was used for the weight measurements was sensitive to 0.0001 g. While these tests were done, the temperature of the oil was maintained between 22°C and 24°C to prevent temperature-induced volumetric changes in the oil.
DR tests
Drying tests were performed for sand–clay soils only. The specific polymers and polymer concentrations that were tested are presented in Table 1. First, soil samples were mixed with water or polymer solution and were left to hydrate for 1 day. The moisture content was slightly above the liquid limit of the sand–clay soil. Next, these samples were placed into containers that had a circular area of 52 mm in diameter. The height of these containers was 6 mm. These containers were weighed prior to and after being filled with the soil on a balance that was sensitive to 0.0001 g. The samples were placed into the containers in three layers. After placement of each layer of soil, the container was tapped, so the soil would spread and all the air bubbles would leave. After placement of the last layer, the excess soil was removed with a spatula so that the soil surface would be flattened smooth. The soil samples were placed into the constant temperature and humidity chamber that had temperature set at 25°C and 30% humidity. Initially, samples were taken out at half-hour intervals and weighed to track rapid initial moisture loss. After the change in weight of the samples became <0.5 g between measurements, the samples were taken out to be weighed at 1-h intervals. After even this interval was not enough to cause a decrease in weight of >0.5 g, the samples were weighed at 2-h intervals, then 4 h, and finally, the samples were left to dry overnight. The next day, the samples were weighed a couple of times until the change in weight became <0.001 g.
SH, shrinkage; D/I, drying and imaging tests. Other notes were explained in Table 1 of Part I of this article (Inyang et al., 2009).
CMC, carboxymethyl cellulose; CHT, chitosan; PVA, polyvinyl alcohol; PEO, polyethylene oxide.
Imaging and crack observations
After the samples were completely dried, their exposed cross-sectional surface areas were measured. They were then placed under an optical microscope purchased from Excel Technologies, Inc. (Enfield, CT), which (with the help of the softwares Image Pro Plus Version 3.0.00.00 for Windows 95/NT from Media Cybernetics and Corel Photo-Paint™ Version 6.00.181 from Corel Corporation) measured the surface area of the cracks that resulted from the drying process. This area divided by the total area of the dry samples gave the CAD as described by equation (4).
Results and Analyses
Shrinkage test results
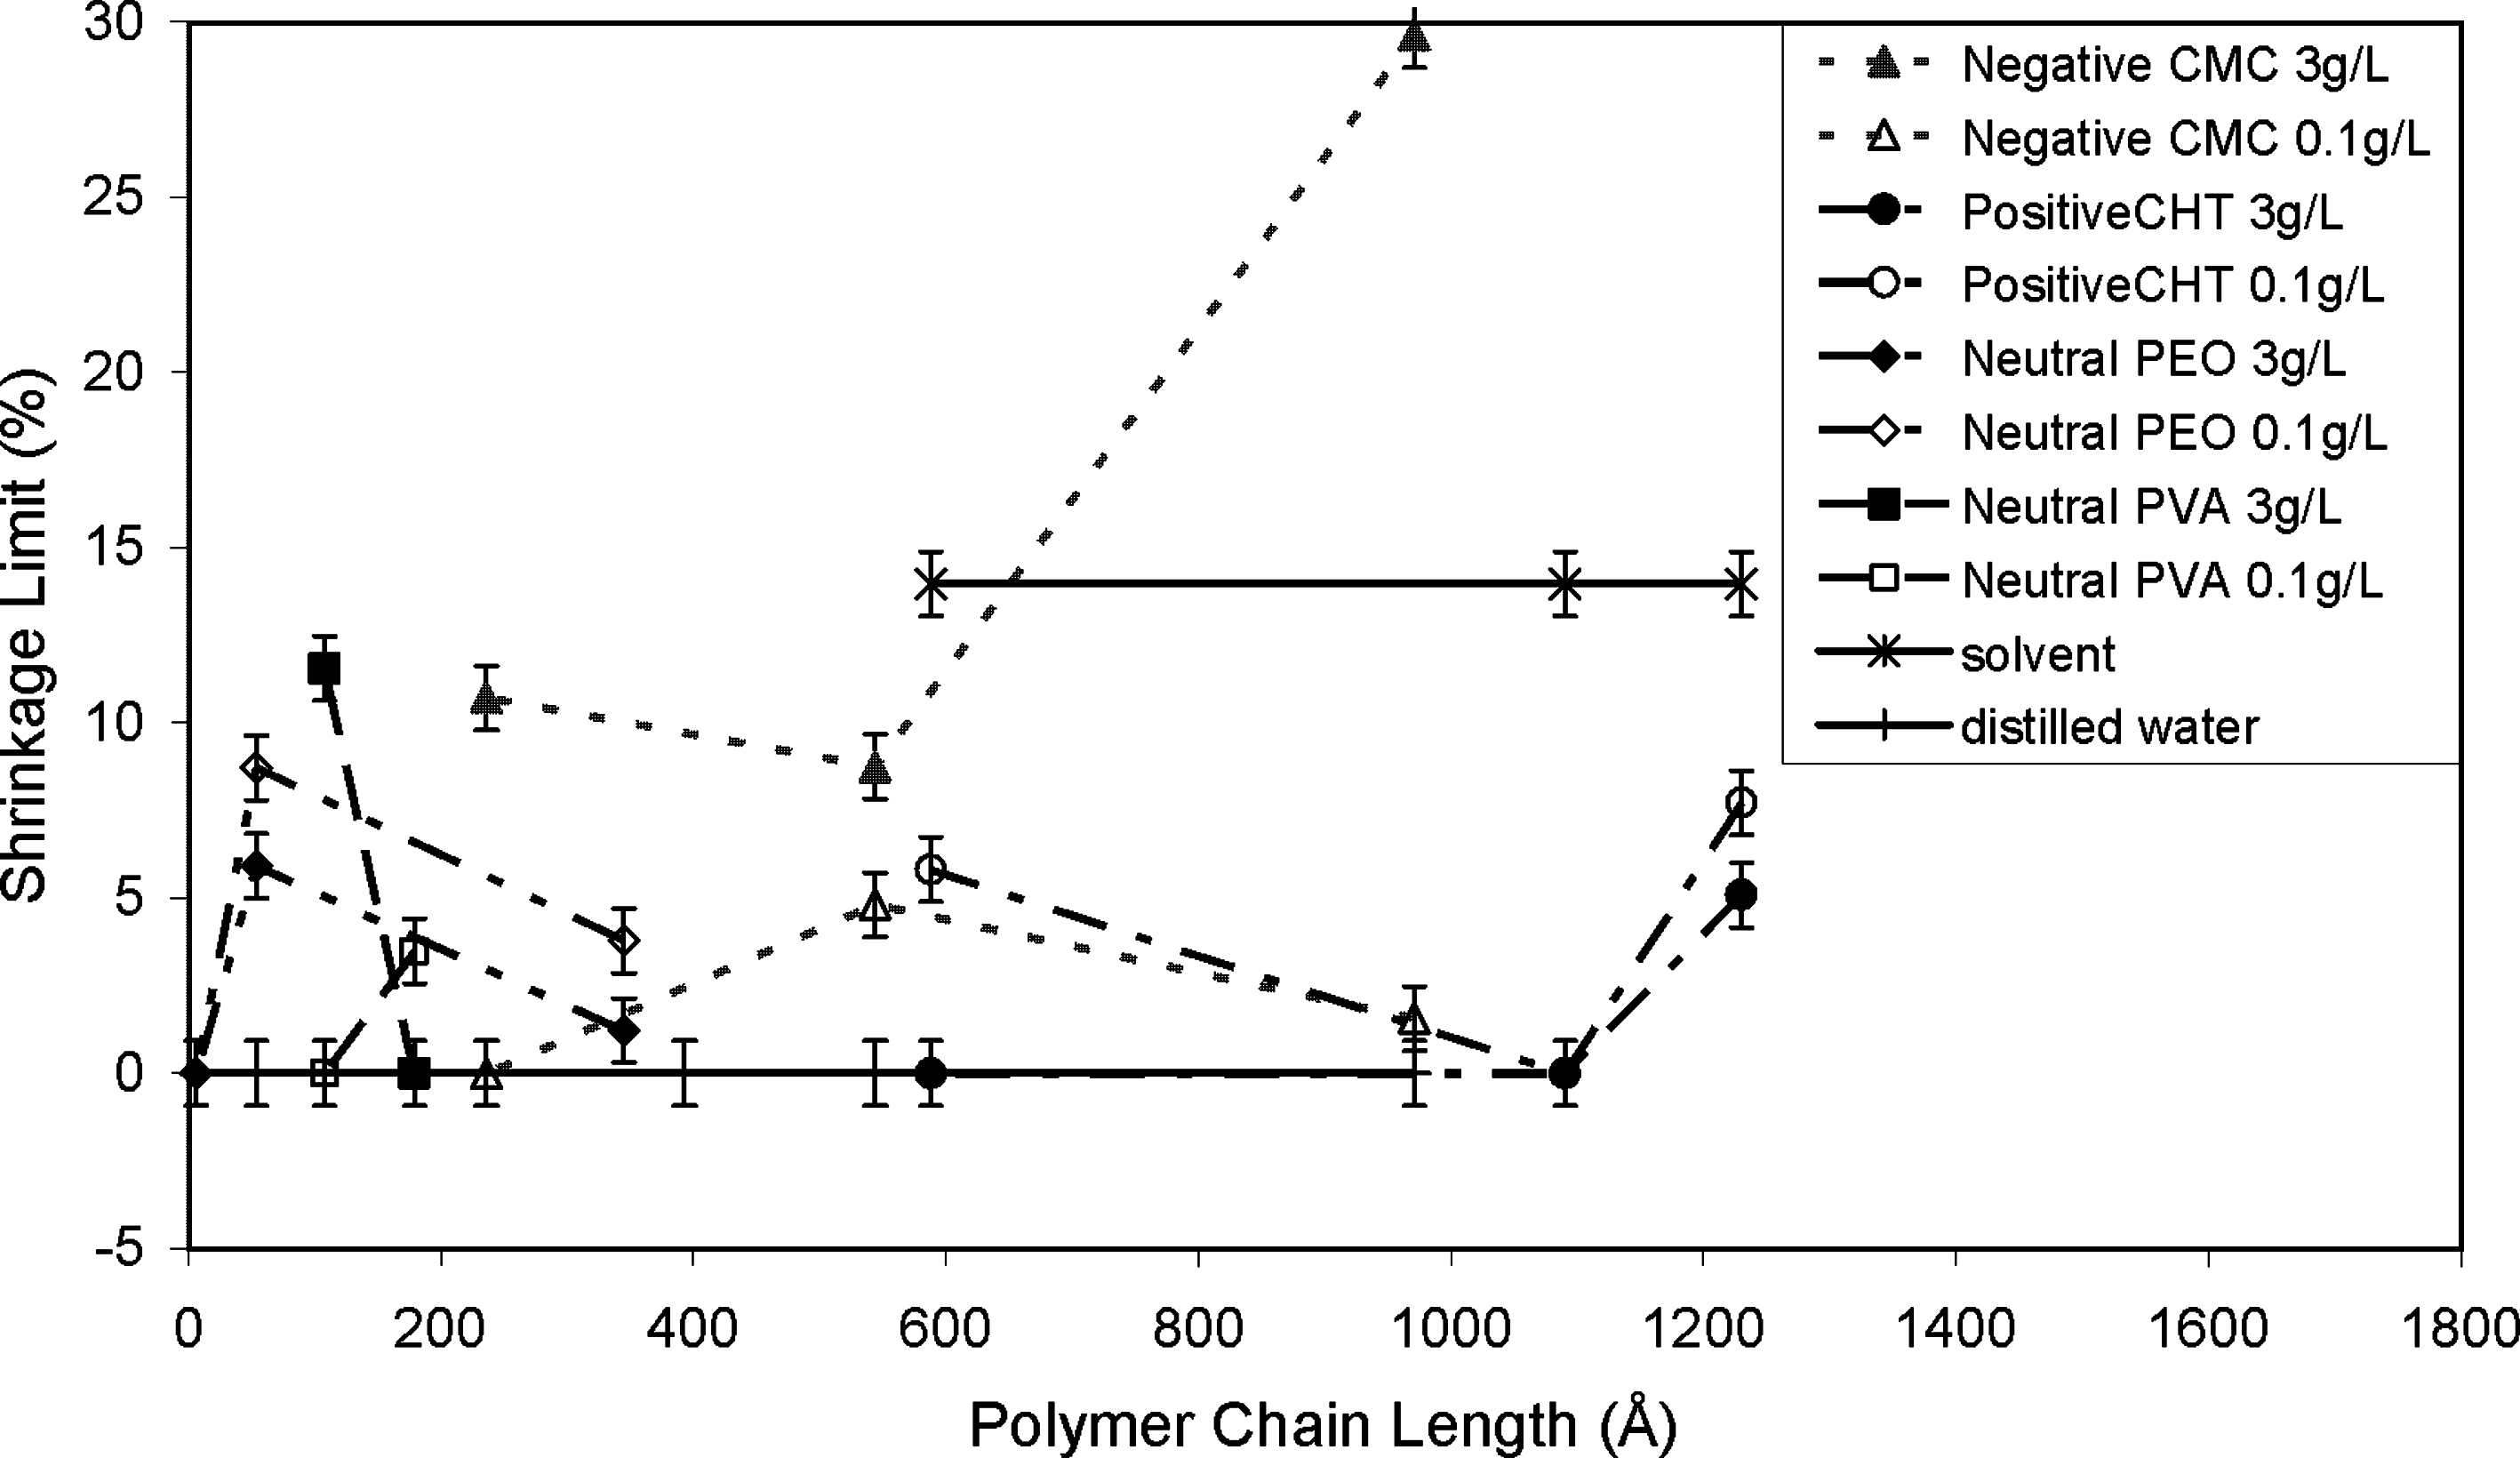
Table 2 contains the results of SR and shrinkage limit. Figures 1–4 contain plots of SR and shrinkage limit versus polymer chain length for both Na-montmorillonite and Na-montmorillonite/sand soils mixed with polymer solutions. The two horizontal lines on each figure are for the samples mixed with distilled water and solvent, which is a solution containing acetic acid and ethanolamine as described in Part I of this article (Inyang et al., 2009). The most significant behavior is that of carboxymethyl cellulose (CMC). It can be seen from Fig. 1 that when pure clay samples are mixed with 3 g/L CMC solutions, SR clearly decreases as CMC chain length increases. The same pattern is observed for sand–clay mixtures when they are mixed with 0.1 g/L CMC solutions (Fig. 2). The behavior of CMC can be seen in Fig. 3 as well: Na-montmorillonite is a highly plastic clay, which collapses upon moisture loss, theoretically resulting in a shrinkage limit value of 0%. Most of the shrinkage limits of the Na-montmorillonite samples were <5%. If a sample has a shrinkage limit of <0%, it receives a value of 0% (Table 2). A shrinkage limit value of 29.6% for a clay sample mixed with 3 g/L CMC3 solution indicates that the sample has a fundamentally different texture due to the addition of the polymer. This value is twice the amount of the second highest shrinkage limit value of 14% for Na-montmorillonite mixed with the solvent. The high shrinkage limit and low SR could be due to the repelling action between negatively charged polymer and the negatively charged surface of clay particles. The ability of CMC to reduce shrinkage of Na-montmorillonite is enhanced at higher molecular weights.
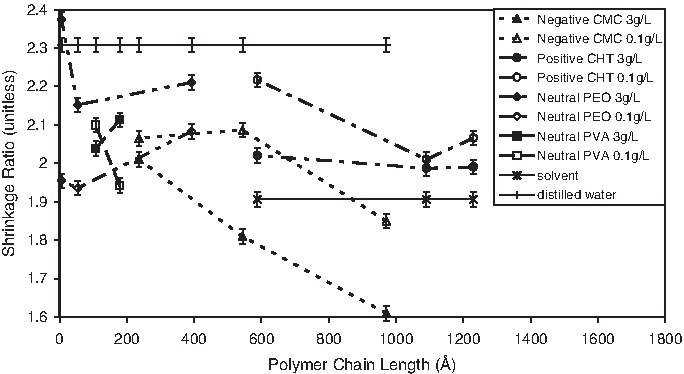
Shrinkage ratio of Na-montmorillonite mixed with polymer solutions as a function of polymer chain length and polymer charge.

Shrinkage ratio of 90:10 mix of sand:Na-montmorillonite mixed with polymer solutions as a function of polymer chain length and polymer charge.
Shrinkage limit of Na-montmorillonite mixed with polymer solutions as a function of polymer chain length and polymer charge.
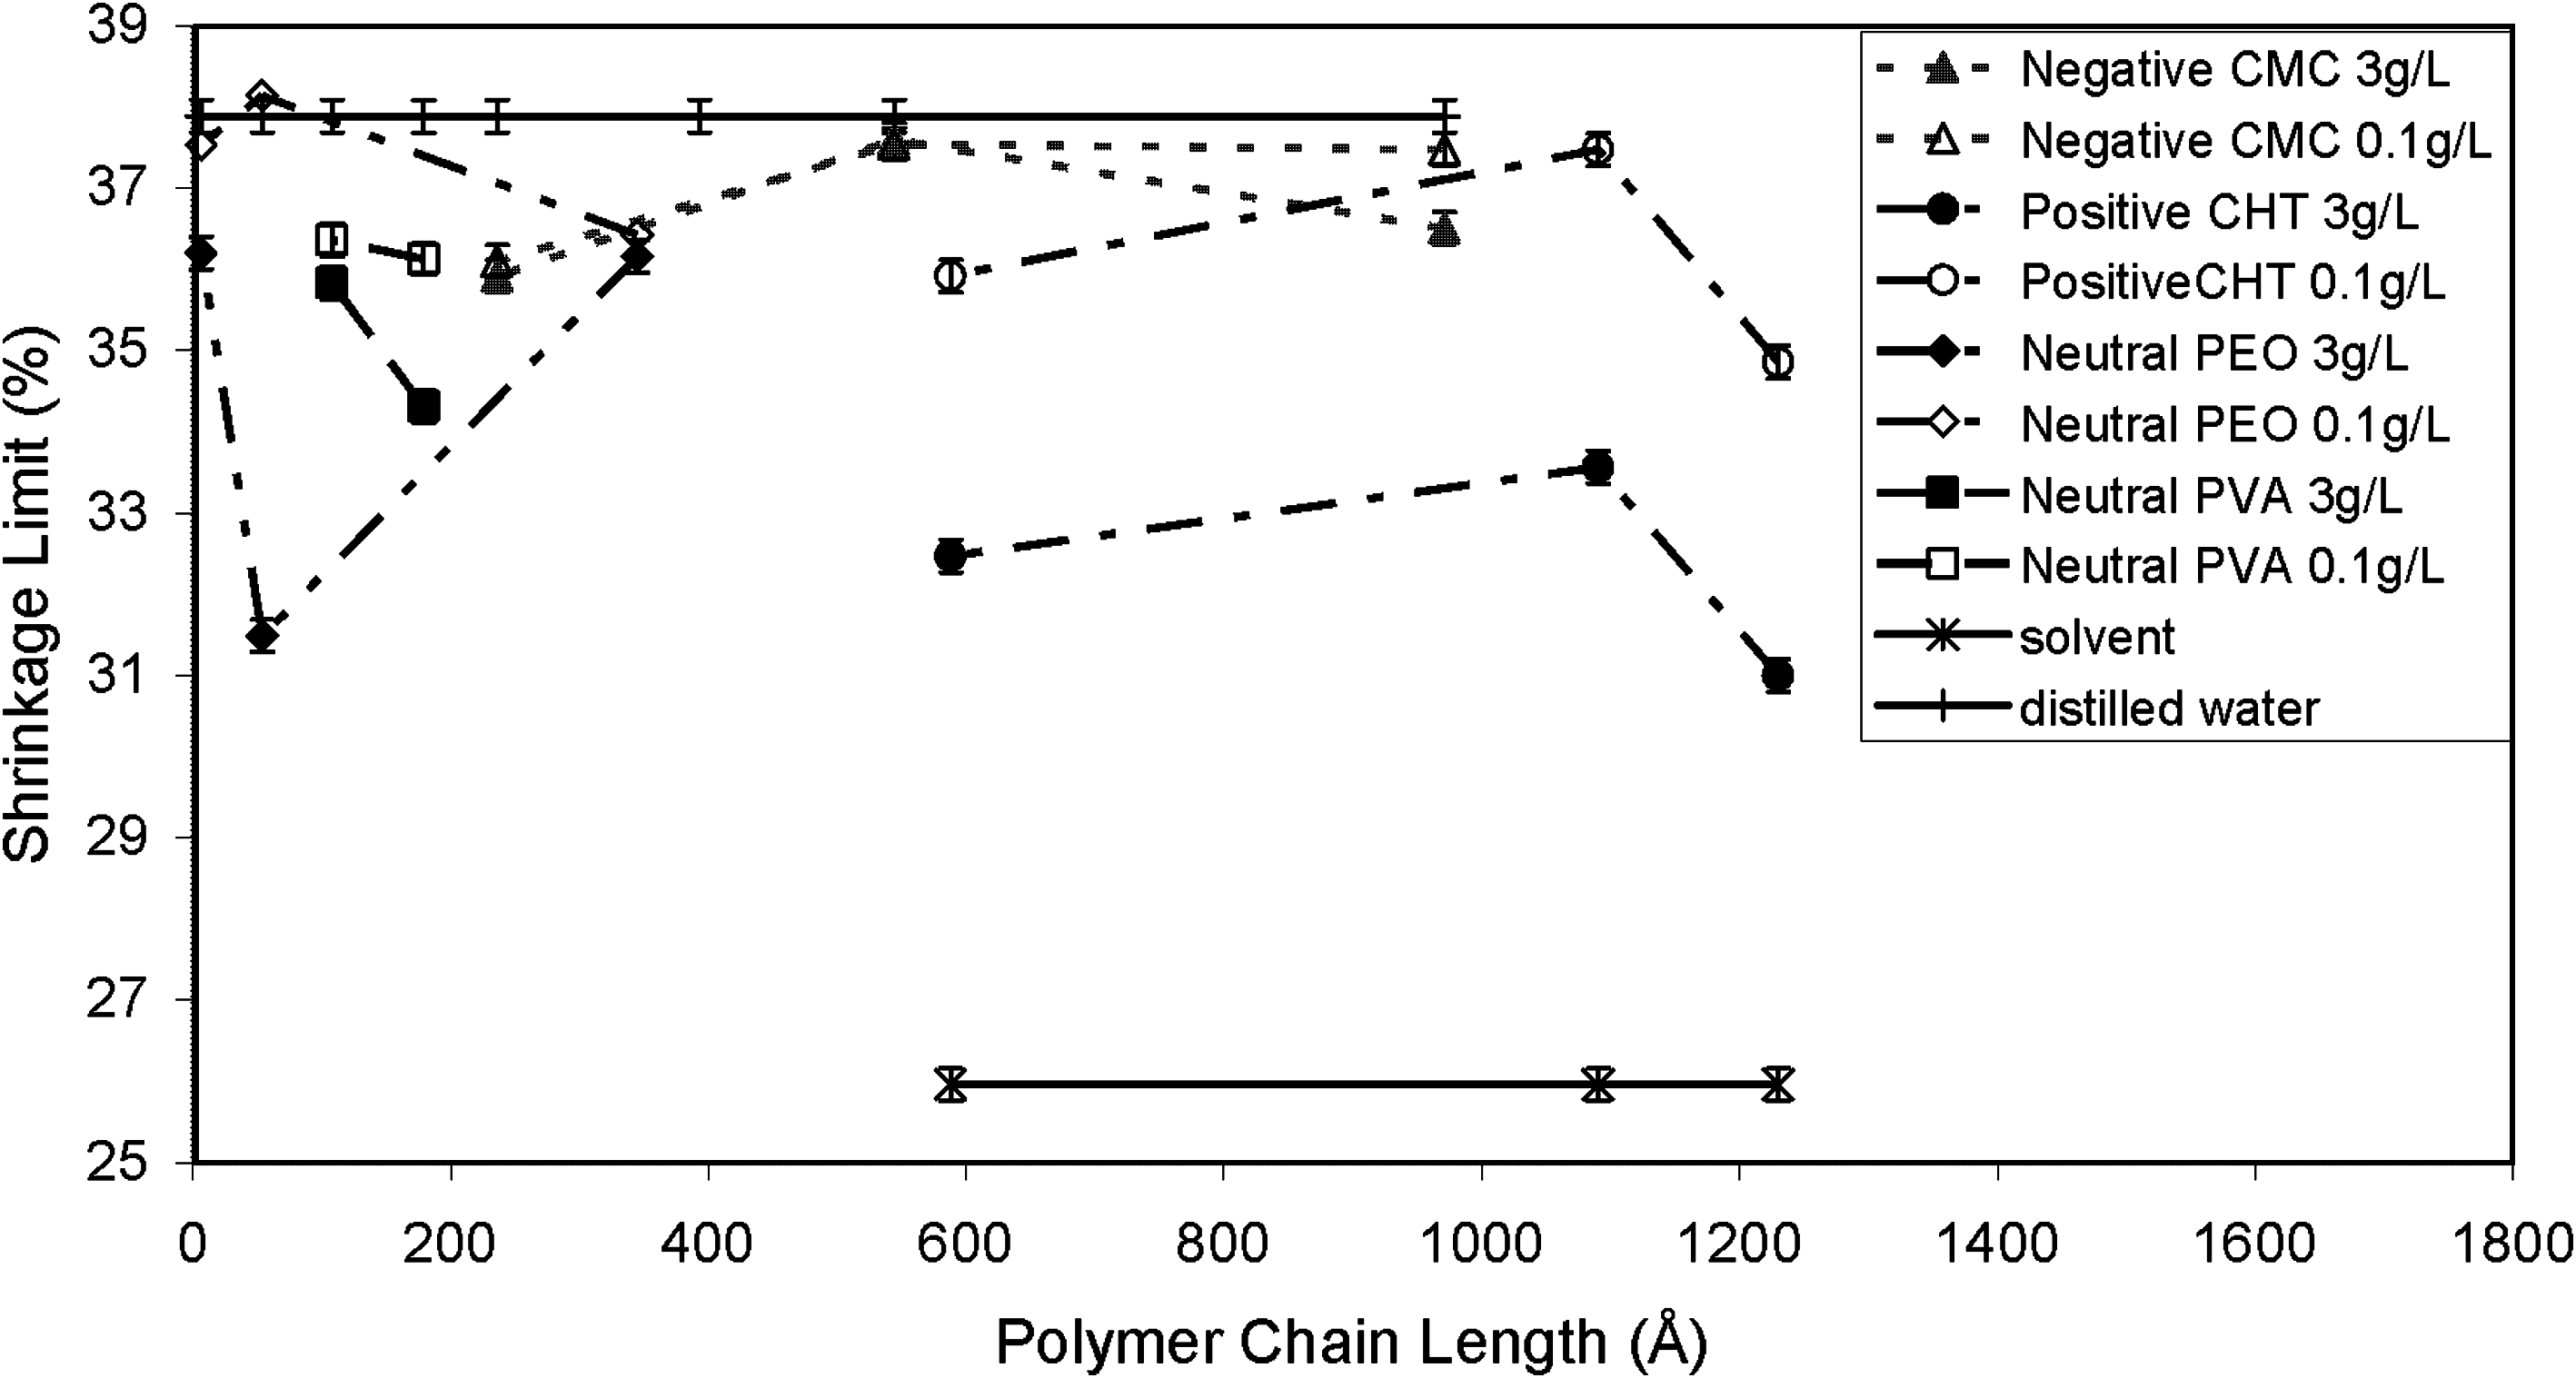
Shrinkage limit of 90:10 mix of sand:Na-montmorillonite mixed with polymer solutions as a function of polymer chain length and polymer charge.
M, Na-montmorillonite; S, sand.
When molecular weight and, therefore, chain length of CHT increase, it initially improves the shrinkage behavior of both pure clay and sandy–clay samples, although it is harder to tell with pure montmorillonite soils because of the larger error bars in Figs. 1 and 2. SR of both soils decreased and shrinkage limit of sand–clay samples increased (Fig. 4) The optimum SR and shrinkage limit of these soils is reached when they are mixed with CHT2 (medium-molecular-weight CHT). Upon further increase in chain length, SR increases and shrinkage limit decreases. This behavior is true for both the 0.1 and 3 g/L concentrations. As only three CHTs of different molecular weights and only one sand:Na-montmorillonite ratio were investigated in this research, it is observed that there is an optimum molecular weight of CHT for which shrinkage characteristics of 90:10 mixtures of sand: Na-montmorillonite are improved.
Another observation worth mentioning about CHTs is that shrinkage characteristics of 90:10 mixtures of sand: Na-montmorillonite at all molecular weights were improved more by the low (0.1 g/L)-concentration CHT solution than by the high-concentration (3 g/L) CHT solutions. The shrinkage limit was higher and SR was lower for sand–montmorillonite mixtures when they were mixed with CHT solutions at 0.1 g/L, than when they were mixed with 3 g/L solutions. Shrinkage limit of pure montmorillonite mixed with 0.1 g/L was higher for all molecular weights than when it was mixed with 3 g/L. However, pure clay samples mixed with low-concentration CHT solutions shrank less than clay samples mixed with high-concentration solutions. These observations indicate that CHT develops completely different mechanisms of shrinkage inhibition at different concentrations.
Polyethylene oxide (PEO) solutions make Na-montmorillonite behave similar to CHT solutions. When pure clay samples are mixed with PEO solutions at either 0.1 or 3 g/L concentration, shrinkage characteristics first improve with polymer chain length; SR decreases; and shrinkage limit increases. Maximum performance is reached at a chain length of 54 Å, and then Na-montmorillonite samples shrink more upon further increase in PEO chain length. When PEO solution is mixed with 90:10 mixture of sand:Na-montmorillonite, the same pattern is observed only when the concentration of the polymer solution is 0.1 g/L. There is more improvement in the shrinkage characteristics of sand–clay soils mixed with low PEO solution concentration of 0.1 g/L. This pattern was also observed with CHT solutions.
In the case of polyvinyl alcohol (PVA), there is hardly any correlation between polymer chain length and shrinkage limit or SR because only two different molecular weights were investigated. The PVA data points do not line up with the PEO data points even though both polymers are neutral. The absence of polymer charge implies that polymer molecular structure is possibly the significant factor with respect to textural manifestation of the clay–polymer interaction. As mentioned in the introduction, the possible bonding mechanism between neutral polymers and clays are dipole–dipole, charge–dipole, and hydrogen bond. As PVA has an OH group (see Fig. 1 in Part I, Inyang et al., 2009), hydrogen bonding is possible between clays and polymers, as well as the other two types of bonds. PEO does not have an OH group, and therefore, only dipole–dipole and charge–dipole bonds are possible between clay and PEO. Because of these different polymer–clay bonding types, different mechanisms of shrinkage inhibition are developed by each polymer. However, almost all polymer-amended pure clay samples have better shrinkage characteristics (low SR and high shrinkage limit) than clay samples mixed with distilled water. For sand–clay soils, the opposite is true. CHTs are exceptions to these observations: CHT-amended pure clay samples have worse shrinkage characteristics compared to soils mixed with the acetic acid/ethanolamine solvent but sand–clay soils had better results when mixed with CHT.
DR test results
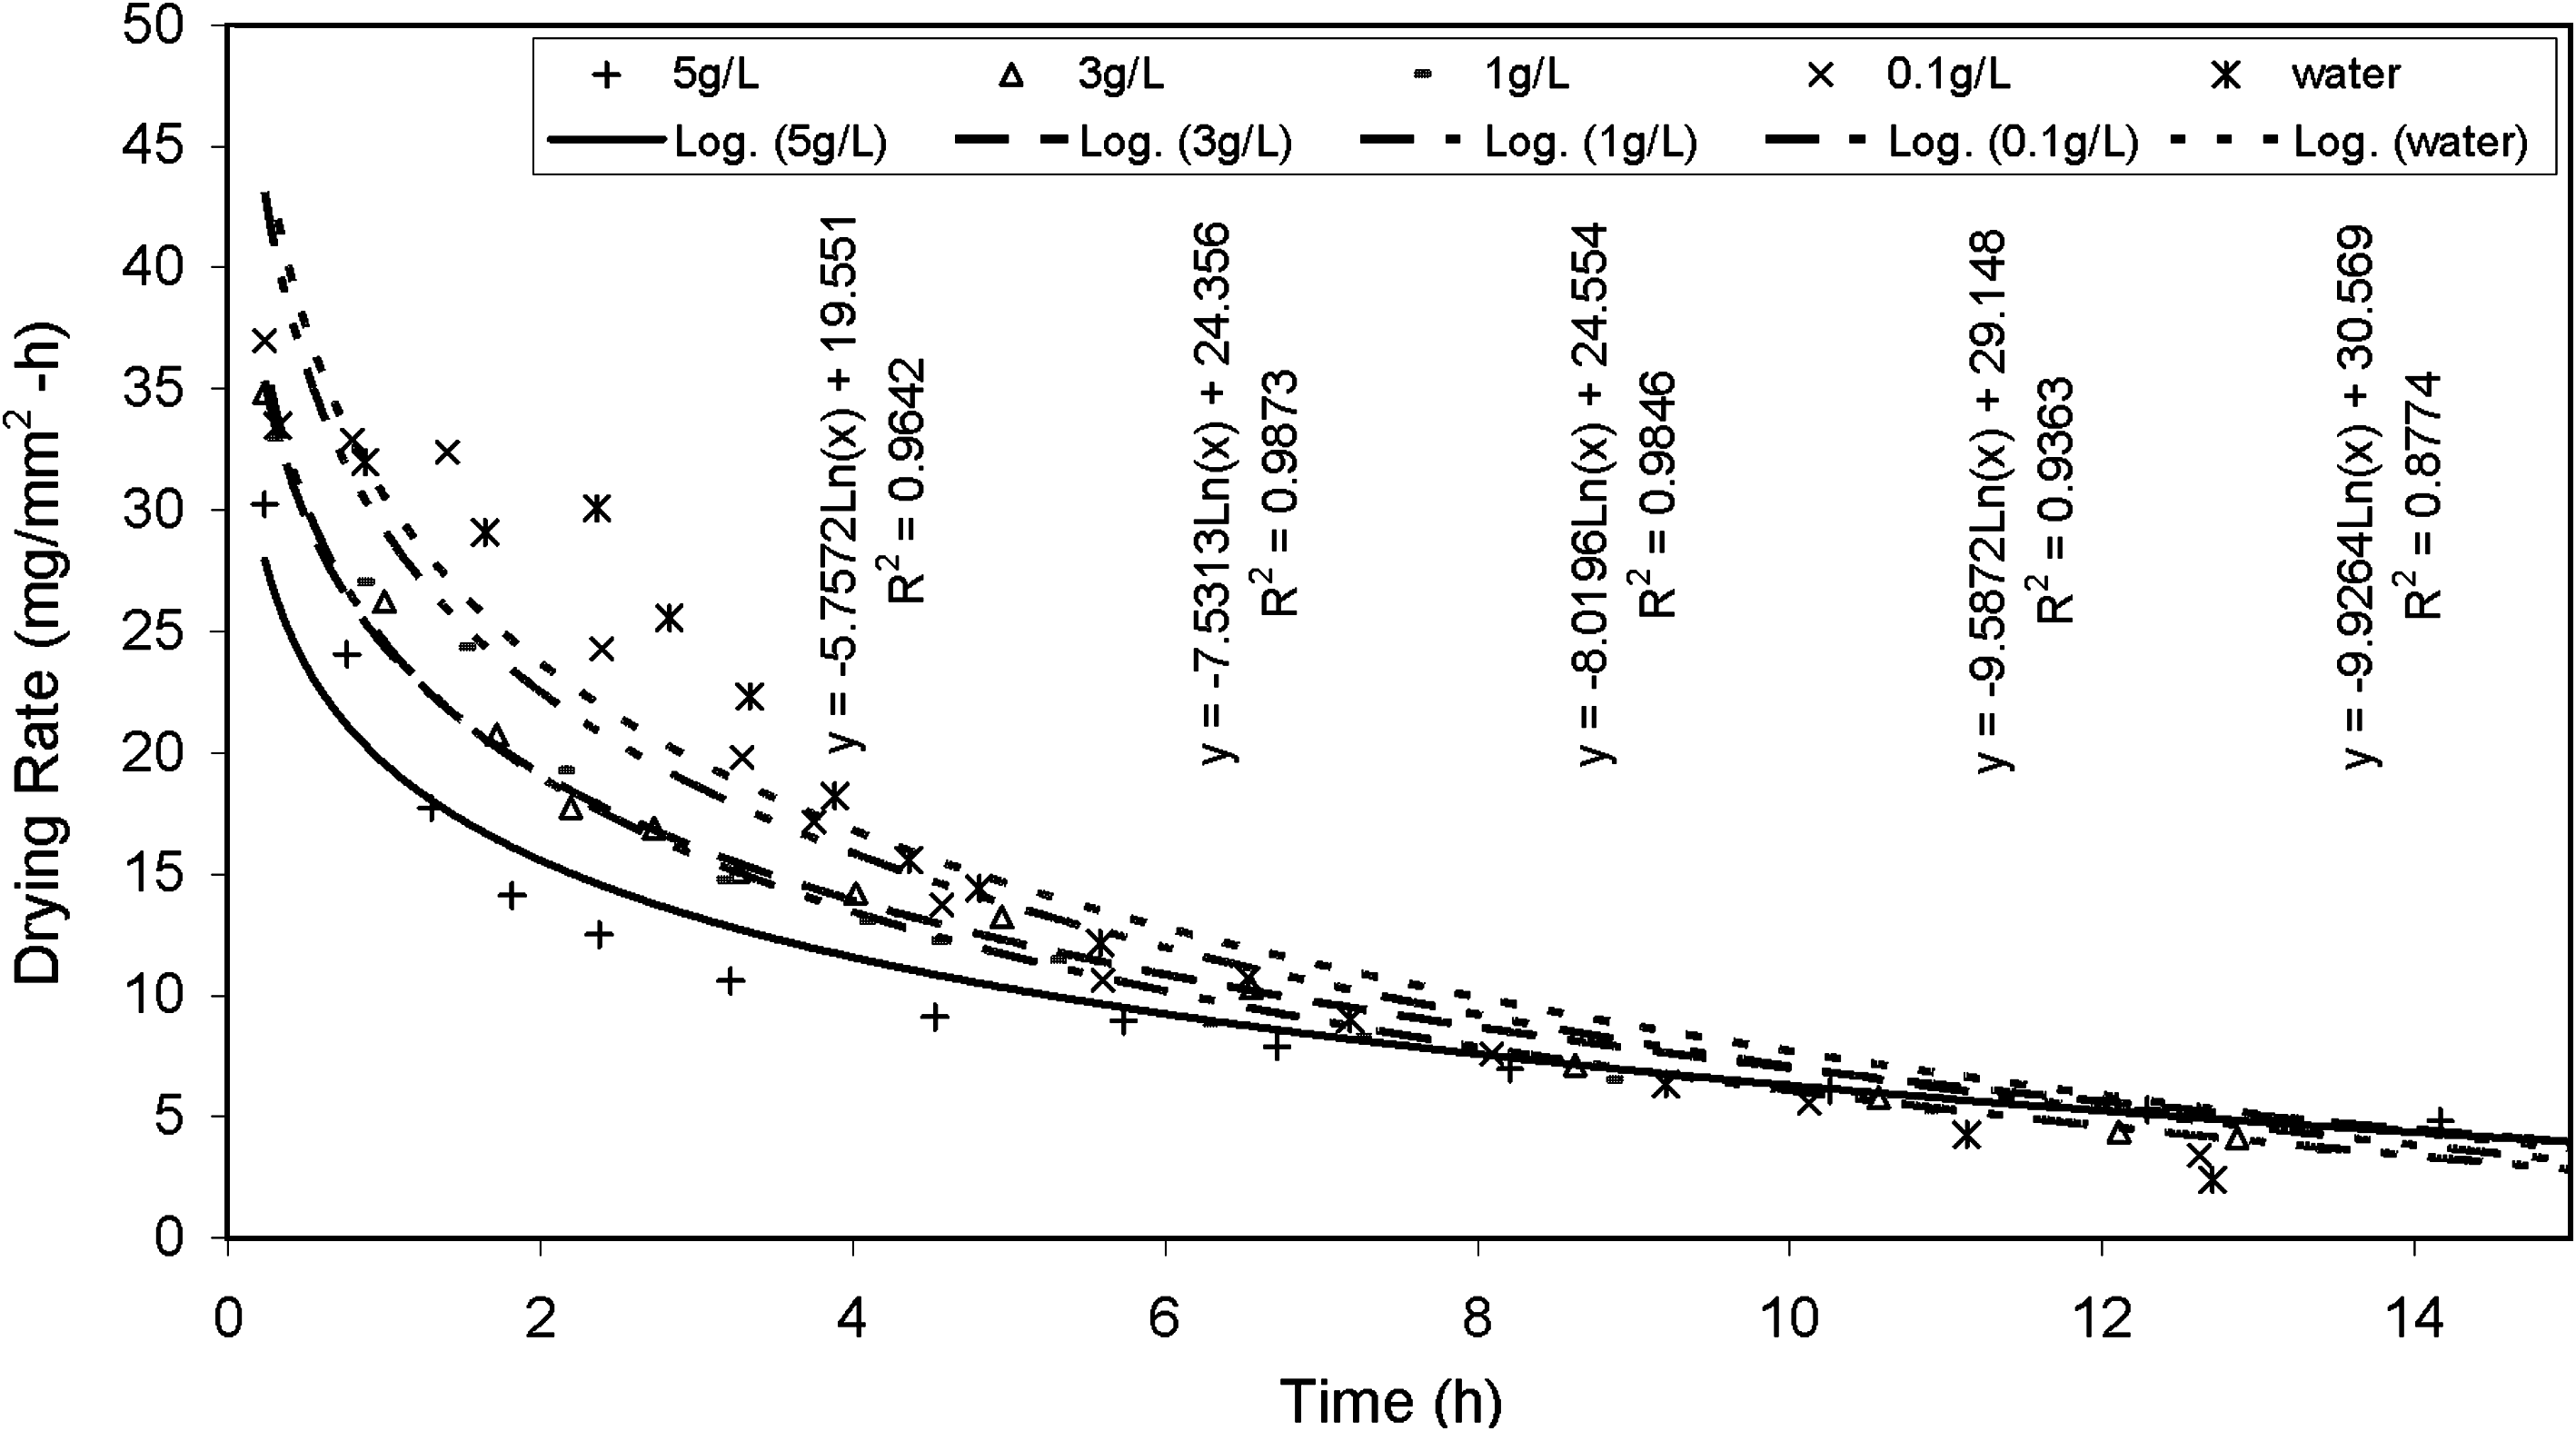
Figure 5 shows the results of the DR tests. DR is the difference between masses of water of a soil sample at two time instants divided by the initial surface area of the soil sample and the time it took for the interval to take place. The X-axis on these charts represents time and starts at zero, the time that the sample was placed into the chamber. As shown on Fig. 5, the DR curve is logarithmic for all polymer-amended soils. All curves have a high coefficient of correlation, R2. The larger the coefficients of the “ln” term in the equations that describe these relationships are (less negative), the faster is the decrease in DR. Regardless of the type of additive mixed in with the soil (polymer solution, water, or solvent), after 10 h of drying, DR of all samples converged. On Fig. 6, which is a plot of DR versus time for all of the CMC3-amended soils, the coefficients of the “ln” term seem to be a function of the concentration of polymer. Addition of CMC decreased the DR quickly. The more the polymers are added, the longer it takes for the soil to dry.

Drying rate as a function time for desiccating 90:10 mix of sand:Na-montmorillonite mixed various polymer solutions having 5 g/L concentrations.
Drying rate as a function of time for 90:10 mix of sand:Na-montmorillonite mixed with various concentrations of carboxymethyl cellulose3 solutions.
Observed cracking patterns
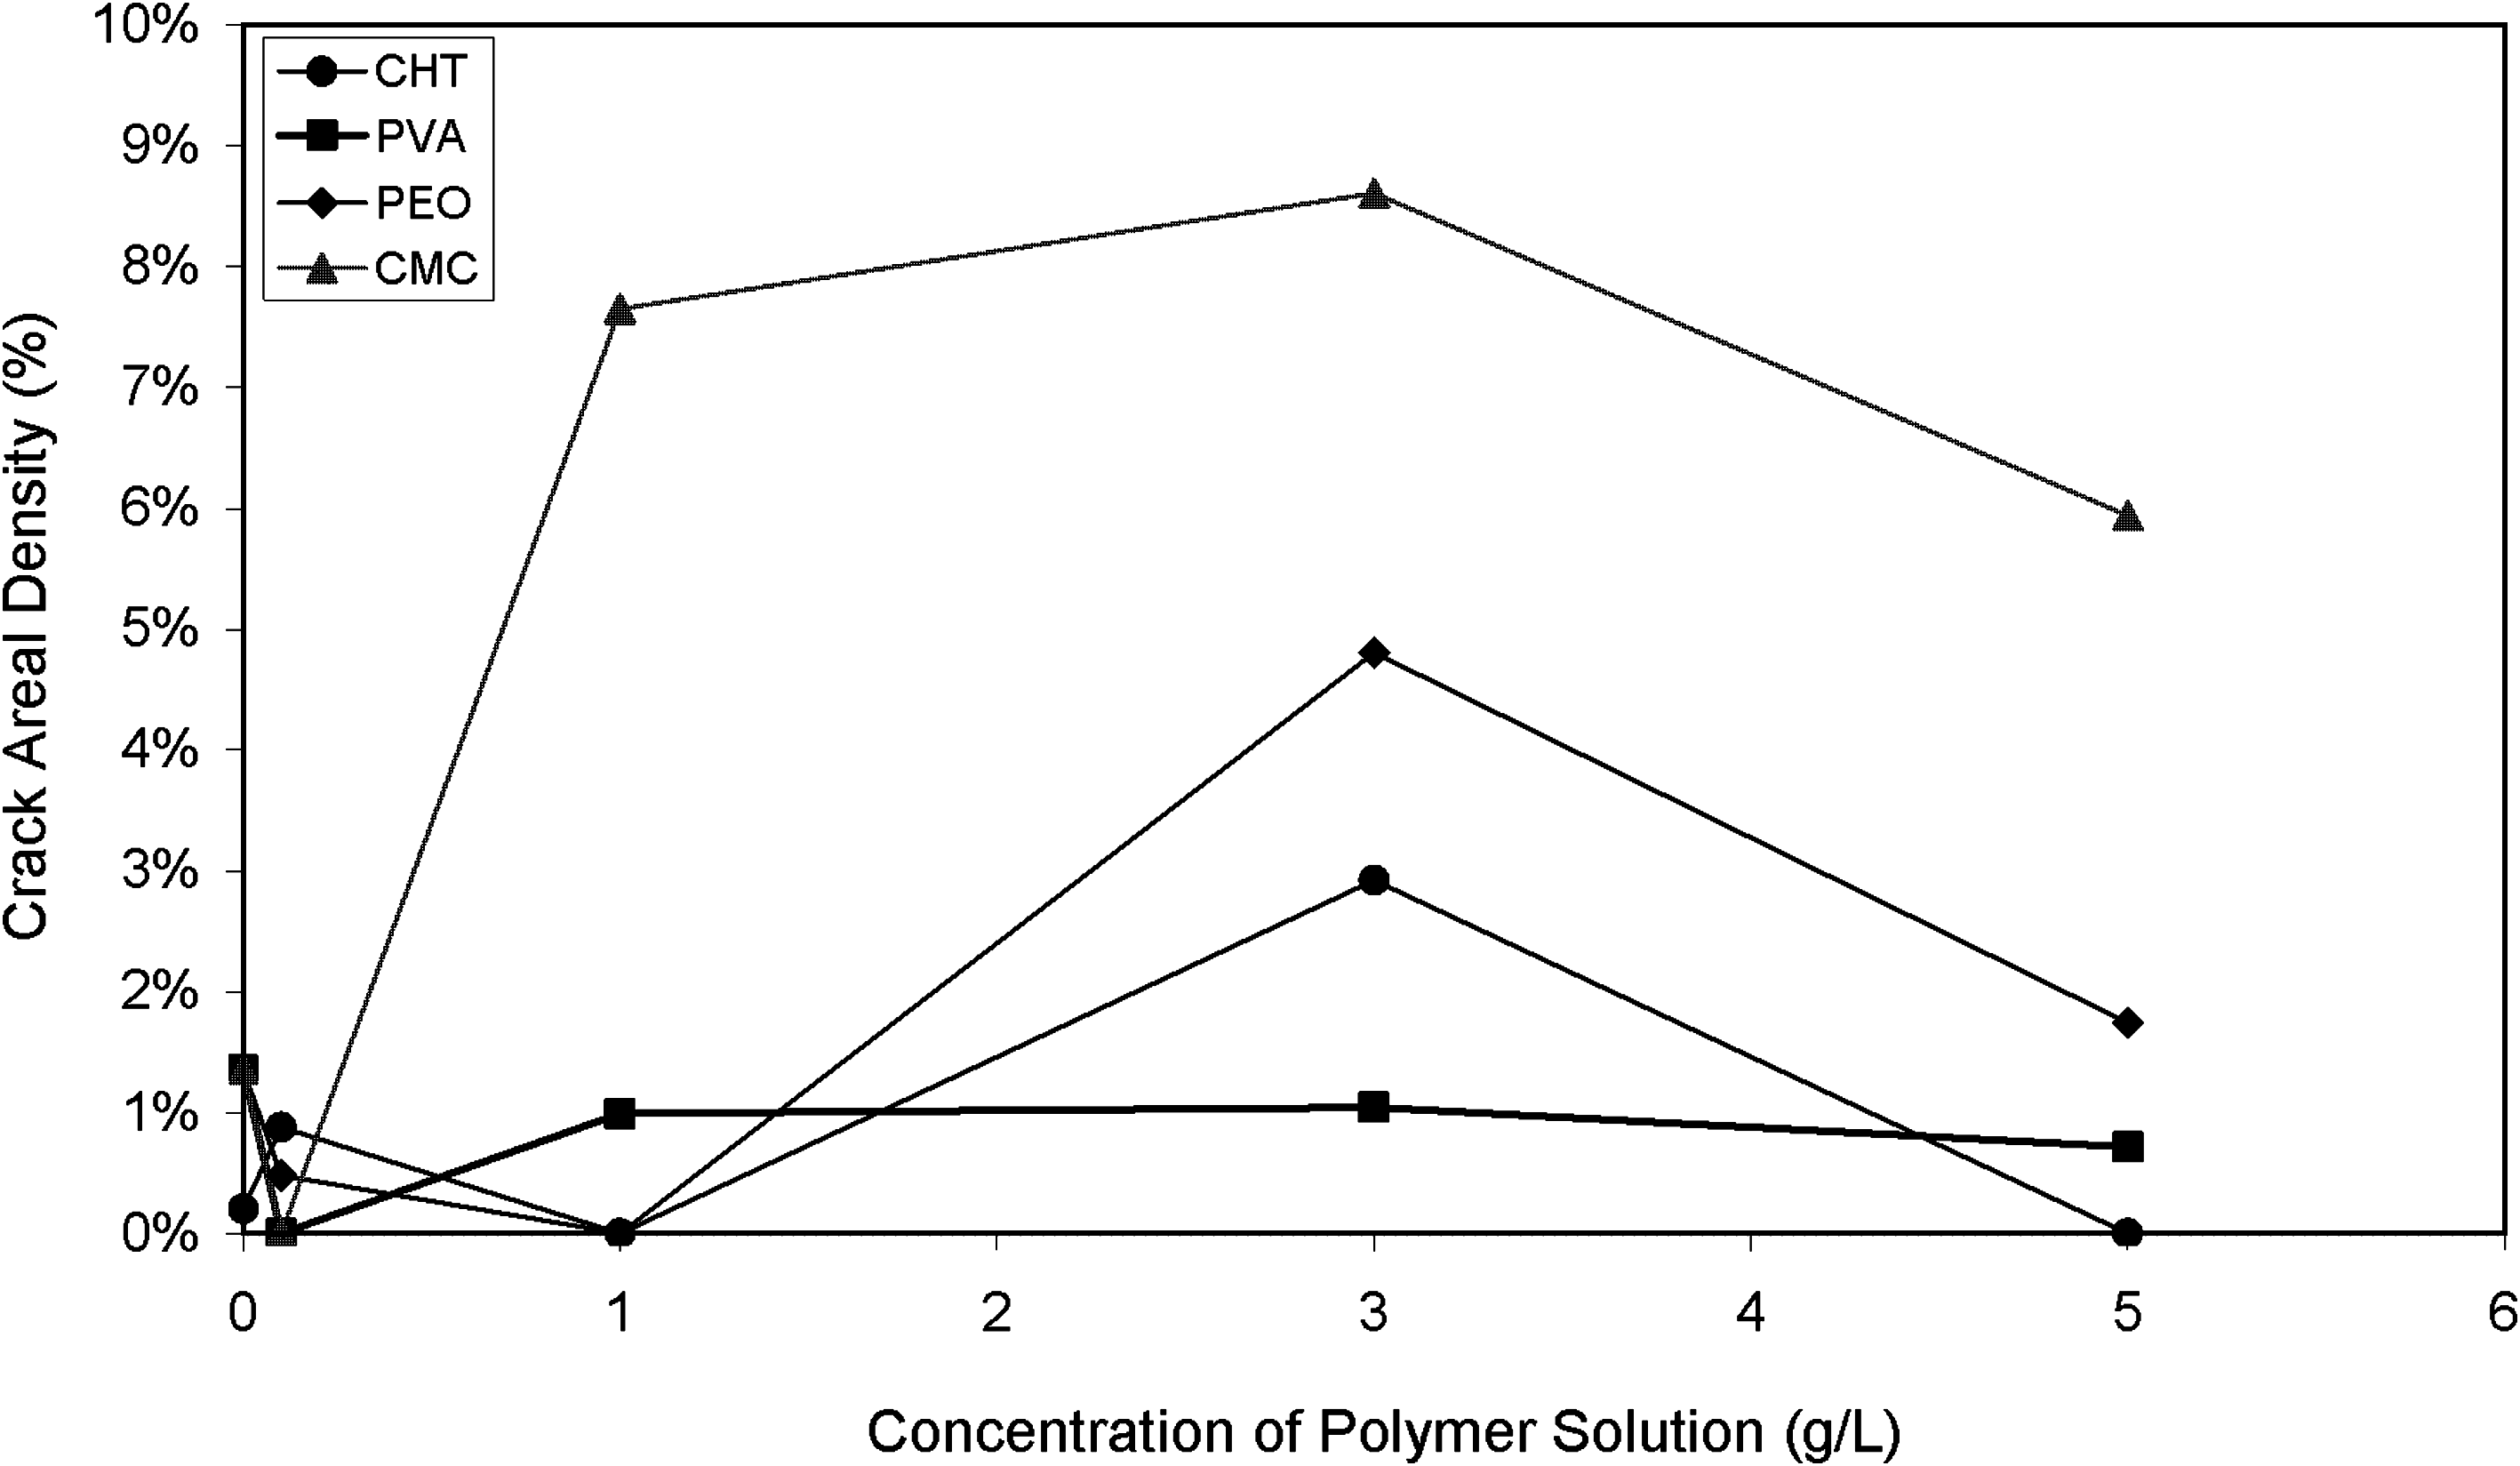
Figure 7 is a plot of CAD versus concentration. Figure 8 shows the images taken of the desiccated samples so that their cracked surface areas could be calculated for the purpose of determining the CAD of each sample. The CAD values range from 0% to 8.61% for CMC3 at 3 g/L concentration. Miller et al. (1998) conducted the experiment with silty clay, which was made up of 55% clay, mostly illite. They found maximum crack intensity factor of 5.5% (crack intensity factor was calculated in the same way as CAD is calculated in this article). Only the polymer PVA1 was able to reduce CAD well below this value (to 1% or less) at all concentrations. Therefore, only this polymer can be considered as a crack inhibitor. PVA1's ability to control cracking effectively could be attributed to its strong bonding (hydrogen bonding) to clay surface as well as to its optimum chain length. The length of this polymer is 108 Å, which is slightly less than the basal spacing of Na-montmorillonite as estimated by Theng (1982). He found that PVAs of this length adsorb well onto Na-montmorillonite.
Crack areal density of 90:10 mix of sand:Na-montmorillonite mixed with various polymer solutions as a function of polymer concentration.
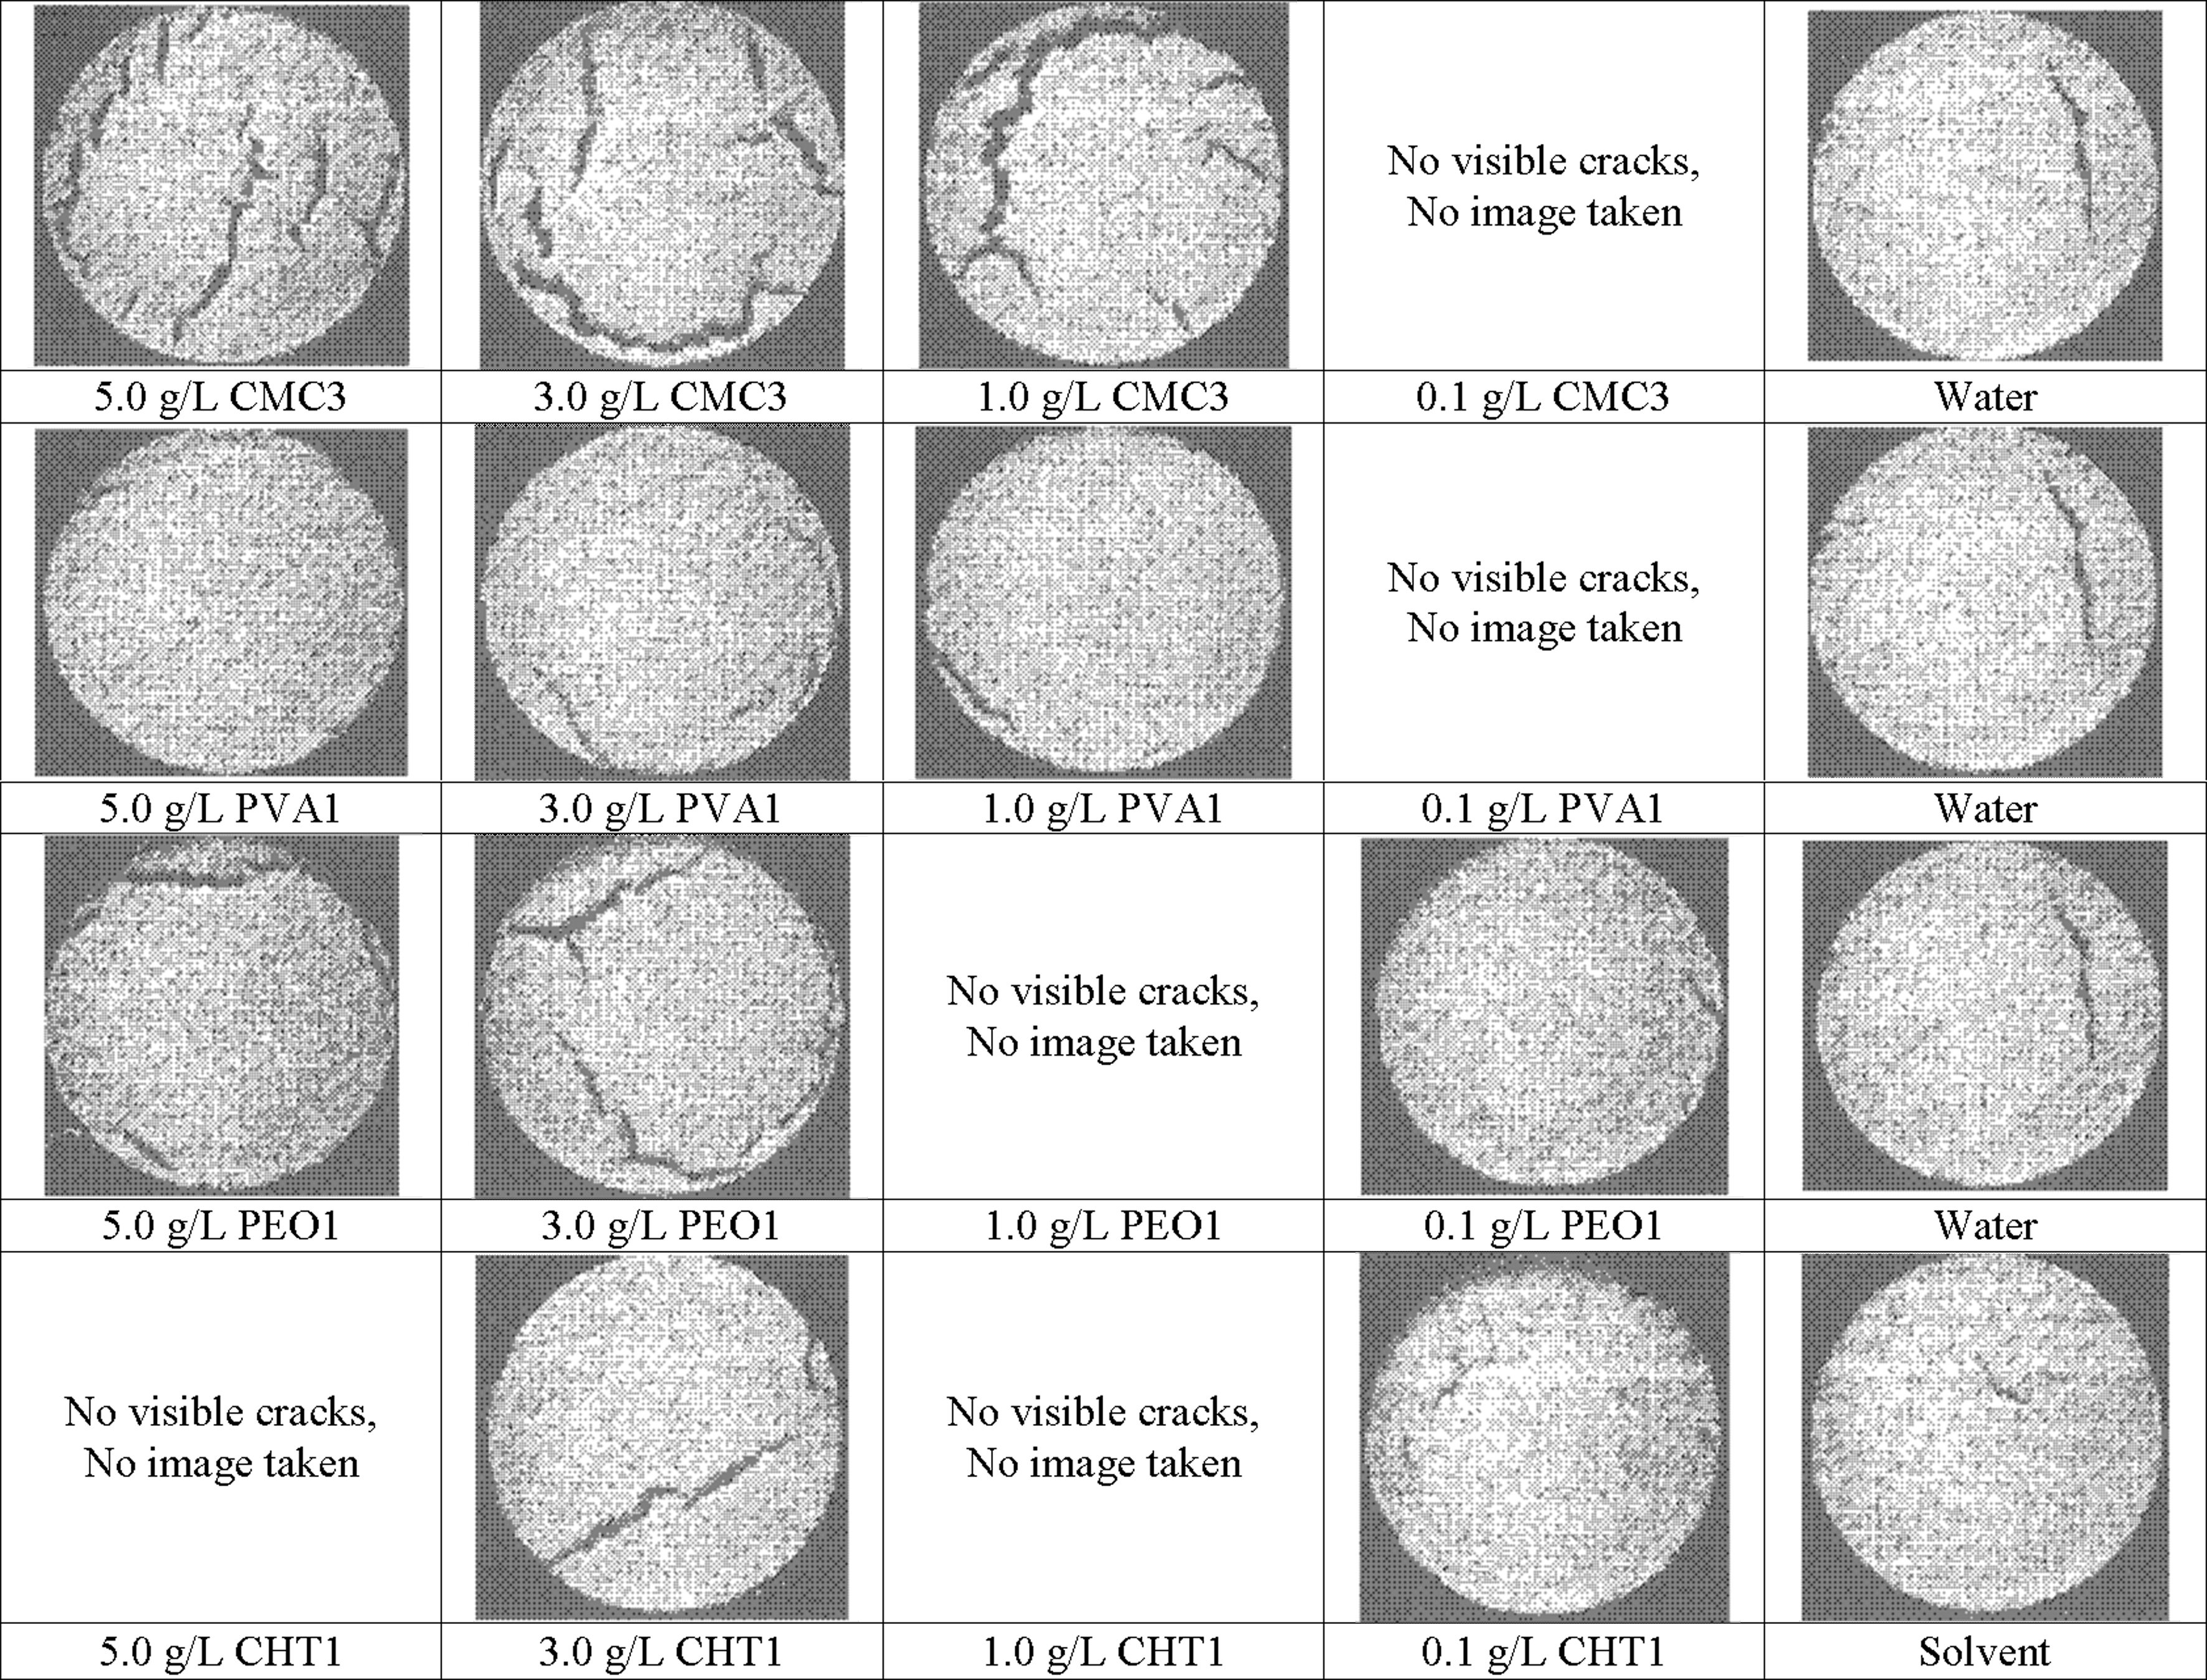
Crack information in sand–montmorillonite soils mixed with either polymer solutions, or water or solvent and dried at 25°C at 30% humidity.
Figure 7 shows that most sand–Na-montmorillonite samples have the greatest CAD for a concentration of 3 g/L. CMC3-amended samples had the greatest CAD values even though the lowest SRs for Na-montmorillonite were observed for the sample that was mixed with 3 g/L. While the samples were drying out, the first visible crack formed on a CMC3-amended sample. This behavior can be explained by the clay bridge theory proposed by Mullins and Panayiotopoulos (1984). During the preparation of samples in this research, it became apparent that clay bridges are strengthened by the addition of polymers. After a clay sample was mixed with CMC3 solution and left to hydrate in a container for a day, it was very easy to wash the container out after use because the montmorillonite stuck together but not to the container. In a shrinkage test, samples are less likely to crack because the container wall is greased and the area of the container is small. However, when a container is not greased and has a large area in which the soil is spread out, the soil particles are more likely to be pulled apart upon drying. The CMC held together the sand particles through the clay bridges very strongly. These bonds are so strong, and therefore, the places where the polymer is not saturated receive more tensile stress and crack as a result. CMC acts as an aggregant like polyacrylamide did when Shainberg et al. (1990) mixed it with clayey soils. The samples split into smaller pieces, but there is no loose soil such as dust in the sample dish. Most of the cracking of CMC3-amended samples in the present study occurs at a concentration of 3 g/L. At higher polymer concentrations, less cracking occurs even though the stresses are higher. This is attributed to the better distribution of polymers in the soil sample.
Conclusions and Recommendations
The results of shrinkage and DR tests performed on 90:10 mix of sand:Na-montmorillonite and pure Na-montmorillonite samples mixed with various polymer solutions indicate the following points:
Na-montmorillonite samples mixed with CMC solutions have good shrinkage characteristics, especially at high concentrations. This could be due to the repelling action between negatively charged polymers and the negatively charged surfaces of clay particles. The ability of CMC to reduce shrinkage of Na-montmorillonite is enhanced at higher molecular weights. Separate mixes of CHT and PEO solutions mixed with both 90:10 mix of sand:Na-montmorillonite and pure Na-montmorillonite exhibit better shrinkage characteristics at lower polymer solution concentrations than at higher ones, indicating different mechanisms of shrinkage inhibition at these two different concentrations. Also, these two polymers (CHT and PEO) have an optimum molecular weight at which they are most able to reduce shrinkage of Na-montmorillonite and 90:10 mix of sand:Na-montmorillonite. Shrinkage characteristics of samples mixed with neutral polymers depend on the prevalent bonding mechanisms between polymer and clay. It seems that dipole–dipole, charge–dipole, and hydrogen bonding between PVA and clay are stronger than only dipole–dipole and charge–dipole bonding between PEO and clay.
DR tests performed on 90:10 mix of sand:Na-montmorillonite indicate that regardless of the type of additive admixed with the soil (polymer solution, water, or solvent), after 10 h of drying, DR of all samples converge. For the samples that were treated with CMC3, it is apparent that as concentration increases, the DR decreases quicker during the desiccation process. The DR of 90:10 mix of sand:Na-montmorillonite has no effect on CAD.
The results of desiccation tests indicate that when polymer solutions are added to 90:10 sand:Na-montmorillonite at a low concentration, some areas within soil samples become saturated, whereas other portions are left susceptible to crack formations up to a critical polymer solution concentration of about 3 g/L. Further increase in polymer content reduces the sizes of the susceptible regions, thereby minimizing cracking potential. Samples treated with PVA do not have a critical polymer concentration; instead, CAD is the same at all concentrations (1% or less). PVA1's ability to control cracking effectively could be attributed to its strong bonding derived from hydrogen bonding to the clay surface, as well as its optimum chain length. However, when the performances of polymers, distilled water, and solvent in all tests in the present study are compared, it can be concluded that CMC3 at concentrations of 0.1 and 3 g/L are the best choices for barrier improvement.
There are other ways of assessing the performance of barrier materials, such as the use of hydraulic conductivity and infiltration tests. Also, freeze–thaw experiments of barrier materials mixed with polymer solutions can be useful. However, the results of this research will enable the results obtained from such tests to be explained and understood. For most tests in this research, only a few polymer concentrations were prepared, sometimes only 0.1 and 3 g/L. A wider range of polymer concentrations would better explain the swelling–flocculating behavior of Na-montmorillonite suspended in CHT solutions. Also, testing of other sand:Na-montmorillonite ratios is important because barrier compositional differences can affect their textural response to admixing with aqueous polymer solutions.
The addition of water-soluble polymers to barrier materials could prove to be an effective way of inhibiting desiccation cracking. However, there is still more research to be done so that the interactions between polymers and barrier materials can be better understood, and the right kind of polymer at the appropriate concentration can be chosen for this application. Additional research could involve dielectric constant measurements of polymer solutions and Na-montmorillonite suspensions in the polymer solutions so that the double layer thickness of Na-montmorillonite samples could be determined. Then, these distances could be compared with polymer chain lengths to provide more information about clay–polymer interactions that are likely to induce clay flocculation and affect the cracking potential of barrier materials under stresses imposed by desiccation processes.
Footnotes
Acknowledgment
This work was funded by Dupont Grants to Professor Hilary I. Inyang at the University of Massachusetts-Lowell. The agreement allows Professor Inyang to authorize the publication of this work without violating the intellectual property rights of his sponsor, his associates and co-authors.
Author Disclosure Statement
No competing financial interests exist.