
Abstract
Abstract
Fluoride can be removed from wastewater by addition of calcite. However, fluoride is often found in complex mixtures where other contaminants can affect the removal process. Batch experiments were used to determine the impact of phosphate (PO43−) on the removal of fluoride from solution by calcite. In the experiments, up to 2,000 mg/L F− and 500 mg/L PO43− were used with 150 μm and 1.18 mm calcite fractions at solid-to-solution ratios of 1.00 and 33.33 g/L. Experimental results were analyzed with the geochemical model PHREEQ, which assumes fluoride and PO43− removal by precipitation as fluorite, fluorapatite, and hydroxyapatite. The model predicted that PO43− had no influence on fluoride removal below pH 11.6. This was inconsistent with the experimental data showing that the presence of a relatively small amount (17 mg/L) of PO43− resulted in a 20% reduction in F− removal, whereas 500 mg/L PO43− resulted in complete (100%) inhibition of fluoride removal. Results indicated that the removal of fluoride via precipitation is inhibited by PO43− adsorption at the calcite surface, and that there was competition for available surface adsorption sites with PO43− preferentially removed over F−. The amount of PO43− adsorbed was in very good agreement with the number of available adsorption sites calculated from Kr-BET surface area measurements. To date no studies have examined the impact of phosphate on the removal of fluoride from water using calcite, a cost-effective, readily available material commonly used as a water filter substrate. Importantly, this study provides quantitative information for environmental engineers and decision makers on the impact of phosphate on the ability of calcite to remove fluoride from contaminated water.
Introduction
Technologies to remove contaminants from wastewaters often employ sorption processes. For example, calcite can be used to remove fluoride (Turner et al., 2005) and phosphate (Freeman and Rowell, 1981; Karageorgiou et al., 2007) from contaminated waters. As PO43− preferentially sorbs over other anions such as F− (Tan, 1982), it is therefore important to determine how phosphate affects the removal of fluoride in sorption processes.
It is commonly thought that the reduction in fluoride levels in the presence of calcite (CaCO3) normally occurs via precipitation as fluorite (CaF2) (Harmon and Kalichman, 1965; Farrah et al., 1985; Pickering, 1985; Zhang et al., 1987; Saha, 1993; Reardon and Wang, 2000). However, experimental studies by Fan et al. (2003) showed that fluoride can undergo adsorption at the calcite surface and that its removal is surface area dependant (Turner et al., 2005). It is therefore expected that the presence of PO43− in a calcite/fluoride system will result in a reduction in the amount of fluoride removed.
Kuo and Lotse (1972) investigated the time dependence of phosphate adsorption by calcite. They found that at low phosphate concentrations, monolayer adsorption occurred and could be described by Langmuir adsorption isotherms. They also found that 80% of the phosphate was sorbed within 10 s. It was suggested that phosphate ions may replace adsorbed water molecules, bicarbonate ions, or hydroxyl ions; however, the actual adsorption mechanism was not discussed.
Griffin and Jurinak (1973) theorized that phosphate adsorption onto calcite occurs, in part, as a multilayer phenomenon at specific surface sites on the calcite surface. Initially, adsorption of phosphate takes place on a limited number of sites. As adsorption proceeds, site coverage increases to the extent that lateral interaction occurs between the adsorbed ions. These clusters serve as centers (heteronuclei) from which spontaneous crystal growth can occur (i.e., precipitation). Freeman and Rowell (1981) also studied the reaction of phosphate (up to 500 mg/L) with calcite surfaces and found that, initially, small amounts of phosphate adsorption occur, followed by precipitation as dicalcium or octacalcium phosphate at higher phosphate concentrations.
Berner and Morse (1974) and Svensson and Dreybrodt (1992) studied the behavior of calcite dissolution in phosphate solutions (∼1.5 mg/L) and observed that PO43− inhibits calcite dissolution. Berner and Morse (1974) suggested that the surface adsorption of PO43− ions act as an inhibitor to calcite dissolution by blocking surface sites active to dissolution. Svensson and Dreybrodt (1992) proposed a model in which Ca2+ ions are adsorbed to lattice sites that are active to dissolution, blocking further dissolution at these sites. The electrostatic attraction between the adsorbed Ca2+ and aqueous PO43− was suggested as the adsorption mechanism.
Yang et al. (1999) studied the impact of phosphate (up to ∼30 mg/L) and sulfate on the removal of up to 300 mg/L fluoride by calcite. The authors concluded that fluoride was removed via the formation of CaF2 with no competition from anions such as SO42− and PO43−. It was determined that when the ratio of PO43− to F− exceeded 5%, the amount of fluoride removed decreased. However, this result could not be explained by precipitation as the saturation indices of fluorite and fluoroapatite were not exceeded. The possibility of fluoride removal by adsorption and the interferences caused by the presence of SO42− and PO43− were not discussed.
Although it is known that PO43− can inhibit calcite crystal growth, quantitative information about their inhibitory capabilities is lacking in the peer reviewed literature (Lin and Singer, 2005a). As there has been no specific study on the effect of PO43− on F− removal by calcite, this article aims to quantify the degree to which PO43− inhibits the capability of calcite to remove fluoride from solution. This study presents results from laboratory-based studies and PHREEQ (Parkhurst and Appelo, 1999) geochemical modeling to determine, macroscopically, the impact of PO43− on fluoride sorption by calcite. The PHREEQc model is similar to other geochemical equilibrium codes such as Minteqa or Geochemists Workbench and the results are included to demonstrate that conventional geochemical modeling cannot describe the experimental data. The application of a surface precipitation model that incorporates monolayer coverage extending to surface precipitation (e.g., Comans and Middelburg, 1987; van Cappellen et al., 1993) is not straight forward and is beyond the scope of this article.
Materials and Methods
The calcite tested in these experiments was sourced from the areas of the Moore Creek and Sulcor Limestone members, which is part of the Tamworth (NSW, Australia) formation laid during the Permian period of the Palaeozoic era ∼300 million years ago. This calcite was selected instead of bottled analytical grade calcite powder as the experiments are to form the basis for the design of a permeable reactive barrier consisting of the crushed limestone placed at an actual contaminated site. Analysis with Philips PW1404 Wavelength Dispersive Sequential X-Ray Fluorescence analyzer showed that the limestone used in these experiments was 99% pure CaCO3 with small quantities of MgO (1%), strontium (168 ppm), barium (71 ppm), zirconium (40 ppm), and other trace elements at concentrations <40 ppm. The X-ray diffraction patterns confirmed the presence of CaCO3 mineralogy and were collected using a Philips X'Pert X-ray diffractometer using Cu Kα radiation operated at 40 kV and 20 mA. Patterns were collected in the range 5–70° 2θ, with a step size of 0.008° and a step counting time of 55.33 s.
A series of batch tests were performed in clean, acid-washed, 30 mL polycarbonate screw-top bottles. Calcite was added in two particle sizes as 150–300- and 850–1,180-μm-sized fractions at solid-to-liquid ratios of 33.33 and 1.00 g/L with initial total aqueous fluoride concentrations of up to 2,000 mg/L as potassium fluoride (KF). For brevity the calcite particle sizes will be referenced as 150-μm and 1.18-mm fractions.
Aliquots of a 1,500 mg/L potassium phosphate stock solution were added to the batch test vials to give the required final phosphate concentrations ranging between 0.0 (control) and 500 mg/L. Phosphorous interacts with soil particles in its exchangeable form known as orthophosphate (H3PO4, H2PO4−, HPO42−, and PO43−) and the relative concentrations of these species are pH dependent, with PO43− having the strongest binding capacity (McBride, 1994). The hydrated ion sizes of H2PO4− (∼420 pm) is of a similar size to HPO42− (∼437 pm) and PO43−, being ∼400 pm (Kielland, 1937). In this article, we do not distinguish between these species and the terminology PO43− refers to the sum of all orthophosphate species.
The pH was adjusted (in selected tests) by adding small amounts of 0.18 M H2SO4. The vials were then capped to reduce CO2 exchange, thereby replicating closed system conditions. To ensure equilibrium, the vials were then mixed in a constant temperature rotating water bath (∼21°C) for at least 4 weeks before being centrifuged and analyzed for pH (Orion 8104BN electrode), major anions (F−, Cl−, SO42−, and PO43−), and cations (Ca2+, Na+, and K+) using a Dionex 2500C ion chromatograph. Control batch experiments were also conducted using HNO3 to adjust system pH instead of H2SO4. These experiments produced identical results demonstrating that SO42− does not affect PO43− or F− sorption. To validate the closed system conditions of the experimental method, four vials (two each of 150 μm and 1.18 mm) containing only calcite and deionized (DI) water were allowed to react as outlined earlier for at least 4 weeks. Four identical vials were also magnetically stirred while open to the atmosphere for 24 h at 22°C ± 2°C. The supernatant was then analyzed for pH, Ca, and total alkalinity and the results were compared with PHREEQc model results for open and closed calcite–water systems.
To determine the morphological changes experienced at the calcite surface, scanning electron microscopy with energy-dispersive spectroscopy (SEM-EDS) was used on samples of Iceland spar (optical-grade pure calcite) exposed to solutions of F− and PO43− (as potassium salts) as described earlier. Iceland spar was chosen in preference to the crushed calcite used in the batch experiments because its chemical behavior has been shown to be identical with that of the raw calcite used in the batch experiments (Turner et al., 2005) and also its smooth, atomically flat surface makes it much easier to work with for surface imaging techniques such as SEM-EDS. SEM was carried out using a Philips XL30 and an Oxford ISIS 200 with a beryllium window detector using ZAF (atomic number [Z], absorption [A], fluorescence [F]) corrections.
Heterogeneous systems and geochemical modeling
Calcite precipitation (and dissolution) involves heterogeneous reactions such as adsorption of lattice ions and incorporation of adsorbed ions into the mineral lattice. Geochemical models such as PHREEQ, however, use thermodynamic databases derived from homogeneous reactions (e.g., WATEQ4f ) and are widely used by the geochemical community to model both laboratory and natural heterogeneous systems (Parkhurst and Appelo, 1999; Brown et al., 2000; Postma and Appelo, 2000; Bain et al., 2001; Plant and House, 2002; Delolme et al., 2004; Lin and Singer, 2005b).
The WATEQ4f database in PHREEQ (Parkhurst and Appelo, 1999) was used to model the experimental system as this database is the only one in PHREEQ that contains phosphate- and fluoride-bearing minerals such as fluorapatite [Ca5(PO4)3F] and hydroxyapatite [Ca5(PO4)3OH]. Model input solutions were set up to be equivalent to the heterogeneous reactions occurring in the respective closed system batch experiments, and the minerals fluorapatite, hydroxyapatite, gypsum (CaSO4 · 2H2O), anhydrite (CaSO4), fluorite (CaF2), and calcite (CaCO3) were allowed to precipitate or dissolve in the model. The model pH was altered via the addition of H2SO4 as done in some batch experiments.
Results and Discussion
In this article, the general term “sorption” is used to mean the processes of adsorption, surface precipitation, and precipitation (and polymerization), as defined by Sposito (1984).
Experimental CO2 control
Table 1 shows the pH, total Ca (mg/L), and total alkalinity (meq/L HCO3−) of the calcite–DI water open and closed system experiments. As the results for the 150-μm and 1.18-mm calcite fractions were almost identical for the respective systems, only the average values are shown together with the PHREEQc predicted results. The experimental and PHREEQc model results are in good agreement, demonstrating that the capped vials used for the remainder of this study are a closed system with no CO2 exchange with the atmosphere occurring during the reaction period.
pCO2 = 10−3.5 atm. All experimental systems at 33.3 g/L solid–liquid ratio, no fluoride or phosphate added.
Surface area
Table 2 shows the Kr-BET surface area results of unwashed calcite samples, calcite washed in DI water, and 0.1 M HCl (to determine the contribution of the associated calcite dust to the total surface area). Because of its greater accuracy for low surface area particles, Kr-BET surface area analysis was used in preference to N2-BET (Yanazawa et al., 2000). The surface area of the 150-μm calcite samples washed in DI water was found to be 0.229 ± 0.005 m2/g. For samples repeatedly exposed to 0.1 M HCl, the average surface area of the three samples was found to be 0.178 ± 0.005 m2/g, indicating that there is up to a 22% decrease in available surface area because of the dissolution/washing out of the fine particles in the presence of 0.1 M HCl. The number of moles of surface calcium sites was determined using the Kr-BET surface area, assuming a surface site density of one Ca atom per 20 Å2 (Stipp, 1999). The calculations show that for raw unwashed calcite there are ∼2.3 and 0.7 μmol/g surface Ca sites on the 150-μm and 1.18-mm calcite fractions, respectively. Assuming a 1:1 adsorption reaction between surface Ca sites and aqueous F, the maximum amount of fluoride that could be removed by adsorption alone is 2.3 μmol/g or 0.044 mg/g, with the remainder of fluoride removed from solution by precipitation as CaF2.
Raw calcite sample.
Calcite washed in deionized water.
Calcite washed in 0.1 M HCl (average of three samples).
Impact of phosphate on fluoride removal
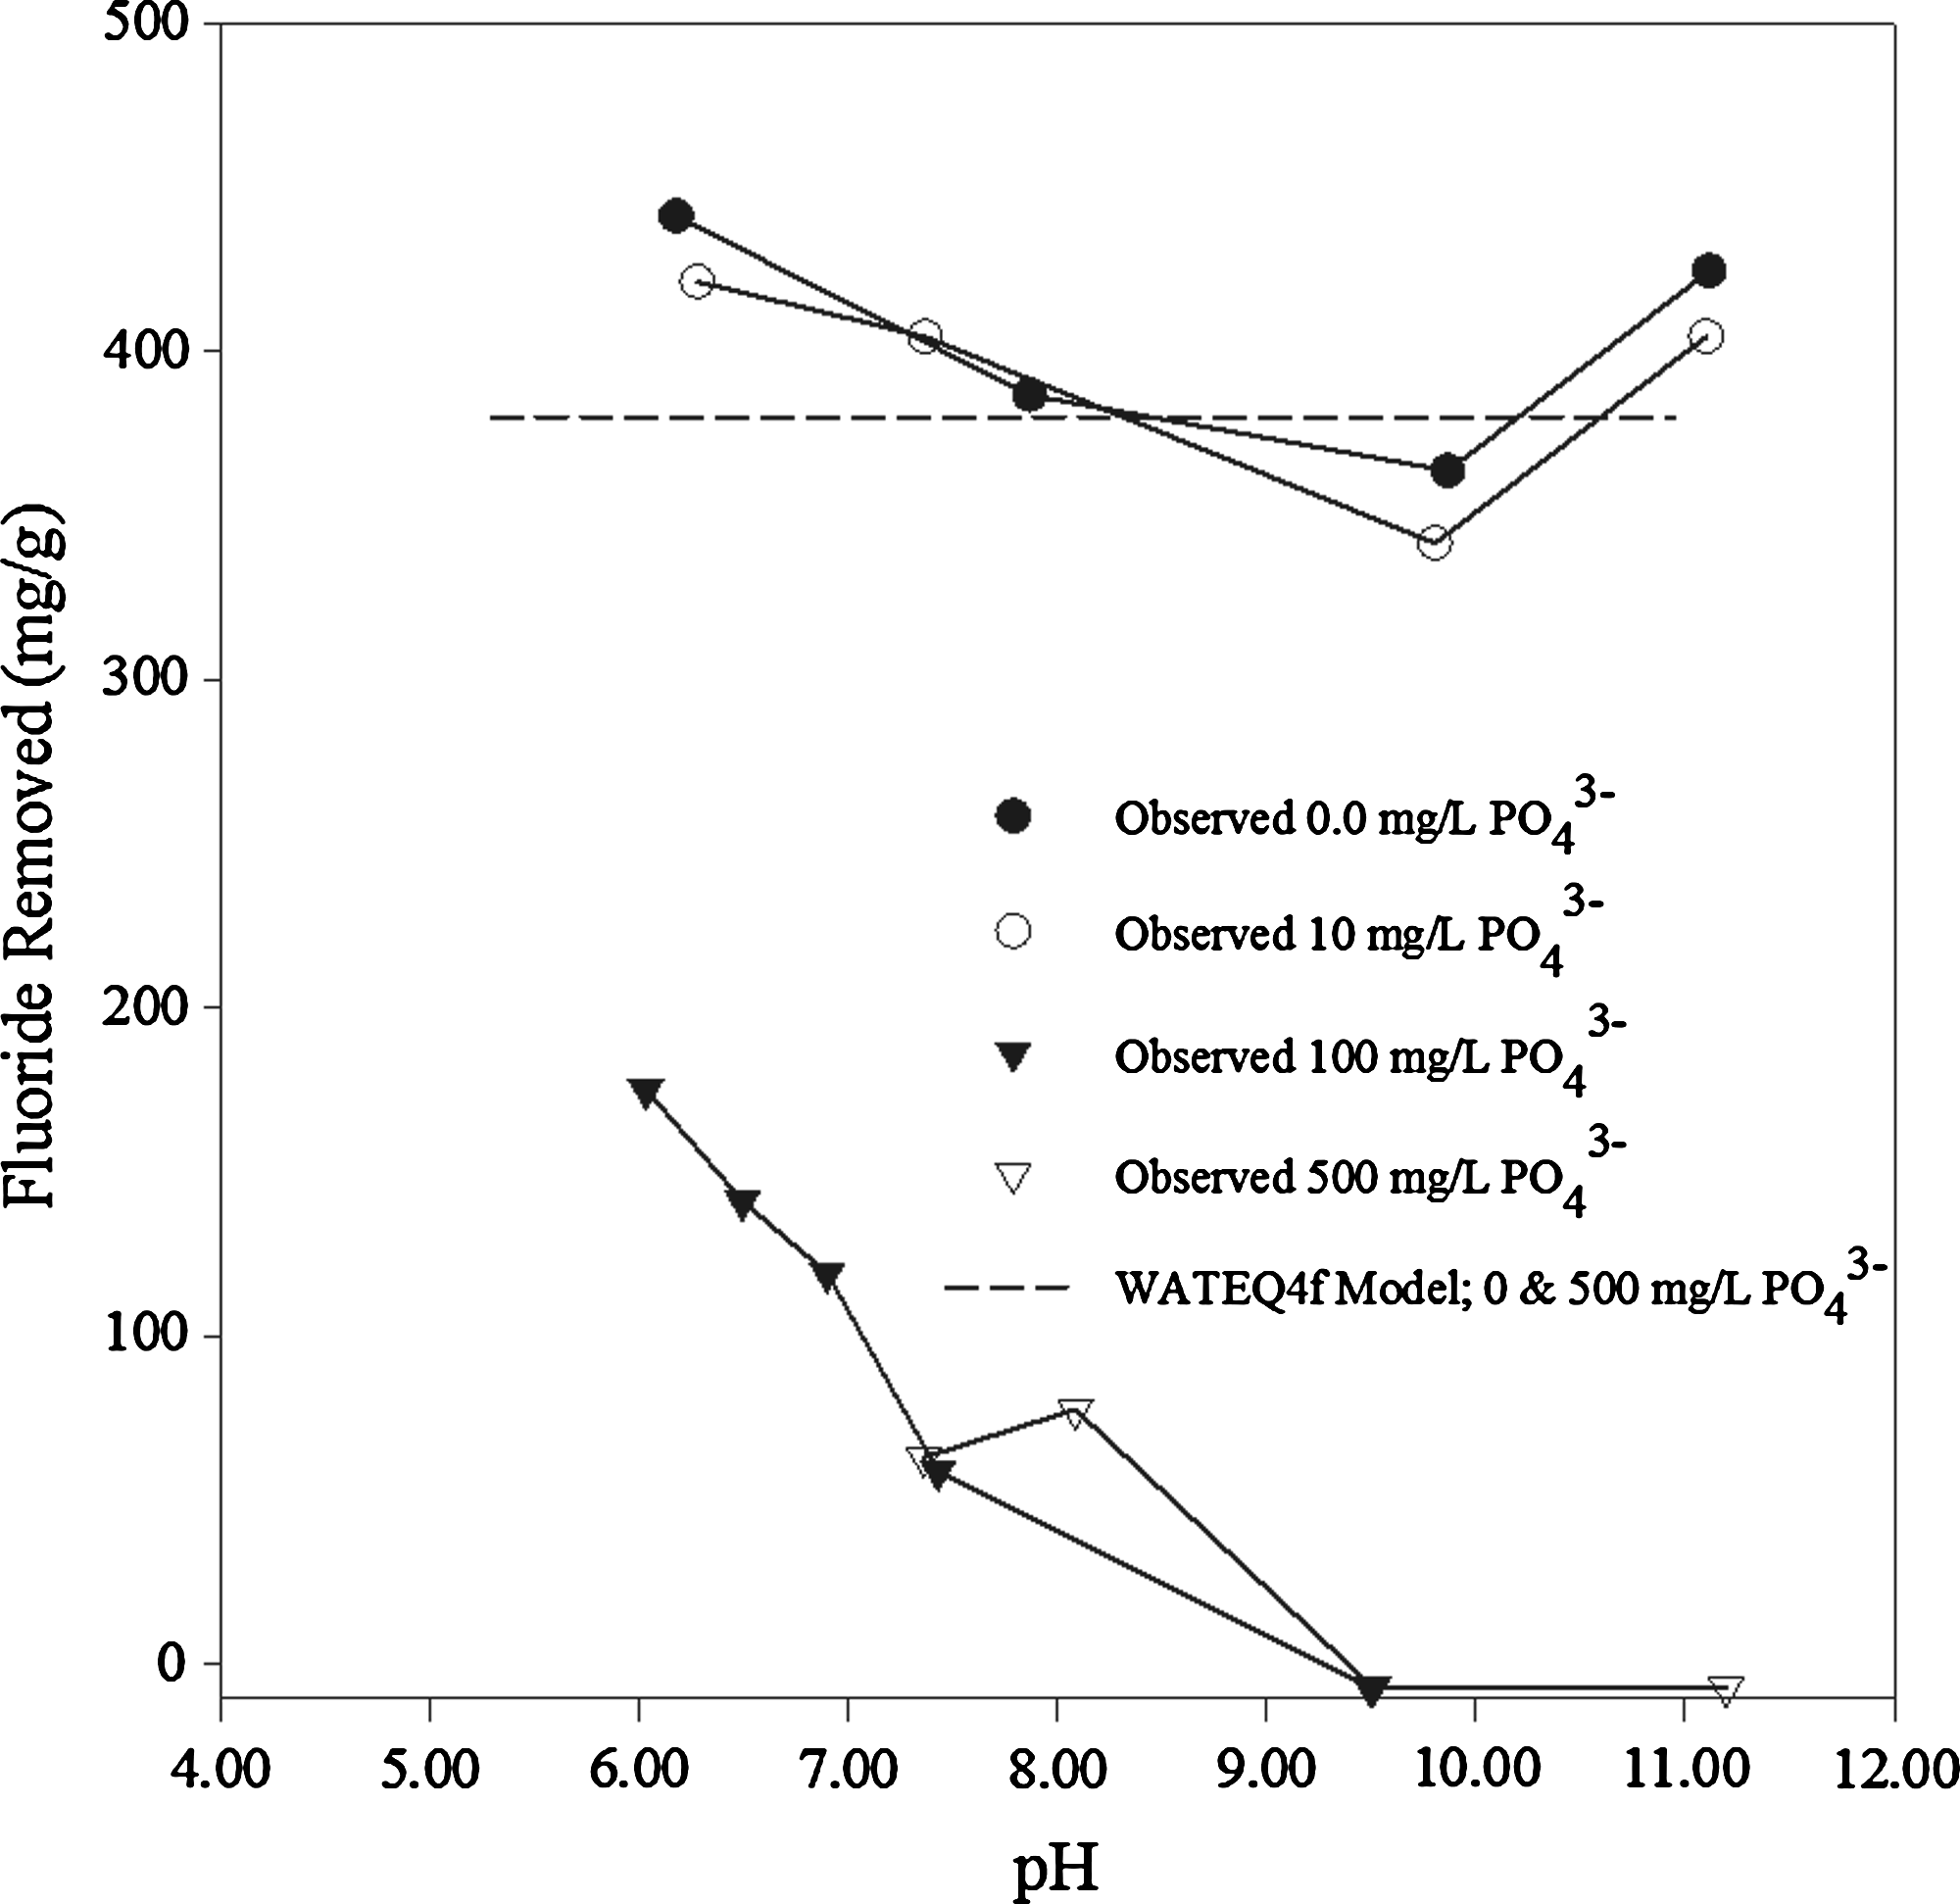
The impact of increasing PO43− concentration on fluoride removal by calcite is presented as a function of pH in Figs. 1 and 2, with calcite solid–liquid ratios of 33.3 and 1.0 g/L, respectively. Results show that fluoride removal appears to increase with decreasing pH and approaches the removal obtained in control batch tests (zero PO43−) as PO43− decreases. A reduction in fluoride removal in excess of 90% occurs at pH > 10 in the presence of 500 mg/L PO43−, which is most likely due to the blocking of calcite sites active to dissolution by PO43− adsorption as proposed by Berner and Morse (1974) and Svensson and Dreybrodt (1992). The pH dependence of PO43− on fluoride removal can be explained by the pH dependence of PO43− speciation (Fig. 2). The increase in fluoride removal with decreasing pH is due to the fact that PO43− complexes in solution via the following reactions:

Impact of PO43
Impact of PO43
These reactions decrease the concentration of aqueous PO43− with decreasing pH. Below pH 11.0, aqueous PO43− in solution rapidly decreases (Fig. 2) until below pH 9.5, and essentially no aqueous PO43− remains in solution. Even when PO43− is no longer present in significant amounts, fluoride removal is still suppressed, and so competition for adsorption sites still occurs.
PHREEQ can be used to predict the amount of fluoride precipitating from solution in the presence of calcite and aqueous PO43−. The model results presented in Figs. 1 and 2 are in excellent agreement with the experimental fluoride removal results in the absence of PO43−. The model also predicts that precipitation of fluoride as CaF2 is unaffected by PO43− at pH < 1.6 where fluorapatite precipitation is not expected. However, comparison of the 500 mg/L PO43− PHREEQ model with the respective 500 mg/L PO43− experimental batch test shows a decrease in F− removal of up to 40 mg/g (Fig. 1) and 350 mg/g (Fig. 2) when compared with the predicted model removal.
Figure 2 shows the calcite-limiting (1.00 g/L) solid–liquid ratio batch test. Experimentally, the amount of fluoride removed decreases dramatically with increasing PO43− concentration. Small amounts of PO43− (<10 mg/L) have no impact. However, at high initial PO43− concentration (>100 mg/L) and pH > 9.5, fluoride ceases to be removed by calcite altogether. This result is similar to that shown by Yang et al. (1999), who determined that a PO43−:F− ratio of more than 5% is required before any impact is seen. The results contrast with experiments in which calcite is not limiting (Fig. 1) but fluoride, in the presence of increasing concentration of PO43−, continues to be removed, even at high pH. The difference between the results observed in the 33.3 and 1.00 g/L batch experiments suggest a surface area dependence of reactions, with the mass removed decreasing with available surface area.
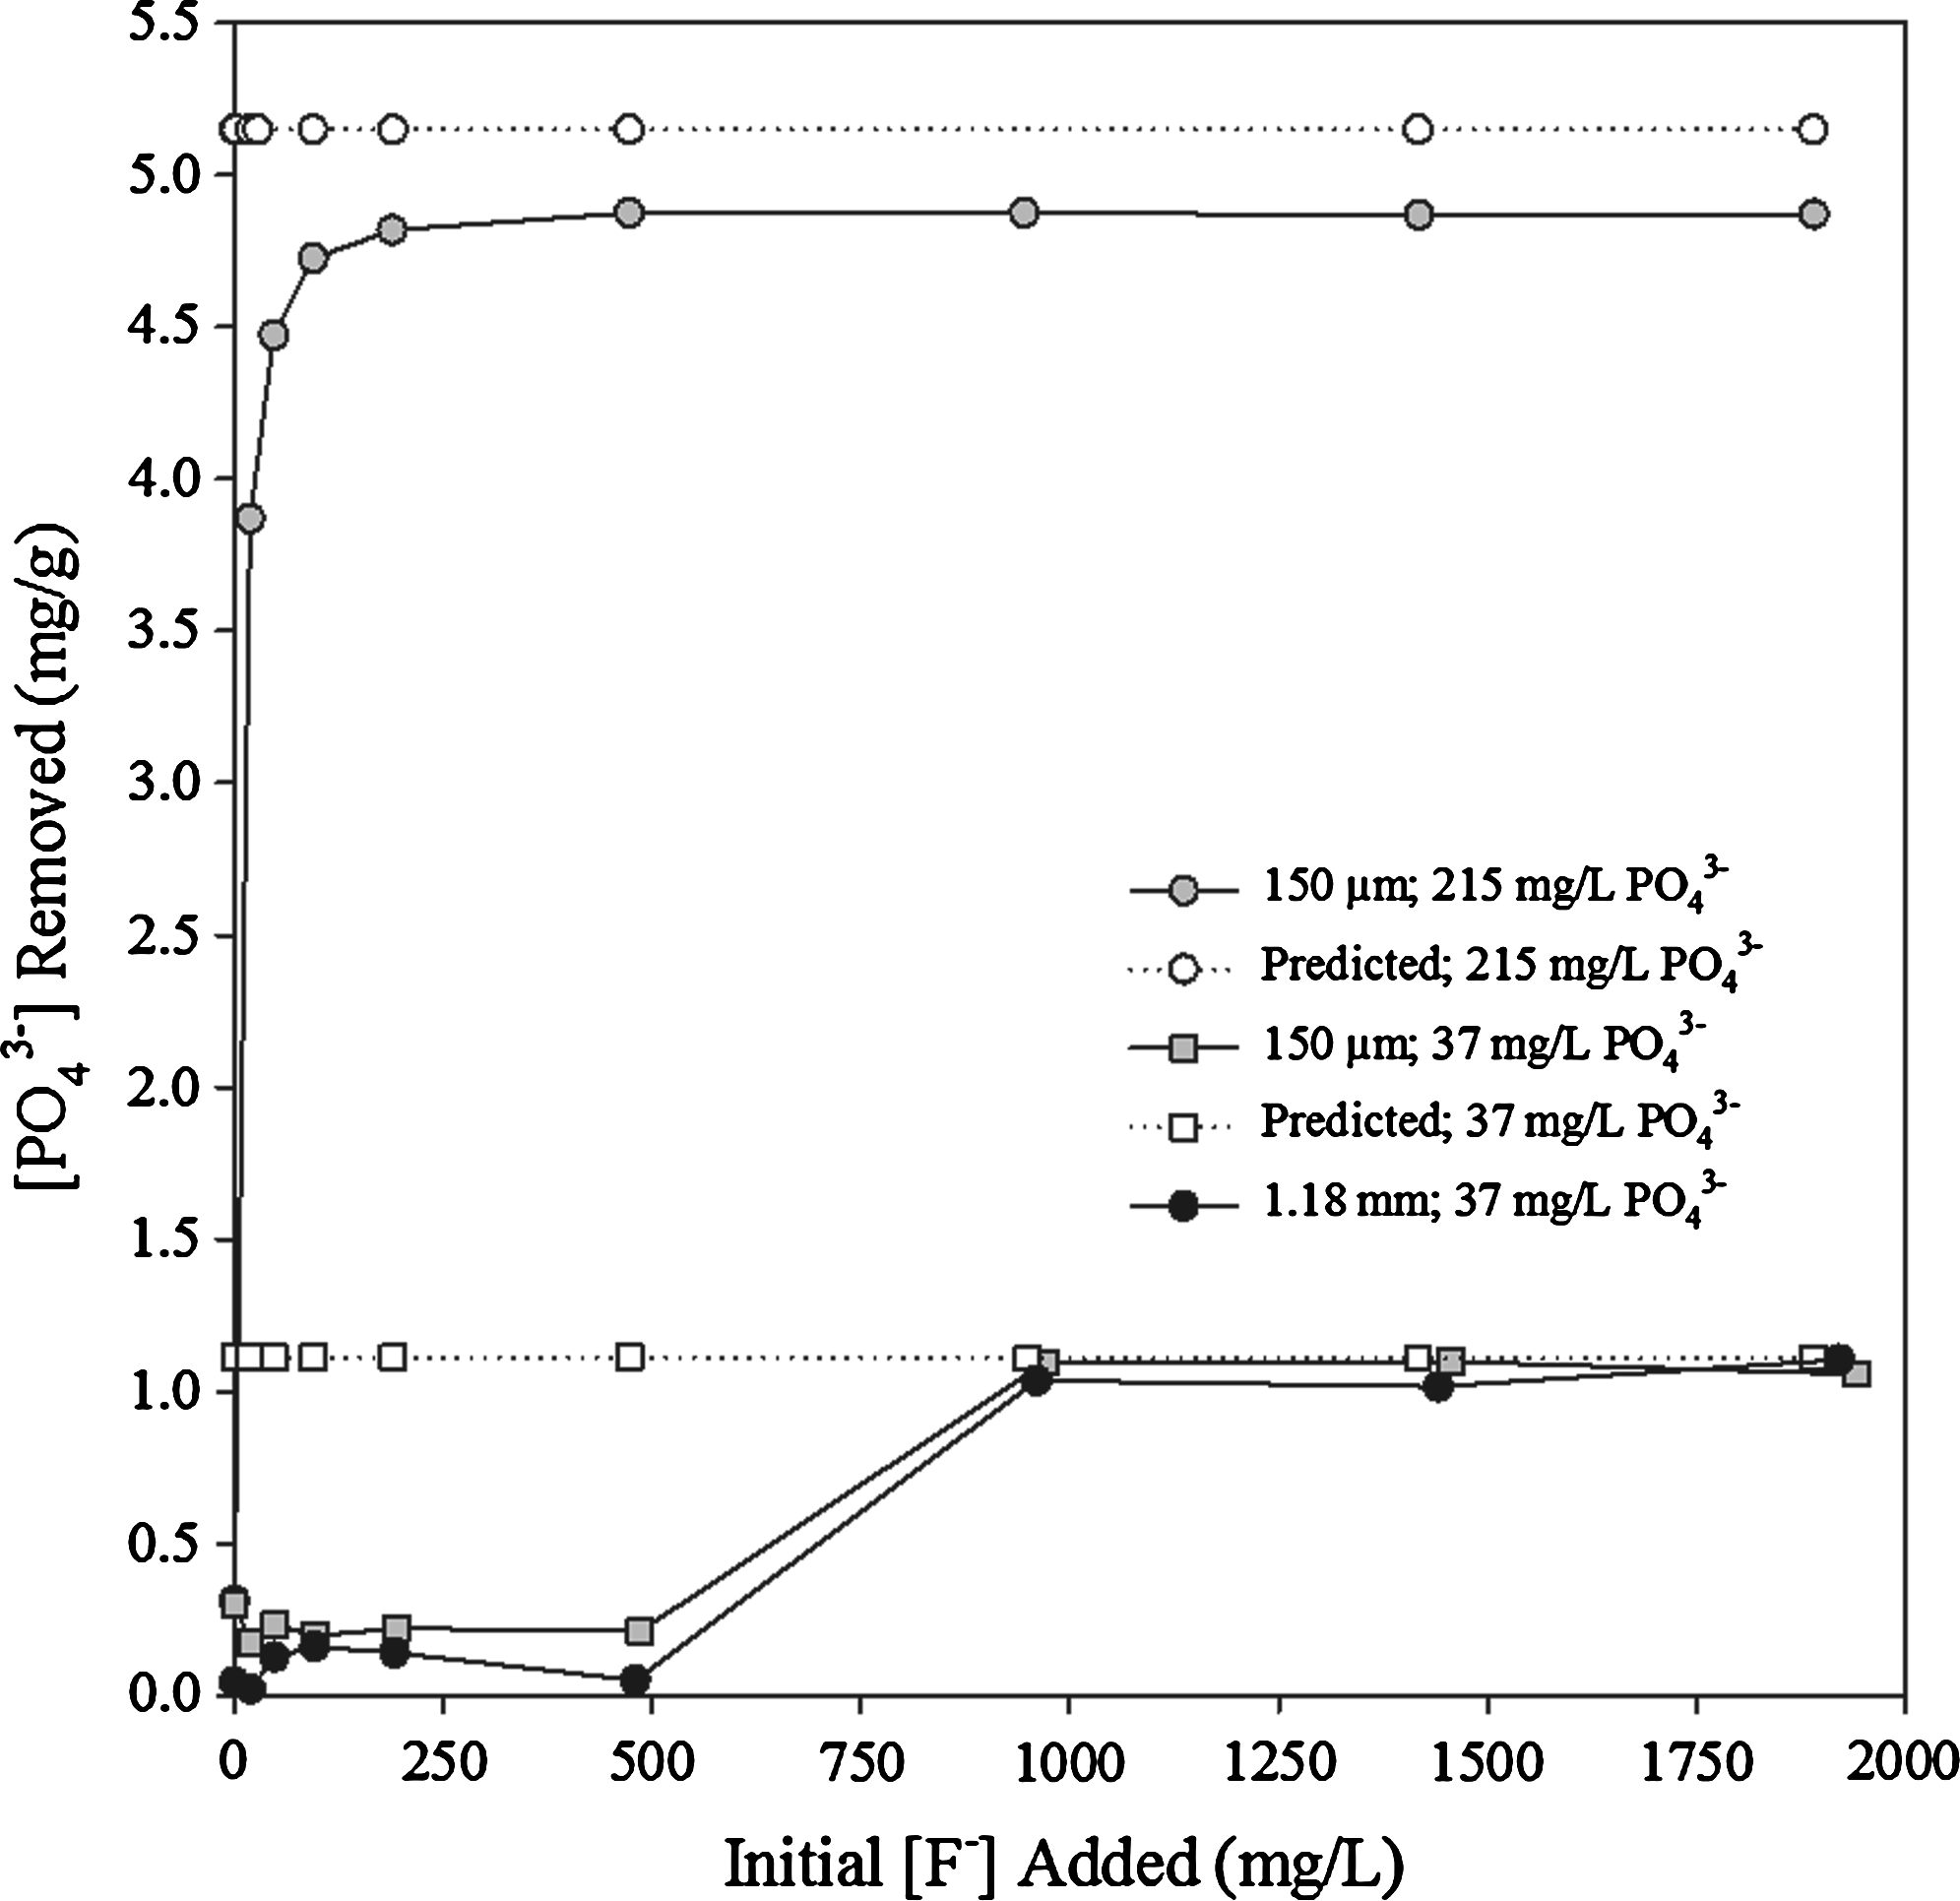
The surface area dependence is also shown in Fig. 3, where fluoride removal is shown for 150-μm and 1.18-mm calcite at various initial PO43− concentrations (0, 37, and 215 mg/L) at a pH of 10.92 ± 0.56 (i.e., no acid added). It is evident that the 150-μm calcite fraction removes more F− than the corresponding 1.18-mm fraction and that the amount of F− removed decreases with increasing PO43− concentration. For example, when 215 mg/L PO43− is present, fluoride removal decreases by ∼53% (150-μm calcite) and ∼72% (1.18-mm calcite) when compared with the corresponding control (0 mg/L PO43−) experiments. The model (predicted) results show that F− removal is unaffected by PO43− concentration and that more F− should be removed than is actually observed in experiments. This indicates that PO43− is sorbed preferentially by calcite causing changes to the calcite surface and thereby a decrease in observed F− removal.

Fluoride sorption isotherm as a function of calcite particle size (33.3 g/L) and initial PO43
Just as PO43− affects F removal by calcite, F also affects PO43− removal. Figures 4 and 5 show the PO43− sorption isotherm and PO43− removal as a function of F concentration, respectively. The graphs show that PO43− removal increases with F concentration, indicating that F facilitates/enhances PO43− removal by calcite. Less than 0.3 mg/g of PO43− is removed when the initial concentration of F is <500 mg/L. Kitano et al. (1978) reported similar results and concluded that the marked increase in PO43− and F removal at later times was due to the formation of apatite. The figures also show that the higher surface area calcite is able to remove more PO43−, for example, 3.1 μmol/g (0.22 mg/L) and 0.48 μmol/g (0.046 mg/L) of PO43− are removed by the 150-μm and 1.18-mm fractions, respectively. This is in very good agreement with the calculated number of adsorption sites based on the surface area analysis (Table 2), implying a 1:1 adsorption reaction between surface calcium and aqueous PO43−.

Phosphate sorption isotherms for 150-μm and 1.18-mm calcite fractions (33.3 g/L) at constant initial fluoride concentrations. pH ∼ 10.50 ± 0.43.
PO43
The lack of a removal maximum (Figs. 3 and 4) is consistent with the findings of McBride (1979), who provided evidence for a continuum between adsorption and precipitation of metal ions in the presence of calcite. At low concentrations, metal ion sorption isotherms exhibit Langmuir behavior (monolayer adsorption), followed by Freundlich isotherm behavior at high concentrations, where no sorption maxima is observed, characteristic of precipitation or solid–solution formation. Fan et al. (2003) showed that fluorite is a better substrate for the removal of fluoride than calcite with F adsorbing onto exposed Ca sites parallel to the [111] fluorite cleavage plane. Therefore, it is possible that the increase in F removal with initial F concentration is due to the presence of greater amounts of the surface precipitate fluorite effectively increasing the number of F sorption sites. Similarly, PO43− removal above amounts, which is expected because of monolayer coverage, is possible due to the formation of surface precipitates (Freeman and Rowell, 1981; Tunesi et al., 1999; Zhou and Li, 2001).
Adding fluoride to the calcite/phosphate system increases phosphate removal (Fig. 5). When fluoride is present, PO43− removal increases to levels above the amount of available calcite adsorption sites. In the literature, this has been attributed to the formation of the precipitates fluorapatite [Ca5(PO4)3F; FAp], hydroxyapatite [Ca5(PO4)3OH; HAp] (Kitano et al., 1978), and fluorite (CaF2) (Fan et al., 2003). To determine if these minerals are present at equilibrium, leading to an increased number of possible anionic adsorption sites, the saturation index of these mineral were calculated using the following equilibrium constants: Ksp ≅ 10−10.64 for fluorite; Ksp ≅ 10−17.6 for fluorapatite; and Ksp ≅ 10−3.421 for hydroxyapatite (Ball and Nordstrom, 1991). When phosphate is added to a solution containing calcite, PHREEQ calculations show that no phosphate minerals form and so phosphate removal only occurs via sorption to the calcite surface. When both F− and PO43− are present, neither hydroxyapatite nor fluorapatite form (saturation index <<0); however, the addition of fluoride forms fluorite as a surface precipitate (Figs. 6–9), thereby increasing phosphate removal via sorption to the additional fluorite surfaces (Fig. 5). CaF2(s) is highly positively charged, even at high pH (Huang and Liu, 1999), and therefore capable of adsorbing anionic species such as PO43− (Fan et al., 2003).

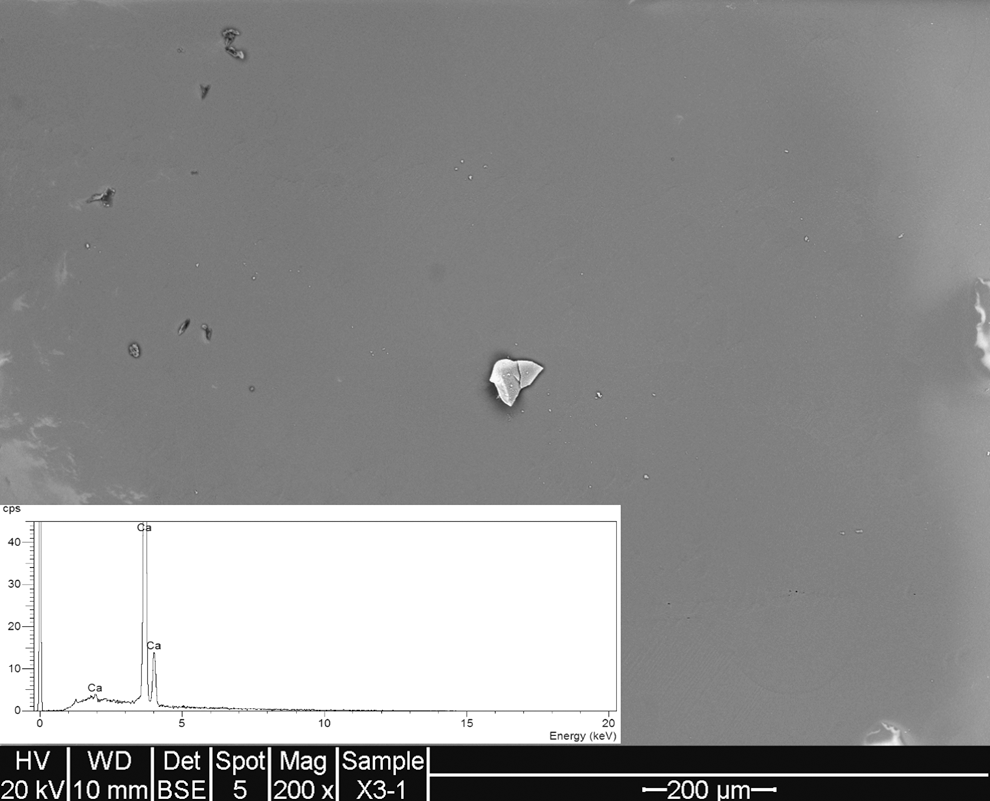
Scanning electron microscopy (SEM) image (energy dispersive spectroscopy [EDS] spectra inset) of Iceland spar exposed to deionized water only. Line and spots on image are foreign matter artefacts. HV, high voltage; WD, working distance (the distance between the sample surface and lens); Det BSE, detector back scattered electrons.
SEM image (EDS spectra inset) of Iceland spar calcite exposed to PO43− (as potassium phosphate).
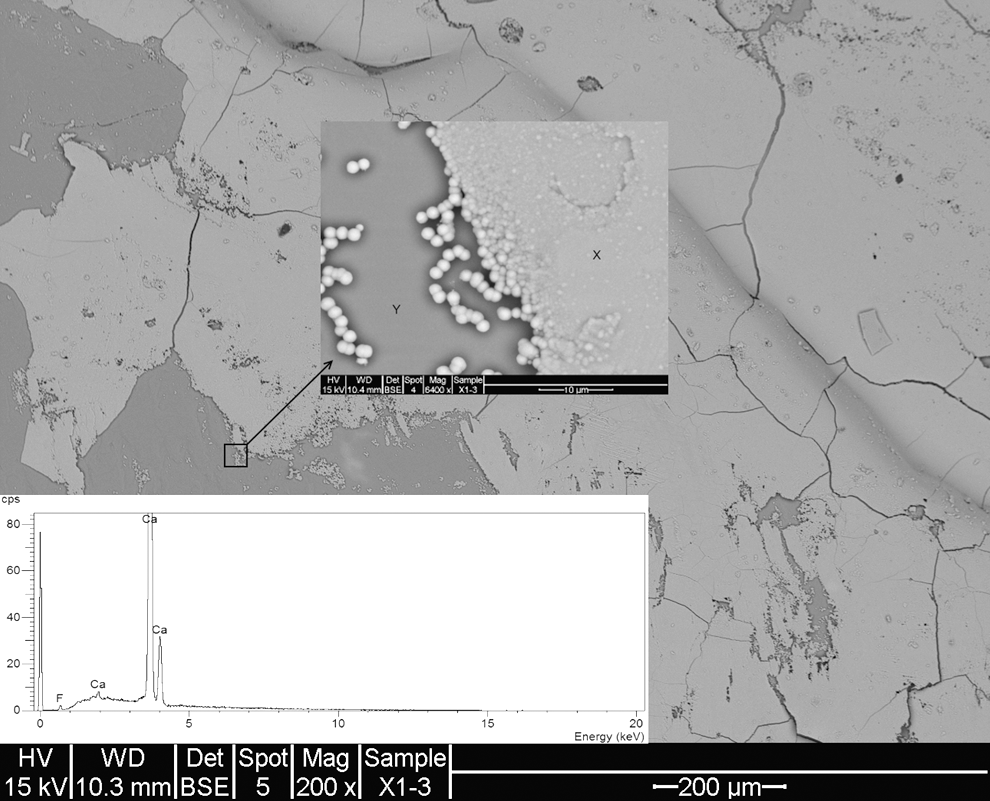
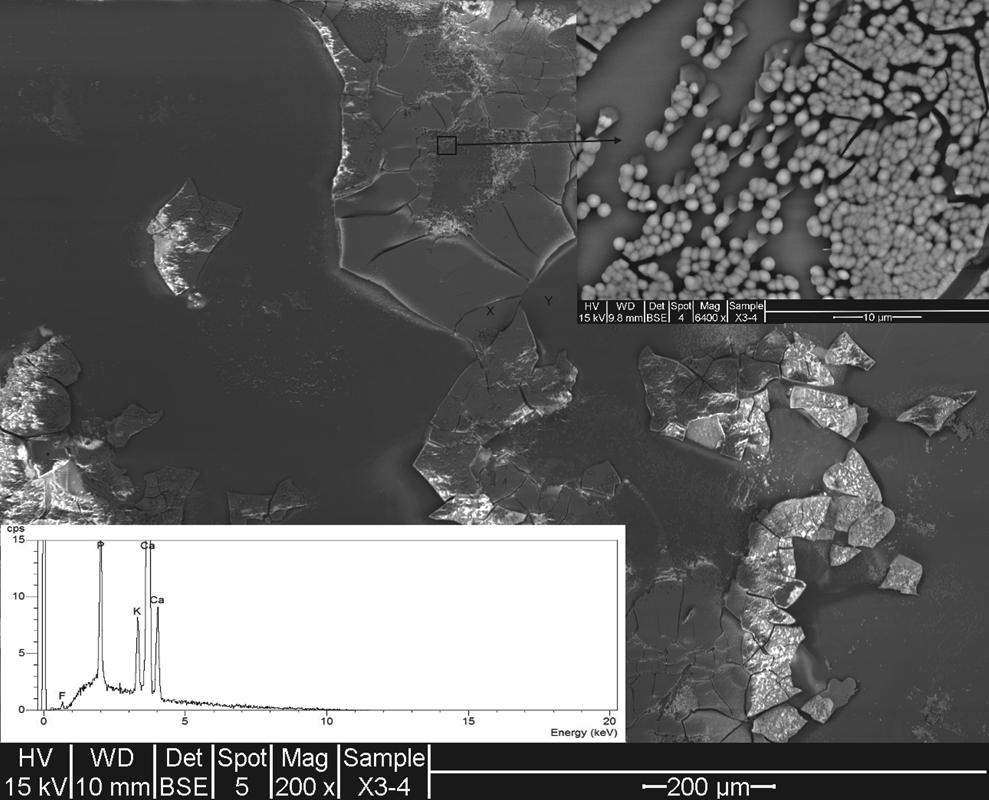
SEM image (EDS spectra inset) of Iceland spar exposed to F− (as KF). Arrow indicates 6,400 × magnification showing globular precipitates of CaF2-forming fluorite sheets (X) over calcite (Y).
SEM image (EDS spectra inset) showing Iceland spar calcite exposed to F
SEM-EDS studies on calcite samples support the theory of PO43− sorption onto CaF2. Figure 6 shows the SEM image of calcite in DI water. The surface is very smooth with a few dust artifacts present. The EDS spectrum (Fig. 6, inset) shows the characteristic calcite background with only Ca peaks present. Figure 7 shows the surface SEM image of calcite exposed to PO43− (as potassium phosphate). The surface is very smooth with no P (PO43−) evident in the EDS spectrum (Fig. 7, inset), indicating little or no phosphate sorption as the detection of monolayer coverage by EDS is impossible. The EDS spectrum is similar to that of the calcite/water control sample (Fig. 6, inset). This supports the wet chemistry results (Fig. 5), which show that very little PO43− sorption (<0.3 mg/g) occurs at high pH.
Figure 8 shows the SEM image of calcite exposed to fluoride (as potassium fluoride). The figure is characterized by sheets of lighter areas overlaying slightly darker areas with numerous smaller particles or islets. Magnification of these areas (Fig. 8, arrow) shows the presence of globular precipitate chains that coalesce on top of the smooth darker calcite areas (labeled “Y”). EDS spectrum of area “X” (Fig. 8, inset) shows that Ca and F are present, with F at a concentration of ∼3 counts per second. This contrasts with area “Y,” which shows only Ca peaks (not shown) characteristic of calcite. It is therefore apparent that fluorite forms in discrete areas, eventually joining together to produce sheets of fluorite on top of the bulk calcite surface.
When calcite is exposed to both F− and PO43−, SEM images (Fig. 9, arrow) show pyramidal growths with globular precipitates at the apex. EDS spectrum of the apex precipitates reveals that P (PO43−) is strongly present together with very small amounts of F (<0.75 counts per second), suggesting that PO43− has adsorbed to the globular CaF2 precipitate. The results of the surface analysis are further evidence for a sorption mechanism and concur with the batch experimental results.
Conclusion
Experimental results show that PO43− reduces the removal of fluoride by calcite. The effect of PO43− on the removal of fluoride was found to be surface area dependant. At identical initial PO43− concentrations, larger calcite solid–liquid ratios (high surface area) remove more fluoride than smaller calcite solid–liquid ratios, suggesting a surface adsorption mechanism, and although the amount of surface calcium adsorption sites is small (2.3 μmol/g), adsorption of PO43− has a significant impact on calcite dissolution and consequently the amount of F− precipitated as CaF2.
PHREEQ was used to model the F−/PO43−/calcite system. The model predicts that below pH 11.6, PO43− has no influence on the precipitation of fluoride as CaF2. The model results are inconsistent with the observed experimental results and indicate that the effects of adsorption on the surface structure of calcite require further research before incorporation into geochemical models. Further, the analytical and SEM-EDS surface analysis evidence presented suggests that secondary adsorption of PO43− and F− onto fluorite occurs, making the application of current geochemical models even more difficult.
The ability of calcite to sequester inorganic contaminants requires a good knowledge of the processes occurring at the water–mineral interface. Despite recent experimental and theoretical efforts, such as the application of surface complexation modeling to carbonate minerals, the present understanding of the topic remains unsatisfactory (Marini, 2007). Consequently, researchers and decision makers should use geochemical models with extreme caution when dealing with calcite-based remediation strategies.
Footnotes
Acknowledgments
This project was funded by the Hydro Aluminium Kurri Kurri Pty Ltd. and the Australian Research Council (ARC) through a linkage grant LP0347747.
Author Disclosure Statement
No competing financial interests exist.