
Abstract
Abstract
Size distributions of aerobiological concentrations in commuter buses in northern Taiwan were examined from December 2006 until May 2007. Two six-stage (>7, 4.7–7, 3.3–4.7, 2.1–3.3, 1.1–2.1, and 0.65–1.1 μm) cascade impactors were used to collect viable bacteria and fungi. Results showed that bacterial concentrations ranged from 113 to 601 colony forming units (CFU)/m3 and averaged 282 CFU/m3. Fungal concentrations ranged from 42 to 2,193 CFU/m3 and averaged 674 CFU/m3. Additionally, the highest fractions occurred in the fourth stage (2.1–3.3 μm) for both bacteria and fungi. Respirable fractions (particles smaller than 4.7 μm in aerodynamic diameter) for bacteria and fungi were 68% and 78%, respectively, which are higher than those in other studies. The number median diameters of the total bacterial and fungal concentration were 1.67 and 2.67 μm in winter and 3.02 and 2.30 μm in spring, respectively. Airborne microorganisms are often associated with asthma, rhinitis, sick building syndrome, and hypersensitivity pneumonitis. Although total bacterial or fungal concentrations did not exceed the recommended standard (1,000 CFU/m3) in Taiwan, we found a relatively high respirable fraction in commuter buses. The relationship between bioaerosol aerodynamic diameter and a greater health risk for sensitive commuters, such as those with asthma, warrants further investigation in the future. The small sample size is a limitation in this study and the results indicated that there were no statistical significances found among bacterial/fungal concentrations, fungal respirable fraction, and seasons (p > 0.05). However, statistical significance was found between bacterial respirable fraction, the fourth fraction, and seasons (p < 0.05). Bioaerosol concentration measurements in commuter buses performed by this study provide basic information for further research on exposure assessment.
Introduction
Airborne microorganisms are often associated with asthma (Ross et al., 2000), rhinitis (Windsor and Johnson, 2006), sick building syndrome (Bolashikov and Melikov, 2009), and hypersensitivity pneumonitis (Lacey and Dutkiewicz, 1994). Between 1980 and 1987, the prevalence of asthma reported in the United States increased by nearly 30%, from 3% to 4% of all Americans (CDC, 1990). Asthma prevalence has also advanced in Taiwan over the last 2–3 decades, especially for children. In Taipei City, the prevalence of asthma in school children increased from 1.3% in 1974 to 19.0% in 2003 (Huang, 2005). A significant fraction of this increase is due to improved detection methods of the disease. However, many indoor environmental factors have been implicated as causative or triggering factors for asthma (Ross et al., 2000), including fungal exposure. Such exposure, especially early in life, may influence the manner in which the immune system responds to subsequent antigen exposures (Goldman and Huffnagle, 2009; Jung et al., 2009). Fungi have long been recognized as an important source of allergies in patients with atopic disease. A number of recent studies have also indicated that indoor levels of airborne bacteria or endotoxins are associated with increased asthma severity (Michel et al., 1996; Rizzo et al., 1997).
Researchers have performed numerous studies to assess personal exposure to indoor air pollution in vehicles. These studies tended to focus on exposure to particulate matter (Riediker et al., 2003; Pio et al., 2006; Zeldin et al., 2006), carbonyl compounds (Pang and Mu, 2007), and volatile organic compounds (Riediker et al., 2003; Shiohara et al., 2005). Rule et al. (2008) has taken samples from cars driving behind poultry trucks for 17 miles. Results indicate an increase in the number of total aerobic bacteria isolated from air and surface samples and suggest that food animal transport in open crates introduces a novel route of exposure to harmful microorganisms and may disseminate these pathogens into the general environment. Jo and Lee (2008) found that elevated bioaerosol concentrations occurred 5–15 min after the use of an automobile or household air conditioner, and these concentrations decreased over time. However, few studies investigate the level of airborne bioaerosols in transportation, with most of studies measuring the bioaerosol concentrations in office and hospitals (Chao et al., 2002; Lee and Jo, 2006; Kim and Kim, 2007; Dutil et al., 2009), in agricultural setting (Plummer et al., 2009), and seldom in public transport vehicles (Lee and Jo, 2005).
This study investigates the size distributions of airborne bioaerosol concentrations inside buses in Chung Li City in northern Taiwan. To the best of our knowledge, only Lee and Jo (2005) have investigated airborne fungi and bacteria in cars and public buses. There are currently no formally regulated laws for indoor air quality in Taiwan, and this preliminary study can thus provide valuable information to the Taiwanese government with regard to this issue.
Materials and Methods
Sampling information
The commuter buses were selected randomly at Chung-Li City in northern Taiwan. The buses were made by Hino (model LRK1MRK). The maximum capacity is about 55 people for most buses. There are two doors in a bus, which stops approximately every 5 min and stops about 10 s for every stop. The buses are powered by diesel with air-conditioning system and no windows can be opened during traveling. All the seats in the buses were plastic and would be cleaned regularly. The sampling dates were scheduled from December 2006 to May 2007. Sampling was undertaken in the morning while the buses were traveling their daily routes. Averaged 15 commuters in the buses were recorded by a counter during 10 min. The sampler was located in the middle of the bus. The windows were closed all the time and the door opening and closing patterns were similar during winter and spring. Additionally, 12 samples were nonsimultaneously taken twice a month in the same city. Two six-stage microbial cascade impactors (TE-10-830; Tisch Environmental, Inc.) were used to sample airborne bacteria and fungi. The aerodynamic diameter ranges for each stage were as follows: stage 1, >7 μm; stage 2, 4.7–7 μm; stage 3, 3.3–4.7 μm; stage 4, 2.1–3.3 μm; stage 5, 1.1–2.1 μm; and stage 6, 0.65–1.1 μm. The sampling flow rate was 28.3 L/min, the sample integration time was 15 min, and the sampling height was approximately 1.5 m. Samples were taken in the morning 2–4 times every month depending on the weather. A total of 32 samples (192 plates) were analyzed (6 samples for winter and 10 samples for spring), including 16 samples (96 plates) for bacteria and 16 samples (96 plates) for fungi.
Measurement and analysis
Trypticase soy agar with cycloheximide and malt extract agar with chloramphenicol were used to capture bacterial and fungal samples (Jo and Li, 2008; Tsai and Liu, 2009), respectively. Field blanks were also tested during the sampling. After sampling, the Petri dishes were incubated for 48 h at 37°C (Taiwan EPA method E301.11C) for bacteria and 120 h at 25°C (Taiwan EPA method E401.11C) for fungi. The concentrations of airborne bacteria and fungi (colony forming units [CFU]/m3) were calculated by dividing the total colony counts on the agar plates by the air volume that was sampled. The fractions for each stage of bacterial and fungal concentrations are defined in equations (1)–(4). Further, respirable fraction is defined in this study as the fraction or aerosols <4.7 μm in aerodynamic diameter, by adding stages 3–6. The respirable fraction represents the fraction of bioaerosols that penetrates into the human trachea and bronchioles (Kim and Kim, 2007).
where B denotes the bacterial fraction (%); Ci is the i stage concentration for bacteria, which is 1 for the first stage (>7 μm), 2 for the second stage (4.7–7 μm), 3 for the third stage (3.3–4.7 μm), 4 for the fourth stage (2.1–3.3 μm), 5 for the fifth stage (1.1–2.1 μm), and 6 for the sixth stage (0.65–1.1 μm); and Cb is the total concentration of bacteria.
where F denotes the fungal fraction (%), Ci is the i stage concentration for fungi, and Cf is the total concentration of fungi.
where Rb denotes the respirable fraction for bacteria (Kim and Kim, 2007).
where Rf denotes the respirable fraction for fungi.
Indoor pollutants (CO and HCHO) and environmental parameters (CO2, temperature, and relative humidity) were also recorded during sampling. The CO, CO2, temperature, and relative humidity were monitored continuously by an AirBoxx monitoring system (KD Engineering). The HCHO level was monitored continuously by a Formaldemeter monitoring system (PPM).
Data analysis
The Kruskal–Wallis test, a nonparametric method, by SPSS 13.0 was conducted to determine the result of statistics. The test was performed to examine the different concentrations in airborne bacterial and fungal concentrations, stage fractions, and respirable fractions over two seasons. An analysis of variance was used to compare the CO, CO2, HCHO, temperature, and humidity datasets. This small sample size would be a limitation in this study.
Results and Discussion
Level of airborne bacteria and fungi in commuter buses
There were no colonies grown on plates for field blank test. Table 1 compares the commuter exposure to airborne bacteria and fungi for all 32 samples. The mean concentrations for bacteria and fungi were 282 and 599 CFU/m3, respectively. The Taiwan EPA recommends a maximum of 1,000 CFU/m3 for both airborne bacteria and fungi in transportation. None of the bacterial samples exceeded the recommended standard in Taiwan, but three fungal samples taken in March and April did (data not shown). The mean concentration for bacteria in winter and spring were 279 and 282 CFU/m3, respectively, whereas that for fungi in winter and spring were 432 and 640 CFU/m3, respectively. Seasonal bacterial concentrations found in this study were comparable to those found indoors by Lee and Jo, who found 280 CFU/m3 in winter and 330 CFU/m3 in summer. Fungal concentrations of 100 CFU/m3 reported by Lee and Jo during winter were lower than those found by us inside buses, but summer concentrations of 460 CFU/m3 were comparable to those found in this study. Lee and Jo (2005) indicated that the in-vehicle sources were not strong enough to outweigh the outdoor concentrations that penetrated inside the vehicle, especially when there were not many floor mats or clothbound seats inside the buses. The mean concentrations for bacteria and fungi were 36 and 175 CFU/m3, respectively, in the city. However, the samples were not taken simultaneously with the bus samples. The results showed that the bacterial and fungal concentration were higher in the buses than in the ambient air of the city. The outdoor concentrations contribute not so much to concentrations in the buses. There was no statistical significance (p > 0.05) found among bacterial/fungal concentrations in the buses and outdoors.
n = 16 (6 for winter, 10 for spring).
No statistical significance was found (p > 0.05).
B1, >7 μm; B2, 4.7–7 μm; B3, 3.3–4.7 μm; B4, 2.1–3.3 μm; B5, 1.1–2.1 μm); and B6, 0.65–1.1 μm.
Statistical significance is found (p < 0.05).
F1, >7 μm; F2, 4.7–7 μm; F3, 3.3–4.7 μm; F4, 2.1–3.3 μm; F5, 1.1–2.1 μm; and F6, 0.65–1.1 μm.
Average number of people occupying buses during sampling time.
LOD, limit of detection; SD, standard deviation; CFU, colony forming units.
The mean fractions of airborne bacteria for B1–B6 were 18.3%, 13.9%, 17.7%, 27.2%, 17.9%, and 5.15%, respectively. The highest fraction occurred in the fourth stage (2.1–3.3 μm). Additionally, the mean fractions of airborne fungi for F1–F6 were 12.0%, 9.77%, 17.7%, 37.6%, 21.7%, and 1.20%, respectively. The highest fraction occurred in the fourth stage (2.1–3.3 μm). The results of Lin and Li (1996) also indicated that the maximum concentrations of the ambient fungus allergens range in size from 2.1 to 3.3 μm, which is the same as that in this study. The sampling location was Taipei City in the Lin and Li's study. The highest concentration happened in the size range of 2.1–3.3 μm in both outdoors (Lin and Li, 1996) and buses (this study). The fungal concentrations inside buses were influenced by those outdoors. Table 1 also shows the mean Rb and Rf. In the study by Kim and Kim (2007) on air inside public buildings in Korea, Rb and Rf ranged from 32.0%–38.1% and 58.9%–69.1%, respectively, indicating that the respirable fraction of indoor airborne bacteria is higher than that of outdoor airborne bacteria. Further, Rb = 67.9% and Rf = 78.2% in this study are higher than those in the study by Kim and Kim (2007) and other studies (Lee and Kuo, 1993; Pastuszka et al., 2000) for both bacteria and fungi. The results of this study were different from those of other studies probably because of the various weather conditions and localized characteristics of bioaerosols. The dominant tropospheric particles in Upper Silesia (Pastuszka et al., 2000) are created by inefficient coal combustion. The highly polluted outdoor air will be the main source of particulate matter in the indoor environment. Bacteria or other bioaerosols may attach to particles and be transported with them. So the microenvironment is different among buses and buildings or cities. The buses in this study are with air-conditioning system and no windows were opened during traveling, besides occupied with passengers from different places. This created various circulative microenvironments, which were easily influenced by the passengers in the buses. Bioaerosols could follow those microenvironments in air with particulates or passengers, and the typical size distribution of bacteria or fungi can be changed, resulting in altered size distributions of respirable bacteria and fungi.
Although the total bacterial or fungal concentrations did not exceed the recommended standard in Taiwan, the percentage of respirable fraction found in this study could mean possible adverse health effects for sensitive commuters, because these particles deposit deep into the lungs, and hence, it warrants further investigation in the future.
The average concentrations of CO and HCHO also did not exceed the recommended standards (9 and 0.1 ppm, respectively) in Taiwan, although the CO2 concentration was over its standard (1,000 ppm). This was possibly due to the passengers' activities in the buses with windows closed and CO2 dilution with outside air was limited. Based on the limited data, the relationship between CO, CO2, and HCHO with the bacterial and fungal concentrations was not clear in this study.
Seasonal variation of airborne bacteria and fungi in commuter buses
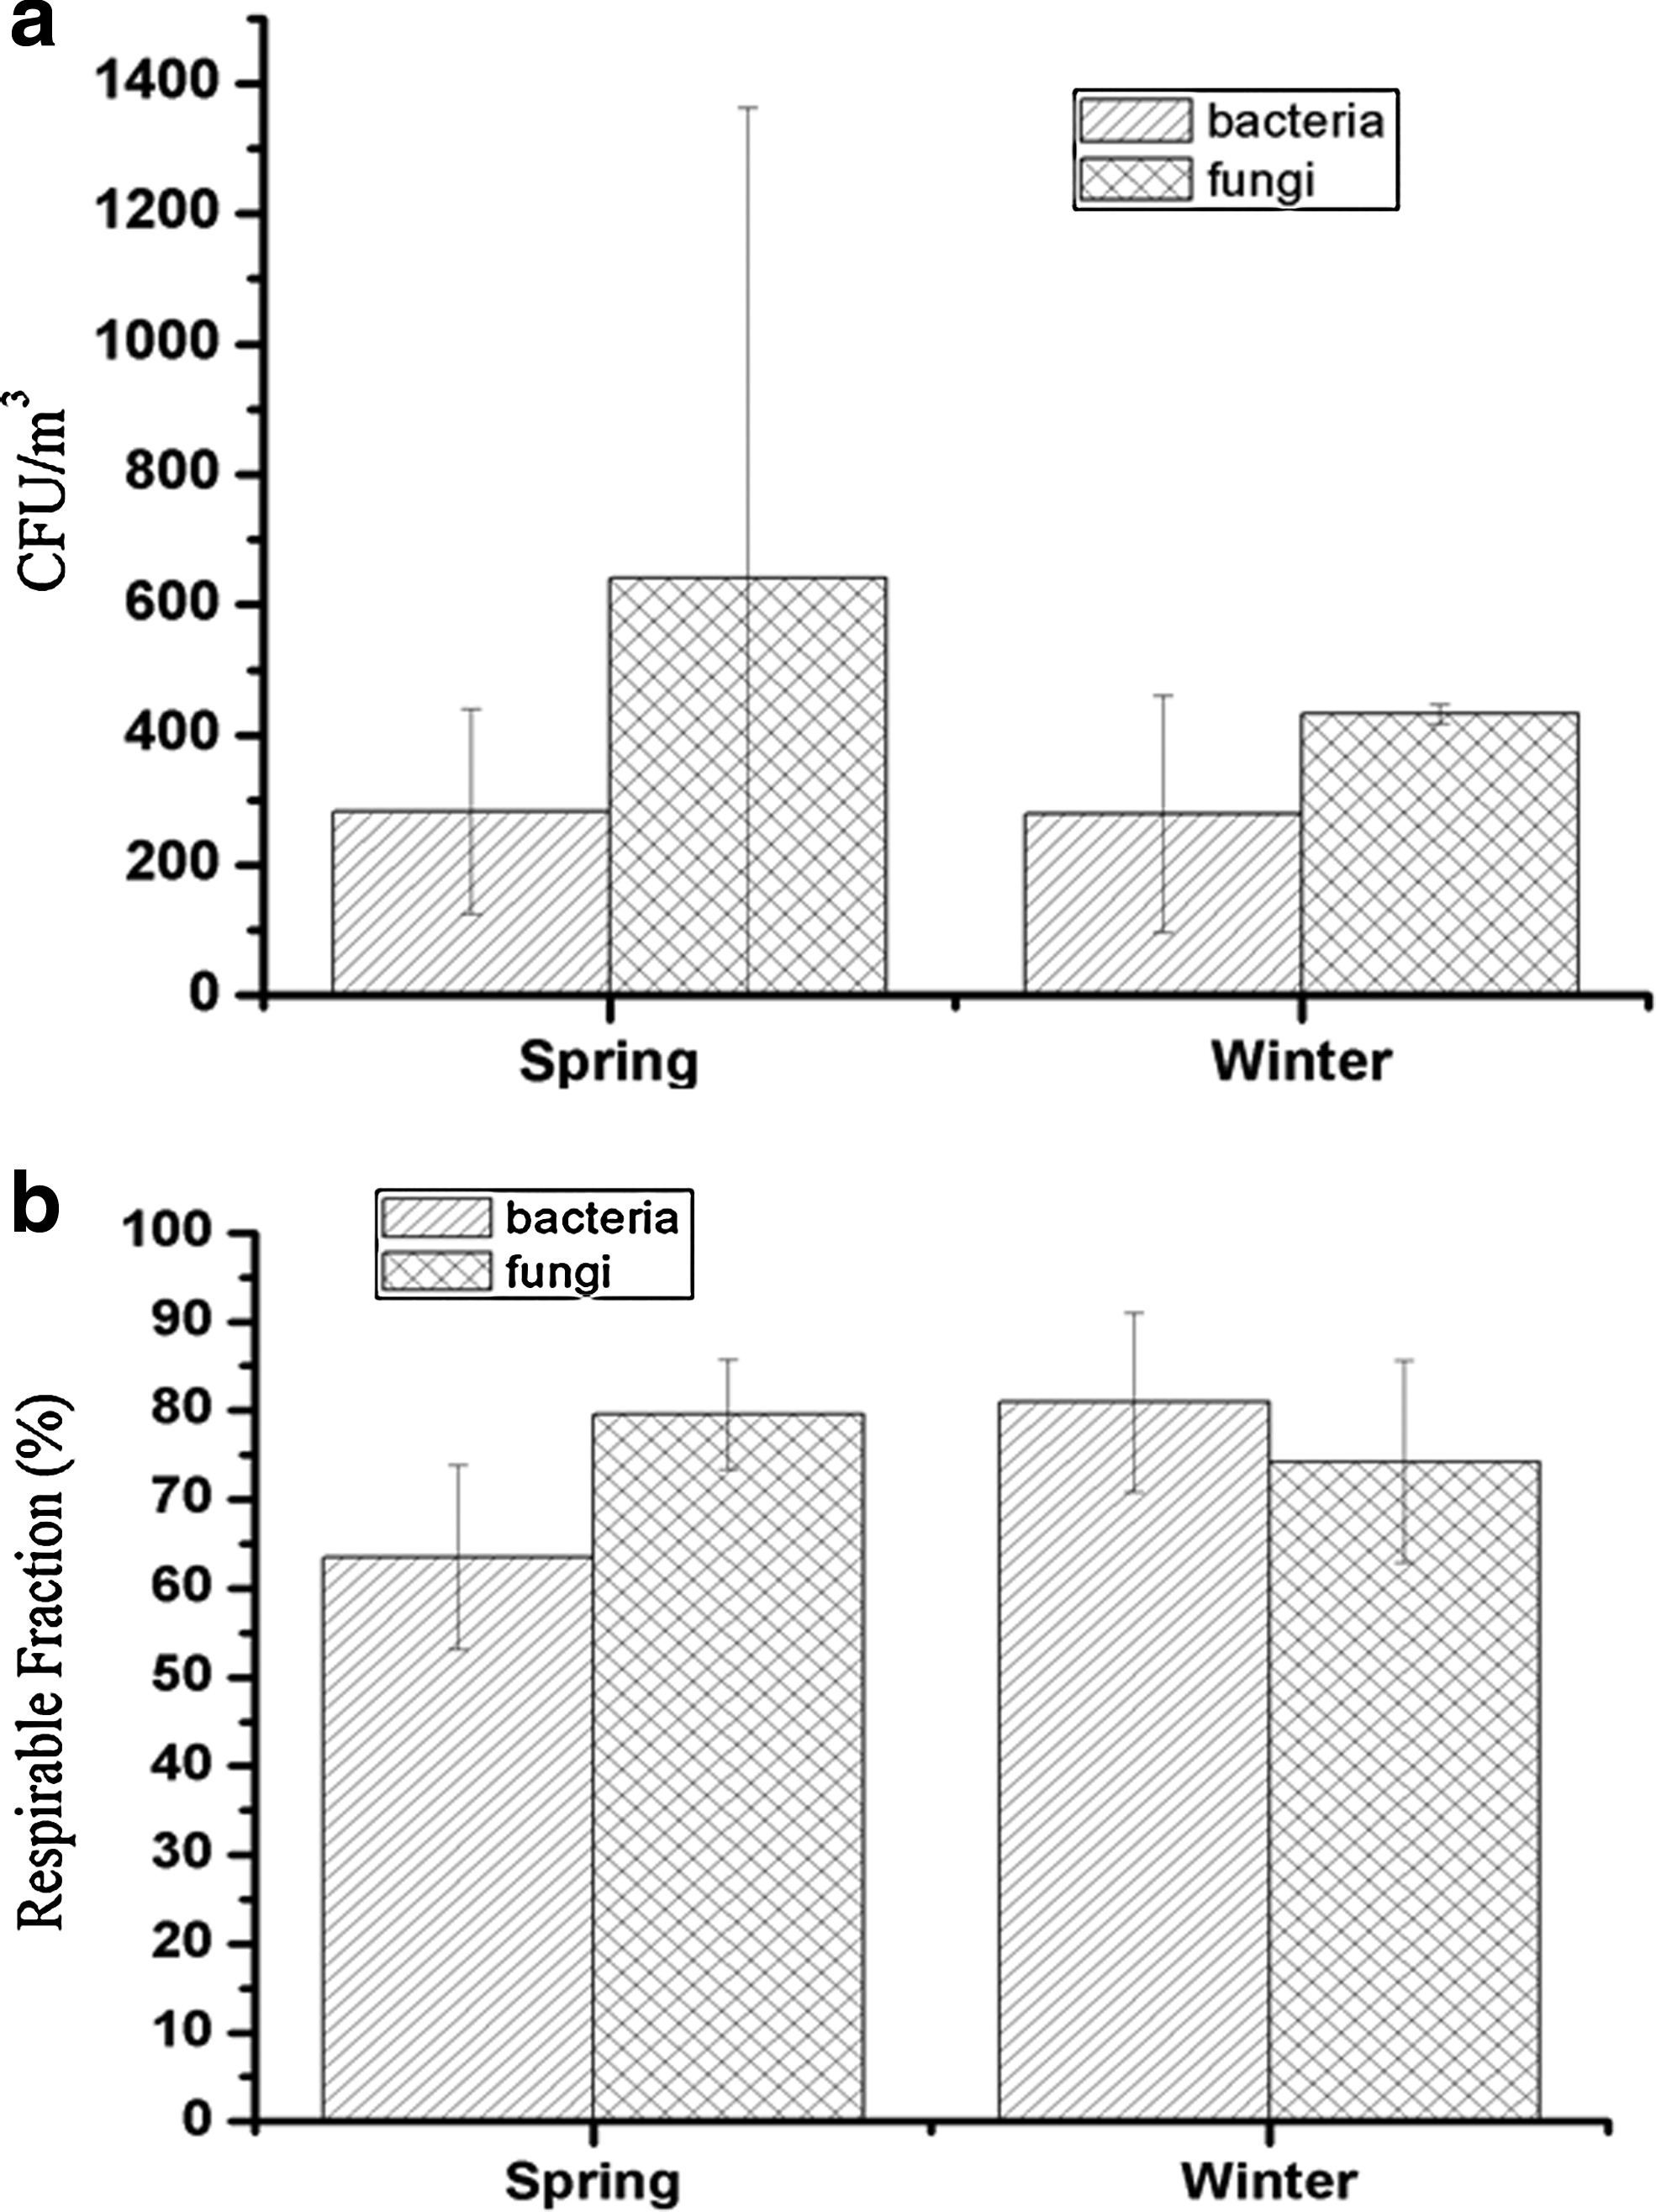
Because of a limited budget, the samples were only taken in winter and spring. Fig. 1a illustrates the seasonal distribution of total airborne bacterial and fungal concentrations in commuter buses. The averaged fungal concentration appeared to be higher than the averaged bacterial concentration in both spring and winter, but was not statistically significant (p > 0.05). The averaged bacterial concentrations were not statistically different (p > 0.05) in both spring and winter. The averaged fungal concentration was 32.5% difference (p > 0.05) between spring and winter. The fungal concentrations are comparable with those in the study by Abdel-Hameed et al. (2009), who conducted measurements on airborne bacterial and fungal composition on the roof of an ∼15-m-high building in the industrial town with 500,000 inhabitants of Helwan, Egypt. The temperature ranged between 12°C and 43°C, and relative humidity ranged between 23% and 69.5%, which was different from the environment in Taiwan. Although the sampling environment was different, the indoor fungal concentrations were influenced by the outdoors environment. Burge et al. (1995) noted that indoor airborne fungal concentrations were correlated with outdoor concentrations, type and rate of ventilation, and the indoor levels. In addition, some studies focused on the seasonal variation of aerosolized fungi. The work of LeBouf et al. (2008) is one such example in which seasonal and diurnal variability in airborne molds in indoor residential environments were investigated and indoor mold levels of 26 times higher in the summer than those in the winter were found.
Seasonal
Huang et al. (2002) showed a seasonal distribution of airborne bacteria and fungi in municipal landfill sites. In that study, the total culturable bacteria and fungal concentrations peaked in winter in closed or undergoing-closure landfill areas. Further, Wu et al. (2007) investigated fungal levels in a subtropical metropolis and indicated that the highest total fungal levels occurred in June and July for urban and rural areas, respectively. Seasonal variations for bacterial and fungal concentrations thus appear to depend on the specific sampling targets. This is why we need more research on specific microenvironments.
Fig. 1b shows the seasonal respirable fractions of total airborne bacteria and fungi concentrations in commuter buses in northern Taiwan. The Rb was higher in winter than in spring (p < 0.05). However, the Rf was higher in spring than in winter (p > 0.05). Statistical significance for the seasonal Rbs was observed. Both the Rb and Rf were over 60% in spring and winter. Although the total concentration of bacteria was smaller than that of fungi, the Rb was higher than Rf in winter. More attention should thus be paid to the high Rb with regard to the higher prevalence rates of asthma, pneumonia, and influenza, which always occur in winter. To our knowledge, the reference literatures related to the respirable fractions of bioaerosols in this type of public transit are limited. The results of this study thus provide the basic information needed to conduct further research on exposure assessment, especially for sensitive individuals.
Fig. 2 shows the seasonal individual fractions of total airborne bacterial and fungal concentrations in commuter buses. Fig. 2a indicates that the highest fractions for bacteria in both spring and winter happened in the fourth stage. The individual fractions of the first (p < 0.05), second (p < 0.05), third (p > 0.05), and sixth (p > 0.05) stages for bacteria were higher in spring than those in winter. However, the individual fractions of the fourth (p < 0.05) and fifth (p > 0.05) stages were higher in winter than in spring. Statistical significance was found among the first, second, third, and sixth stages and the fourth stage in winter (p < 0.05); however, only the sixth stage showed statistical significance with the fourth stage in spring (p < 0.05). The risk of illness associated with airborne contaminants is obviously a public concern, and the collected airborne microorganisms lower than 3.3 μm will be easily deposited in the secondary and terminal bronchi within the human body. This can lead to adverse health effects, especially for sensitive individuals.

Seasonal individual fraction of total airborne
A different pattern was seen for fungi in Fig. 2b. The highest fractions for fungi in both spring and winter happened in the fourth stage. The individual fractions of the second (p > 0.05) and fifth (p > 0.05) stages for fungi were higher in spring than in winter. However, the individual fractions of the first (p < 0.05), third (p < 0.05), fourth (p > 0.05), and sixth (p > 0.05) stages were higher in winter than in spring. Statistical significance was found among the first to sixth stages and the fourth stage in both winter (p < 0.05) and spring (p < 0.05). The identification of fungal genera thus warrants further investigation in the future. The results of statistical analysis showed that there were no statistical significances among bacterial/fungal concentrations, fungal respirable fraction, and seasons (p > 0.05). However, statistical significance was found among Rb, the fourth fraction, and seasons (p < 0.05). Further, the first, second, and fourth stages for bacteria also showed statistical significances with seasons (p < 0.05). The first and third stages for fungi showed statistical significances with seasons (p < 0.05). The small sample size is a limitation in this study. The result was probably due to the sample size not big enough to distinguish differences among seasons.
Size distribution of airborne bacteria and fungi in commuter buses
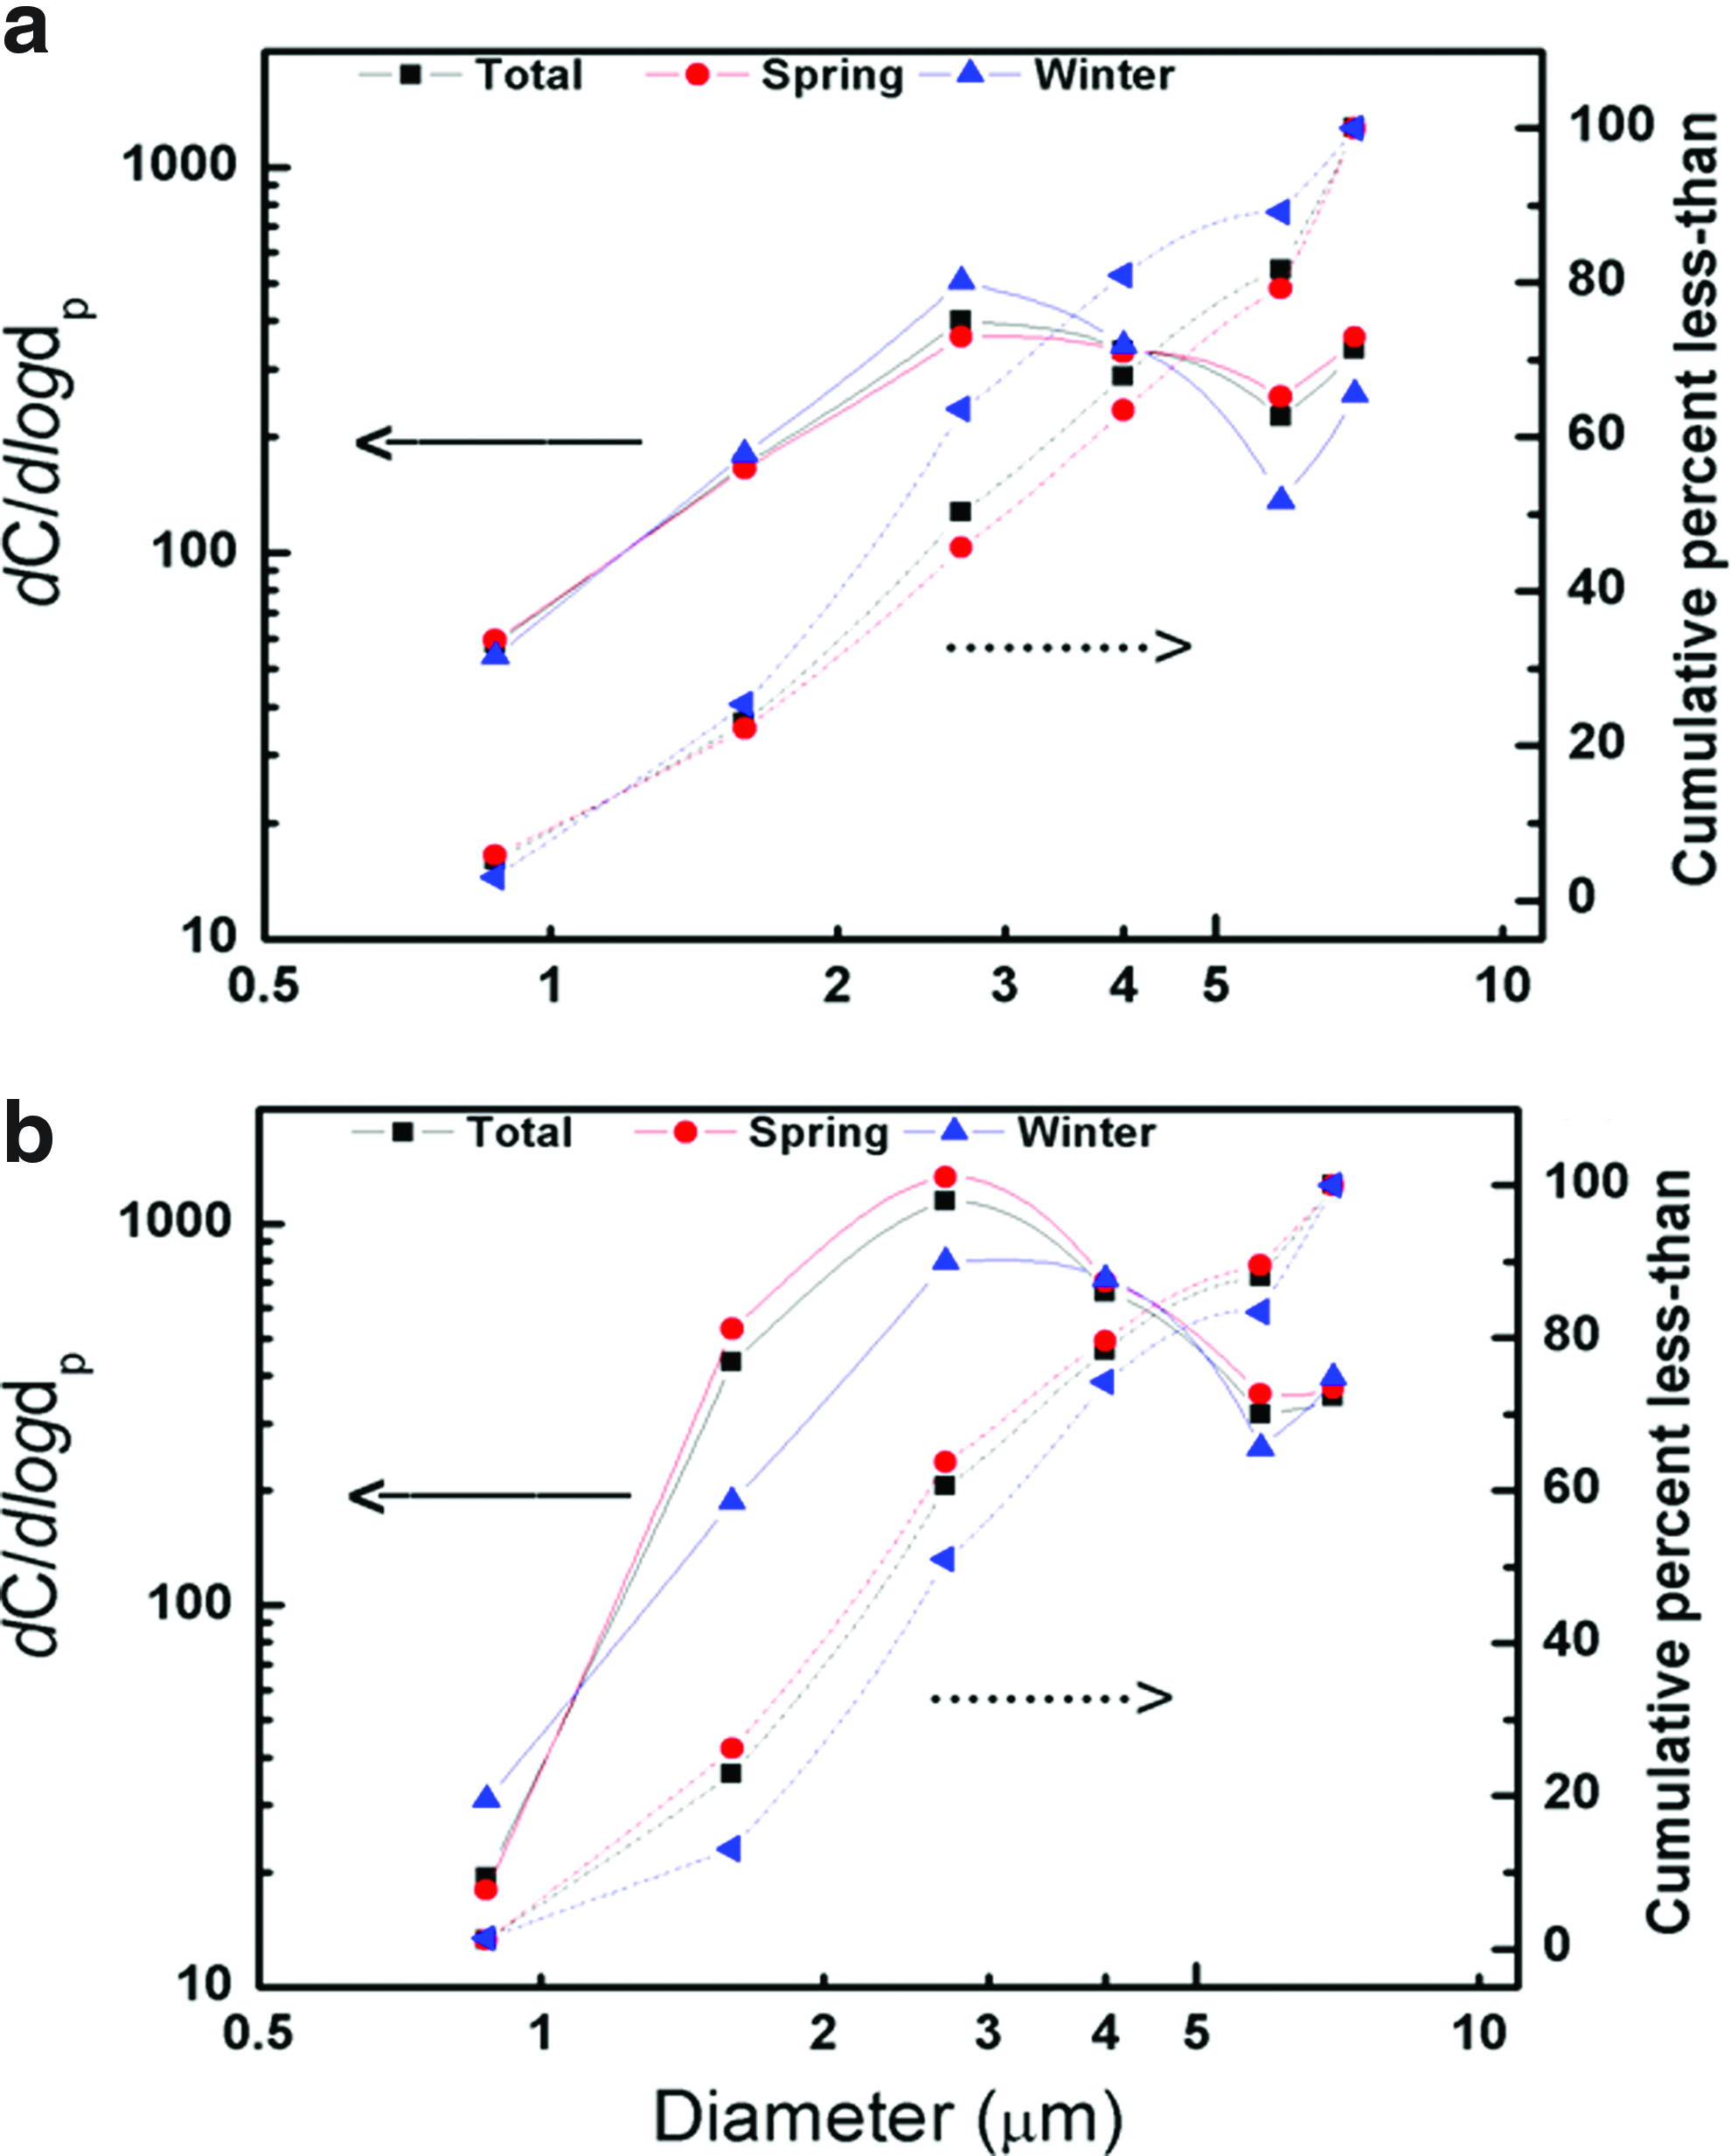
Fig. 3 shows the size distribution of total airborne bacterial and fungal concentrations in commuter buses. Number median diameter (NMD) is the diameter dividing the total number into two halves (Yang et al., 2005). The NMD of the total bacterial concentration was 3.01 and 1.67 μm in spring and winter, respectively. The NMD of the total fungal concentration was 2.30 and 2.67 μm in spring and winter, respectively. The bacterial concentration was 282 and 279 CFU/m3 in spring and winter; however, the NMD in winter was 1.34 μm smaller than that in spring. The bacterial concentration was 153 CFU/m3 lower than the fungal concentration in winter, but the NMD for bacteria was 1 μm smaller than that for fungi in winter. Further, there is a major peak in the 2.1–3.3 μm size range for bacteria. The concentration was 507 CFU/m3/d log Dp in winter and 364 CFU/m3/d log Dp in spring. There is also a major peak in the 2.1–3.3 μm size range for fungi, and the concentration was 1,325 CFU/m3/d log Dp in spring and 796 CFU/m3/d log Dp in winter. The fluctuation of concentration (CFU/m3/d log Dp) for fungi ranged between 18 and 1,325 CFU/m3/d log Dp in spring and 31–796 CFU/m3/d log Dp in winter. For bacteria, it ranged between 59 and 364 CFU/m3/d log Dp in spring and 54–507 CFU/m3/d log Dp in winter. These mean concentration, NMD, and CFU/m3/d log Dp were all not statistically significant (p > 0.05). Airborne microorganisms are often associated with asthma, rhinitis, sick building syndrome, and hypersensitivity pneumonitis (Lacey and Dutkiewicz, 1994; Ross, et al., 2000; Windsor and Johnson, 2006; Bolashikov and Melikov, 2009). The relationship between bioaerosol aerodynamic diameter and asthma prevalence warrants further investigation in the future.
Size distribution and cumulative percentage of total airborne
Conclusions
To the best of our knowledge, there are only a few studies on the measurement of bioaerosol concentrations in commuter buses. Although the total bacterial and fungal concentrations did not exceed the recommended standard in Taiwan, the relatively high respirable fraction in commuter buses implies a greater risk for sensitive commuters, especially statistical significance was found among Rb, the fourth fraction, and seasons (p < 0.05). The small sample size is a limitation in this study and the results indicated that there were no statistical significances found among bacterial/fungal concentrations, fungal respirable fractions, and seasons (p > 0.05). Nevertheless, the results of this study provide basic information for further research on exposure assessment.
Footnotes
Acknowledgments
The author thanks Chen I-Wei, Chang Wei-Ren, and Zhu Yun-Ru of the BioMonitoring and Environmental Lab for helping with sample collection.
Author Disclosure Statement
No competing financial interests exist.