
Abstract
Abstract
The present technology to handle end-of-life vehicles usually generates about 20–30% of the automobile shredder residue (ASR) of a new car in weight, which is disposed of via landfill or combustion at cement kilns and incinerators. Recently, surveys to compare various techniques such as pyrolysis, gasification, and melting to treat ASR with a better recycling rate have been reported. Gasification and melting processes are operated at high temperatures with the destruction of hazardous components and production of gases, mainly CO and H2, which can be utilized as fuel gas or raw chemicals after cleaning. Also the remaining slag solid portion is stable enough without being hazardous and it can be utilized as recycled material. In this study, ASR sampled from a shredding company was tested in a laboratory-scale gasification and melting process to characterize the gaseous and slag products. At higher temperatures and a lower air equivalent ratio (ER), CO, H2, and CH4 emission increased but CO2 and N2 decreased. C2H6 concentrations changed, but different ERs were not clear. However, there was an increasing tendency of its emission amount at lower temperatures. Carbon conversion efficiency, gas yield (Gy), and CO2 increased with an increasing ER. Thus, when the temperature was higher, Gy and carbon conversion efficiency increased. By-product yield was related to carbon conversion efficiency and Gy. Characteristics of slag produced, such as segregation of metal, leaching property, composition, and surface morphology, were also analyzed.
Introduction
Present technology to handle ELVs usually generates around 20–30% of the ASRs of a new car in weight at shredding facilities, which are disposed of via landfill or combustion. In the future, it is expected that disposing the organic portions of waste will not be permitted at the landfills. The recycling rate of ELVs must be above 95% of a new vehicle because of forthcoming regulations going into effect around 2015 in some countries such as EU, Japan, and Korea. The EU Directive (2000/53/EC, 2000) emphasizes minimizing the impact of ELVs on the environment and improving the quality of environment and energy conservation. Several technologies are currently under utilization and development, including conventional means such as compaction, solidification (Kusaka and Iida, 2000), and incineration (Trouve et al., 1998). Recently, heat recovery methods such as pyrolysis, gasification, and injection into blast furnaces have also been considered (Galvagno et al., 2001; Horii and Iida, 2001; Roy and Chaala, 2001; Kikuchi et al., 2005). Gasification and melting technology are operated at high temperatures with a high destruction of hazardous components and the production of syngas, mainly consisting of CO and H2, which can be utilized as fuel gas or raw chemicals after cleaning.
In this study, ASR sampled from a domestic shredding company was experimented on at a lab-scale gasification and melting process, which is similar to the shaft-type gasification melting furnace used for municipal waste treatment. During the experiments, the characteristics of syngas, tar, and residue (slag) produced were analyzed to provide the information to further utilize them as fuel and recyclable materials in scaled-up plants.
Experimental
Sampling of ASR feedstock
ASR feedstocks used in this study were sampled from a domestic shredding company. ASR was classified into three types: heavy fluff, light fluff, and sand/soil based on the process shown in Fig. 1. The portions of heavy fluffs, light fluffs, and soil/sand in ASR by weight were 89.2%, 8.1%, and 2.7%, respectively. Generally, heavy fluffs are used as a substitute fuel in cement kilns because of its high calorific value. Nonferrous materials are recovered from sand/soil by mechanical sorting and are then disposed off at landfills. Because of the low heating value (LHV) and high transportation costs involved with low density (sponges, etc.), light fluffs are mainly land filled. Thus, in this study, light fluff was used as feedstock for gasification experiment.
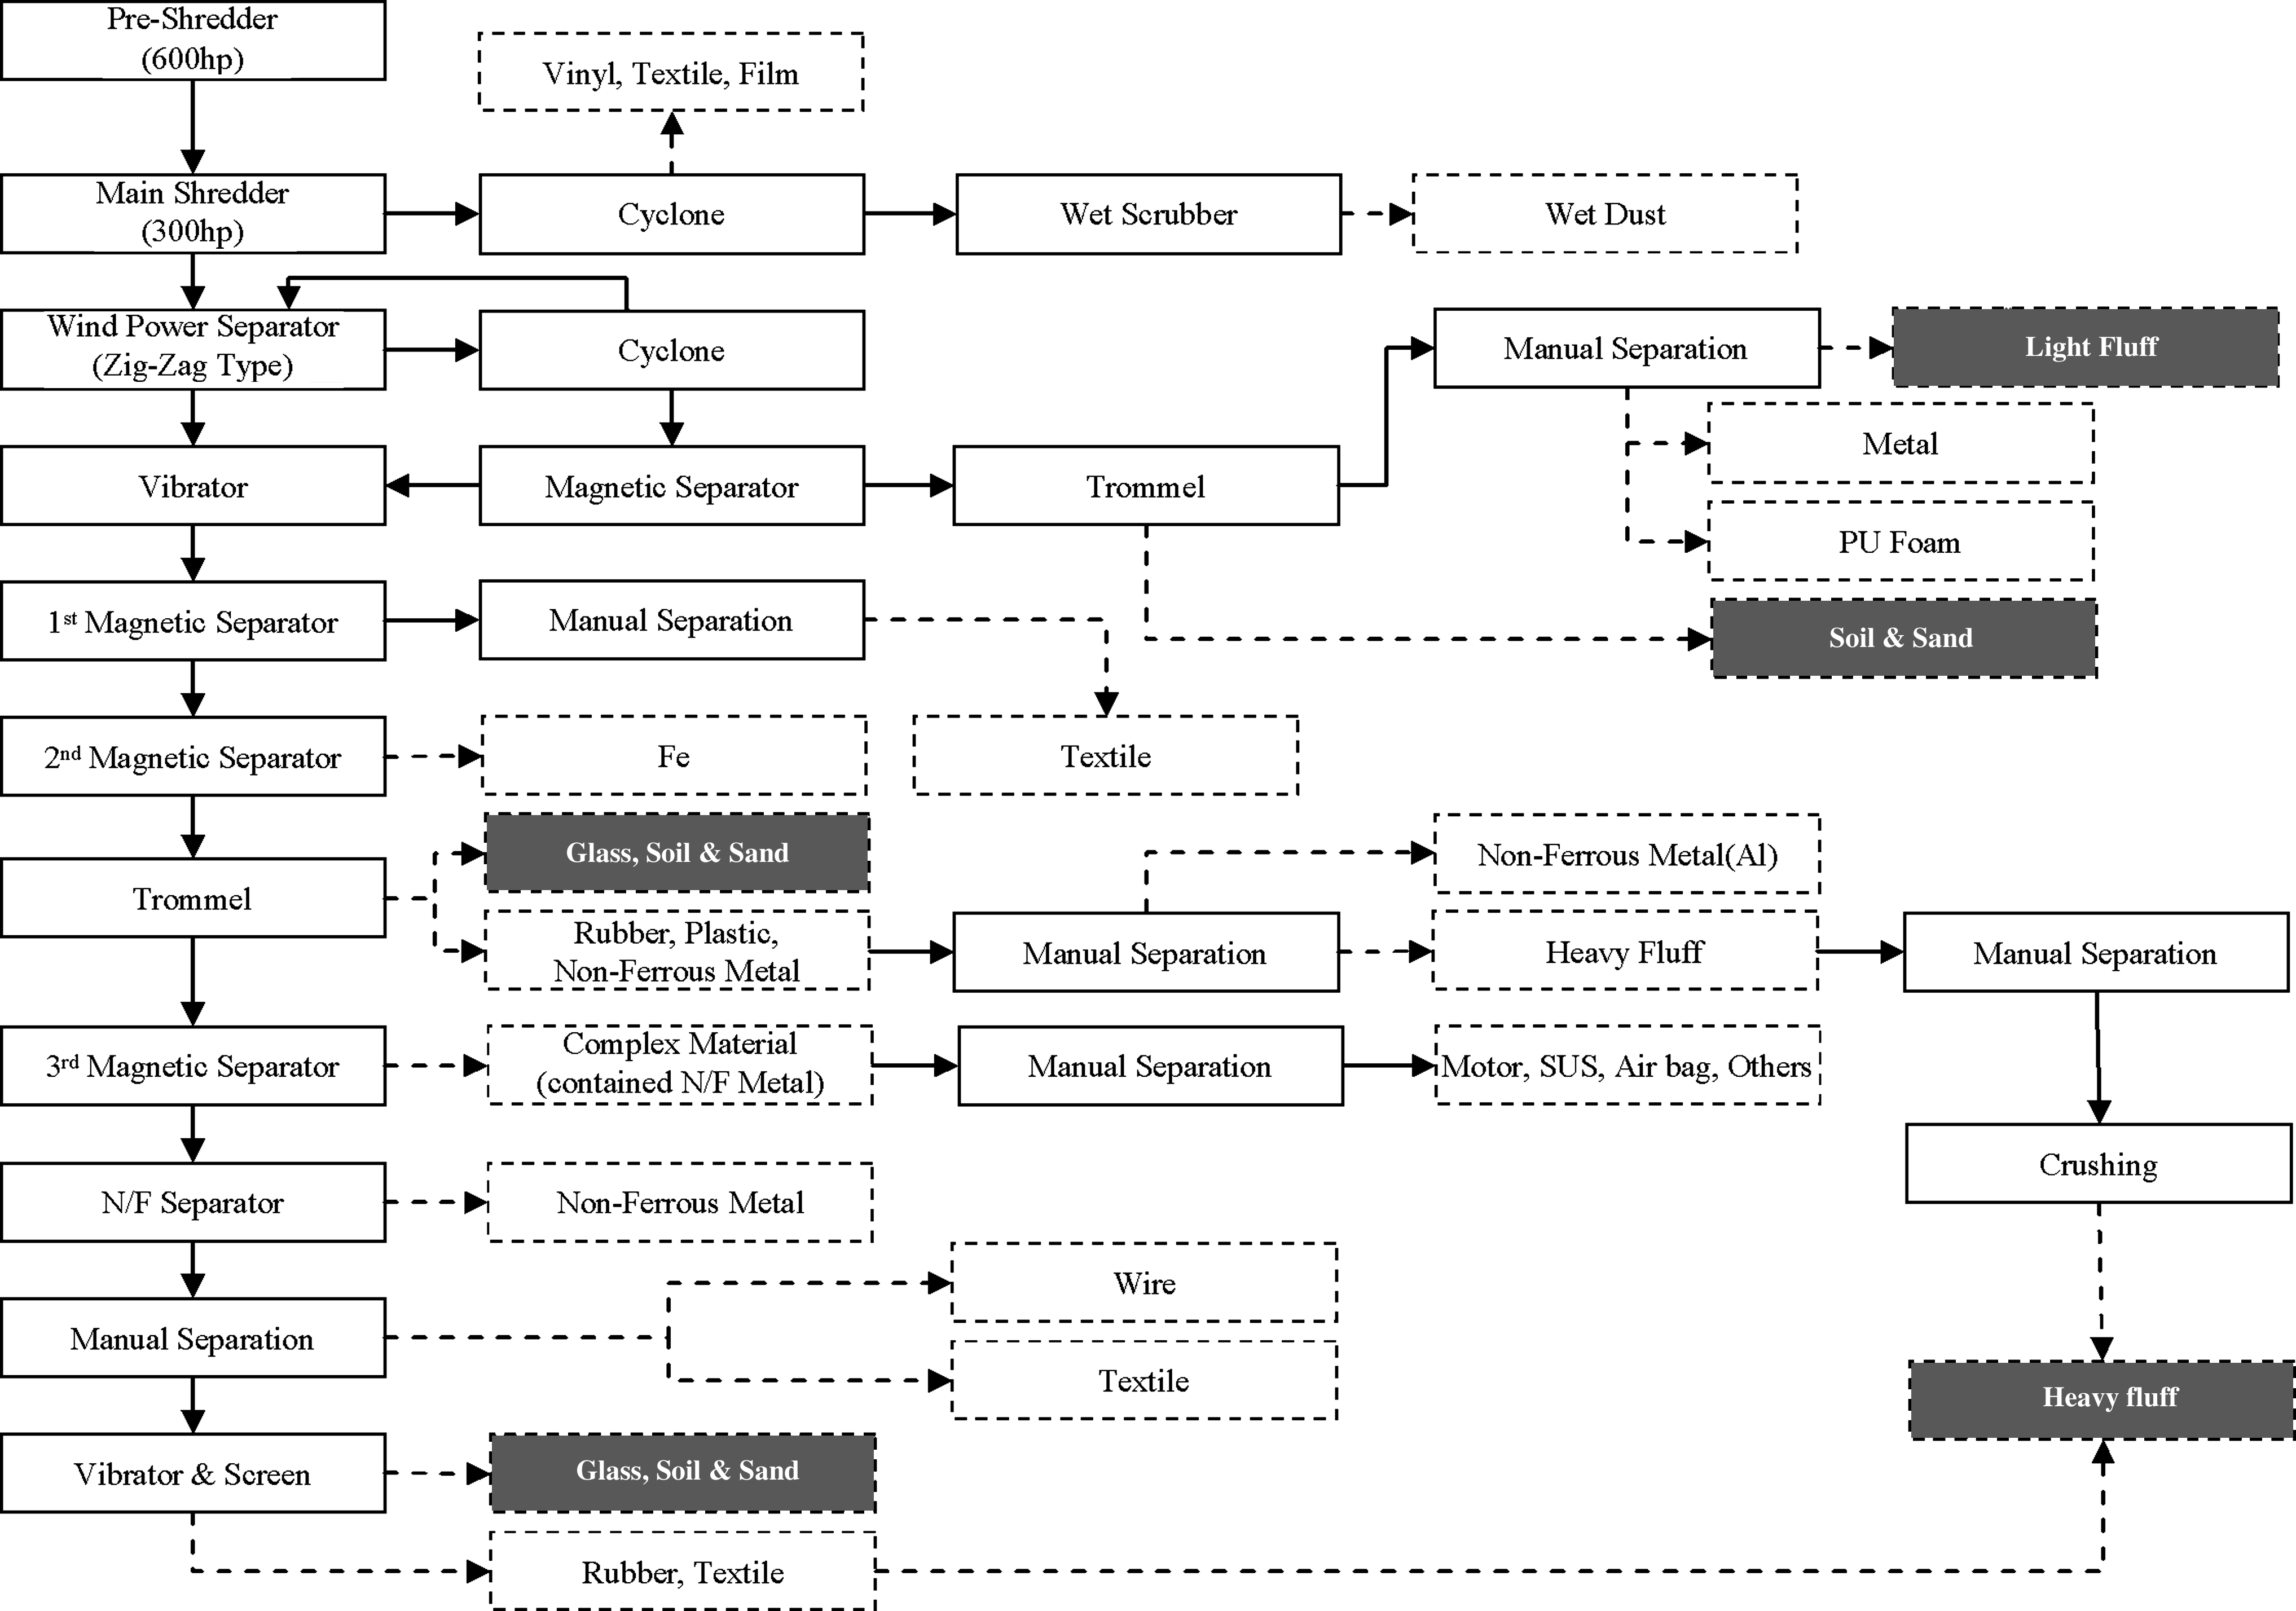
Schematic diagram of automobile shredder residue separation.
To collect a representative sample, light fluff was sampled for 5 consecutive days. The collected samples were mixed to prepare representative samples for the experiment. First, light fluff sampled from the shredding process was classified by the materials content found in it (textile, rubber, plastics, etc.) by manual separation. To ensure uniform feed rates during the experiment, homogeneous mixing was done and then shredded into less than 1 cm size. The proximate analysis, elemental analysis, LHV, and other tests were then carried out.
Shaft-type lab-scale gasifier
The schematic diagram of lab-scale shaft-type gasification unit is shown in Fig. 2. It can be divided into three parts (part 1: main control box; part 2: two furnaces—pyrolysis/gasification [chamber 1] and melting [chamber 2]; part 3: air pollution control devices). The main control box is designed to control the experimental temperature of the furnace, air flow rate, and so forth. There is a temperature difference between the upper and lower part of the shaft-type gasification reactor. The reactor contains two parts and the main control box displays the temperature of each of these units. Samples are fed manually (two stages and semibatch mode). In the two-stage manual mode, samples are placed vertically down by two valves and nitrogen atmosphere was maintained by removing oxygen in an injecting device by nitrogen purge port. Air pollution control devices include cyclone, scrubber, and bag filter for controlling gaseous emissions, especially dusts such as tar in the ASR gasification experiment. Emission gas was analyzed through a gas analysis system at the last gas outlet. In this system, two kinds of residual materials after gasification reaction can be collected. One is like ash containing inorganic material, and the other is tar, that is, almost a carbon component. Ash was taken out from the crucible that was placed in the melting zone at the bottom of reactor. The crucible can be replaced through the top and bottom of the melting zone by a lifter. Tar was sampled from a cyclone ash box (9), scrubber (11), and bagfilter ash box (13). Tar sampled from the scrubber was dried before weighing.
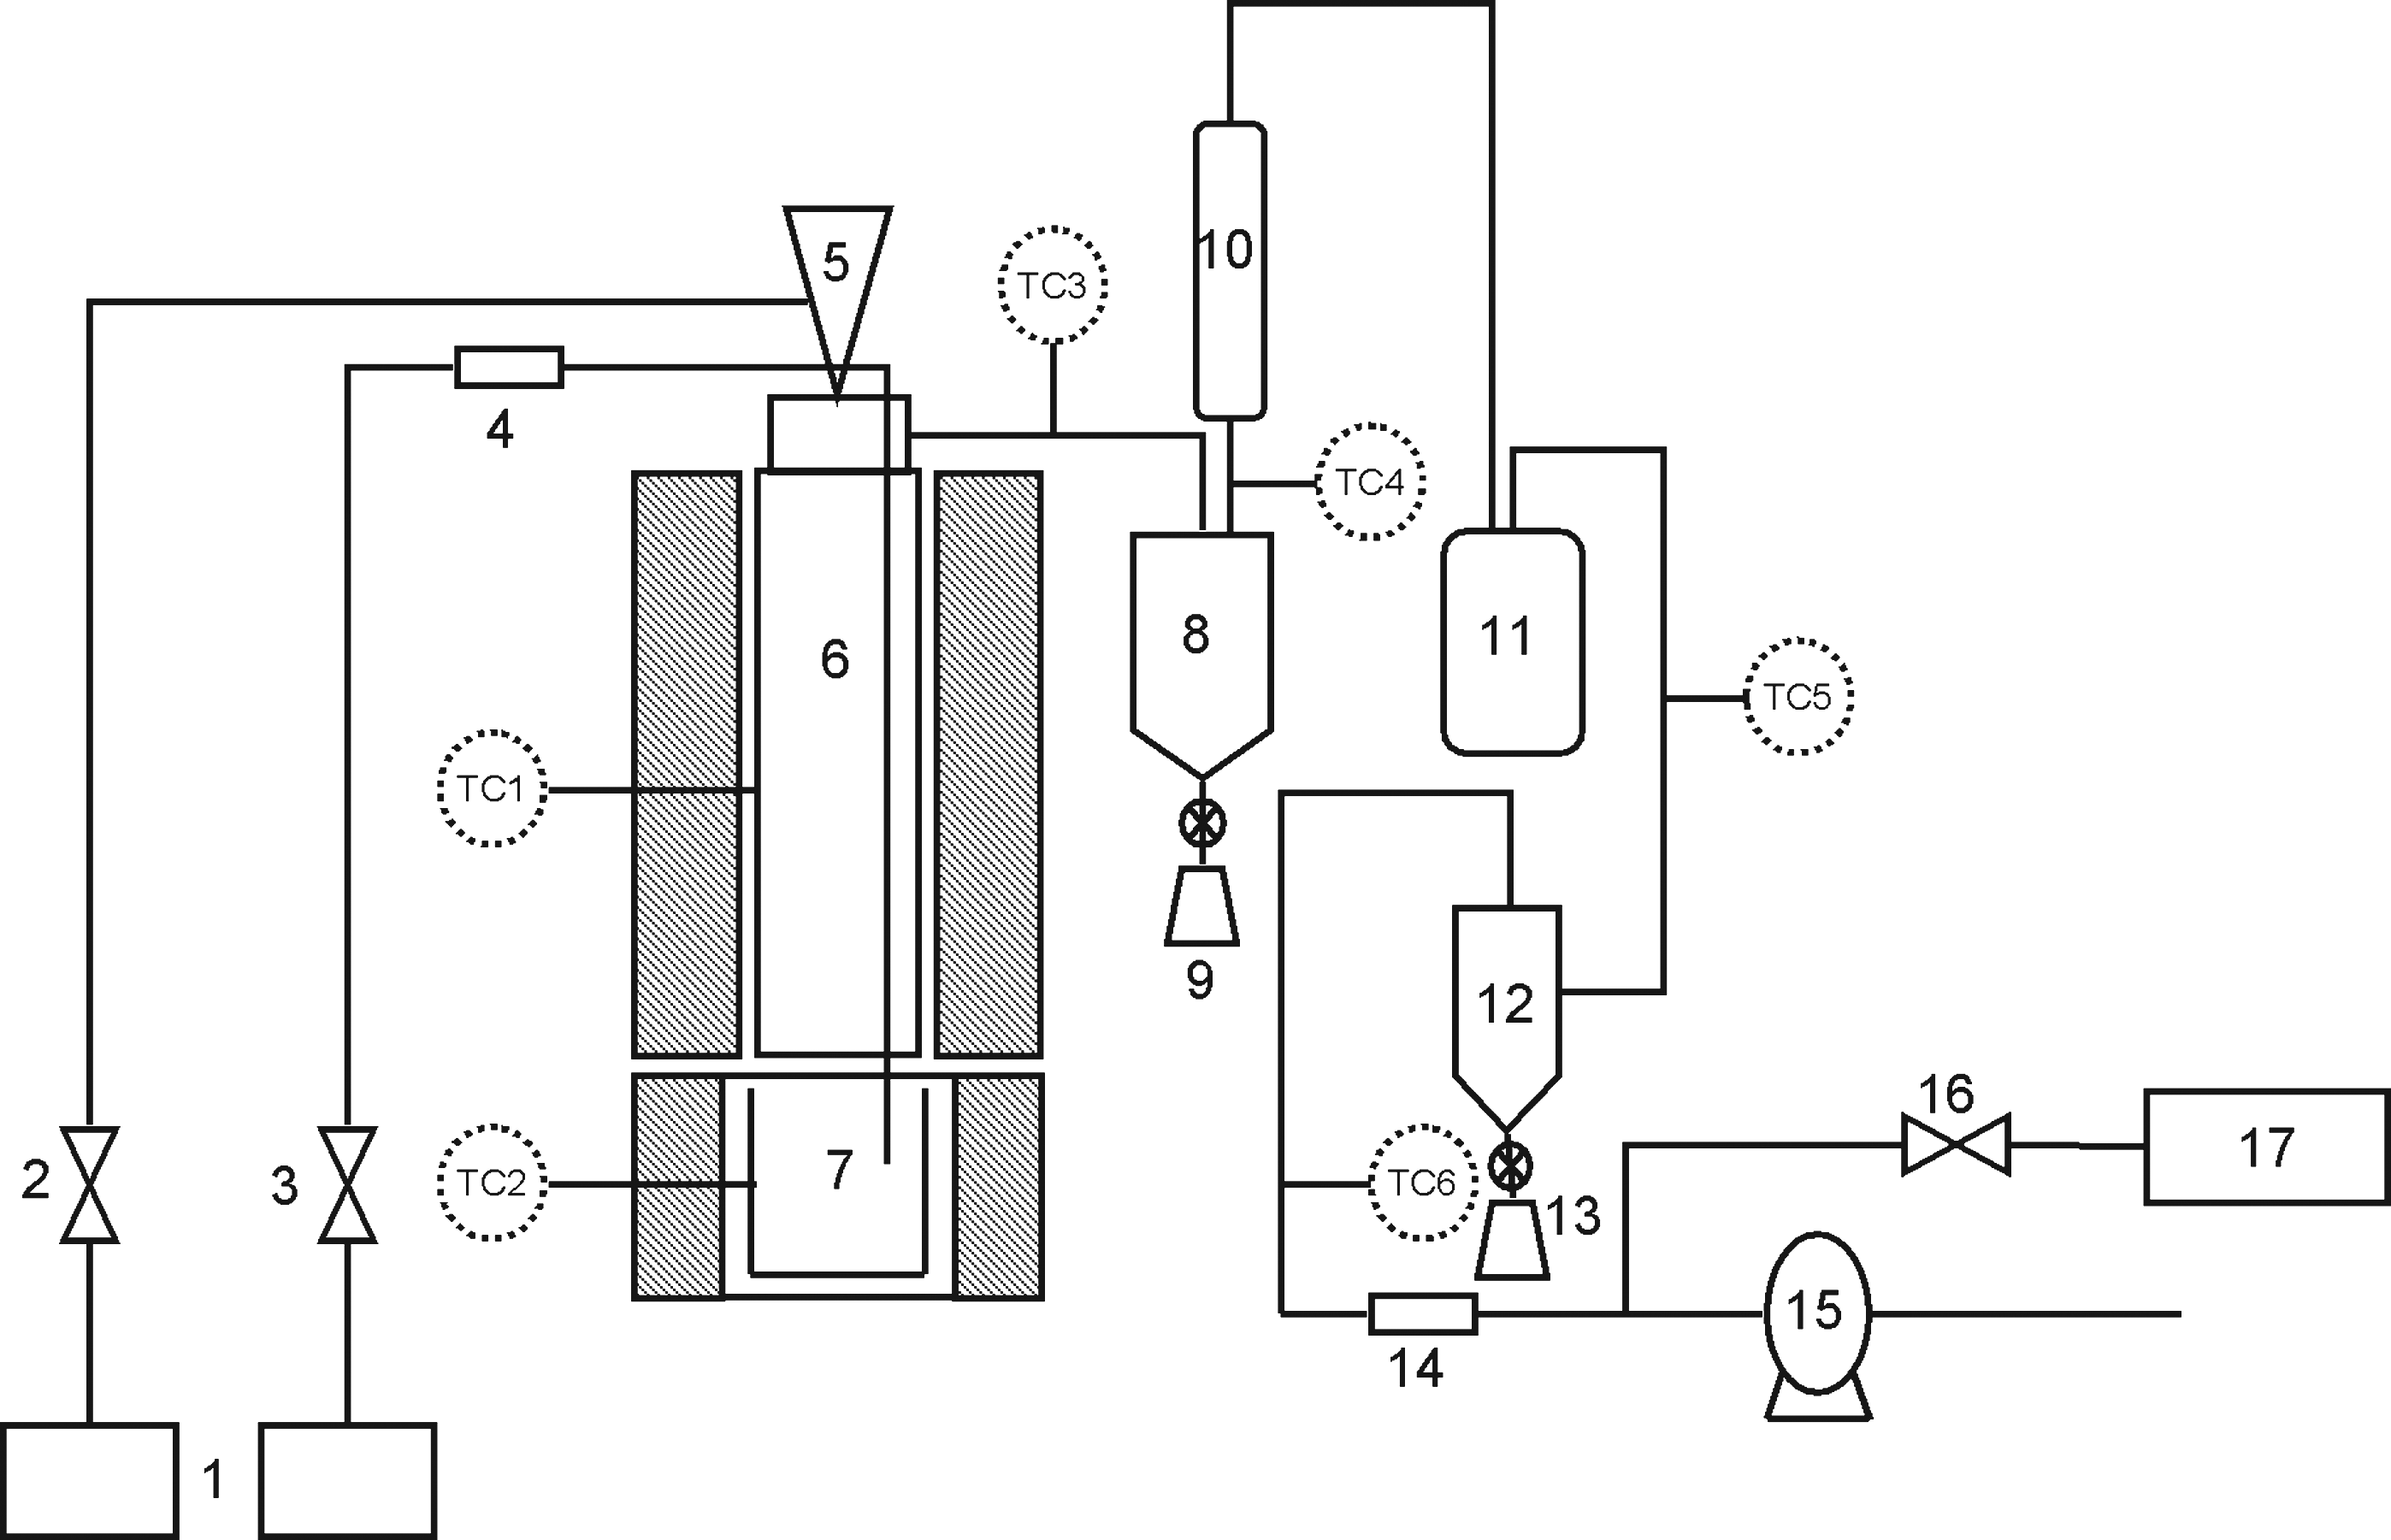
Schematic diagram of lab-scale gasifier system. 1, air and nitrogen supply; 2, nitrogen controller; 3, air controller; 4, mass flow controller; 5, feeder; 6, chamber 1; 7, chamber 2; 8, cyclone; 9, cyclone ash box; 10, condenser; 11, scrubber; 12, bag filter; 13, bag filter ash box; 14, MFM; 15, pump; 16, dry gas controller; 17, gas analyzer, TC, thermocouple.
Operational procedure
Before carrying out the main experiments, preliminary tests were carried out to determine sample feeding intervals in the gasification reactor. Experiments were carried out at the fixed input of feedstock (15 g) at a temperature of 1,000°C in chamber 1 and 1,200°C in chamber 2, and the air equivalent ratio (ER) was 0.0. The reason for selecting the upper condition is that hydrogen production is typical and representative in a gasification reaction, theoretically anticipating optimum yield conditions among our experimental conditions. Hydrogen production was evaluated in two conditions: at sample fed interval of 60 and 90 s. For an accurate analysis, a continuous H2 analyzer (VH-Sniffer II Plus Multi-Gas Monitor; Kinsco Tech) was used for measuring concentration at every 2 s. Hydrogen produced during the experiment is shown in Fig. 3 (production after steady state is presented). When the sample was fed at an interval of 90 s, a hydrogen concentration cycle was noticed because feed samples were fed as semibatch mode. However, when a sample was fed at an interval of 60 s, gas concentration became more stable. In the 60 s sample feeding, the minimum and maximum values of hydrogen varied 3%, whereas the variation was 8% in sample feeding intervals of 90 s. Thus, the sample feeding interval of 60 s was selected.
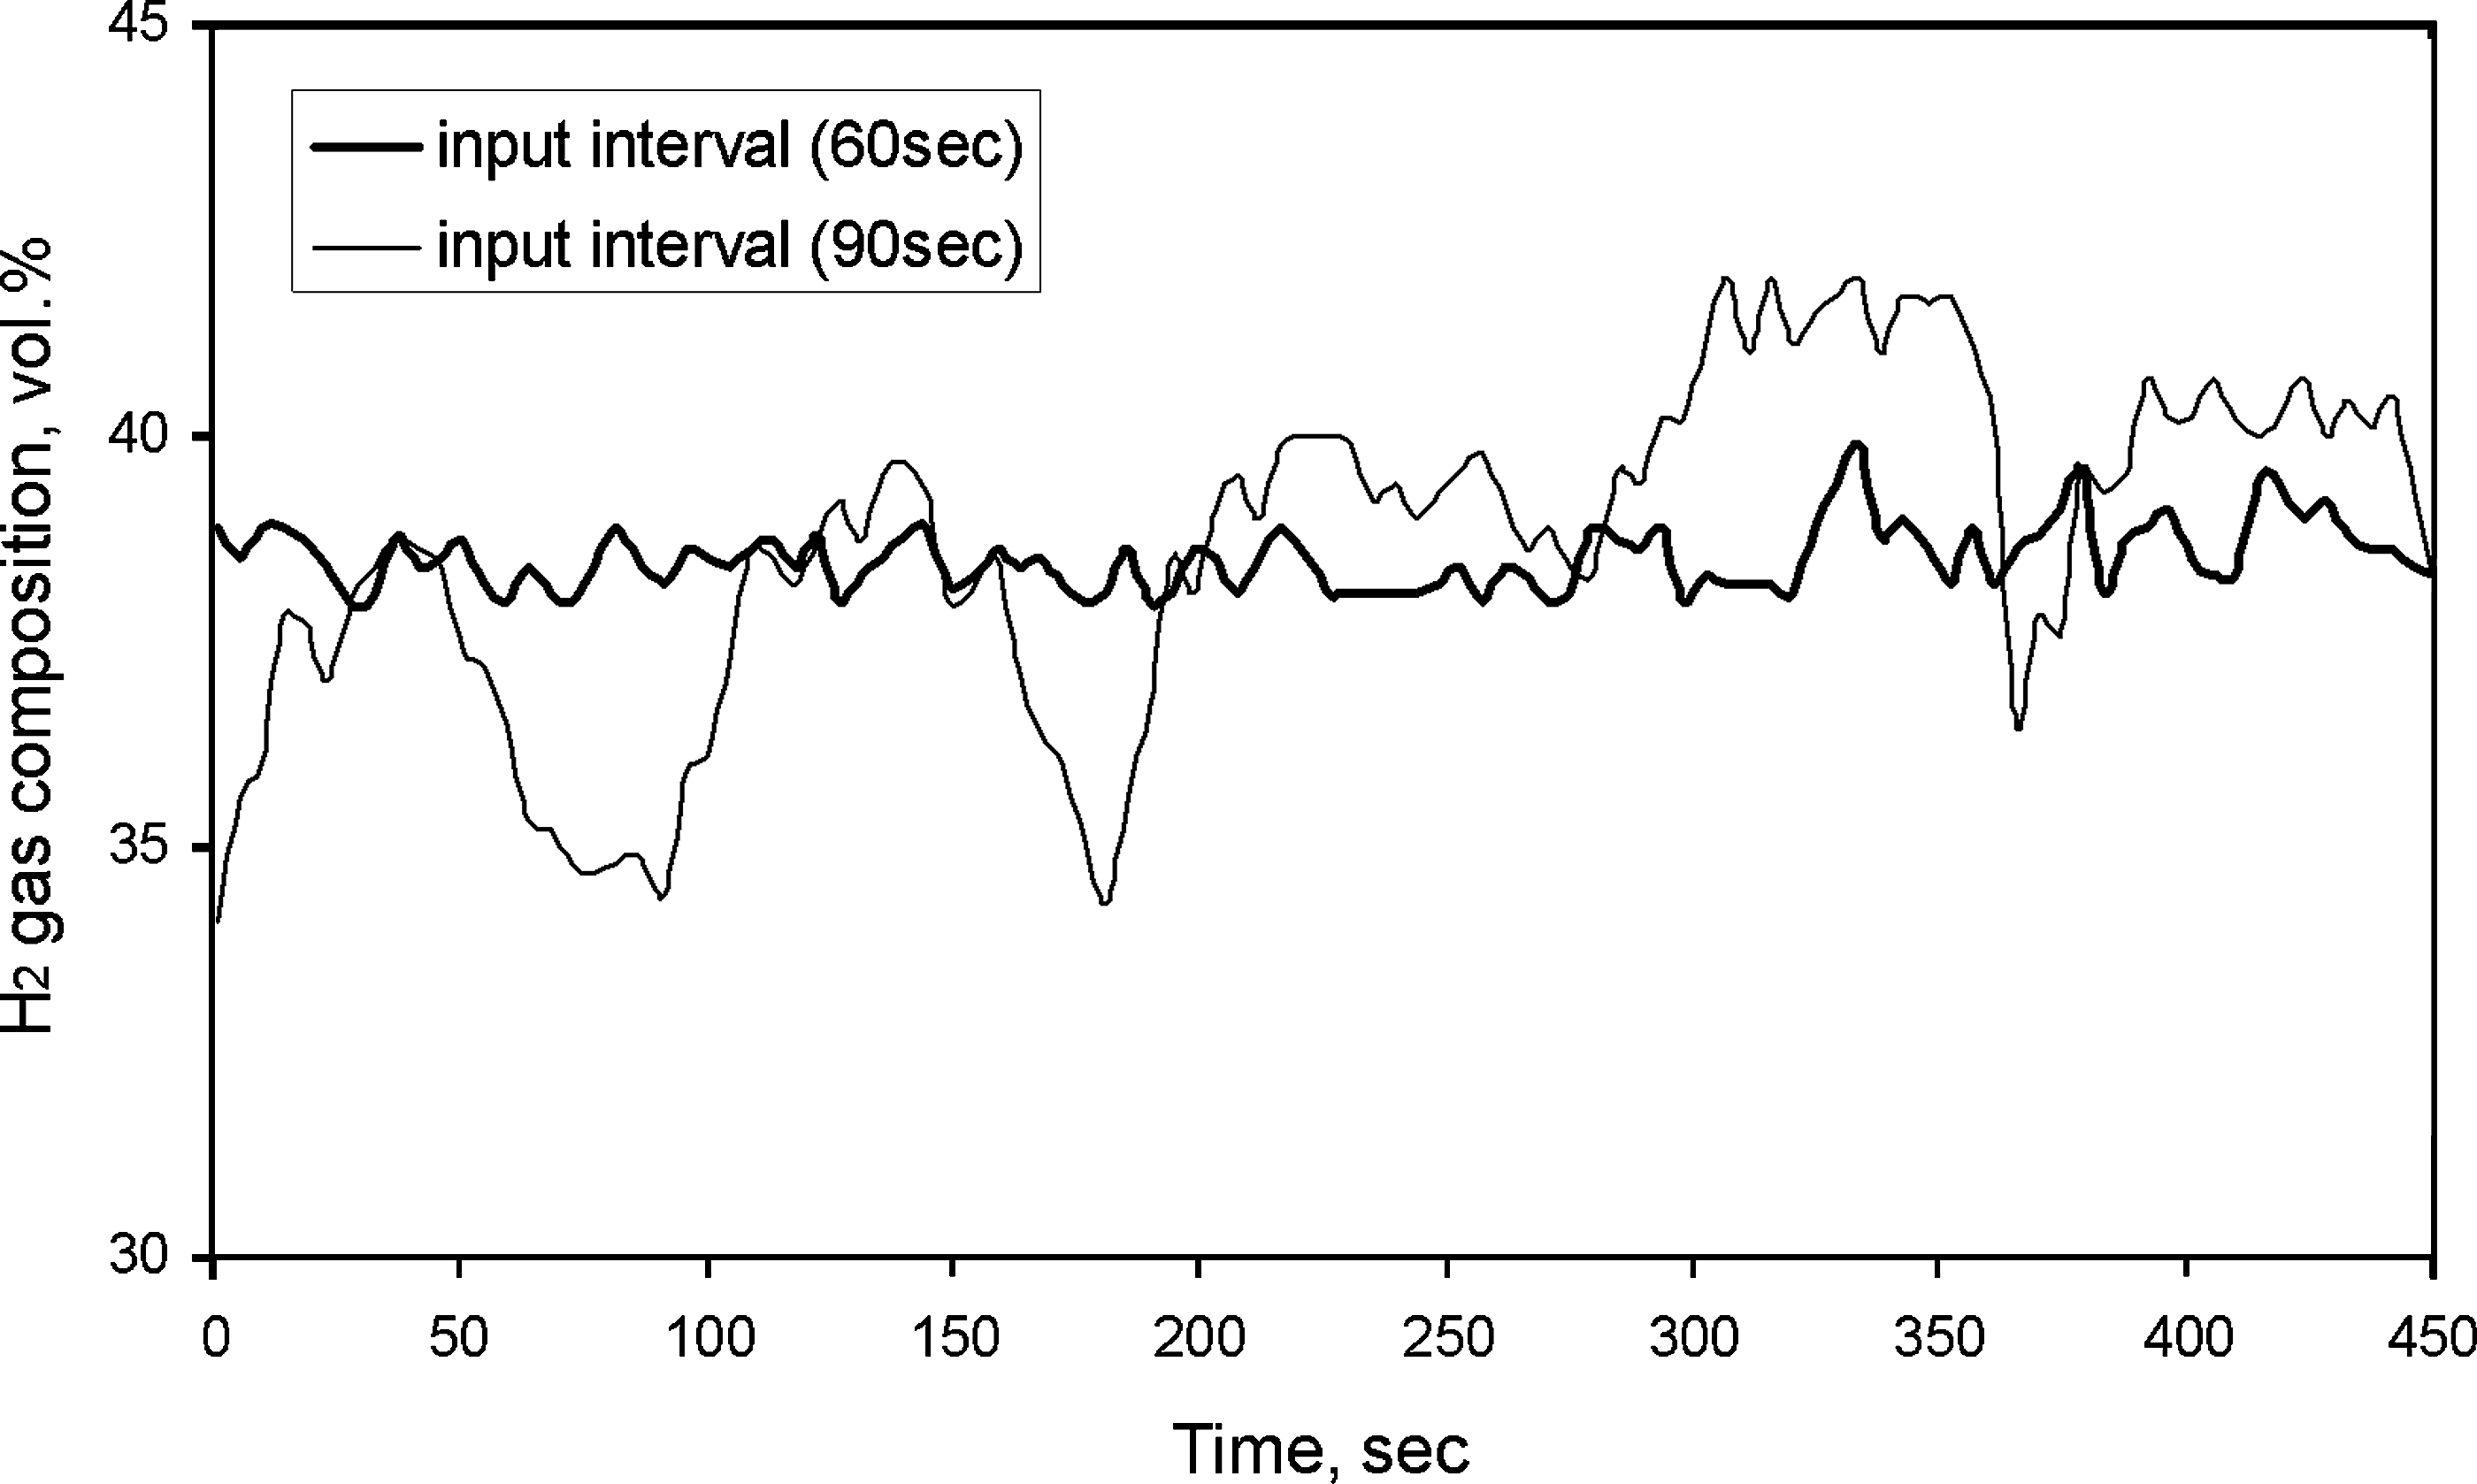
H2 compositions at two different feeding intervals.
The operational conditions such as temperature, ER, and particle size are shown in Table 1. The temperature at chamber 2 was fixed at 1,200°C, temperature at chamber 1 was changed to test at 600°C, 800°C, and 1,000°C, and ER was also changed from 0.06 to 0.24. Experiments were carried out at 15 different conditions, as shown in Table 1. For each experimental condition, LHV, gas yield (Gy), and carbon conversion efficiency were calculated.
Equivalent ratio was calculated as the ratio of air supplied to air required for complete stoichiometric combustion of ASR.
ASR, automobile shredder residue.
After gasification experiments, tar yield and residue yield in the crucible were measured. Slag-recycling methods differ with slag crystal structure, leaching test result, heavy metals content, density, and absorption ratio. Therefore, these characteristics of ASR melting slag were also studied. The results obtained in this study will be used to further develop melting slag-recycling processes in a scale-up system. The residues remaining in the crucible (chamber 2, bottom part of the reactor) were collected and then melted down further because some of the slag was not properly melted. Also, for further characterization studies they needed to be fabricated with different melting conditions as shown in Table 2. The slag structure from the X-ray diffraction (XRD) results at different melting temperatures, melting time, basicity, and cooling method (air cooling and slow cooling) (cases 1–13) were analyzed. A leaching test, heavy metals, density, and an absorption ratio analysis were conducted only on case 3. Detailed experimental conditions are shown in Table 2. Basicity was defined as CaO/SiO2, and basicity during experiment was adjusted by adding SiO2 and CaO. Basicity results obtained from the X-ray flourescence spectrometry (XRF) analysis are shown in Table 3.
Analysis and data processing method
Particle size distributions, material composition, and the apparent density of light fluff were measured according to the Korean standard method used in shredding facilities. The high heating value was measured using a bomb calorimeter (AC-350; Leco). A proximate analysis was carried out using a thermogravimetric analyzer (TGA-601; Leco). An elemental analysis was done in an elemental analyzer (EA; Vario EL). Heavy metal concentration in ASR ash and extracted liquid from ASR slag (for leaching test) were measured by inductively coupled plasma-optical emission spectrometers (ICP-OES, 720ES series; Varian) and analyzed by U.S. EPA Method M-3050B (2008). The leaching test was carried out by the Korean standard testing method for solid waste. The density and absorption ratio of slag were measured using Korean standard KS F 2503 (MKE, 2007). The generated gas composition, H2, CO, CO2, CH4, C2H4, C2H6, and N2, was analyzed using microgas chromatography (Micro-GC 3000A; Agilent). Gaseous concentrations were measured every 2 min and values were averaged.
The LHV of fuel gas (He et al., 2009a, 2009b, 2009c), the flue Gy (Guo et al., 2009), the carbon conversion efficiency of flue gas, residue yield, and tar yield were calculated as shown in the following equations, where CO, H2, CH4, C2H4, and C2H6 are the volume percentages of fuel gas components [equations (1) and (3)] and C is percentage of carbon in ultimate analysis of ASR [equation (3)]:
Results and Discussion
Characteristics of ASR feedstock
Physicochemical characteristics of light fluff are shown in Table 4. Light fluff larger than 16 mm in size was about 90%. Thermoplastics, textiles, thermosetting polymer, and rubbers were major material components of light fluff. This result is similar to other studies (Trouve et al., 1998; Horii and Iida, 2001; Roy and Chaala, 2001; KUCEA, 2008). Heating values (25.96 MJ/kg) was relatively higher than other studies (Marco et al., 2007). This is because of the complex shredding process and relatively higher organic components contained in it. Carbon and volatile matter content were 52.9 and 65.5 wt%, respectively, which are higher than other studies (Galvagno et al., 2001; Roy and Chaala, 2001; Marco et al., 2007). Among metals, Fe was in high concentration. Especially, the recovery of valuable metals such as Ni, Cu, and Pb was higher compared with other wastes.
Effect of ER and temperature on gaseous product
Figure 4 shows the composition of product gas with various ERs and temperatures (chamber 1). The main components were H2, CO, CH4, and CO2; concentrations of C2H4 and C2H6 were less. At higher temperatures and lower ER, CO, H2, and CH4 emission tended to increase but CO2 and N2 decreased. C2H4 and C2H6 concentration change at different ERs was not clear; however, there was an increasing tendency of its emission amount at lower temperatures. As gaseous products in the gasification process were generally affected by many complex reactions occurring together, there were variations in experimental results.
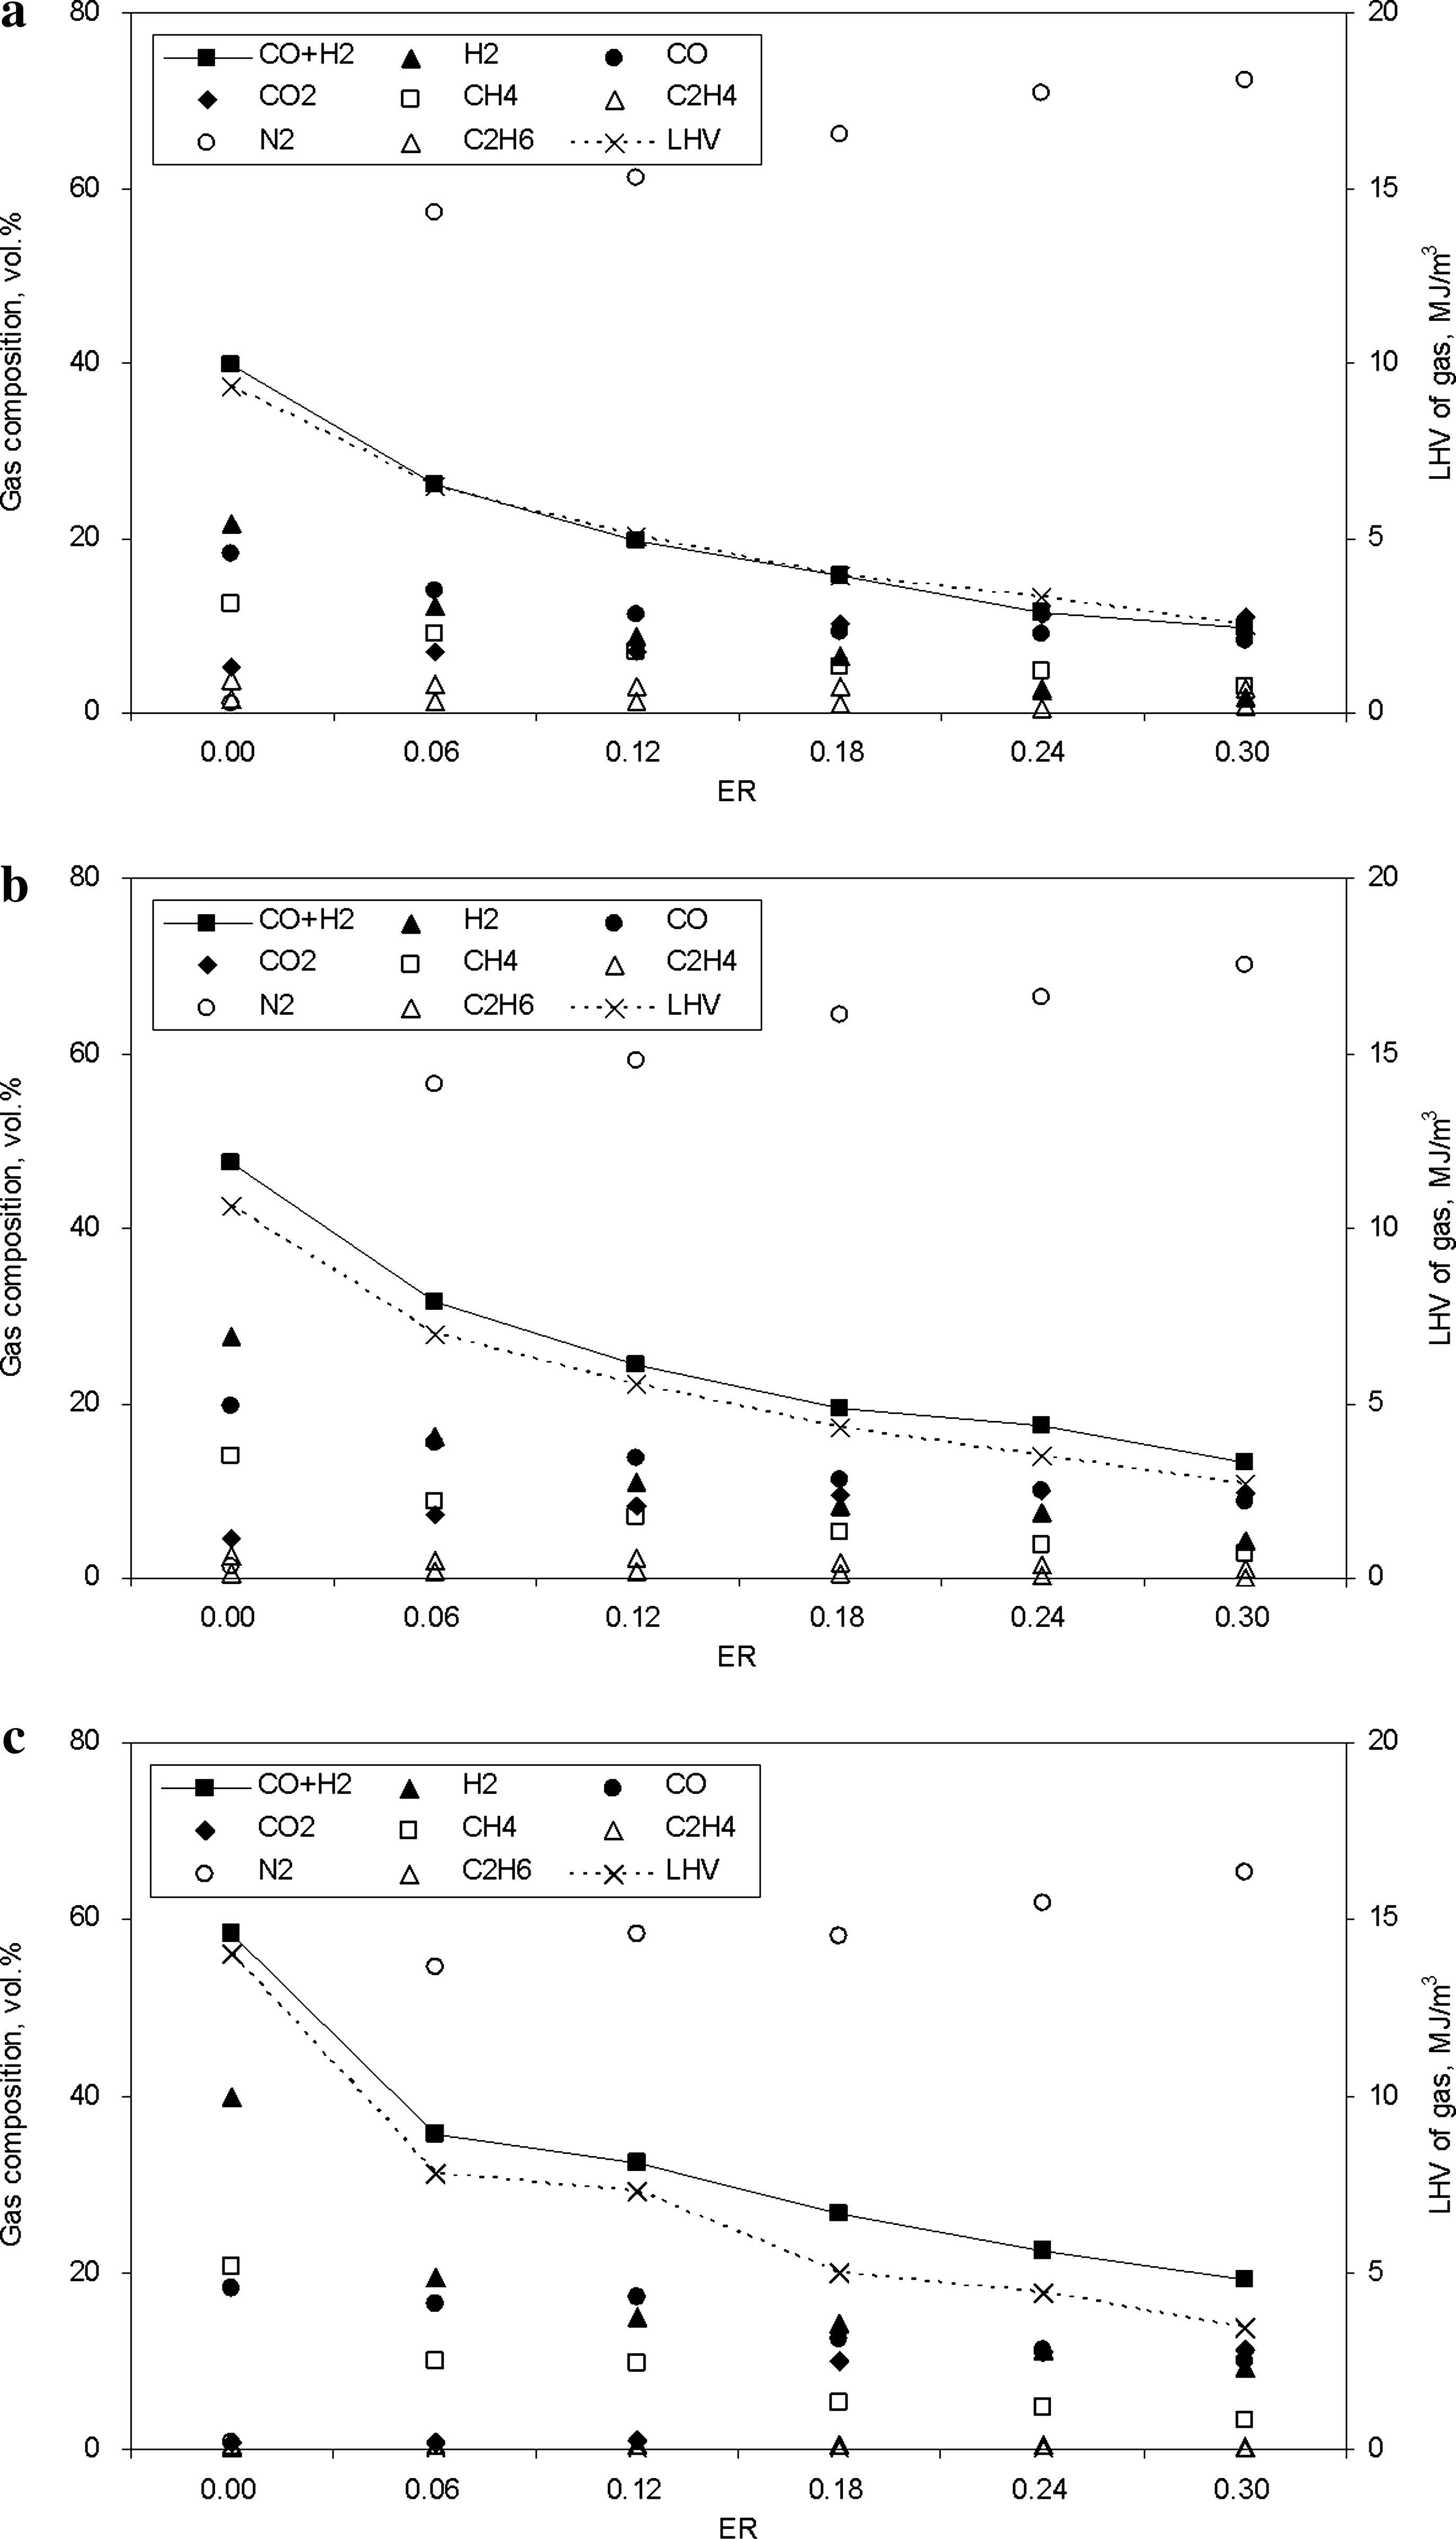
Dry gas composition with temperature at chamber 1: (
Although increasing ER, H2, CO, and CH4 showed a tendency to decrease, CO2 increased. Especially, variations of gaseous products measured were relatively higher when ER ranged from 0.00 to 0.06. This might be due to the dilution effect caused by the sudden increase in N2 concentration moving from ER 0.00 to 0.06. As shown in Fig. 4, as the ER value increased, CO2 gradually increased, whereas CO decreased. The gradual increase of CO2 with increasing ER might be due to the dominance of oxidation reaction (C + O2 → CO2) (Rezaiyan and Cheremisinoff, 2005) than the Boudouard (C + CO2 → 2CO) or the water–gas reaction (C + H2O → 2CO + H2). As the ER value increased the available O2 also increased, which favored the formation of CO2 than CO. Thus, as ER increased, CO2 increased and CO decreased. As CO and H2 decreased with ER, the forward methanation reaction (CO + 3H2 → CH4 + H2O) is less favored, and thus the measured CH4 concentration decreased with ER. Considering the fact that gasification reactions basically occur by absorbing heat from the surroundings, as the ER increased the carrier gas (i.e., N2) increased and the temperature decreased. As the gasification reactions shown above are favored at high temperature and thus are less favored at increasing ER, less release of H2, CO, and CH4 is observed in our experiments. The role of temperature will be explained in the following paragraphs.
Reaction temperature is an important parameter for the gasification process and the by-products. Theoretically, at a higher temperature, the forward reactions Boudouard (C + CO2 → 2CO), the water–gas (C + H2O → 2CO + H2), the water–gas shift conversion reactions (CO + H2O → CO2 + H2), and so forth, are favored, and all of these are endothermic reactions (Borgianni et al., 2002; Rezaiyan and Cheremisinoff, 2005). In our experiment, with a higher temperature, an increasing variation of H2 and CH4 was clearly noticed. But the increasing trend of CO and decreasing trend of CO2 and N2 were not clear. The increase of H2 with an increasing temperature might be due to more occurrences of water–gas reaction and the water–gas shift reaction, which are endothermic reactions and favored at higher temperatures. A CH4 increase might be due to the favorable forward methanation reaction (CO + 3H2 → CH4 + H2O), which was also favored by the increase in H2 with the increasing temperature. It might be prospected that CO and CO2 had nothing to do with the variation in temperature.
The heating value of gas, which was calculated using the equation (1) based on gaseous products, ranged from 2.5 to 14.0 MJ/m3. Maximum values were obtained at ER 0.0 and at 1,000°C. At lower ER and a higher temperature, heating value tended to be higher, which might be due to the composition of gas compounds (CO, H2, CH4, C2H4, and C2H6), which itself has a high heating value. Especially, the most important parameters influencing heating value were H2 vol% because the variation of H2 was highest with the changing ER and temperature, compared with other gas products.
Figure 5 shows carbon conversion efficiency of flue gas and dry Gy (carbon in tar and residue was not considered). Carbon conversion efficiency is one of the parameters used to estimate gasification efficiency (Kumar et al., 2009; Luo et al., 2009; Velez et al., 2009). An increase in carbon conversion efficiency with increasing ER was noticed but influence on temperature was not clear. The increase in carbon conversion efficiency might be favored by several factors. It might be prospected that the decomposition and devolatilization reaction during the gasification reaction rose with the increasing gasification temperature and ER. In Fig. 6, with the decrease in ER and temperature, tar and residue yields increased. So, if total carbon conversion efficiency is estimated considering carbon in tar and residue, efficiency would increase, more or less equally to all experimental conditions. The dry Gy increased at increasing ER and temperatures. This might be mainly attributed to increasing N2 in the feeding air with increasing ER. Increase of Gy with increasing ER was mainly because of the increasing inert N2 gas in injected air.
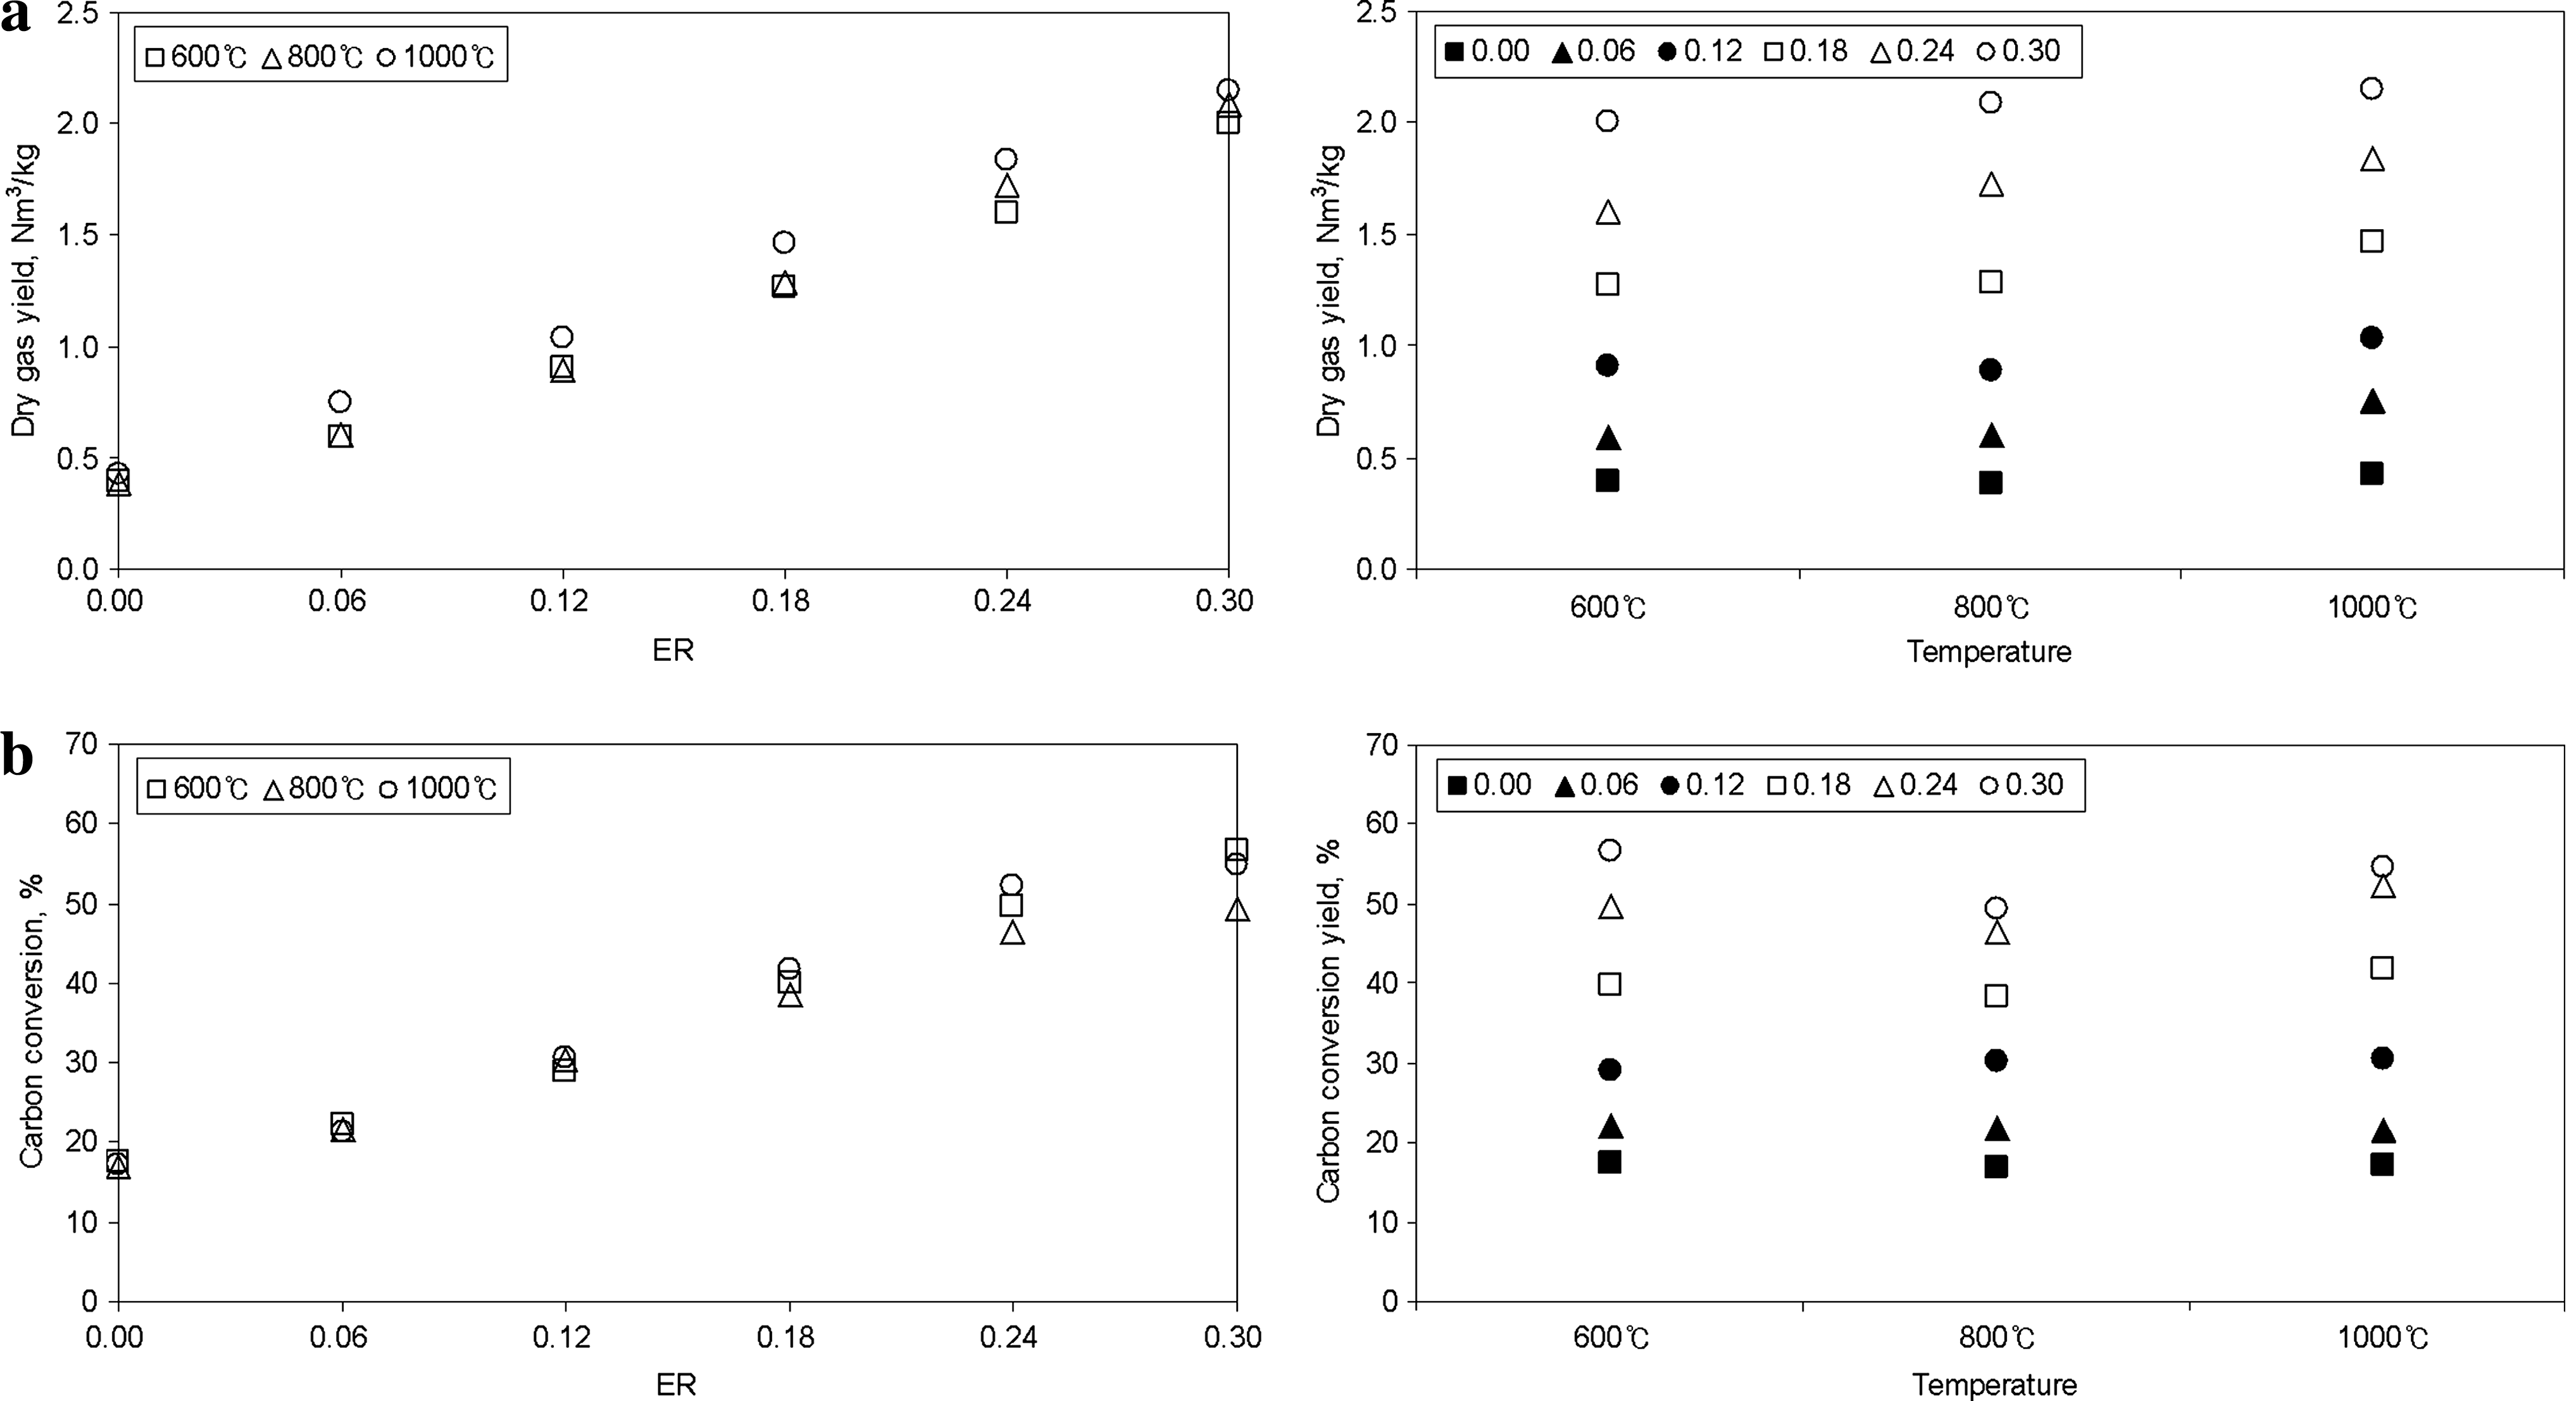
Fuel gas characteristics of product gas. (
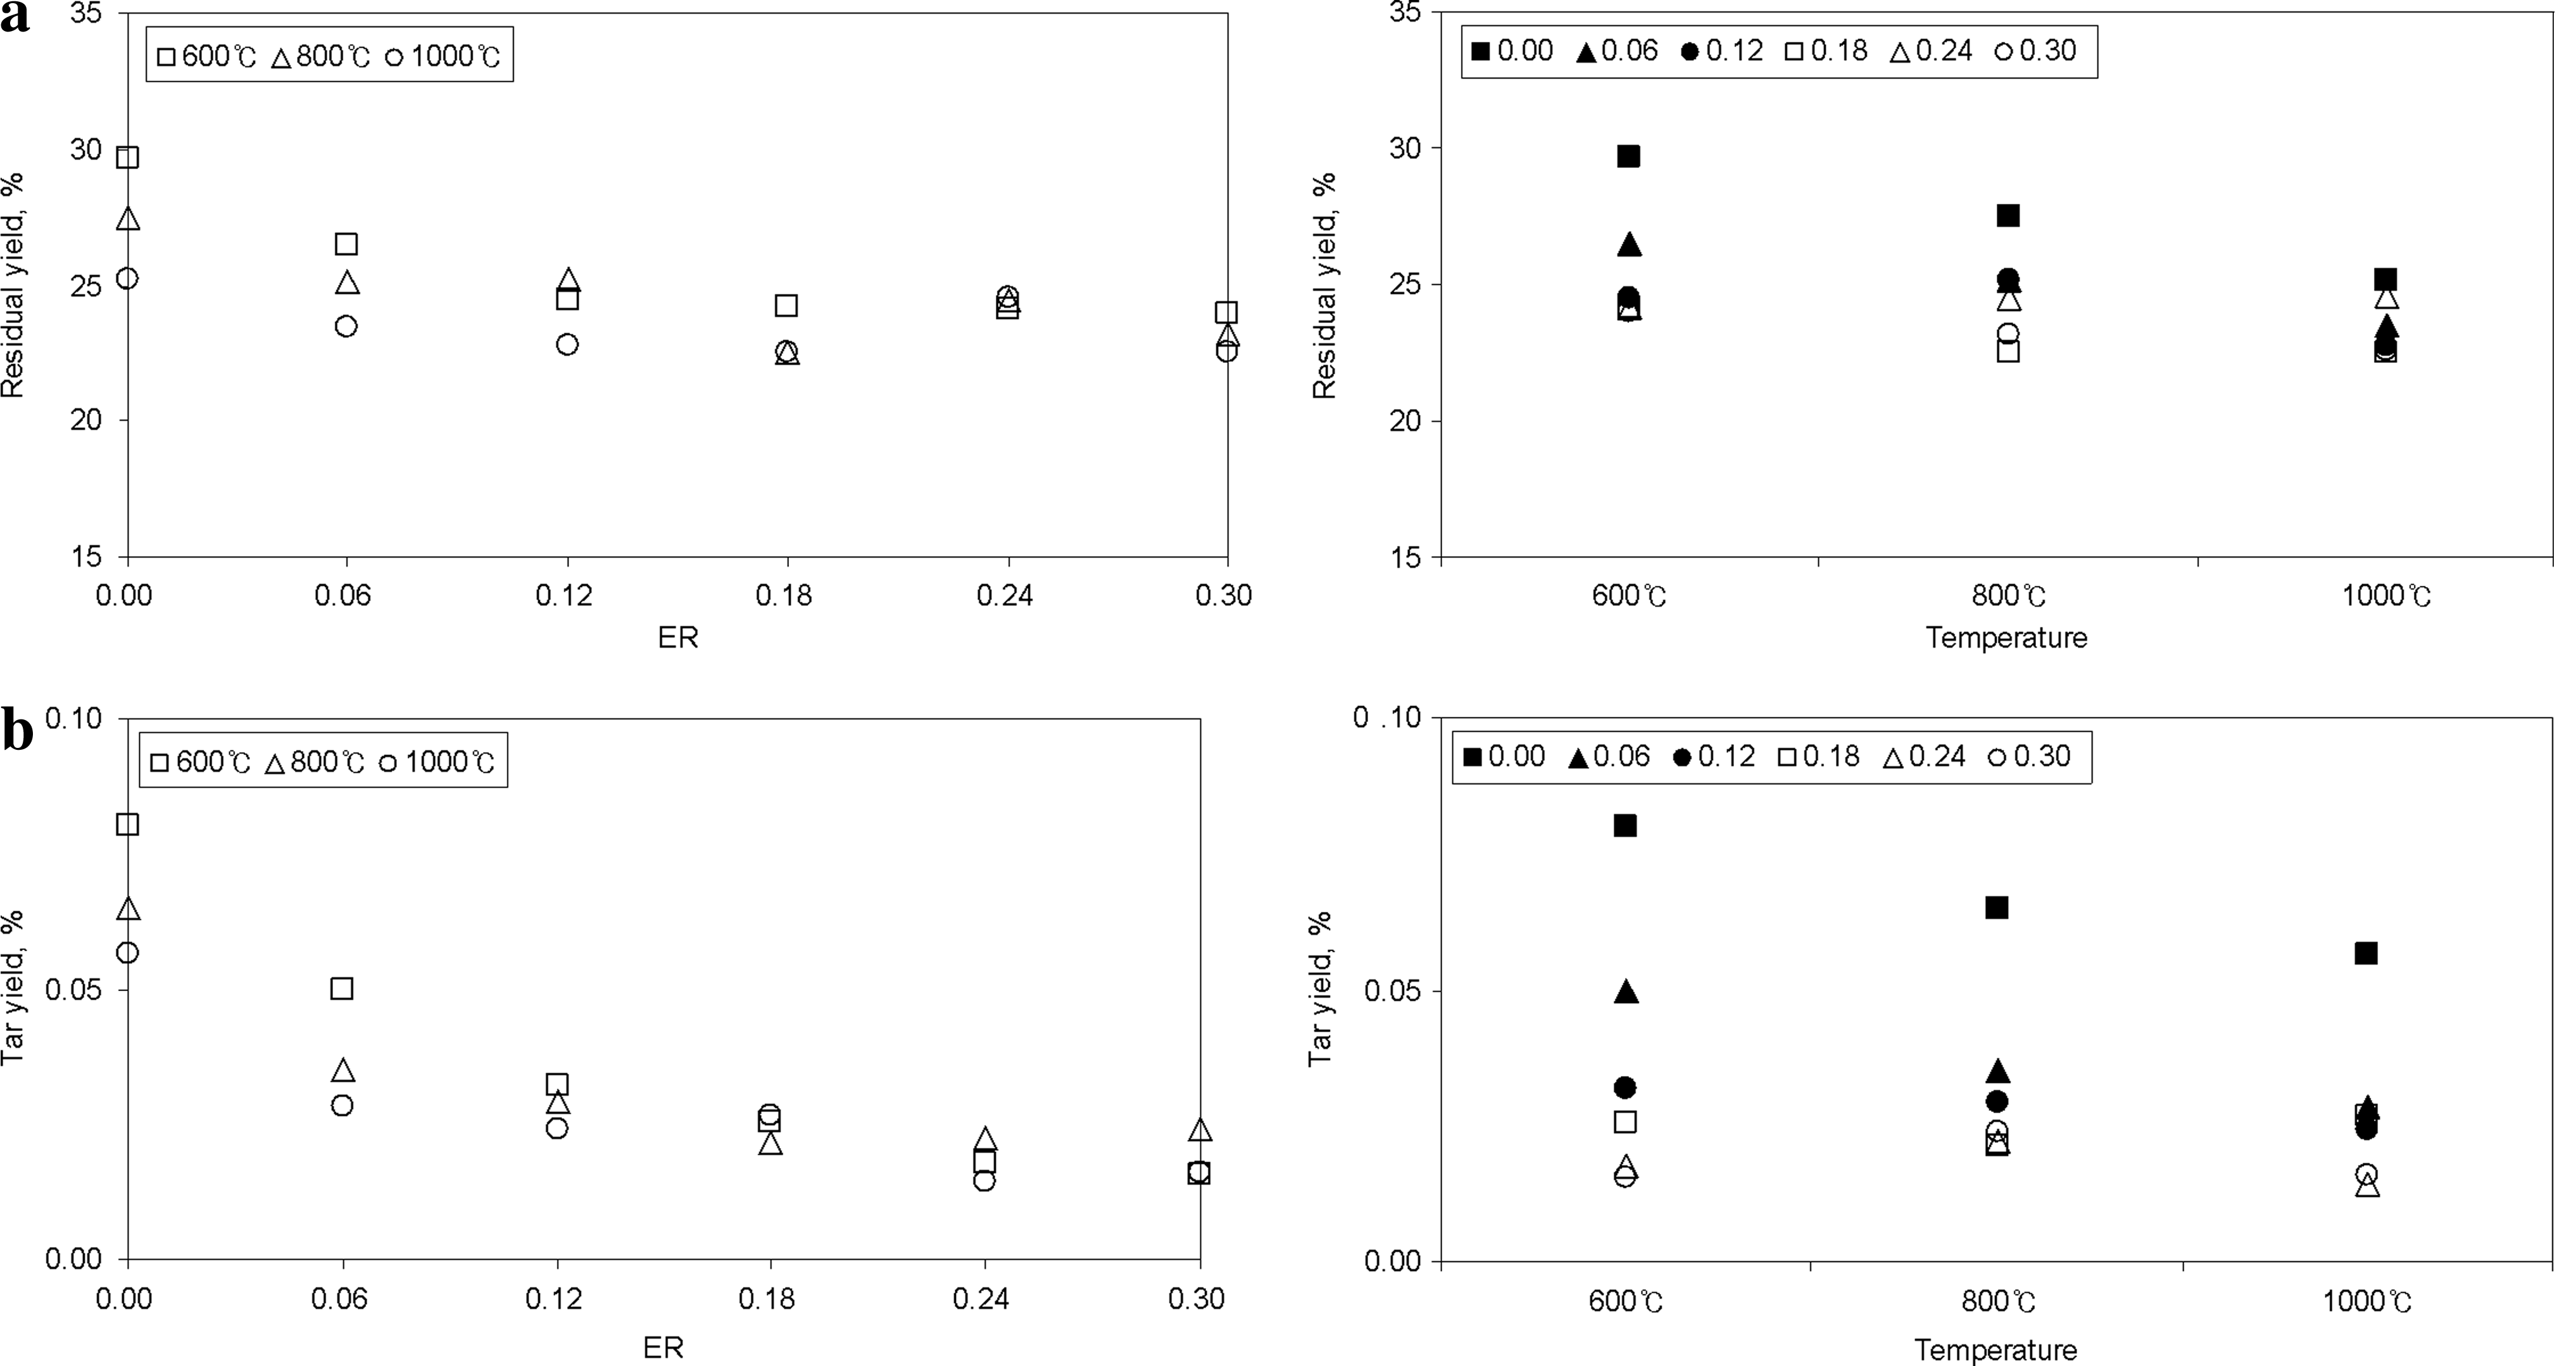
By-product yields of gasification reaction. (
By-product yields as tar and residue
Tar and residue yields after the gasification reaction and melting were obtained, as shown in Fig. 6. As seen in Fig. 6, tar and residue yields were decreasing with increasing ER and temperatures, and this shows an opposite tendency with carbon conversion efficiency. Tar yield was below 0.10% and residue yield was below 30%. Residue yield was higher than other wastes, especially municipal solid waste (He et al., 2009a, 2009b, 2009c), and this is due to various metal contents in ASR waste. In a pilot plant or real facility operation, residue yield is also related to slag yield. When slag was fabricated, the averaged slag portion obtained in this study was about 22 wt%. The slag is usually very stable to be used as recyclable materials; therefore, further analysis of their structures was made.
Characteristics of slag products
In Table 2, experimental conditions (cases 1–13) are presented. In most conditions, the separation of the metal portion and glass portion in slag can be seen in Fig. 7. In high temperatures, because of density and melting temperature of metals, metal particles have aggregating characteristics to be segregated. Figure 7 shows the separation of metal slag and glassy slag. Especially, at a slow cooling slag (case 11), a metal slag of relatively bigger size than other conditions can be seen (Fig. 7). This is due to the fact that slow-cooling dense particles have enough time to combine with each other, whereas low-dense particles float to the surface. Generally, at basicity 0.6, with increasing melting temperatures and melting time, the increasing fluidity and surface roughness of slag can be noticed by visual inspection.
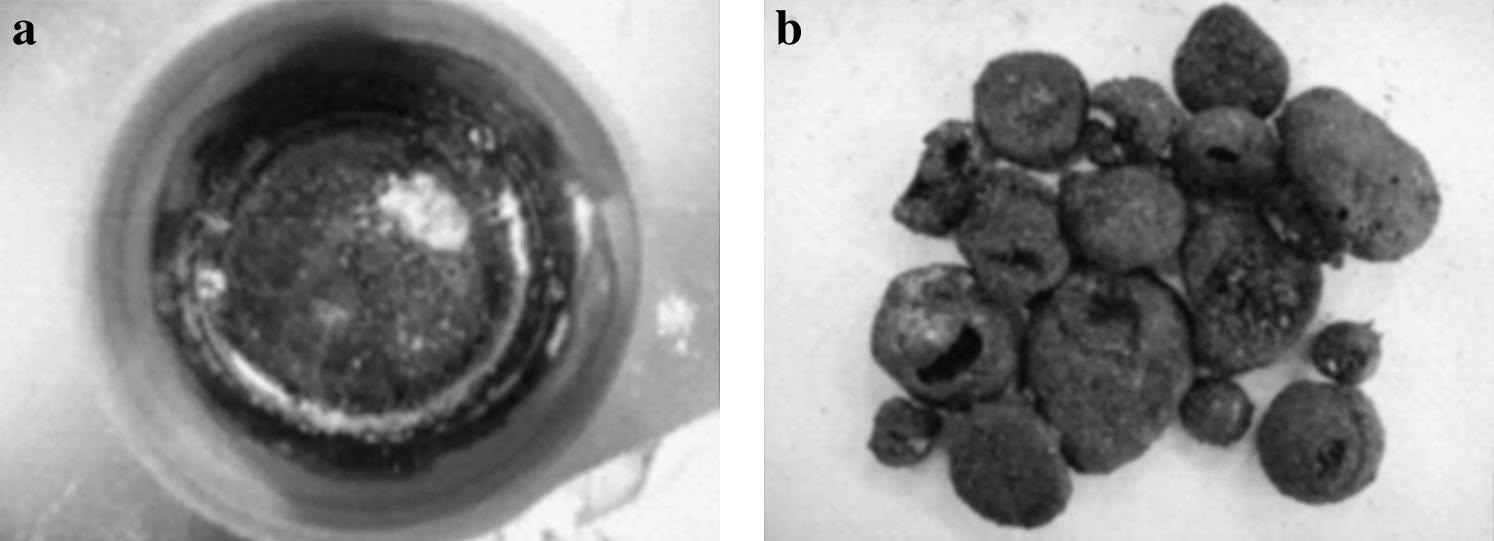
Photographs of slag obtained by slow cooling [case 11: (
The structures of most slags from XRD analysis results were amorphous. But slags from tests 8 and 11 were only showing crystalline structures. Such structures were found at slow cooling and at basicity of 0.6 (melting temperature: 1,450°C; basicity: 0.65; cooling method: air cooling; melting time: 15 min). Results of XRD tests show two sharp peaks (Fig. 8). The peaks were due to crystal structures, which are similar to Augnite. During the slow cooling process (case 11), particles have enough time to arrange themselves in a crystalline structure. Basicity of 0.6 (case 8) was the proper metal mixture that forms crystalline structures. Such information would be useful for further utilization of produced slag such as recyclable valuable materials.

X-ray diffraction results of slag (crystal structure, cts: 0–100, case 8; and cts: 100–200, case 11).
The leaching tests of slag were also carried out to check out its usefulness in recycling and landfilling (Katou et al., 2001; Thamavithya and Dutta, 2008), and the density and absorption ratio were analyzed to estimate relevance as aggregate. Table 5 shows the results of leaching test, density, and absorption ratio. All of the pollutants measured in the leaching test satisfied the Korean standard, and so it could be used as a recycling media. If slag satisfied any aggregate density standard, slag may be considered as construction aggregates. The absorption ratio of slag was satisfied for the standards of all aggregate types.
Others: Se, organic P, TCE, PCE, PCBs.
ND, not detected; TCE, trichloroethylene; PCE, perchloroethylene; PCBs, polychlorinated biphenyl.
Conclusion
Physical, chemical, and thermal characteristics of ASR were analyzed and ASR sampled from a domestic shredding company was experimented in a lab-scale gasification and melting process. Heating value of light fluff (25.96 MJ/kg) was relatively higher because of the presence of a relatively large portion of organic components. The results of characteristics of gas product show that concentrations of CO, H2, and CH4 emitted increased but CO2 and N2 decreased at higher temperatures and lower ER. Especially, the gradual increase of CO2 with increasing ER might be due to the dominance of oxidation reaction (C + O2 → CO2) and favoring the formation of CO2 than CO. The increase of H2 with an increasing temperature might be due to more occurrence of water–gas reaction (C + H2O → 2CO + H2) and the water–gas shift reaction (CO + H2O → CO2 + H2), which are endothermic reactions and favored at higher temperatures. Heating value of gaseous products ranged from 2.5 to 14.0 MJ/m3, and the most important parameters influencing heating value were H2 vol%. The carbon conversion efficiency, Gy, and CO2 increased with increasing ER. Thus, when the temperature was higher, Gy and carbon conversion efficiency were higher. Yields of tar and solid residue were related to carbon conversion efficiency. That is, gasification efficiency had a contrasting tendency with the residue and tar yields. Residue yield was higher than that from other wastes (especially municipal solid waste) because of the metal content in it. The slag portion obtained in this study was about 22 wt%. The structure of most slags in this test was amorphous. Other characteristics such as the leaching property, absorption rate, and the surface morphology were also investigated, resulting in an appropriateness to recycle. The results obtained in this study will be used for further development of melting slag-recycling process in scale-up systems.
Footnotes
Acknowledgments
This work was supported by the Project on Technology Development of Cleaner Production of Korea and was partially sponsored by the KEITI project.
Author Disclosure Statement
No competing financial interests exist.