
Abstract
Abstract
Potential ecological risks of selenium (Se) to migratory birds in wetlands of the Great Salt Lake have not been previously studied. Monitoring results show that total Se concentrations coming from the Jordan River into the Ambassador Duck Club wetland ponds approached 2.0 μg L−1. Bioconcentration of Se occurred in all nine ponds of the wetland system of Ambassador Duck Club. Se bioconcentration factors were over 1,700 L kg−1 in plant tissue and 650 L kg−1 in microinvertebrate tissue above observed Se concentrations in surface water. Se concentration in plant tissue and sediments showed strong linear correlations (r = 0.99 and r = 0.93, respectively) to dissolved Se concentration, whereas macroinvertebrate tissue did not show a correlation with dissolved Se. In addition, plant tissue showed a strong correlation (r = 0.96) to selenate but no correlation to organic-selenide. Selenate was the major species of dissolved Se entering the wetland system and decreased significantly through the wetland ponds as Se speciation shifted to dissolved organic-selenide forms. Substantial decreases in dissolved and total Se concentrations (56% and 49%, respectively) occurred between the first and the seventh of nine ponds (total retention time of 25 to 465 h) of the wetland system. Removal of Se from the water column was caused by Se accumulation in plants, sorption, and sedimentation of Se with organic and inorganic matter, and microbial transformation to volatile Se forms. From the observed concentrations of Se in water, sediment, and biota, and by comparison to other studies in similar environments, we conclude that these wetlands do not currently pose an Se hazard to migratory birds.
Introduction
Se is essential for healthy living organisms; however, the margin between essentiality and toxicity is very narrow, particularly for birds and aquatic species (Lemly, 1997; EPA, 1998; Skorupa, 1998). Sediment and macroinvertebrate Se concentrations of >4 μg g−1 dry weight (dw) and >5 μg g−1 (dw), respectively, and dietary Se concentrations between 5 and 10 μg g−1 have been shown to cause reproduction impairments in birds (Heinz et al., 1989; Ohlendorf et al., 1989; Lemly, 1996; Ohlendorf, 2002). Also, an aquatic concentration of total Se >2.3 μg L−1 (based on avian egg accumulation) was suggested for the protection of birds (Skorupa and Ohlendorf, 1991; Peterson and Nebeker, 1992; Lemly, 1993). A good understanding of the distribution of Se in the wetlands of the Great Salt Lake is important in managing ecological risks of Se to birds and wildlife in these environments.
Se distribution in natural waters is governed by its complex chemistry; that is, it is present in four oxidation states (+6, +4, 0, −2), and in a variety of compounds (oxyanions, sulfides, organoselenium compounds, metal selenides, oxides, and hydroxides) (Zhang and Moore, 1996). The oxidation state and chemical properties of the various forms of Se affect its mobility and toxicity (Besser et al., 1989, 1993; Masscheleyn et al., 1990; Lemly et al., 1993). Selenate and selenite can exist in well-oxidized to mildly reducing conditions. Elemental Se is insoluble and in solid forms (e.g., black amorphous or red crystalline), while selenide, is in soluble organic (e.g., selenomethionine), insoluble metal inorganic (e.g., ferroselite), or volatile organic form (e.g., dimethyl selenide) in reducing environments (Besser et al., 1989; Haygarth, 1994, Skorupa, 1998). Transformations of Se from various oxidation states and between inorganic and organic forms can be microbially mediated and represent a major sink for Se in anoxic settings (Oremland et al., 1989, 1990). Saline (estuarine) and freshwater wetland studies showed biota (plants and invertebrates) to accumulate Se several times above the surrounding water concentration (Zhang and Moore, 1996; Hansen et al., 1998; Terry and Zayed, 1998). Also, Se sedimentation via sorption to, or incorporation into organic and inorganic matter, and precipitation as solid form, can produce a large reservoir for Se in sediments (Bar-Yosef and Meek, 1987; Balistrieri and Chao, 1990; Zhang and Moore, 1996; Hansen et al., 1998; Zhang et al., 2004). Microbial transformations to volatile compounds of Se in rhizosphere and/or via phytovolatilization are important removal mechanisms of Se in wetlands (Thompson-Eagle and Frankenberger, 1990; Terry and Zayed, 1998; Lin and Terry, 2003).
This study aimed to understand if current incoming concentrations of Se from the Jordan River (2.0 μg L−1) pose a potential ecological risk to migratory birds using the ADC wetland, due to transfer and accumulation processes of Se into sediments and biota, all important constituents of the food chain. Correlations between wetland compartments and Se species concentrations and permanent removal process of Se such as volatilization were also investigated. This research required sensitive (ng–μg L−1) analytical methods coupled with matrix interference compensation techniques due to salinity increases in the water ponds, and collection and analysis of representative spatial samples from various wetland compartments.
Materials and Methods
Location
The wetland system used as the basis for this research is part of the ADC, located on the southern shoreline of Farmington Bay of Great Salt Lake (Fig. 1). The ADC wetland system covers 1,003 ha (2,479 acres) of which about 471 ha (1,165 acres) are managed impoundments with depths ranging from 0.1 to 1.0 m and salinities of 0.5 to 19.5 g L−1. The constructed wetland system provides habitat for ducks, Canadian geese, and other aquatic life. Macroinvertebrate populations include amphipods (Hyallela azteca), mayflies (Callibaetis sp.), damselfly (Ischnura sp.), midges (Chironomus sp.), water boatmen (Corisella sp.), and snails (Physella sp.) (Gray, 2005). Submerged aquatic plants (e.g., Stuckenia sp.) are abundant during late spring, summer, and early fall. The Ruppia cirrhosa was also observed in the most saline pond of the wetland system (Pond I) during the same period. The wetland ponds located at the entrance of the ADC wetland system receive nutrient rich water with Se by a series of canals from the Jordan River. Sources of Se to the Jordan River include irrigation return flows, waste discharge from municipal and industrial facilities, and urban runoff as well as some natural tributaries (Aldrich and Paul, 2002).
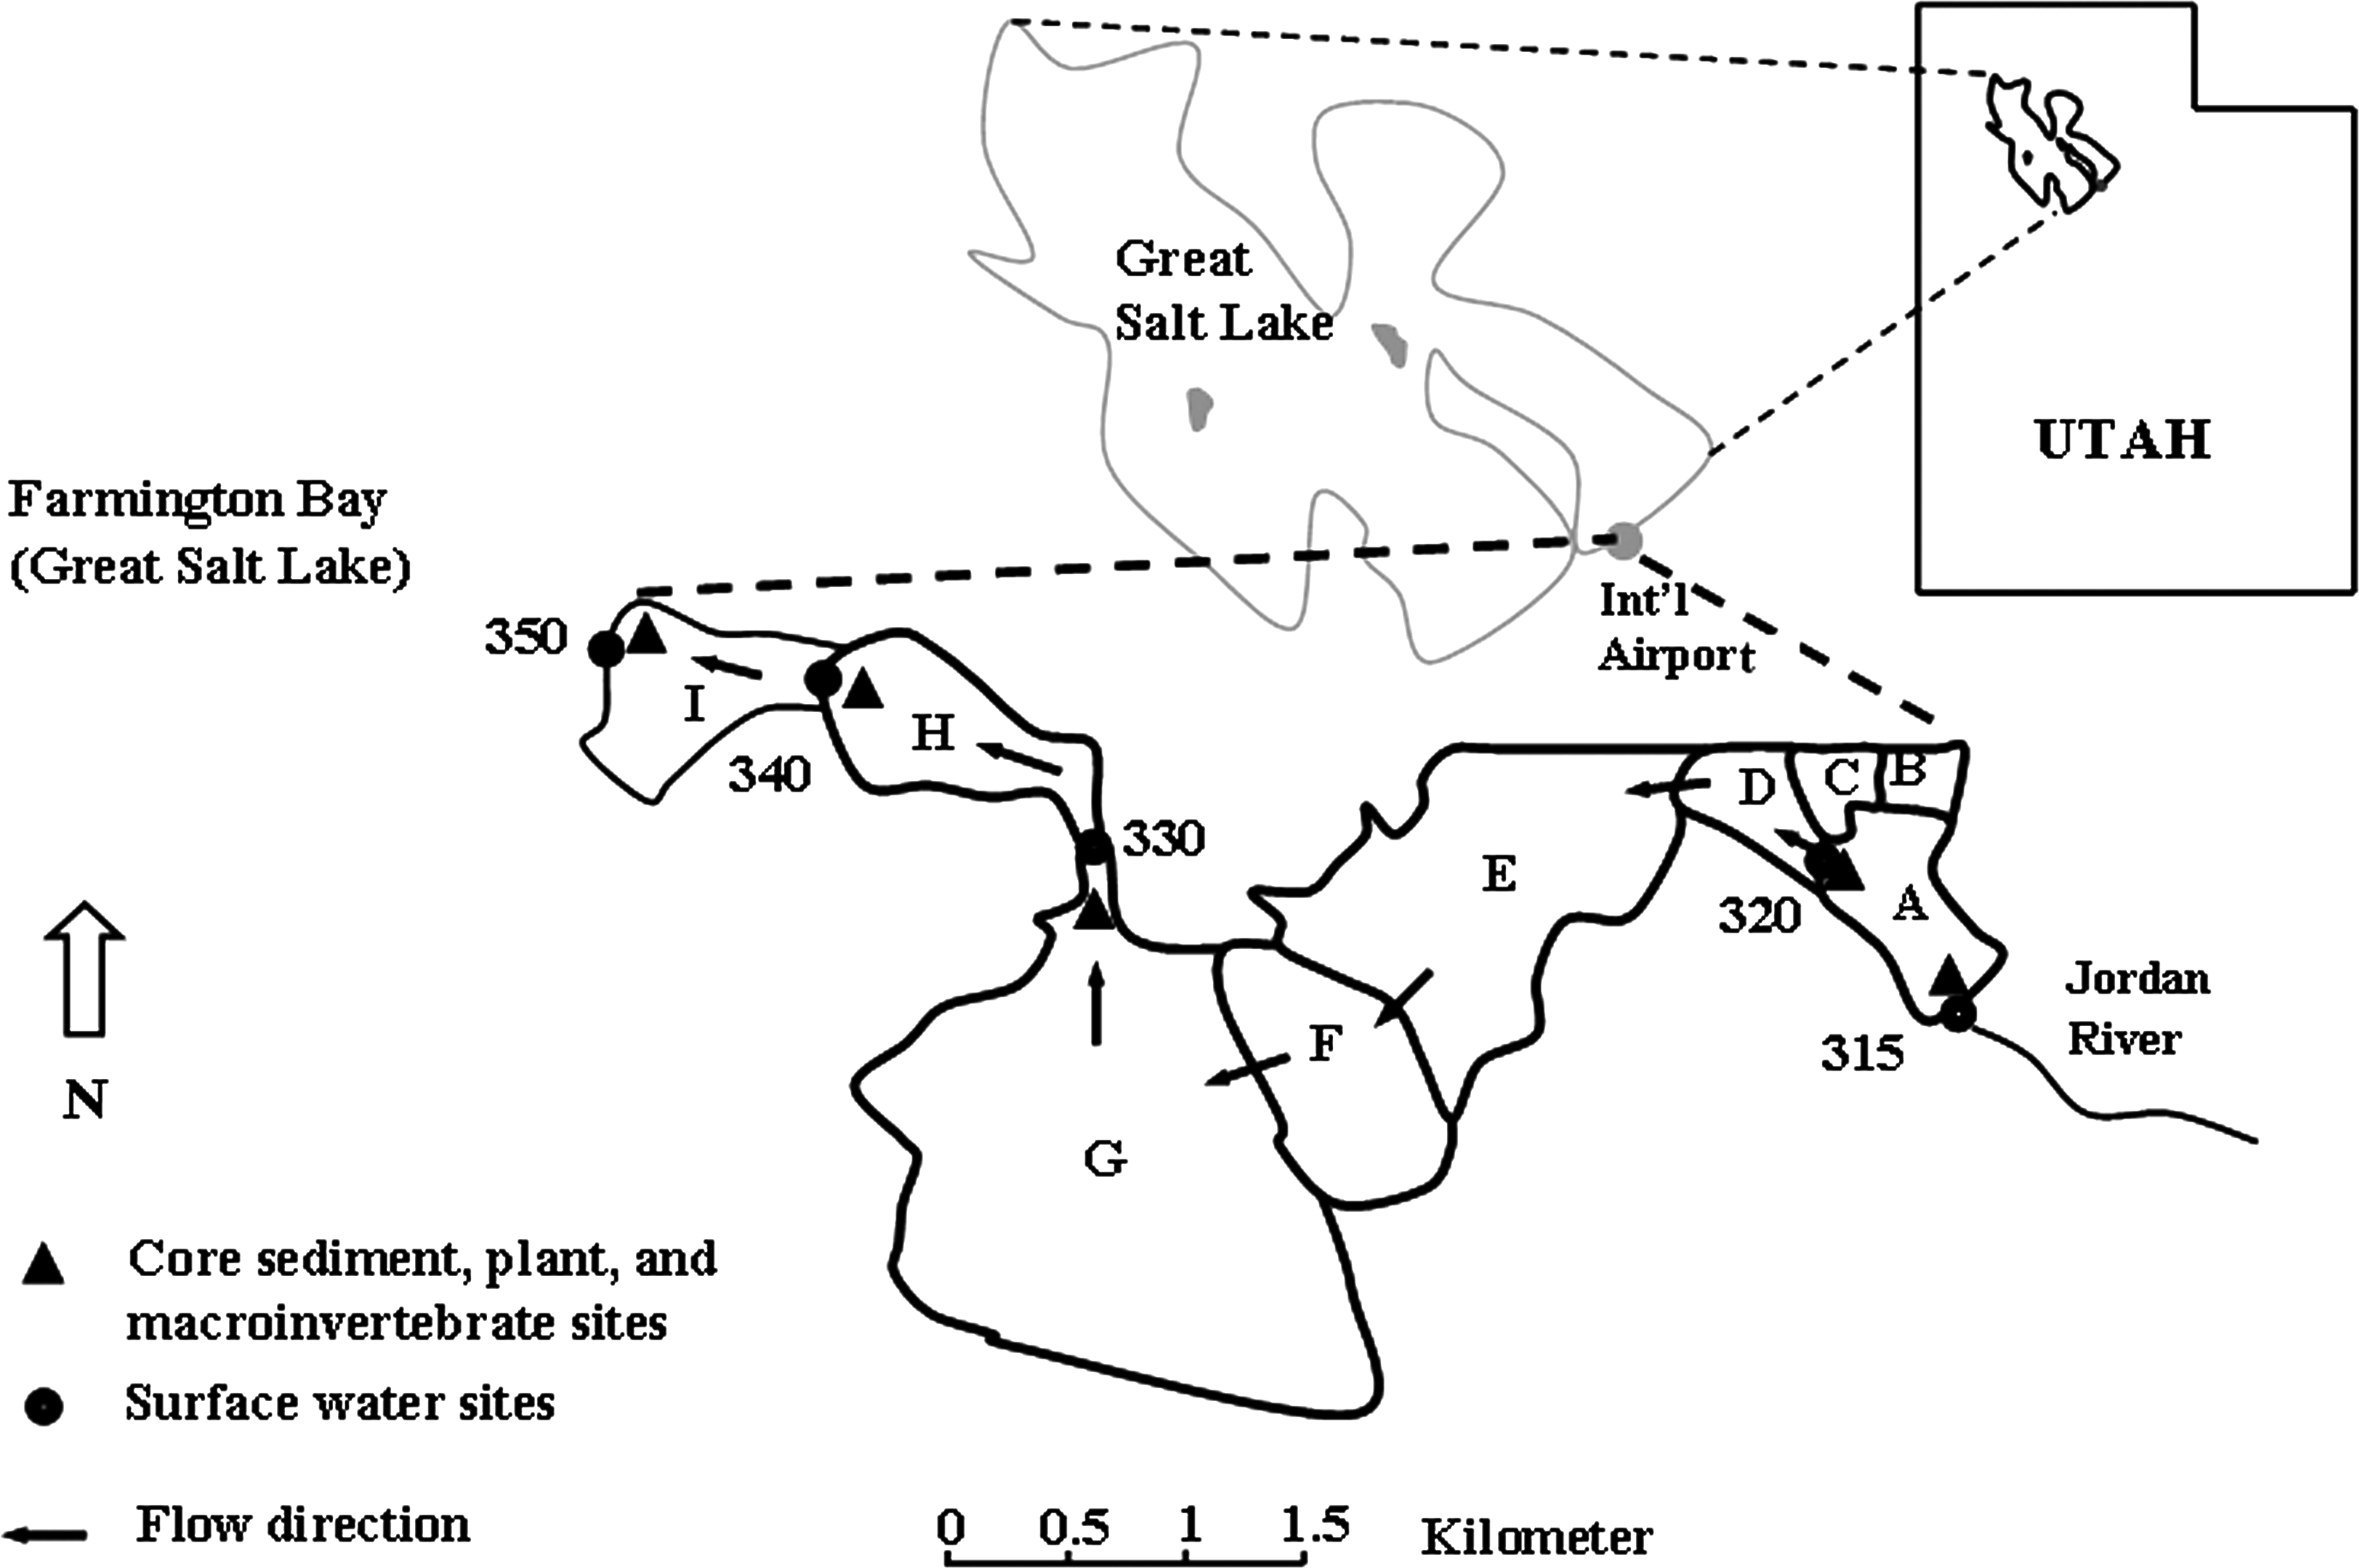
Site map of wetland system studied.
Field measurements
The surface areas of the nine ponds of the ADC wetlands were determined from aerial photographs and Geographic Information System analyses; water depths were measured directly. Residence time for Pond A was determined by tracer dye (uranine) test on October 31, 2005. The test included the release of uranine dye at the inlet of Pond A (Utah Storet number 4895315), and collection of samples at the major outlet of Pond A (Utah Storet number 4895320) every hour beginning 8 h after the experiment begun. The tracer experiment was conducted for 30 h (n = 22).
Residence times in Ponds B through I were estimated based on discharge rates from Pond A and computed pond volumes. Daily flow data at the Lower Jordan River Utah Club (Utah Storet number 4985315) were obtained from the Utah Division of Water Rights (Utah Division of Water Rights, 2008). Jordan River flows are diverted and the wetland ponds are completely drained during February through most of March each year.
Samples of surface water were collected weekly from February 2005 to July 2006 at five sampling sites (Utah Storet numbers 4985315, 4985320, 4985330, 4985340, and 498550). The Storet stations are referred to as 315, 320, 330, 340, and 350 for this article, omitting the 4985 prefix of the Storet code (Fig. 1). These locations represent average cumulative hydraulic residence times in the wetland complex of about 0, 25, 465, 530, and 548 h, respectively. Hourly (24-h) measurements were conducted on September 29–30, 2005, October 24–25, 2005, May 24–25, 2006, and August 17–18, 2007, at site 320. Field samples collection included major cations and anions (i.e., sulfate, chloride, potassium, sodium, magnesium, and calcium), alkalinity (as bicarbonate), nutrients (nitrate, ammonia nitrogen, and total phosphorus), total dissolved solids (TDS), total and dissolved Se, and other trace metals, including total and dissolved arsenic, iron, manganese, and mercury. The total number of surface water samples collected during the study period was n = 644. Interpretation of water Se change may be confounded by lack of replication in water samples to quantify sampling variability for each of their weekly sampling events. However, it is believed that sample frequency is such to compensate for the shortcoming and allow for an accurate interpretation of trends.
Dissolved samples were collected with a geopump using Teflon tubing and field-filtered using 0.45 μm Millipore filters. Particulate concentrations of Se associated with particulates >0.45 μm were computed by subtracting dissolved concentration from total concentration. Se and other metal samples were collected in 250 mL plastic bottles and acidified with nitric acid (HNO3) to lower the pH below 2.0. Holding time for acidified Se and other metal samples was 6 months (Table 1).
TDS, total dissolved solids.
Dissolved oxygen, pH, specific conductance, oxidation–reduction potential (ORP) (using a platinum sensor with silver/silver chloride reference electrode), and water temperature were measured in each pond site concurrently with surface water sample collection, using Troll 9000 or 9500 instruments by In-Situ Inc. The data were recorded after sufficient stabilization time of the probes. Calibration of the probes was performed using a three-point calibration for pH (pH of 4, 7, and 10) and Zobell's solution for ORP (In-Situ, 2010a). Dissolved oxygen optical probe calibration was performed by saturation method as specified by In-Situ (In-Situ, 2010b).
Sediment core (n = 5), plant tissue (n = 4), and macroinvertebrate (n = 4) tissue samples were collected during summer 2005. The sediment core samples were collected using a clear 2.5-cm-diameter plastic tube with core depths ranging from 15 to 24 cm. After collection, sediment cores were immediately placed in a cooler and stored in a freezer at the Utah Division of Water Quality within a few hours. The sediment cores were stored frozen in the dark for 15 months before analysis. Vascular plants were harvested by hand along transects (50 m long) to collect a random sample. Two species of plants were chosen as representative samples, including Stuckenia sp. and R. cirrhosa because they were the predominant species in all ponds. Composite macroinvertebrate samples, including mayflies, damselfly, midges, water boatmen, snails, and amphipods, were collected during daylight hours using a large sweep-net (500 μm mesh size).
Volatile Se samples (n = 10) were collected on June 13, 2007, and August 17–18, 2007, at Site 320. Field collection and processing included pumping water directly from the pond (Site 320) to a 7 L sparge system. The pond water was subsequently purged of volatile Se by using inert helium gas for ∼15 min at a flow of 500 mL min−1. The flowing vapor purged from the reactor was then devoid of water using a water trap (−55°C, dry ice/ethanol) and forced through a glass trap (−196°C, liquid nitrogen). HNO3 was added to the glass trap to oxidize volatile Se compounds to their stable aqueous species. Refer to Diaz et al. (2009) for more details.
Laboratory measurements
Field tracer experiment samples collected hourly were analyzed with a fluorometer at the Center for Water, Ecosystems, and Climate Science Laboratory, at the University of Utah (UU), immediately after collection. Uranine dye concentrations in water samples were measured by fluorometer techniques with multipoint calibration samples composed of uranine and distilled water.
Major ions, alkalinity, nutrients, TDS, total and dissolved Se, and other total and dissolved trace metals, including arsenic, iron, manganese, and mercury, were analyzed at the Utah Public Health laboratory using the methods described in Table 1. Dissolved samples were filtered using 0.45 μm Millipore filters. Total and dissolved Se concentrations were determined by predigesting the samples in potassium persulfate and HCl, and analyzed with hydride generation atomic absorption spectroscopy (HGAAS Analyst 400; Perkin Elmer Corporation) using modified Standard Method 3114 C (Clesceri, 1998). Other metals' (total and dissolved) concentrations were analyzed by inductively coupled plasma (ICP Optima 4300 DV; Perkin Elmer Corporation) optical emission spectrometry, and ICP mass spectrometry (ICP-MS Elan DRC-e; Perkin Elmer Corporation) with dynamic reaction cell to compensate for matrix interference.
Selenite, selenate plus selenite species, and total Se were determined by HGAAS methods using Standard Method 3114 C (Clesceri, 1998) and the Kennecott Environmental and Industrial Hygiene (KEIH) Laboratory (2002a, 2002b) method. Selenite was determined by analyzing nonacidified samples using HGAAS. Combined selenite and selenate was determined by chemical digestion (10 mL of sample in 10 mL of concentrated trace metal grade hydrochloric acid), heating at 90°C for 20 min, and analysis with HGAAS. Selenate was determined by subtracting selenite from the combined selenite and selenate concentration. Elemental Se and selenide species were determined subtracting the selenite plus selenate fraction from total Se. This speciation method does not distinguish between elemental Se, metal selenides, and organic-selenides. Elemental Se and metallic selenide minerals are highly insoluble in water (Haygarth, 1994) and would be expected to immediately precipitate and settle out when formed (Elrashidi et al., 1987; Zhang et al., 2004) given the shallow depths (0.1–1.0 m) of the ponds. On the other hand, organic-selenide is soluble (Haygarth, 1994) and likely to be the major form of reduced Se in solution. Therefore, all dissolved reduced forms of Se that were measured in this study are referred to in this article as organic-selenides. Frozen core sediment samples were sectioned into 2.5 to 7.6 cm sections with a hacksaw. The hacksaw was rinsed with de-ionized water between cuts to avoid sample cross-contamination. Sediment and tissues samples were dried at 65°C for 3 h, and weighted and dried until the weight of the sample did not change. Subsequently, they were predigested using the EPA Method 3051 and a CEM Mars 5 microwave oven at the KEIH Laboratory. Aliquots of 0.5 g of sediment or tissue samples were placed in a Teflon vessel with 10 mL of ultra pure metal grade HNO3, and heated to 175°C for 6.5 min and held at 175°C for 4.5 min. All samples were subsequently analyzed for total Se by HGAAS.
Samples collected on August 17 and 18, 2007, for total and dissolved Se, major ions (i.e., sulfate, chloride, potassium, sodium, magnesium, and calcium), and trace metals (iron, manganese, aluminum, and mercury) were analyzed at the UU laboratory by ICP-MS with collision cell. Volatile Se samples were digested in the closed traps in a water bath at 75°C for 3 h and analyzed using the ICP-MS at the UU laboratory. Sample concentrations were corrected to the recovery of dissolved Se (25%) due to losses in the purge and cryotrap system as described in Diaz et al. (2009).
The bioconcentration factor (BCF) (L kg−1) was determined by dividing the Se concentration in the plant and macroinvertebrate tissue (μg kg−1) by the concentration in water (μg L−1) measured at the same location (Chapra, 1997). The partitioning coefficient between sediment and water (Kd, L kg−1) was determined by dividing the Se concentration in sediments (μg kg−1), by the Se concentration in the co-located water (Chapra, 1997). Statistical analyses were performed by using the Pearson's product-moment correlation coefficient (r) to understand the linear dependence between surface water, biota, and sediment concentrations.
Quality control
Quality control (QC) of surface water samples of Se by HGAAS (at the Utah Public Health laboratory) included check standards (acceptable within ± 10%), laboratory spiked blanks (within ± 10%), laboratory spiked matrix (LSM), and LSM duplicate (LSMD) (LSM/LSMD recovery within ± 30% and relative percent difference of LSM/LSMD was ≤15%). Laboratory analyses of field samples (total, dissolved, and Se species) and matrix spiked samples (n = 32) were performed in triplicates (% Relative Standard Deviation <8.0) to validate the accuracy of the HGAAS method. The Standard Reference Material (SRM) recovery was within ± 10%, while the calibration curve was accepted if R2 (correlation coefficient) was >0.997. The minimum detection limit was 0.18 μg L−1. QC on Se analyzed by ICP-MS (at the UU laboratory) included initial calibration verification, continuing calibration verifications (acceptable within 90%–110% of calibration standards), initial calibration blanks, and continuing calibration blanks that were accepted if below the estimated quantitation limit. The minimum detection limit using the ICP-MS method was 0.007 μg L−1. All water surface laboratory data sets passed QC.
Comparison of samples of mean total and dissolved Se analyzed by HGAAS (1.16 μg L−1 and 1.25 μg L−1, respectively; n = 95) and ICP-MS (1.08 μg L−1 and 1.17 μg L−1, respectively; n = 42) at the same site (320, Pond A) showed good agreement. Also, a sample collected in March 24, 2005, at site 320 analyzed by another laboratory (KEIH Laboratory) using HGAAS method showed values of total and dissolved Se of 1.1 μg L−1 and 1.0 μg L−1, respectively, corroborating our measurements.
Sediment core and tissue (plant and invertebrate) samples QC included blanks, SRM, duplicates, and sample spikes. An SRM (certified durum wheat flour, reference number 8436) containing 1.23 mg kg−1 Se and obtained by the National Institute of Standard and Technology was used to validate sediment and tissue analyses. Sample recoveries were between 83% and 110% on a known reference material spiked at 10 μg L−1 Se.
Volatile Se flux models
The volatile Se flux (JVSe) from the wetland ponds was estimated using available flux models as reported by Chapra (1997) and Schwarzenbach et al. (2003), assuming that the mass transfer of Se vapor is kinetically controlled in the water phase, as opposed to the vapor phase:
where vv is the water transfer velocity across the air–water interface (m year−1), VSew is the concentration of volatile Se in the water column (mole m−3), VSea is the concentration of volatile Se in the air (mole m−3), and He′ is the Henry's constant for volatile Se (dimensionless).
Water transfer velocity models
The water mass transfer velocity can be estimated by using the Whitman's Two-Film model (Chapra, 1997) given the shallow depth and slow-flowing water conditions in the ponds:
where Kl is the liquid film transfer coefficient or mass transfer velocity in the liquid laminar layer (m year−1), Kg is the gas film transfer coefficient or mass transfer velocity in the gaseous laminar layer (m year−1), He is the Henry's constant (atm m3 mole−1) obtained from Karlson et al. (1994), R is the universal gas constant (8.206 × 10⁻⁵ (atm m3°K −1 mole−1), and Ta is the absolute temperature of water in kelvin (°K).
Kl and Kg were determined by the following relationships as reported by Mills et al. (1982):
where
The oxygen transfer coefficient,
Values of Sc for O2 in water were obtained from Schwarzenbach et al. (2003). The U10 (Mackay and Yuen, 1983) was computed using data available from the National Oceanic and Atmospheric Administration (2007a, 2007b) at the Salt Lake City International Airport.
The modified Liss and Merlivat model (Liss and Merlivat, 1986; Livingstone and Imboden, 1993) provides an alternate approach and corroborates the results of the Two-Film model. This model estimates the water transfer velocity, vv at velocities in the range of velocities occurring in the wetland ponds, corrected for the Schmidt number according to the boundary layer model (Schwarzenbach et al., 2003):
Since no Sc is available for dimethyl selenide, the Sc for the analogous dimethyl sulfide was used according to the relationship given by Saltzman and King (1993). The mass transfer of Se (kgSe year−1) to the atmosphere due to volatilization was computed by multiplying the volatile Se flux (μgSe m−2 year−1) by the surface areas (m2) of the ponds (Table 2).
Incremental values represent residence times for individual ponds. Cumulative data reflect total residence times starting from the first pond in the system.
Assumes 50% of flow from Pond A goes through Ponds B and C, while the remaining flow goes directly to Pond D.
Results
Hydraulic residence time
Hydraulic residence times in the wetland system (Pond A through Pond I) ranged from about 3 h (Ponds B and C) to about 12 days (Pond G) as shown in Table 2. The computed cumulative water residence time through the pond system was about 548 h (22.8 days) (Table 2).
Water column chemistry
Diel dissolved oxygen concentrations in this system varied widely, from a high of 24 mg L−1 (daytime) to a low of 0.1 mg L−1 (nighttime) (Table 3). Average pH increased from 8.1 at the influent to Pond A to 9.4 at the discharge to the Great Salt Lake. Mean ORP measurements ranged from 98 mV in Pond H (outlet of wetland system) to 316 mV in Pond A (inlet of wetland system). Water temperatures ranged from 29°C in July to 1°C in February.
Values in parentheses represent minimum/maximum.
DO, dissolved oxygen; ORP, oxidation–reduction potential.
Influent water from the Jordan River and associated canals contained relatively lower concentrations of major dissolved ions, including chloride (209 ± 106 [± 1 standard deviation] mg L−1), sulfate (155 ± 69 mg L−1), potassium (12 ± 5 mg L−1), sodium (161 ± 60 mg L−1), and magnesium (40 ± 13 mg L−1), and relatively higher concentrations of nitrogen (primarily nitrate, 1 ± 1 mg L−1) and phosphorus (0.6 ± 0.2 mg L−1), with respect to Pond I. Dissolved trace metals, including mercury (0.2 ± 0.04 μg L−1) and manganese (40 ± 13 μg L−1), were also higher in the first pond than in the last pond of the system (Table 4). Major ion concentrations (chloride, sulfate, sodium, and potassium) increased significantly due to evaporation as the water moved through the ponds, resulting in a significant increase in TDS (up to 19,500 mg L−1).
Values in parentheses represent minimum/maximum. Filtered metals have been filtered with a 0.45 μm filter.
Se, selenium.
Total Se concentrations are highest in Pond A. Substantially lower Se concentrations are discharged (<50%) to the Great Salt Lake from the lowest pond (Pond I) (Fig. 2). Average total and dissolved Se concentrations decreased between the outlet of Pond A (Site 320) to the outlet of Pond G (Site 330) (i.e., from 1.2 to 0.6 μg L−1 [total], and from 1.1 to 0.5 μg L−1 [dissolved]), whereas total and dissolved Se concentrations remained consistent (0.7 and 0.6 μg L−1, respectively) downstream of Pond G (Sites 340 and 350). Similar trends were observed for other trace metals, including dissolved manganese, and dissolved iron concentrations (Table 4). Dissolved Se was consistently higher (0.5–1.1 μg L−1) than the Se associated with particulate matter (0.08 to 0.1 μg L−1) at all sample sites during the entire study period (Fig. 3). Volatile Se concentrations measured in Pond A ranged between 0.9 ng L−1 at 2 a.m. Mountain Daylight Time (MDT) on June 13, 2007, and 3.7 ng L−1 at 7 p.m. MDT on August 17, 2007. These values represented ∼0.1% to 0.3% of the average dissolved Se measured in the water column of Pond A (1.12 μg L−1).
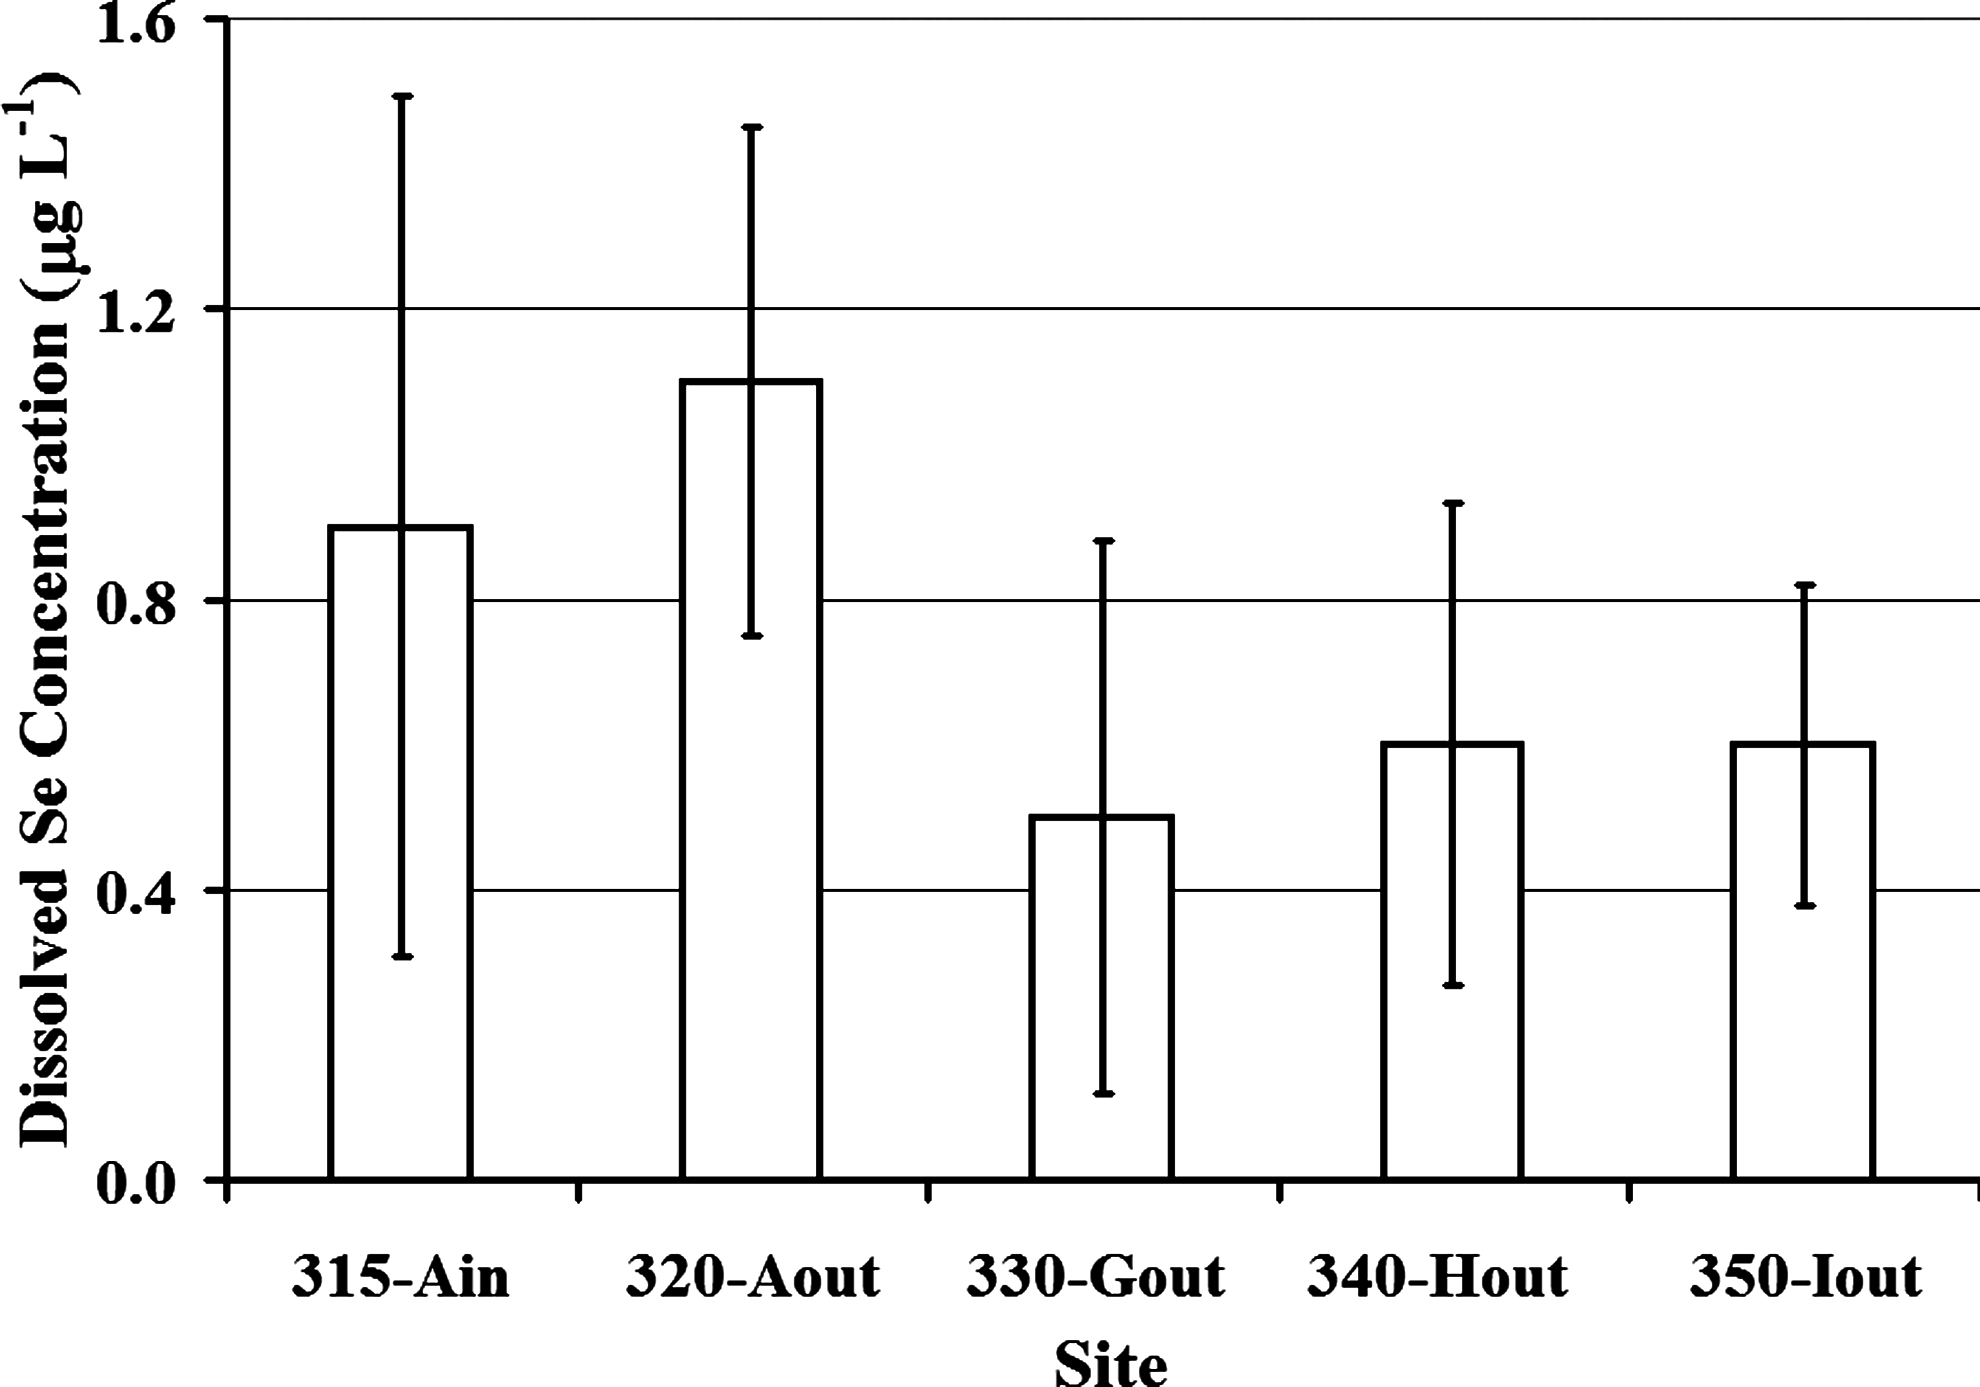
Average dissolved Se concentrations at each sampled site in the Ambassador Duck Club wetland system. Ain, inlet of Pond A; Aout, outlet of Pond A; Gout, outlet of Pond G; Hout, outlet of Pond H; and Iout, outlet of Pond I; Se, selenium.
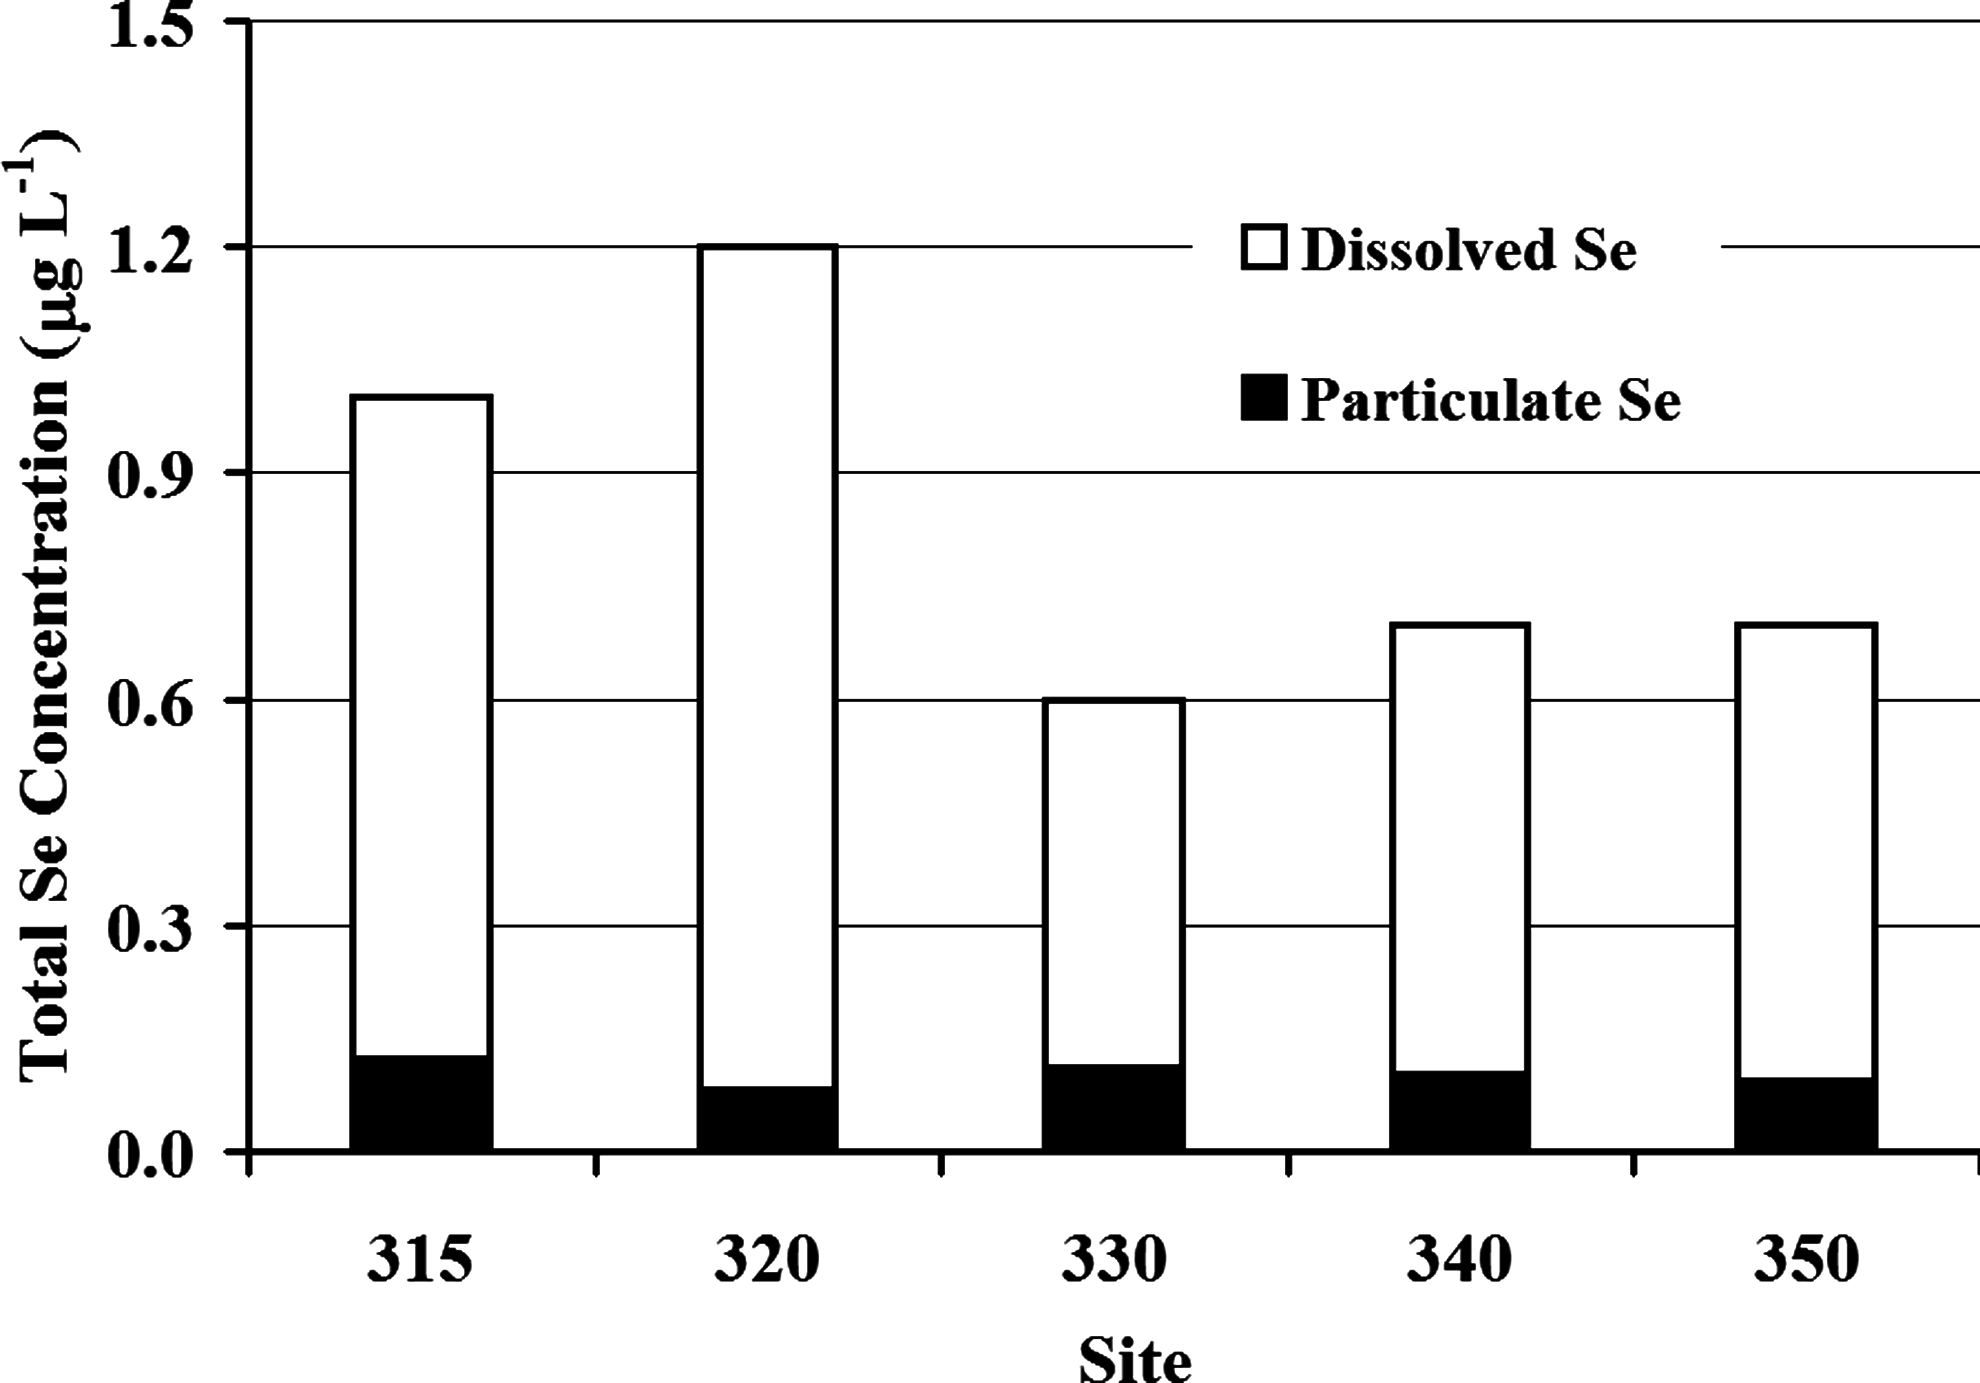
Mean dissolved and particulate concentrations of Se observed at each sampled site.
Se speciation
Se enters the ADC wetland system (Site 315) as primarily selenate, accounting for 79%–95% of total Se (Table 5). Total selenate concentrations ranged from a high of 1.5 μg L−1 entering Pond A to nondetectable concentrations (<0.18 μg L−1) in Pond G, and replenishment occurred (e.g., re-oxidation or contribution from other sources) in Pond I (0.57 μg L−1) in total Se (September 19). Meanwhile, the more reduced species of Se (i.e., soluble organic-selenide) increased in most downstream ponds. Organic-selenide concentration increased substantially between Ponds A and G (up to 0.9 μg L−1, September 19), replacing selenate as the dominant Se species in the water column. Figure 4 shows the average fractions of Se species (selenate, selenite, and organic-selenide; n = 16) during the study period. These mean concentrations of Se species in the wetland system generally show selenate predominance in Pond A (Sites 315 and 320) shifting to soluble organic-selenide as major species in Pond G, Pond H, and Pond I (Sites 330, 340, and 350).
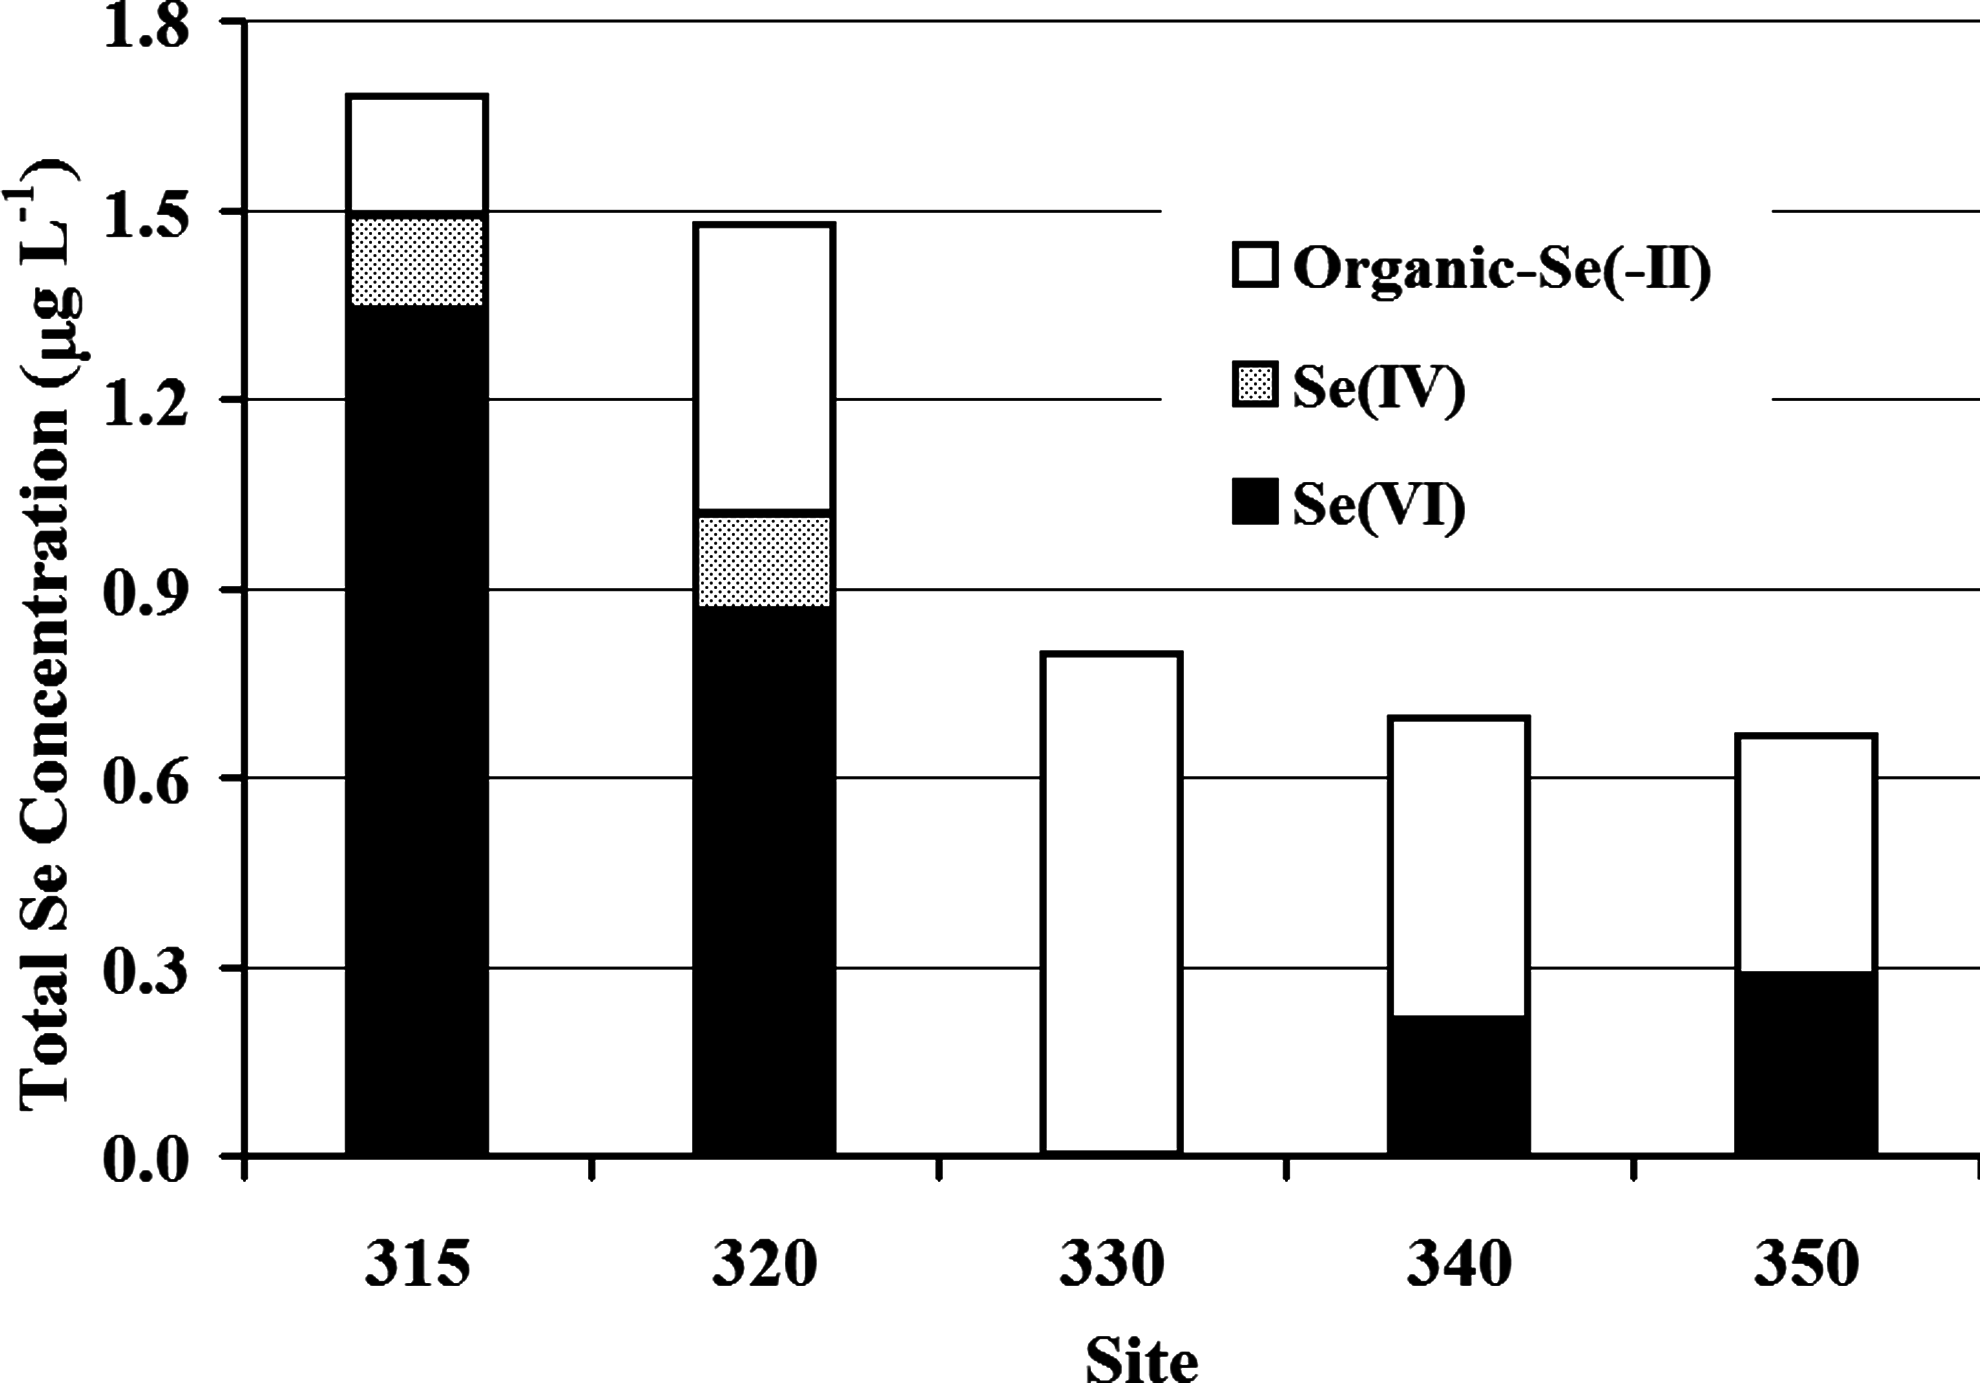
Average selenate, selenite, and organic-selenide species by site. Selenate shifts to reduced Se species at site 330. Some oxidation of reduced Se species is shown at Sites 340 and 350.
Utah Storet Sites 4985-.
Assumed as dissolved organic-selenide.
Se(VI), selenate; Se(IV), selenite; Diss., dissolved; nd, non-detectable (<0.18 μg L−1).
Se distribution in sediments
Sediment core samples in the wetland system showed Se concentrations in Pond A of 0.97 mg kg−1 (dw) at the surface (0.0 to 2.5 cm), increasing to 1.97 mg kg−1 (dw) at 2.5 to 5.0 cm below the sediment surface, and then decreasing to 0.73 mg kg−1 (dw) at ∼ 24 cm (Fig. 5). Surface sediment (0.0 to 2.5 cm) Se concentrations dropped dramatically from 0.97 to 0.35 mg kg−1 (dw) from Pond A to Pond G, consistent with the decrease in dissolved and total Se observed in the water column. Core sediment analyses for the top 20 cm of the sediment (Fig. 6) showed a clear spatial variation in Se accumulation between sites. Pond A sediments in the top 20 cm (Sites 315 and 320) have the most Se with average concentrations ranging from 1.05 to 1.43 mg kg−1, whereas Pond I has the least Se with a concentration of 0.15 mg kg−1. The Kd between sediments and water ranged from 860 L kg−1 (Pond A) to 290 L kg−1 (Pond I). Water column total selenate concentrations were strongly correlated to surface sediment concentrations (r = 0.86), whereas organic-selenide water column concentrations did not show any correlation to surface sediment. This suggests that the wetland system (and especially Pond A) is effective in transferring selenate from the water column to the sediments.
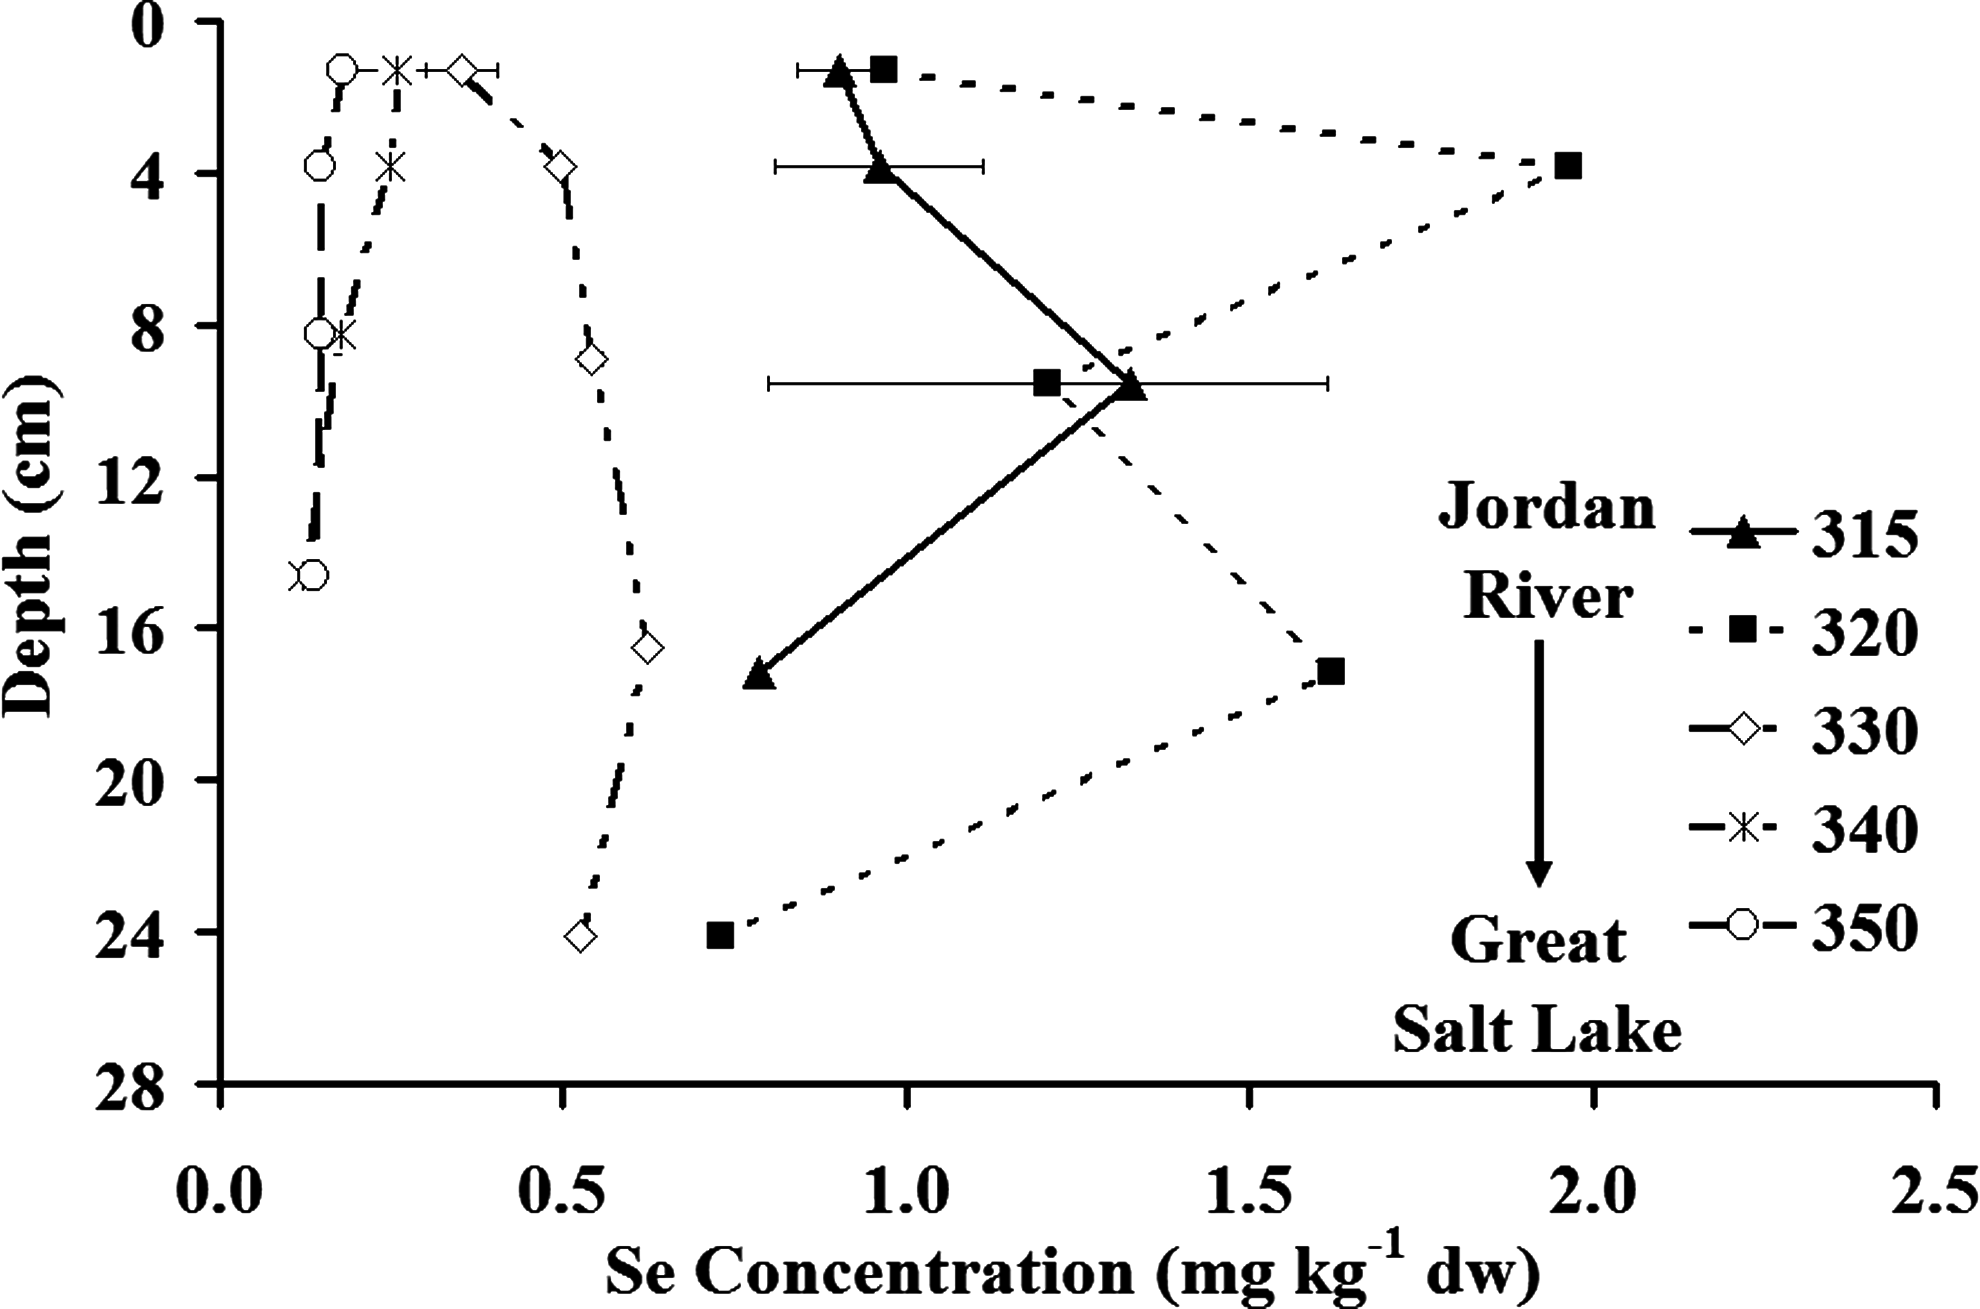
Se concentrations in core sediment samples collected on July 12, 2005. Depths of the cores ranged from 15 to 24 cm. The error bars represent ± 1 standard deviation.
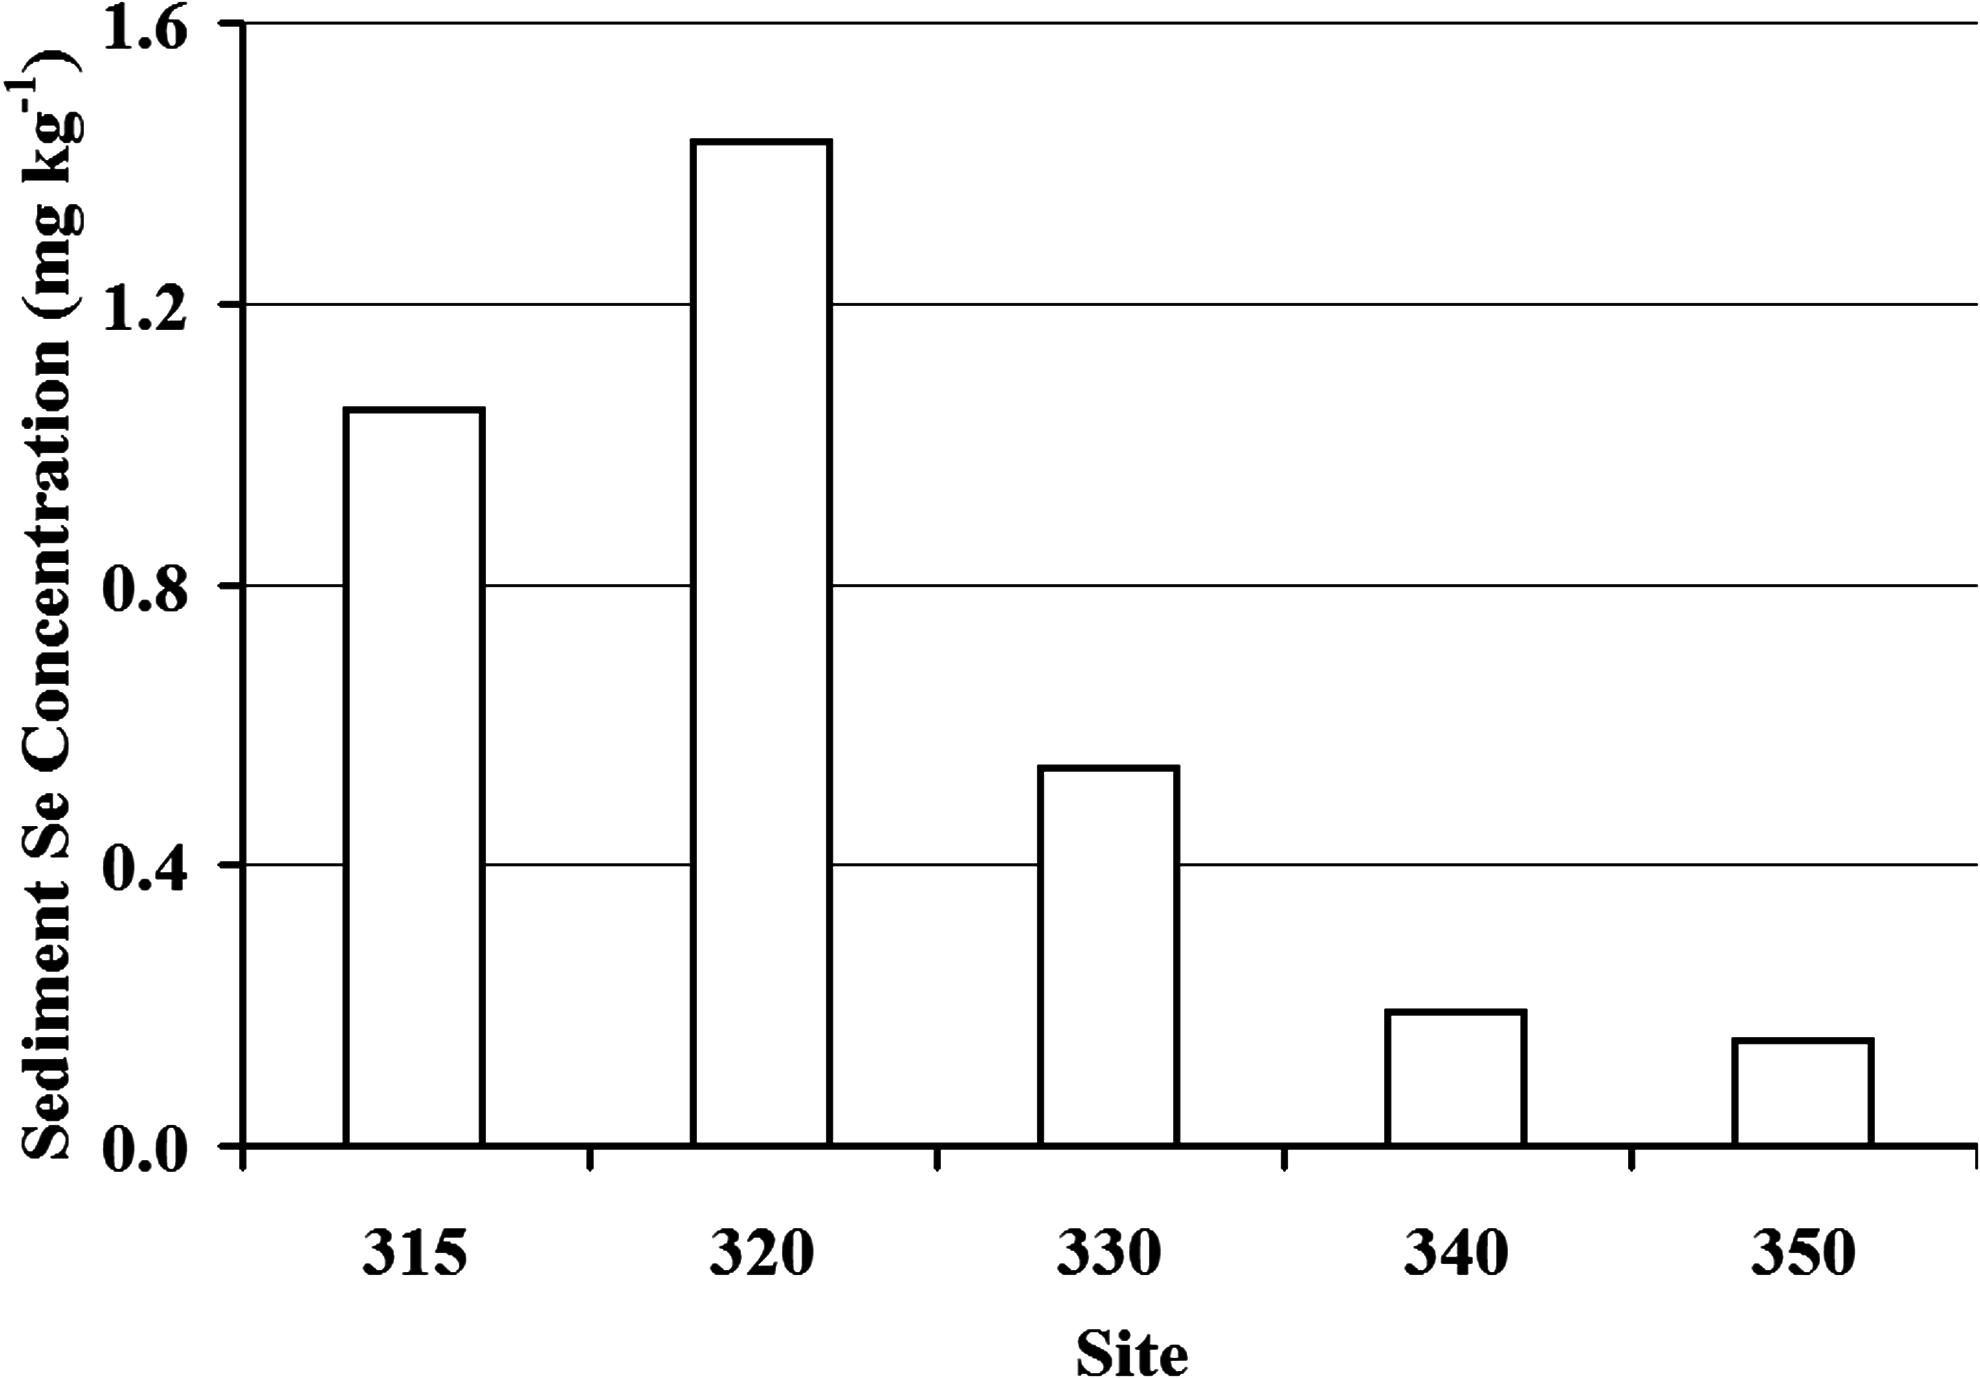
Average sediment Se in the top 20 cm in each site. Se deposition is much higher in Pond A (Sites 315 and 320) than in the downstream ponds (Sites 330, 340, and 350).
Se accumulation
Se accumulation in submerged plants and macroinvertebrate was observed at each sampled site (Fig. 7). In the submerged plants (Stuckenia sp. and R. cirrhosa), Se BCF was between 220 and 1,700 L kg−1 above water column concentrations (dissolved Se), whereas plant concentrations were 0.3 to 2 times as high as those in sediment from the same sites. Se concentrations in plant tissue showed a strong linear correlation to dissolved Se concentrations in water (r = 0.99) and Se concentrations in surface sediments (r = 0.93). Plant tissue also showed a strong positive linear correlation to selenate (r = 0.96) and no linear correlation with organic-selenide. Not enough data were available for correlating selenite to tissue (plant and invertebrate) concentrations. Plant tissue showed a substantial decrease in Se concentration from 1.91 mg kg−1 in Pond A [dw]) to 0.12 mg kg−1 (dw) in Pond G, corresponding to a 95% decrease (Fig. 7).
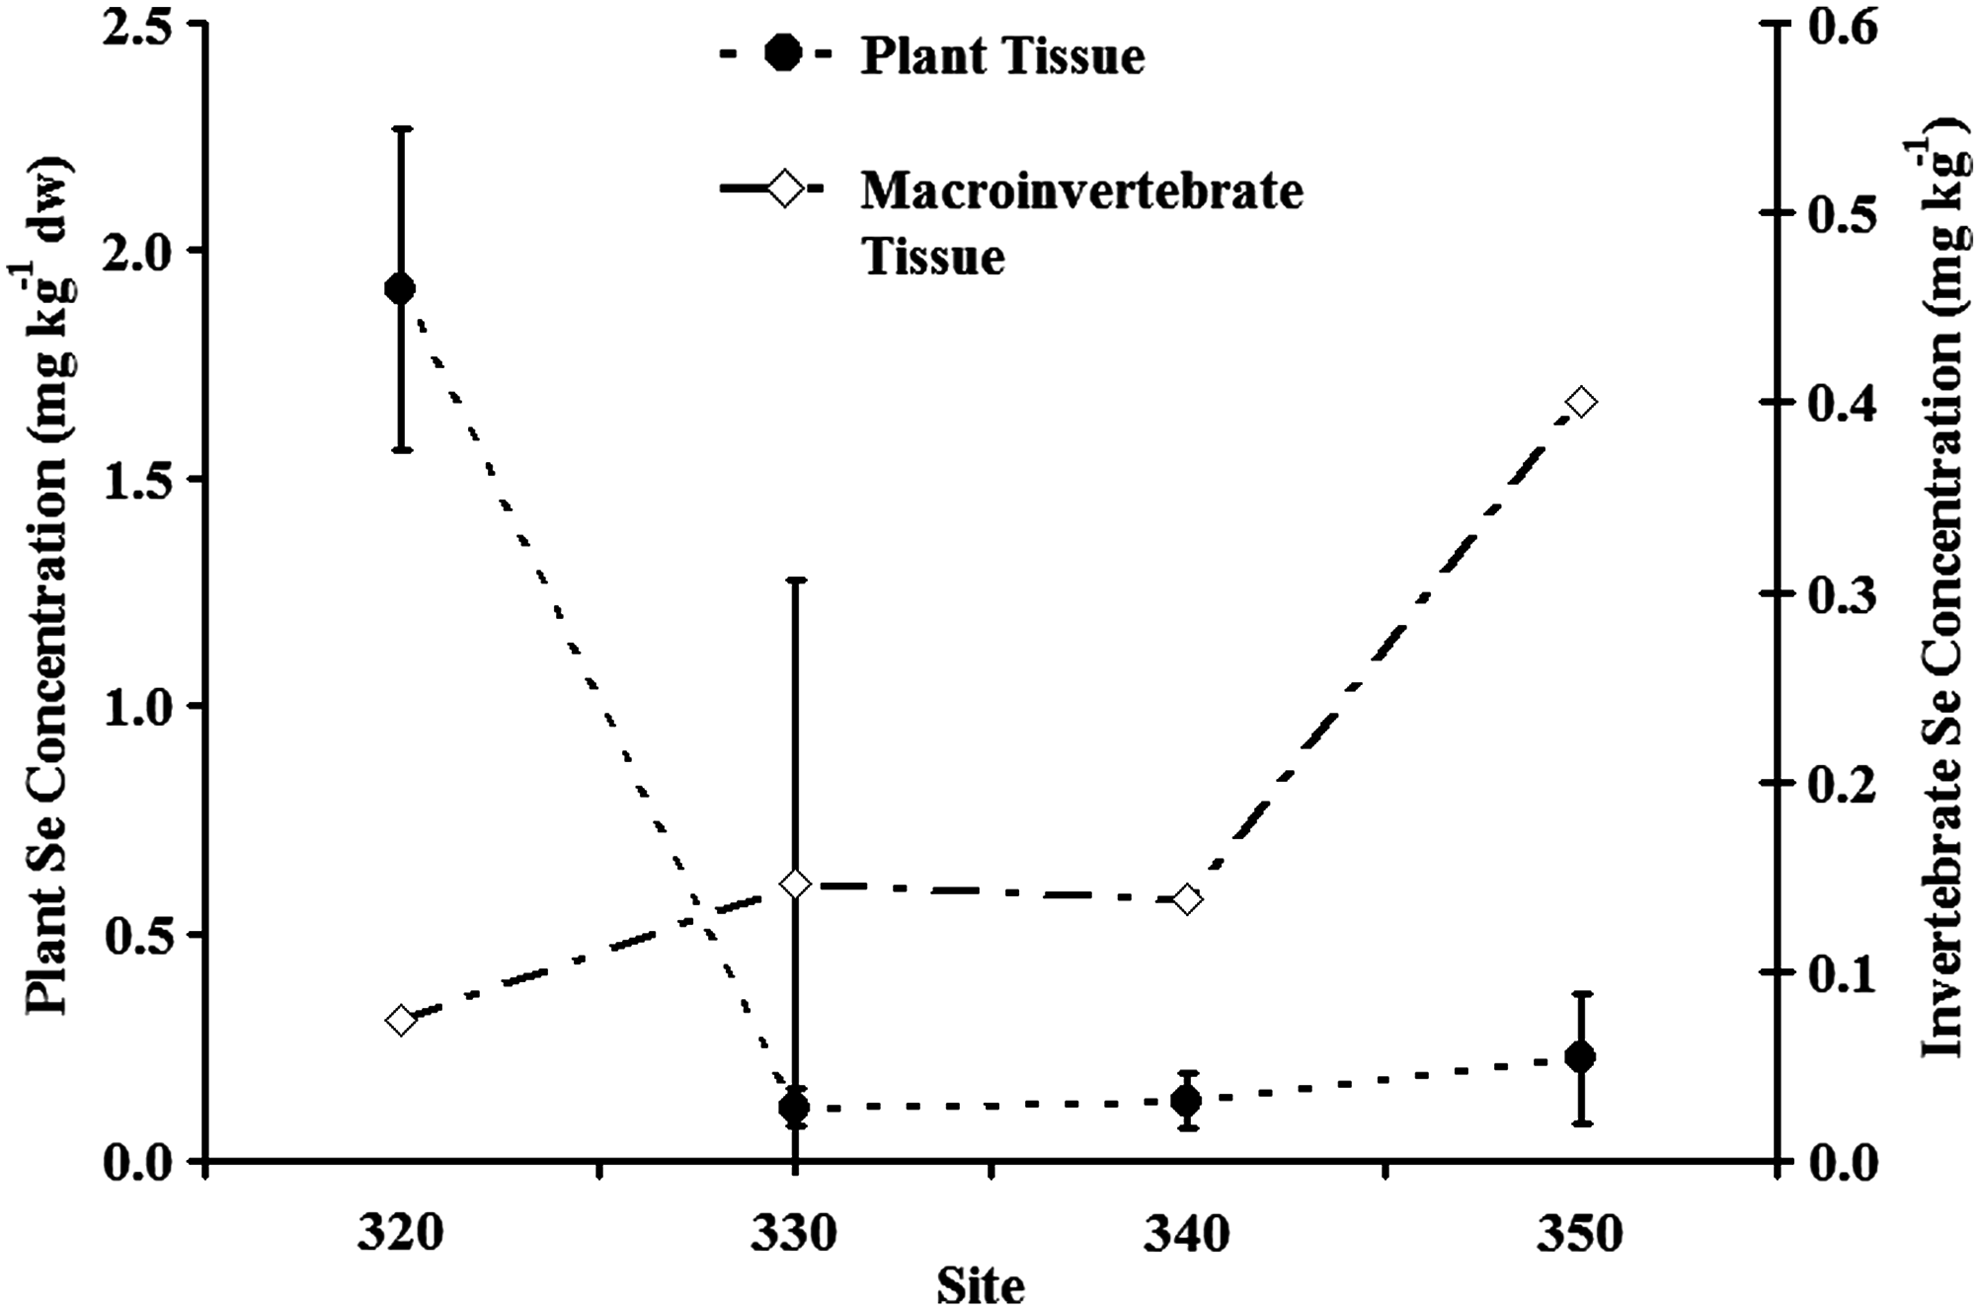
Average Se concentrations in plant tissue (Stuckenia sp. and Ruppia cirrhosa) and macroinvertebrate tissue (i.e., amphipod, mayflies, damselfly, midges, water boatmen, and snails). The error bars represent ± 1 standard deviation.
Composite macroinvertebrate (i.e., amphipod, mayflies, damselfly, midges, water boatmen, and snails) samples had Se BCF from 66 to 650 L kg−1 above water (dissolved) concentrations, and concentrations from 0.1 to 2.2 times the co-located sediment concentration. The macroinvertebrate Se concentrations, contrary to Stuckenia sp. and R. cirrhosa, showed no linear correlation to either water concentrations of dissolved Se, sediment or plant tissue Se concentrations. Also, microinvertebrates tissue Se concentrations did not show any correlation with selenate or organic-selenide; however, the macroinvertebrate Se concentrations increased substantially through the ponds with distance from the inlet. Se concentration in Pond G microinvertebrates (0.15 mg kg−1 [dw]) were higher than in Pond A (0.07 mg kg−1 [dw]) (Fig. 7), despite the fact that sediment, water, and plant concentrations were the lowest among the sampling sites.
Discussion
The Jordan River and a series of canals transport Se into the ADC wetland system. The majority of Se occurs in the oxidized selenate form as it enters this system. Much of it is removed from the water column via several mechanisms, including biologic uptake, sorption, sedimentation, and volatilization processes. The substantial uptake of Se by submerged rooted plants is likely one of the major mechanisms in the loss of dissolved Se from Pond A to Pond G. Similarly, the loss in dissolved (total) Se in Pond G was the result of decreases in both selenate and selenite. Selenate and selenite predominance in Pond A are biologically important because aquatic plants preferentially bioaccumulate selenate and selenite over organic-selenide (Zayed et al., 1998). In our case, the predominance of selenate (during oxic conditions) in Pond A would favor uptake by aquatic plants (Stuckenia sp. and R. cirrhosa) as corroborated by the strong correlation (r = 0.96) between them.
Although plant tissue Se concentrations were very high in Pond A, plant tissue concentrations in the downstream Ponds G, H, and I were much lower. This is consistent with the much decreased concentrations of selenate and selenite in the water column and in the sediments (that would be available for uptake or sorption) and is supported by the strong linear correlation between selenate (r = 0.96) and plant concentrations and no correlation between organic-selenide and plant concentrations. Poor assimilation of the more reduced Se species, elemental Se, and metal selenides, by aquatic plants has been also reported by Masscheleyn and Patrick (1993). However, Se accumulation by plants can be also inhibited by the presence of significant concentrations of dissolved sulfate (Terry et al., 2000) in Ponds G, H and I. Indeed, sulfate increased by a factor of about 22 from 84 mg L−1 in Pond A to 1,820 mg L−1 in Pond I.
The cause of the consistent increase in macroinvertebrate tissue concentration relative to water column and sediment concentrations (97%, −439%; Figs. 6 and 7) is not clear. Both selenate and organic-selenide concentrations did not correlate linearly to invertebrate concentrations. Organic Se was shown to bioaccumulate into wetland invertebrates at much higher levels than either selenate or selenite (Besser et al., 1989; Besser et al., 1993). It is hypothesized that predominance of organic-selenide in Ponds G through I (Sites 330, 340, and 350) facilitated bioconcentration of Se in microinvertebrates even if there is no correlation between them. Further, the macroinvertebrate tissue concentrations increased despite the fact that dissolved Se fell substantially. This finding is important because it indicates that wetland systems with low levels of dissolved Se may still have high concentrations of Se in biota (i.e., macroinvertebrate) due to potential high accumulation of organic Se. Dissolved (total) Se concentrations in the water column varied over time (seasonally) causing the BCF between water, invertebrate, and plant tissue to change by one order of magnitude (from 66 to 650 L kg−1, and from 220 to 1,700 L kg−1, respectively).
Water-sediment or water-suspended sediment reactions with selenite could be also a major mechanisms responsible for the reduction in dissolved Se observed in the wetland system. Reduction of selenate to selenite caused by microbial activity or respiration processes in the ponds would drive pH changes conducive to selenite adsorption to sediments and suspended solids (Bar-Yosef and Meek, 1987; Balistrieri and Chao, 1990). Association of Se to particulates (≥0.45 μm) at the outlet of Pond A (Sites 315 and 320) and subsequent settling of solids may partially explain the higher concentrations of Se in Pond A top 20 cm sediments as compared to the other ponds. Settling of organic matter (decaying plant tissue and organic litter) may provide a substantial contribution of Se to sediments. Stepwise decrease (up to a factor of 10) from the first to the last pond (Pond A through Pond I) in sediment Se concentrations corresponded to a decrease of available particulate Se (Fig. 3) and reduction in submerged plant tissue due to decrease in available nutrients (Table 4).
Volatile Se concentrations were up to 3.7 ng L−1 in Pond A, based on several measurements made during June and August 2007. This value represents only 0.3% of the concentration of mean dissolved Se measured in the same pond (1.12 μg L−1). Yet, this concentration is significant because of the large surface area of the wetland ponds (∼4,700,000 m2) relative to their depths (0.1–1.0 m). Reduction of Se by microorganisms in sediments may produce volatile Se compounds (e.g., dimethyl selenide) (Oremland et al., 1990; Chasteen, 1998), which may escape across the water–air interface. Further, abundant submerged aquatic plants may facilitate rhizosphere microbes reduction and metabolism of selenate or selenite to organic forms of Se (e.g., selenoaminoacids), which may be volatilized by plants (Terry and Zayed, 1998)
Estimates of yearly volatile Se flux based on the dissolved volatile Se concentration of 3.7 ng L−1 showed that Se flux ranged from 2.14 to 3.42 (mg Se/m2/year). This translates to volatile Se flux for the entire wetland system of 9.2 to 15.1 kg Se/year. The yearly load of Se into the wetland during the 2005–2006 study period based on a total Se concentration incoming in the system of 2.0 μg L−1 was 64.5 ± 5.4 kg Se/year. The volatile Se loss from the wetland system to the atmosphere represents 16% to 25% of the maximum yearly Se load. Therefore, volatilization is a significant permanent removal mechanism of Se from these wetlands.
Matrix interference in saline ponds
Measurements of trace amounts of Se in saline waters are challenging due to matrix interferences (Moellmer et al., 2007). Se measurements made in Pond I (site 350) by Utah Department of Environmental Quality containing TDS concentrations up to 19,500 mg L−1 before this study were analyzed by conventional ICP-MS as freshwater samples (TDS < 1,500 mg L−1), without the use of dynamic reaction cell or collision cell apparatus. In this study, we showed that Pond I measurements never exceeded a total Se concentration of 1.0 μg L−1. We believe that the difference in Se concentrations between the conventional ICP-MS measurements made before this study and HGAAS measurements performed during this study (i.e., 4.4 μg L−1 and 1.0 μg L−1, respectively) were the result of polyatomic interference caused by the saline matrix (Moellmer et al., 2007).
Migratory birds implications
Several environmental toxicology assessment studies on birds have identified Se concentrations in environmental matrices that are likely to be indicative of effects in water birds. Surface water concentrations above 2.0 μg L−1 (as total Se) were shown to affect avian eggs (Skorupa and Ohlendorf, 1991; Peterson and Nebeker, 1992; Lemly, 1993). The concentrations of Se in Pond A of ADC are up to 2.0 μg L−1 (total) in surface water, 1 μg g−1 (dw) in sediments, 2 μg g−1 (dw) in plant tissue, and 0.07 μg g−1 (dw) in microinvertebrates. These levels appear to be below the hazard threshold for migratory birds, with the exception of surface water concentrations in Pond A which, are approaching the suggested levels for avian egg health.
Further research should be conducted to understand these impacts and the relationship between surface water Se and its chemical forms to birds. Further, more data should be collected to understand seasonal and spatial variation of Se in biota and sediments especially during the migratory seasons.
Conclusions
Relatively low concentrations of Se (up to 2.0 μg L−1) in freshwater and saline wetlands bordering the Great Salt Lake showed to be effectively transferred to sediments, and accumulate in plant and microinvertebrate tissue. Selenate was conducive to Se accumulation in plants, and seemed to correlate well to plant tissue and sediments. Reduced forms of Se (i.e., organic-selenide) predominated the downstream wetland ponds. Both sediment and biota (plant and macroinvertebrate) provided a reservoir for Se, whereas volatilization permanently removed dissolved Se from the water column. The results of the study showed that the ecological risks to migratory birds are low from sediments and tissue (plant and macroinvertebrate) concentrations at current levels of Se in water (2.0 μg L−1). However, if reverse osmosis concentrate was allowed to be discharged in the Jordan River, the water column concentrations (4.2 μg L−1) entering the ADC ponds would be above the suggested limits for avian egg effects and approaching the chronic limit for aquatic wildlife in the State of Utah.
Footnotes
Acknowledgments
The authors thank the Utah Division of Water Quality, the US EPA (Region 8) and Central Davis Sewer District for financial support; the UU Laboratory, KEIH Laboratory, for assistance with water quality and Se analysis, and the ADC for providing access for this research.
Author Disclosure Statement
No competing financial interests exist.