
Abstract
Abstract
Synthetic dyes are extensively used in industrial processes but do not degrade easily in the environment. Microbial decomposition is a cost-effective alternative to chemical and physical degradation processes. In the present study, we studied the potential effects of using an aerobic biofilm reactor, a hydrolytic reactor, and a combined aerobic–hydrolytic reactor system for treating the anthraquinone dye Reactive Blue 19 (RB19). Compared with the aerobic and hydrolytic reactors, the combined aerobic–hydrolytic reactor system achieved the highest removal efficiency regarding color and chemical oxygen demand, at 95.6% and 83.7%, respectively. Microbial communities in the reactors were analyzed with denaturing gradient gel electrophoresis based on bacterial 16S rRNA genes. A statistical analysis of the denaturing gradient gel electrophoresis profiles demonstrated that the structure of the RB19-degrading consortium changed between the different reactors. All band sequences recovered were assigned to two phyla, Proteobacteria and Firmicutes. A clone corresponding to a Shewanella strain was assumed to be responsible for the RB19 decomposition. A Thauera-like microorganism that was active in the combined reactor system was suggested to be a key bacterium responsible for intermediates. Results of this study provide a basis for further research on the degradation of anthraquinone dyes.
Introduction
Microbial decomposition is an environment-friendly and cost-effective alternative to chemical and physical degradation processes. In previous studies, two methods were mainly used to degrade anthraquinone dyes in wastewater. The first involves using pure cultures, especially white-rot fungus (Borchert and Libra, 2001; Ramsay and Nguyen, 2002; Eichlerova et al., 2005; Vanhulle et al., 2007). Pure cultures, however, are difficult to apply at the industrial scale even though they can provide a highly efficient method for color removal. The other method uses a mixed culture, which can be easily implemented in most wastewater treatment plants. Because the efficacy of aerobic treatment is inferior to that of the anaerobic decolorization process (Pagga and Brown, 1986; Keharia et al., 2004), aerobic mixed cultures have been rarely investigated in recent years. Instead, anaerobic process attracted much more attention. Under anaerobic conditions, colors were removed to a dramatic extent (Luangdilok and Panswad, 2000; Lee and Pavlostathis, 2004). The major problem with anaerobic processes is that they are time-consuming and could result in intermediate accumulation.
A combined hydrolytic–aerobic reactor system was developed for the treatment of anthraquinone dye wastewater by Wang et al. (2009). This system consisted of a hydrolytic reactor operated under anoxic conditions (dissolved oxygen [DO]: 0–0.5 mg/L) and an aerobic biofilm reactor with aeration (DO: 4.5–6.0 mg/L) and was operated via the recirculation of reactor content. The removal efficiency of the dye color and the chemical oxygen demand (COD) were improved significantly, and the reactor system could potentially be used to mineralize anthraquinone dye in wastewater. So far, the research on dye degradation has mainly focused on reactor optimization. The role of the microorganisms involved in these reactors is still unknown and has been poorly investigated. Elucidating the role of these microorganisms is essential to further the understanding of the degradation process and would therefore allow any unfavorable changes in reactor performance to be addressed in advance.
In the present study, we investigated the successive changes and structures of a microbial community degrading anthraquinone dyes in an aerobic biofilm reactor, a hydrolytic reactor (with the DO concentration maintained between 0 and 0.5 mg/L), and a combined hydrolytic–aerobic reactor system. Reactive Blue 19 (RB19) was selected in the present study as a model anthraquinone dye. The objectives of this study were to (1) compare the color/COD removal efficiencies in the three reactors; (2) to use a culture-independent molecular technique-denaturing gradient gel electrophoresis (DGGE), to characterize the change of the microbial community structure during the cultivation periods of the aerobic and hydrolytic reactors and among the three reactors; and (3) to try to rationalize the differences in performance among the three reactors with the principles of microbiology.
Materials and Methods
Dye and reagent
A commercial anthraquinone dye, C.I. RB19 (Fig. 1), was used in this study, which was provided by Xiamen Hualun Group and was used without further purification. All other chemicals were of analytical grade.

Chemical structure of Reactive Blue 19.
Reactors, inoculums, and synthetic wastewater
Activated sludge was collected from the Qianpu Domestic Sewage Treatment Plant. A portion of the sludge was sealed in a hydrolytic reactor with a plastic cover, and the rest was cultivated in an aerobic reactor with an air supply for 3 days to accumulate hydrolytic and aerobic microorganisms, respectively (Figs. 2 and 3). Both the hydrolytic and aerobic reactors are 16 cm in diameter and 30 cm in height. The working volume of both reactors is 4 L. The hydrolytic and aerobic reactors were filled with D-2 soft fibers that were 25 cm in height, provided by Xiamen Hengli Ltd. The density and the specific surface area of the carriers were 0.91 g/cm3 and 5563 m2/m3, respectively. The total surface area of the carriers in the hydrolytic and aerobic reactors was approximately 3.4 m2. The carrier was swung from the top of the reactors, 5 cm above the bottom of the reactors. The composition of the synthetic dye wastewater in the assay is as follows (g/L): RB19 from 0.05 to 0.2, glucose 2.0, NaHCO3 1.5, NH4Cl 0.07, KH2PO4 0.03. The concentrations of trace elements in the assay were as follows (mg/L): CaCl2·6H2O 0.01, FeSO4·7H2O 1.55, MnSO4 4.95, ZnSO4·7H2O 0.71, CuSO4·5H2O 0.48, CoCl2·6H2O 0.01.
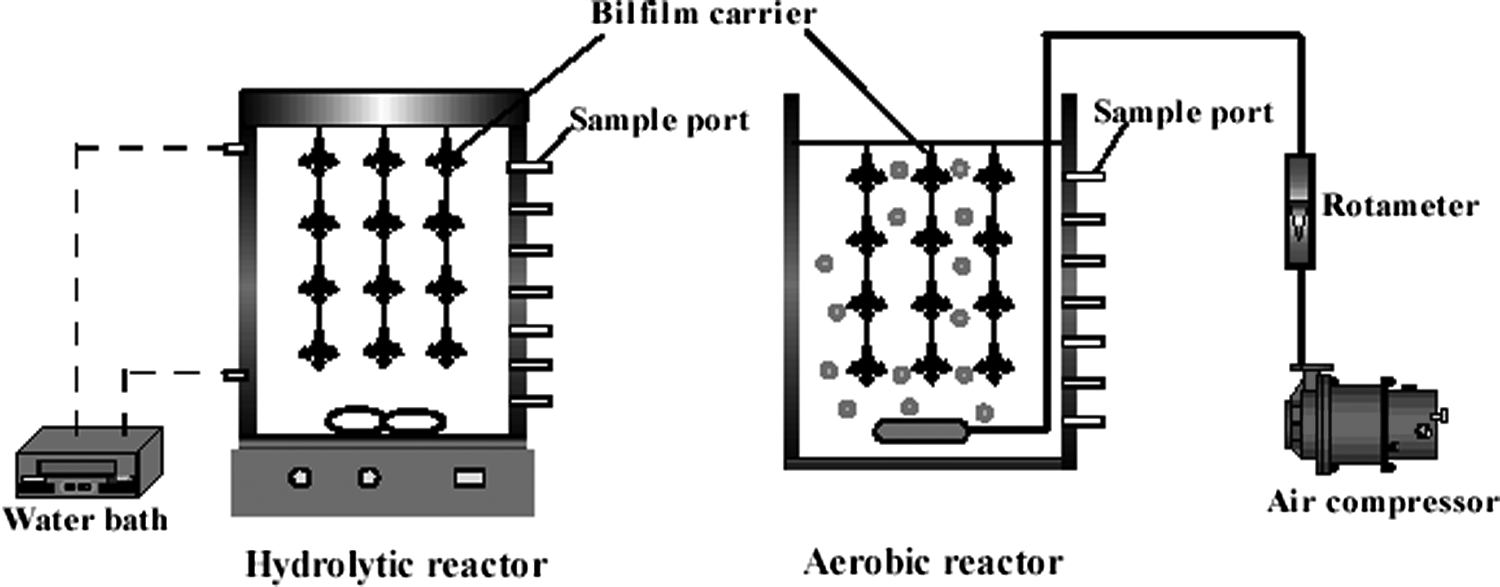
Biofilm hydrolytic (left) and aerobic reactor (right) systems.
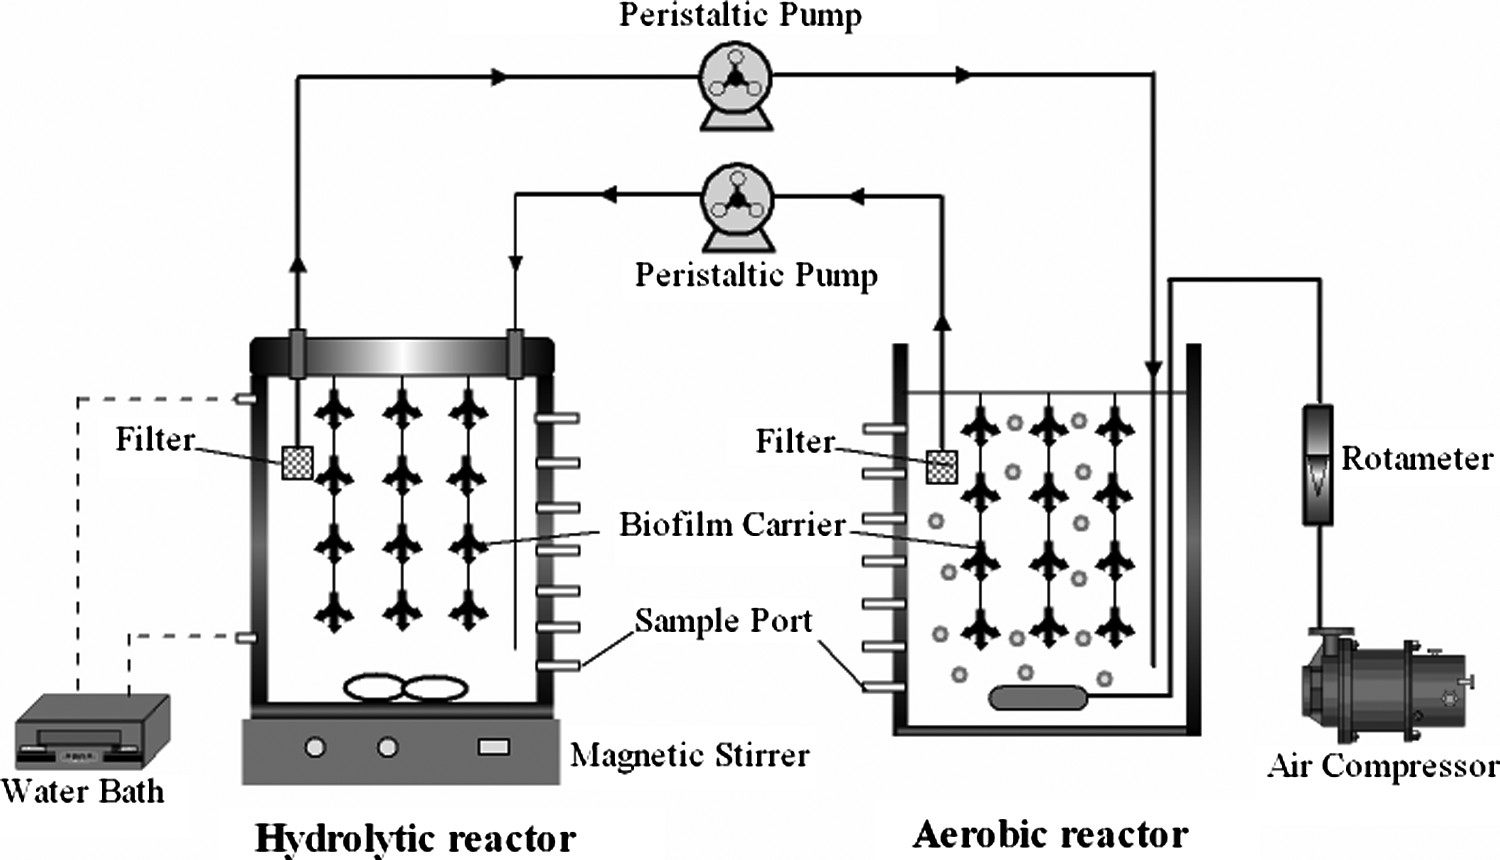
Biofilm hydrolytic–aerobic reactor systems.
Experimental Procedure
Reactor startup
To promote the sufficient immobilization of biomass onto the carrier, the reactor was operated in a batch mode for each day. The biofilm was cultivated with glucose (2 g/L) for about 20 days after the inoculum attached to the fiber carrier. The COD removal rate reached a steady state, which suggests that the microbial community structure became steady (Timothy et al., 2002). The soft fiber carrier possesses many micropores and cavities, which are beneficial for microbial immobilization. After the biofilm developed, the sludge concentrations in the hydrolytic and aerobic reactors were 20 and 15 g/L, respectively. Scanning electron micrographs of the soft fiber carrier that were taken before attaching the biomass are shown in Fig. 4. Afterward, the concentration of RB19 was increased from 50 to 200 mg/L (in four steps: 50, 100, 150, 200 mg/L) to improve the microorganisms' adaptability to the anthraquinone dye. The reactors were batch-fed with no sludge discharged, and the HRT was set as 24 h. The initial concentration of RB19 was 50 mg/L in both reactors. After about a week of operation, the color/COD removal efficiency became stable, and then the sample was collected, and the concentration increased to the next step until the concentration reached 200 mg/L.
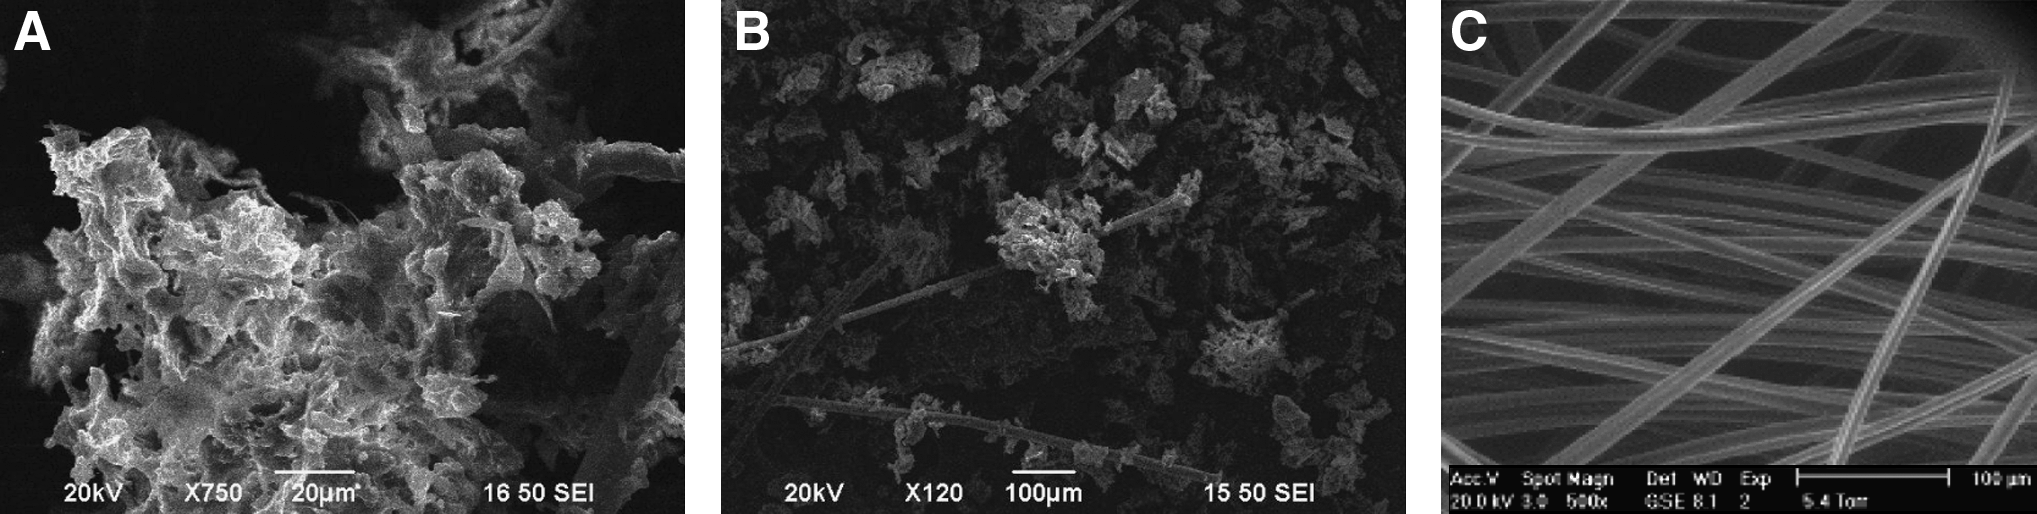
Scanning electron micrographs of the soft fiber carrier in the aerobic and hydrolytic reactors after
Reactor operation and sampling
The three reactors were batch operations with a hydraulic retention time (HRT) of 24 h. The temperatures of the aerobic and hydrolytic reactors were room temperature (20°C–25°C) and 35°C ± 1°C, respectively. The aeration volume of the aerobic reactor was 2 L/min, and the stirring rate of hydrolytic reactor was 50 rpm. The aerobic and hydrolytic reactors were run with the concentration of RB19 at 200 mg/L for a month. After the samples were collected, a peristaltic pump was used to connect the two reactors to form a combined reactor system with the concentration of RB19 at 200 mg/L. The recycling rate was set as 10 mL/min (Wang et al., 2009). The synthetic dye wastewater was simultaneously added to the hydrolytic and aerobic reactors. Then, the peristaltic pump was turned on. The RB19 and COD removal were measured after centrifugation of the samples collected from both reactors in different time intervals. The parameters of the operational conditions and sampling times are shown in Table 1.
I0, the sample from the biofilm, which grew in the glucose medium for 20 days; A, sample from the aerobic reactor; H, sample from the hydrolytic reactor.
Calculation method in the combined reactor system
The total removal efficiencies of the COD (Rtc) and that of RB19 (Rtr) during the biodegradation process were calculated according to the following equation (Wang et al., 2009):
where n stands for COD or RB19, Cain is the initial concentration of n in the aerobic reactor (mg/L), Chin is the initial concentration of n in the hydrolytic reactor (mg/L), Carn is the residual concentration of n in the aerobic reactor after degradation for 24 h (mg/L), Chrn is the residual concentration of n in the hydrolytic reactor after degradation for 24 h (mg/L), Va is the effective volume of the aerobic reactor (L), and Vh is the effective volume of the hydrolytic reactor (L).
Sample collection and DNA extraction
When the removal efficiency became stable under each concentration (from 50 to 200 mg/L) during the cultivation and in each process (Table 1 shows the exact dates of sample collection), microorganisms were collected from the biofilm of the aerobic, hydrolytic, and combined hydrolytic–aerobic reactor systems (Gong et al., 2008), placed in sterile polypropylene tables, and stored at −20°C before DNA extraction. Approximately 1 g of microorganisms was weighed into DNA extraction tubes with the 3S DNA Isolation Kit V2.2 (Shenery Biocolor). All extraction steps were conducted according to the manufacturer's protocol. The DNA was eluted in 100 μL of TE buffer.
Polymerase chain reaction–denaturing gradient gel electrophoresis
Polymerase chain reaction (PCR) was carried out in a thermal cycler (Bio-Rad) according to standard protocols. For the bacterial population analysis of the biofilm, the bacterial general primers F338 (5′-ACT CCT ACG GGA GGC AGC AG-3′) and R518 (5′- ATT ACC GCG GCT GCT GG-3′) (LaPara et al., 2002) were used to directly amplify the samples. The primers were synthesized by Sangon. The GC-clamp described by Muyzer et al. (1993) was added to the forward primers for PCR to facilitate the DGGE. The reaction mixture had a volume of 50 μL and consisted of the following ingredients: 1 μL template, 5 μL of 10× PCR buffer (Mg2+), 2 μL of 10×dNTP, 1 μL F338GC/R518 (25 pmol/50 μL), 0.5 μL Taq polymerase (Takara Ex TaqTM; Takara Shuzo), and 39.5 μL sterile H2O. Amplification was performed using the following protocol: 2 min of initial denaturation (94°C), followed by 30 cycles of 45 s at 94°C, 45 s at 51.5°C, and 45 s at 72°C; then, the mixture was elongated at 72°C for 10 min and was finally maintained at 4°C. DGGE was performed using the protocol of Muyzer et al. (1993) with the Bio-Rad DcodeTM system (Bio-Rad, Hercules). From each sample, 400 ng of the PCR product generated was separated on an 8% acrylamide gel with a linear denaturant gradient range of 35%–50%. The gels were stained with SYBR Green I for 30 min and were photographed on a UV transillumination table with a Gel Documentation System (Kodak). Eight individual bands were recovered from DGGE gels for further sequence analysis. Briefly, the bands were excised from the DGGE gels; then, the DNA was eluted in Tris-HCl buffer (pH 8.0). The eluted PCR products were again amplified with F338 and R518 primers without any GC-clamp. After purification, the products were cloned into the pGEM-T Easy vector (Promega). The cloned 16S rRNA gene fragments were sequenced by Sangon.
DGGE patterns and phylogenetic analysis
The digitized DGGE images were analyzed with the Quantity One image analysis software (version 4.0; Bio-Rad) (Wang et al., 2008), and the presence or absence in the DGGE profile was scored as 1 or 0, respectively, without considering the band intensity. A Jaccart similarity matrix was generated and analyzed with the nonmetric multidimensional scaling (NMDS) method in the PC-ORD software (version 5.0; MjM Software) (Lee et al., 2008). The sequences recovered from excised bands were compared with other sequences previously deposited in GenBank (www.ncbi.nlm.nih.gov) with the Means Basic Local Alignment Search Tool. Sequence alignment and phylogenetic analysis were performed using the Mega 4.1 software (Moormann et al., 2009). The phylogenetic tree was constructed in Mega with the neighbor-joining method.
Nucleotide sequence accession numbers
The nucleotide sequences determined in the present study have been deposited in the GenBank database under the accession numbers GQ153955–GQ153962.
Results
Comparison of the stand-alone reactors and the combined reactor system
The experimental results from the three different reactors were compared with fed batch with 200 mg/L of RB19. From Fig. 5A, we can find clearly that the most effective decolorization took place in the first 12 h in the three reactors, but the rate of decolorization was fastest in the combined reactor system during that time. Figure 5B shows that the COD decreased rapidly in the first 2 h, and the rate slowed thereafter. Table 2 presents the color and COD removal efficiencies in the aerobic and hydrolytic reactors and the combined reactor system with a recycling rate of 10 mL/min. It was shown that the COD removal efficiency could be up to 91.4% in the aerobic reactor, whereas it was only 53% in the hydrolytic reactor. Conversely, the decolorization of the hydrolytic reactor is more efficient than that of aerobic reactor, which reached 60% compared with 49.4% obtained with the aerobic reactor. For the combined hydrolytic–aerobic reactor system, the COD and color removal efficiency reached 95.6% and 83.7%, respectively, within 24 h.

Decolorization
AP, stand-alone aerobic process; HP, stand-alone hydrolytic process; RP, hydrolytic–aerobic recycling process.
Successive changes in the DGGE profiles in the aerobic and hydrolytic reactors during cultivation
To further understand the anthraquinone degradation process, the microbial composition of the acclimatized RB19-degradation consortium was analyzed with PCR-DGGE. Figure 5 shows the successive changes in the DGGE band profiles of the RB19-degrading consortium grown in the aerobic and hydrolytic reactors (lanes A1–A4 were from the aerobic reactor and lanes H1–H4 were from the hydrolytic reactor) during cultivation with the concentration of RB19 ranging from 50 to 200 mg/L. The dominant bands in the aerobic and hydrolytic reactors were obviously completely distinct (Fig. 6). The distinct bands indicated that the acclimatized RB19-degradation consortium had a different microbial composition from the biofilm that grew in the culture medium with glucose. Although many bands were detected in all samples, apparent differences in the bacterial communities with RB19 treatment were readily observed. As shown in Fig. 5, the number of bands in the biofilm with RB19 was significantly reduced compared with the number of bands in the bulk biofilm. As the concentration of RB19 increased, the bands Y1 and Y4 dominated the system in each step, and the intensity of bands Y2 and Y3 decreased in the hydrolytic reactor. The band O4 was constantly dominant in the consortium in the aerobic reactor with increasing intensity.

Profile of the DGGE gels of the amplified PCR products with 16S rRNA gene primers for samples of inoculum and RB19-degrading consortium during the operation period. DGGE, denaturing gradient gel electrophoresis; PCR, polymerase chain reaction; RB19, Reactive Blue 19.
Differences of the DGGE profiles from the combined aerobic–hydrolytic reactor system
There were significant differences in the DGGE profiles between the aerobic and hydrolytic reactors and the combined hydrolytic–aerobic reactor system with the concentration of RB19 at 200 mg/L. The amount of the dominant microorganism related to the O4 band diminished sharply from the aerobic reactor to the combined reactor system. Conversely, in the combined reactor, the band O2 reappeared and obtained a dominant status like the O4 band in the aerobic reactor (lanes A4 and AR in Fig. 6). In the hydrolytic reactor, the bands Y1, Y2, and Y3 reduced significantly and resulted in pulling the Y4 band, which was maintained at its original quantity, to an absolutely dominant state.
Changes in the microbial community composition in the bioreactors
Because NMDS takes into account the changes in the abundances of all species, it will be sensitive to changes in species composition (Ugland et al., 2008). Therefore, NMDS was applied to visualize changes in the microbial community structure. The NMDS map, which was drawn by analyzing the DGGE profiles using the matrix obtained previously, showed an uneven variation in the community structure (Fig. 7). In the map, the community structure profiles in the aerobic reactor were similar. When the color and the COD removal efficiency reached the stationary phase in the combined reactor system, the profiles in the aerobic and hydrolytic reactors became closer (from lane A4 to AR and from lane H4 to HR in the map).
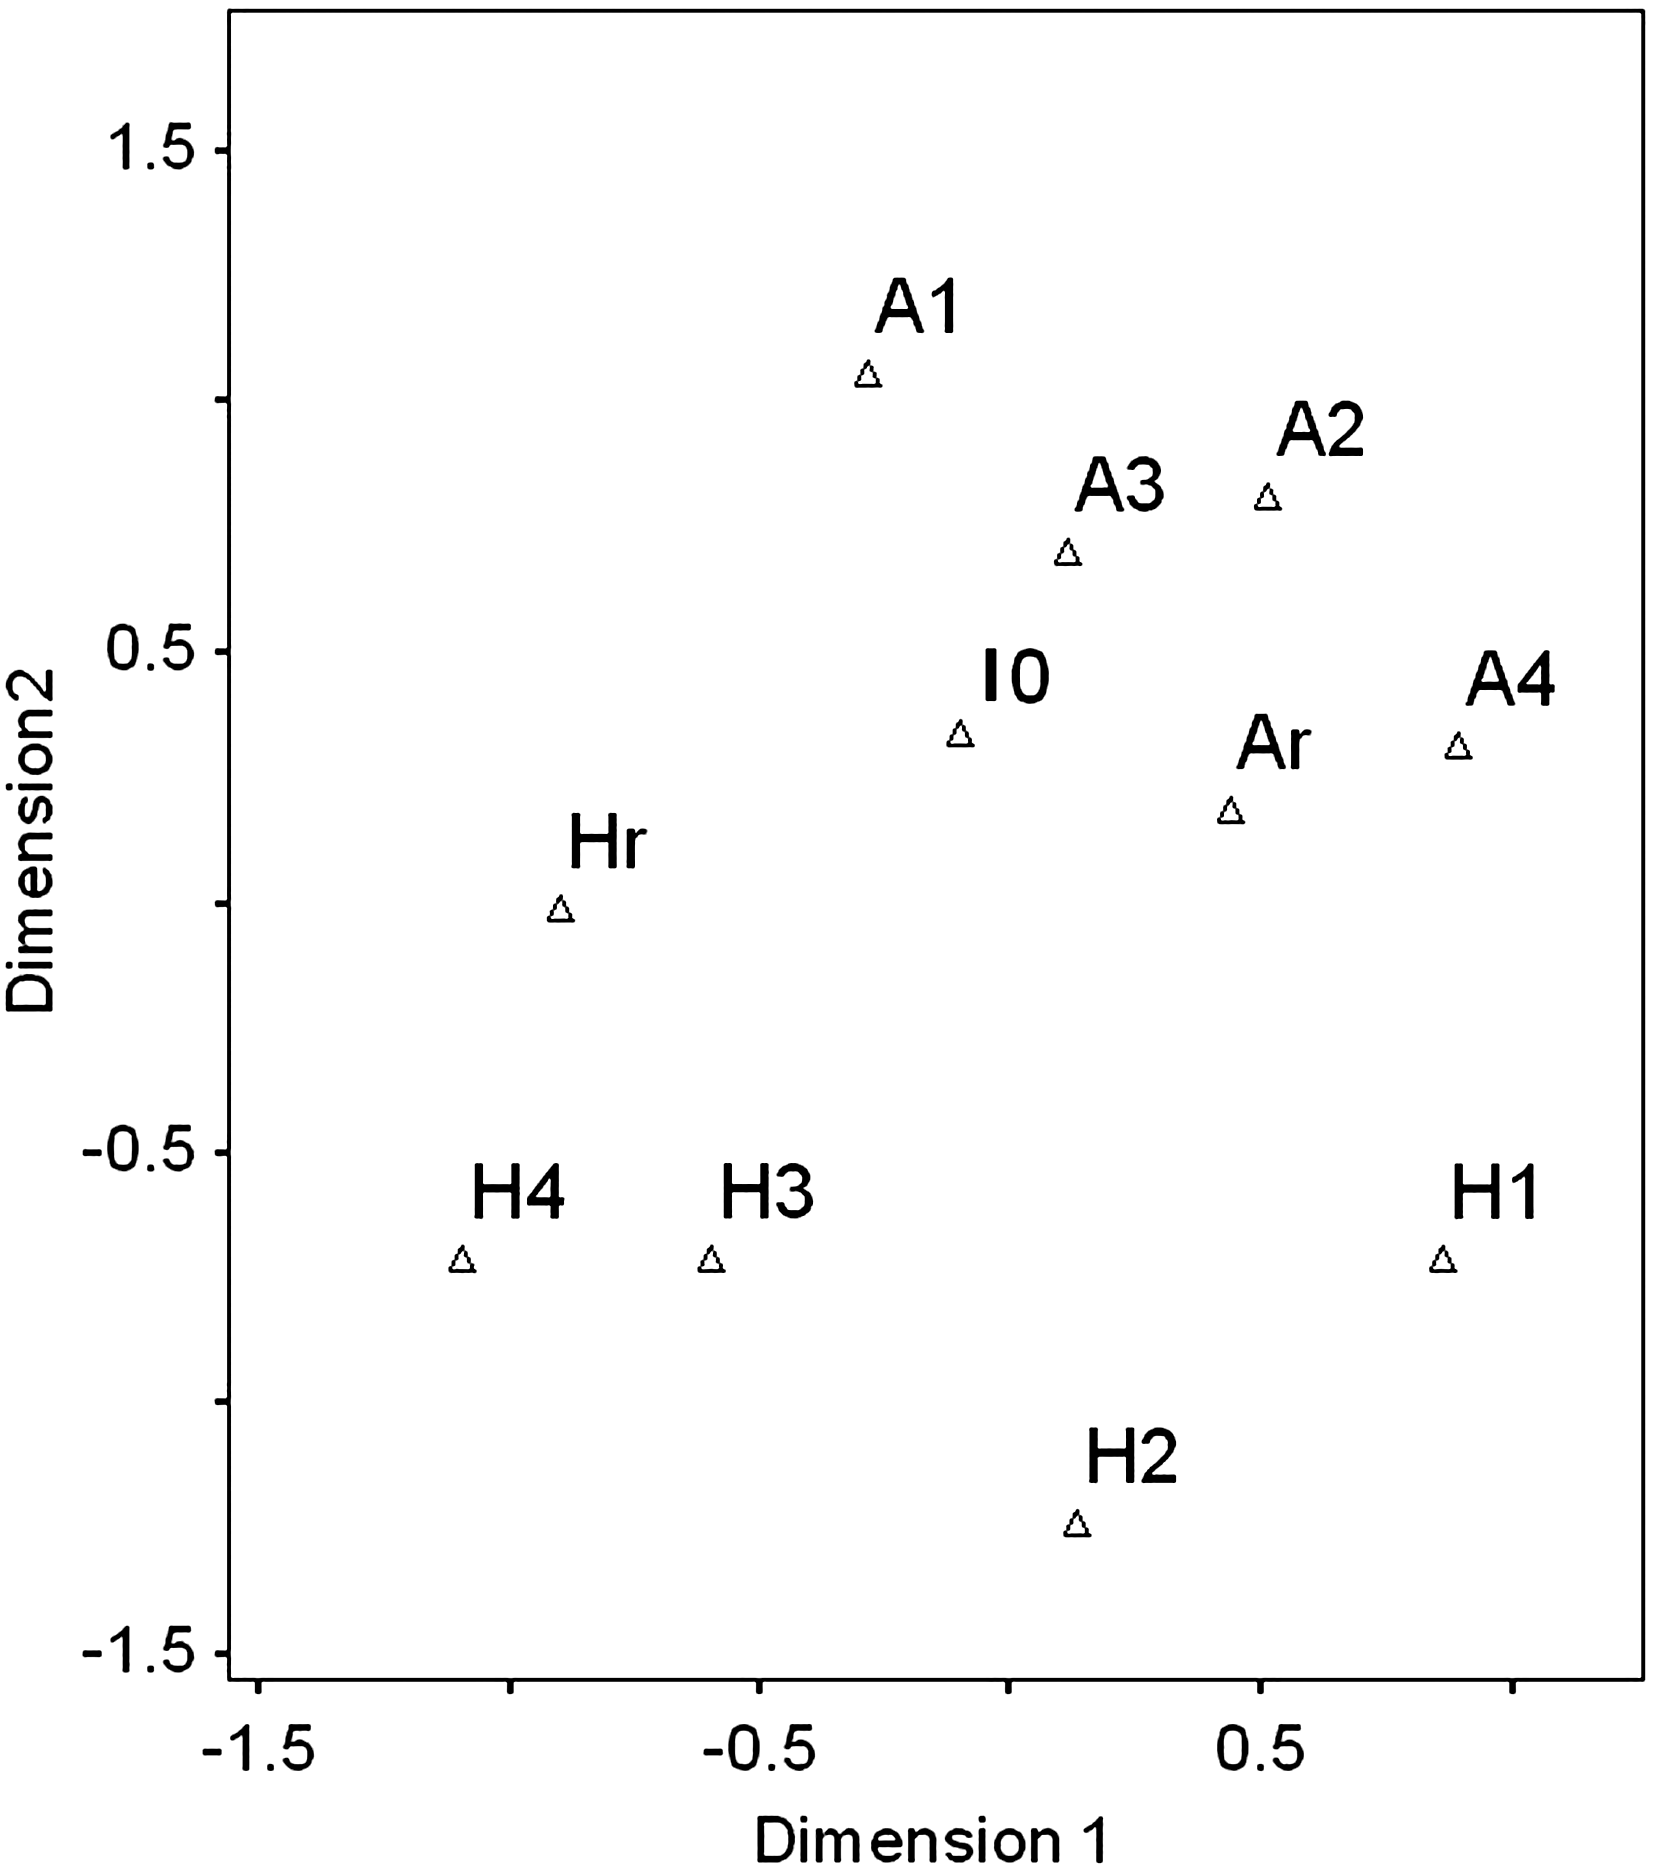
Nonmetric multidimensional scaling map from the analysis of the DGGE profile based on the 16S rRNA gene.
Phylogenetic analysis
A phylogenetic analysis of the sequences recovered from the DGGE gels (Fig. 8) was performed to understand whether differences existed in the distribution of the phylogenetic groups among the three reactors. The closest matches of the obtained sequences to the known species were determined by comparison with the GenBank database (Table 3). All the sequences were close to those of known organisms previously recovered from environmental samples. A phylogenetic tree was generated with Mega.4.1. The sequences recovered from the DGGE gels were distributed throughout the tree. Based on this analysis, the sequences were most closely related to α-, β-, and γ-proteobacteria and Firmicutes.

Phylogenetic tree of the partial 16S rRNA gene sequence that was amplified with F338 and R518. Bootstrap support values with 1000 replicates are given along the branches.
Discussion
In this study, the removal efficiency of color and COD was increased by using a combined hydrolytic–aerobic reactor system relative to the efficiencies achieved with individual aerobic or hydrolytic reactor (Table 2). The microbial communities responsible for the RB19 degradation in the three reactors were different, although they developed from the same original inoculum with glucose as the major substrate for growth. The changes in the microbial community may provide insights into the role of microbes in dye degradation, which could be useful for further process optimization.
The microbial community structures between the hydrolytic and aerobic reactors were quite different from each other. There were two different conditions in the three reactors: the DO concentration and the temperature. The DO concentration was maintained at 0.3–0.5 mg/L in the hydrolytic reactor, whereas in the combined reactor system it was increased to 0.4–0.6 mg/L. In the aerobic reactor, the DO concentration remained steady at 4.5–6.0 mg/L in both the stand-alone and the combined reactor systems. The NMDS (Fig. 7) showed that samples I0–Ar, H1–H2, and H3–Hr belonged to three different large-category bacterial populations, and the similarity between them was 60%. However, the similarity between the five samples (A1–Ar) was higher, up to 68%, which suggests that the differences of the community structure profiles were determined by the different operation conditions. Similar results were reported by many other researchers. For example, temperature-transient conditions were found to affect the bacterial community structure in the lab-scale sequencing batch reactors treating bleached kraft mill effluent (Nalina et al., 2007).
During the cultivation in the hydrolytic reactor, the clone from band Y2 showed 93% similarity to Shewanella sp. JC15. According to the research of Xu et al., although Shewanella strains grow on glucose, Shewanella strains can degrade reactive brilliant blue (Xu et al., 2006). Therefore, the microbe in the position of band Y2 was assumed to be responsible for the RB19 decomposition in the hydrolytic reactor. In the combined reactor system, RB19 should be removed from the water phase by (hydrolytic) reduction followed by the (aerobic) oxidation of the metabolites that were formed previously in the hydrolytic reactor (Van der Zee and Villaverde, 2005), which overcomes the major drawback of degradation in the anaerobic condition. Accordingly, we found that band O2 turned out in the combined reactor system. The O2 band showed a 99% sequence similarity to Thauera phenylacetia, which was isolated from the activated sludge of an industrial sewage treatment that was enriched with nitrates and the aromatic amino acids
The changes in bands indicated a community shift in both the reactors because of the increase in dye concentrations. They may be related to dye degradation and may also be related to selection pressures caused by the dye and its intermediates (which could be inhibitory for some organisms). Although we did not analyze the effect of intermediates on the bacterial community composition, the difference in bacterial diversity in different reactors was distinct from the PCR-DGGE approach and sequences. From the present study, we can draw the following conclusions: (1) compared with the aerobic biofilm reactor and hydrolytic reactor, the combined aerobic–hydrolytic reactor system produced a higher removal efficiency of color and COD at 95.6% and 83.7%, respectively, with the concentration of RB19 at 200 mg/L; (2) variations in the microbial community structure were mainly caused by different operation conditions in RB19 degradation, and a clone corresponding to the Shewanella strain was assumed to be responsible for RB19 decomposition; (3) a Thauera-like microorganism that was active in the combined reactor system was suggested to be a key bacterium responsible for intermediates generated in the hydrolytic reactor decomposition.
Footnotes
Acknowledgments
This work was supported by the National Natural Science Foundation of China (No. 40801195 and 30700020) and the State Key Lab of Urban Water Resource and Environment (HIT; No. QA200809).
Author Disclosure Statement
No competing financial interests exist.