
Abstract
Abstract
Long-term temporal behavior of permeable reactive barriers used for remediation of subsurface contamination is of ongoing research interest. This study was designed to investigate the impact of formation of surface oxide coatings on the performance of high-carbon iron filings (HCIF) used for dehalogenation of 2-chloronaphthalene (2-CN). Three types of HCIF, viz. HCIF-S1, HCIF-S2, and HCIF-S3, with no oxide coating, Fe(II)/Fe(III) oxide coating, and pure Fe(III) oxide coatings, respectively, were prepared and characterized by X-ray diffraction and Mössbauer spectroscopy. The HCIF samples were contacted with 2-CN in completely mixed batch systems. During interaction with HCIF-S1, 2-CN was observed to partition substantially to the HCIF surface, whereas the residual aqueous 2-CN underwent reductive dehalogenation. Results were similar during 2-CN interaction with HCIF-S2. However, during 2-CN interaction with HCIF-S3, both 2-CN dehalogenation and adsorption were severely diminished. Reduction in sorption was attributed to the concealment of carbon present on HCIF-S3 surface by the oxide coating, as confirmed by scanning electron microscopy and energy dispersive X-ray spectroscopy studies. Reduction in dehalogenation rate was attributed to the insulating effect of the surface oxide coating. Addition of ferrous ions led to the enhancement of the rate of dehalogenation of 2-CN by HCIF-S3 by almost an order of magnitude.
Introduction
Corrosion reactions in aerobic conditions result in the formation of ferrihydrite (Fe3HO8·4H2O) on ZVI surface, which at neutral pH further transforms to hematite (α-Fe2O3) and goethite (α-FeOOH) (Stipp et al., 2002). Under anoxic conditions and at neutral pH, corrosion leads to the initial formation of amorphous ferrous hydroxide [Fe(OH)2] on the ZVI surface, which gradually transforms to magnetite (Fe3O4) (Odziemkowski et al., 1998; Bonin et al., 2000). In high alkalinity and anoxic conditions prevalent in many subsurface environments, corrosion may result in the initial formation of carbonate green rust (Drissi et al., 1995; Abelmoula et al., 1996; Erbs et al., 1999; Farrell et al., 2000) on the ZVI surface. Other surface corrosion products identified during ZVI corrosion under anoxic conditions include maghemite (γ-Fe2O3), lepidocrocite (γ-FeOOH), ferrihydrite [Fe3HO8·4H2O], and goetite [α-FeOOH] (Drissi et al., 1995; Abelmoula et al., 1996; Bonin et al., 2000). Farrell et al. (2000) proposed that the carbonate green rust formed on ZVI surface is stable only at low redox potentials, and its subsequent oxidation commonly leads to the ultimate formation of maghemite (γ-Fe2O3) and lepidocrocite (γ-FeOOH). Thus, in conditions normally prevalent in subsurface environments, ZVI corrosion often starts with the surface formation of carbonate green rust, which gradually gets transformed to magnetite and, finally, maghemite (Kohn et al., 2005). Spectroscopic analyses of aged ZVI surfaces have demonstrated surface coating consisting of an inner layer of magnetite and outer layer of maghemite (Nagayama et al., 1962; Farrell et al., 2000).
Several researchers have shown that carbonate green rust can act as an electron donor, thus allowing dehalogenation reactions involving HOCs to proceed (Erbs et al., 1999; Loyaux-Lawniczak et al., 2000; Williams and Scherer, 2001; Lee and Batchelor, 2002a). Similar behavior has also been reported with magnetite (Schmuki et al., 1995; Balko and Tratnyek, 1998; Farrell et al., 2000). In contrast, maghemite, ferrihydrite, and goetite are poor electron donors (Mayne et al., 1950), and hence, dehalogenation reactions involving HOCs may be inhibited in their presence. Vikesland and Valentine (2002) have shown that the trend in iron oxide mineral–mediated monochloramine reduction was as follows: magnetite>goethite>hematite≈lepidocrocite>ferrihydrite. Iron oxide mineral–mediated dehalogenation of hexachloroethane (Elsner et al., 2004) exhibited the following trend: mackinawite (FeS)≃pyrite (FeS2)>green rust>goethite≃magnetite (Fe3O4),>nontronite>lepidocrocite (γ-FeOOH)>hematite (Fe2O3)>siderite (FeCO3). Reductive dechlorination of chlorinated ethylenes by suspensions of pyrite, magnetite, and green rust showed the following trend (Lee and Batchelor, 2002a, 2002b): carbonate green rust>pyrite>magnetite. However, the dehalogenation rates of the same chlorinated ethylenes were much faster in the presence of mackinawite (Butler and Hayes, 1999), triolite (Sivavec and Horney, 1997), or zerovalent iron (Arnolds and Roberts, 2000).
It has also been reported that incorporation of ferrous ions on various iron oxide mineral phases allows dehalogenation of HOCs at faster rates (Klausen et al., 1995; Rugge et al., 1998; Hofstetter et al., 1999; Amonette et al., 2000; Huang and Zhang, 2002; Pecher et al., 2002; Vikesland and Valentine, 2002; Klupinski et al., 2003; Elsner et al., 2004; Gregory et al., 2004). Vinyl chloride (VC) and cis-1,2-dichloroethylene (cis-1,2-DCE) dehalogenation rates by magnetite increased by an order of magnitude on addition of ferrous ions (Lee and Batchelor, 2002a). Biogenic ferrous ion production has also been reported to enhance HOCs' dehalogenation rates in some ZVI systems (Amonette et al., 2000; McCormick et al., 2002).
Based on the literature reports, it is evident that corrosion reactions result in a gradual transformation of the ZVI surface. The HOCs' reactivity with ZVI is also dependent on the nature of the surface oxide layer on the ZVI surface. Under the circumstances, HOCs' dehalogenation rate by ZVI will show temporal variations as the ZVI surface transforms because of corrosion reactions.
Interaction of 2-chloronapthalene (2-CN) with high-carbon iron filings (HCIF) was investigated in this study. HCIF is a low-cost reactive material used often in permeable reactive barriers (Burris et al., 1995). 2-CN has been identified as a priority pollutant by U.S. Environmental Protection Agency (2002). Interaction of 2-CN with three types of HCIF was examined: (1) with no initial surface oxide coating (HCIF-S1), (2) with an initial surface oxide coating of mixed Fe(II)/Fe(III) oxides (HCIF-S2), and (3) with an initial surface coating of purely Fe(III) oxide (HCIF-S3). These HCIF samples roughly represent the state of HCIF after short-, medium-, and long-term use, respectively, for HOC dehalogenation. The main objectives of the study were as follows:
• to determine the rate and extent of dehalogenation of 2-CN by the three types of HCIF, • to investigate the impact of addition of Fe(II) ions on the rate of dehalogenation of 2-CN by HCIF-S3, • to mathematically simulate the composite adsorption–dehalogenation process during the above interactions, and • to elucidate the processes and mechanisms behind the observed results through X-ray diffraction (XRD), Mössbauer spectroscopy, scanning electron microscopy (SEM), and energy dispersive X-ray spectroscopy (EDS).
Experimental
Chemicals
The following chemicals were used in this study: 2-chloronaphthalene (2-CN) 99.9% (5,000 μg mL−1 in methanol; Supelco), 1,4-dichlorobenzene (1,4-DCB) 99+% (Sigma Aldrich), n-hexane (Merck HPLC grade), acetonitrile (Merck HPLC grade), pyrite (Ward's Natural Science Est., Inc.), HCl (AR grade; Thomas Baker), HNO3 (AR grade; Thomas Baker), and FeSO4·7H2O (AR grade; SD Fine Chem.). The pyrite used was 94% pure and was ground into a fine powder before use.
Preparation of HCIF
Commercially available high-carbon iron (purchased at Kanpur, India) was used to make high-carbon iron filings (HCIF) as per the procedure described by Sinha and Bose (2007). Three types of HCIF were prepared for use in this study. To prepare HCIF with no oxide coating (HCIF-S1), the HCIF was washed in nitrogen-sparged 1 N HCl with periodic shaking for 30 min and then rinsed 10–12 times with N2-sparged deionized (Milli Q) water, and the moist sample was dried for 2 h at 100°C in an oven under nitrogen atmosphere. This treatment yielded dark gray metallic filings with no visible rust on the surface. For preparing HCIF-S2, HCIF-S1 was kept in an oven (open to atmosphere) at 500°C for 2 h and then cooled in a N2 environment. For preparing HCIF-S3, moist HCIF-S1 was kept in the same oven at 500°C for 10 h and cooled in open atmosphere. Carbon content of HCIF-S1, HCIF-S2, and HCIF-S3 was determined by Strohlein Apparatus (Adair Dutt and Co. Pvt. Ltd.) to be 2.72%, 2.68%, and 2.63%, respectively. Surface area of HCIF-S1 was determined by BET (N2) analysis using a BET surface area analyzer (Coulter SA 3100) to be 3.418 m2 g−1. All three types of HCIF were stored in vacuum desiccators to prevent further changes in surface characteristics.
HCIF characterization
XRD analyses were carried out for surface characterization of all three HCIF samples. An X-ray powder diffractometer (model ISO-Debyeflex 2002; Rich Seifert & Co.) using Cu Kα radiation (with λ=1.541841 Å) was employed for this purpose (for details, see Sinha and Bose, 2007).
Scanning electron microscopy
Scanning electron micrographs of all three HCIF samples were obtained. A scanning electron microscope (FEI Quanta 200), operating at 20 kV accelerating voltage at 12.3 mm working distance, was used for this purpose. The scanning electron microscope was also equipped with EDS capabilities. A small amount of sample was placed on a copper stub using carbon paste adhesive at a vacuum of 10−4–10−5 Torr, and scanning electron micrographs were obtained at 3,000–4,000 times magnification. EDS was done at four points for each sample, the objective being the elemental characterization of the surface.
Experimental procedure
The experimental procedure is largely similar to that described by Sinha and Bose (2007) and hence will be only summarized here. All the experiments were carried out in 16-mL glass vials with screw caps, equipped with Teflon-lined resealable rubber septa (Wheaton Science). For a typical experiment, approximately 2 g of HCIF and 0.1 g of pyrite were added to a vial, with the exact weight of HCIF and pyrite added being determined gravimetrically. The mass of HCIF and pyrite in the vials was variable, but the variability was never more than ±5%. Pyrite addition was required for pH control. Aqueous solution of 2-CN was prepared (∼2 mg L−1) and transferred to the vials containing HCIF and pyrite, such that no headspace existed. The mass of 2-CN thus added to each vial was between 28 and 30 μg. In experiments involving Fe(II) addition, FeSO4 was added to the 2-CN stock solution to achieve a concentration of 10, 50, or 100 mg L−1 Fe(II). Aqueous volumes in the vials were determined gravimetrically. Control vials, containing 2-CN but no HCIF filings or pyrite, were also prepared. The vials were placed on a roller drum and rotated at 15 rpm such that the vial axis remained horizontal at all times. Ambient temperature was approximately 25°C±1°C throughout the experiments. The vials were removed (in duplicate and one control) at specified times, ranging from 2 to 410 h for analysis. Both aqueous and sorbed 2-CN concentrations were measured in all vials wherein 2-CN was contacted with HCIF. The procedure for these measurements has been described in detail by Sinha and Bose (2007). Briefly, aqueous 2-CN concentration was measured by taking a 300 μL aqueous sample from a vial and extracting the 2-CN with 1 mL n-hexane, which was analyzed using a gas chromatograph. To measure the adsorbed 2-CN concentration, the aqueous phase was removed (as far as practicable) from the vial. Two 3 mL aliquots of n-hexane were added in succession to the HCIF in the vial for extraction of the adsorbed hexane. 2-CN concentration measured in this hexane extract was used to determine the adsorbed 2-CN concentration after application of corrections to account for the mass of aqueous 2-CN, which could not be separated from HCIF at the initial stage.
Analytical procedures
pH and oxidation–reduction potential (ORP) of the aqueous phase in all vials were measured before sampling of the vials by piercing needle-type microelectrodes through the vial septa. A redox electrode (model MI-800/414; Microelectrodes, Inc.) and a combination pH electrode (model MI-414; Microelectrodes, Inc.) connected to an Orion 320 PerpHecT analyzer (Thermo Scientific) was employed for this purpose.
A gas chromatograph (model Clarus 500; Perkin Elmer) equipped with an Elite-5 column (30 m×0.32 mm×0.25 μm) was used for measurement of 2-CN concentration. The carrier gas was nitrogen. The instrument settings and other details for the above measurement were the same as given by Sinha and Bose (2007). The detection limit for 2-CN was 25 pg μL−1, and the corresponding signal/noise (S/N) ratio was greater than 4.
Results
XRD and Mössbauer spectroscopy results
The XRD spectra of HCIF-S1 surface have been presented by Sinha and Bose (2007). The spectra showed prominent peaks consistent with metallic iron (JC-PDF: 06-696). No peaks attributable to any iron oxide phase were observed. The XRD spectra for HCIF-S2 (Fig. 1A) showed peaks consistent with magnetite (JC-PDF: 19-0629) and maghemite (JC-PDF: 25-1402) phases, whereas peaks attributable to metallic iron were no longer observed. The XRD spectra for HCIF-S3 (Fig. 1B) showed peaks consistent with hematite (JC-PDF: 33-0664) and maghemite (JC-PDF: 25-1402), but no peaks attributable to metallic iron.
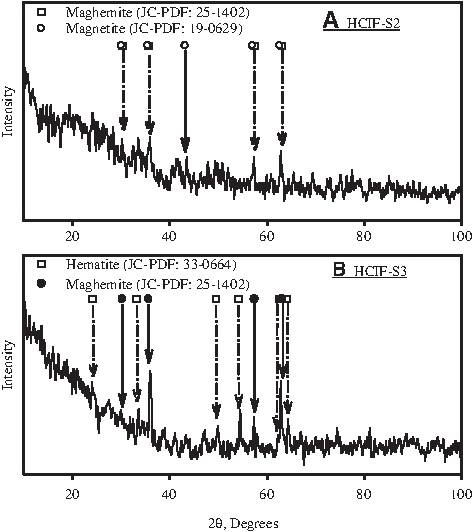
X-ray diffraction results.
Mössbauer spectroscopy of HCIF-S1 has been presented by Sinha and Bose (2007). This spectrum indicated that metallic iron, cementite (Fe3C), and triolite (FeS) are the main phases present on the HCIF-S1 surface. Similar spectra obtained for HCIF-S2 (Fig. 2A) showed the abundant metallic iron, triolite, and cementite phases to be diminished, whereas iron oxide minerals such as magnetite and maghemite were observed in appreciable quantities. The spectra for HCIF-S3 (Fig. 2B) confirmed the presence of Fe(III) oxide phases such as maghemite, δ-FeOOH, and hematite, but magnetite was no longer observed.

Mössbauer spectroscopy results.
Based on both XRD and Mössbauer spectra presented in Figs. 1 and 2, it was concluded that the HCIF-S2 surface initially had a partial coating of Fe(II)/Fe(III) oxides, whereas HCIF-S3 surface initially had a substantial coating of Fe(III) oxides. Based on results presented by Sinha and Bose (2007), it was concluded that the HCIF-S1 surface initially had no detectable oxide coatings.
Modeling the interaction between HCIF and 2-CN
Modeling of the interaction between HCIF and 2-CN has been described in detail elsewhere (Sinha and Bose, 2006, 2007). Briefly, interaction of 2-CN with HCIF involves partitioning of 2-CN on the carbon present on the HCIF surface and reductive dehalogenation of the residual aqueous 2-CN through the interaction with metallic iron. It was demonstrated that 2-CN does not adsorb appreciably on pure metallic iron or iron oxides. During interaction of 2-CN with HCIF, the adsorption and dehalogenation processes occur simultaneously. The decline in aqueous phase 2-CN concentration due to dehalogenation results in progressive readjustment of 2-CN partitioning between solid and aqueous phases. Further, in well-mixed conditions, adsorption reactions are fast when compared with dehalogenation reactions under most circumstances. Hence, the solid and aqueous phase 2-CN can be assumed to be in equilibrium at all times except in the first few hours of the experiment, that is, when the rate of dehalogenation is high. Interaction between HCIF and 2-CN can be described using the following equations:
When aqueous and adsorbed 2-CN concentrations are in equilibrium, they are related by a Freundlich isotherm of the form,
It was also assumed that
In the above expressions, CT (μmol L−1), Ca (μmol L−1), and Cs (μmol g−1 iron) are the total, aqueous, and sorbed 2-CN concentrations; M (g L−1) is the concentration of HCIF; k1 (h−1 g−1 iron L) and N are the rate constant and reaction order, respectively, of the 2-CN dehalogenation; K [(μmol g−1 iron)/(μmol L−1)] and m are Freundlich isotherm constants for 2-CN adsorption on HCIF surface; and k2 (h−1 g−1 iron L) and k3 (h−1) are the sorption and desorption rate constants for the 2-CN adsorption process.
Interaction of HCIF-S1 and HCIF-S2 with 2-CN
HCIF-S1 was contacted with 2-CN for various time periods in 16-mL vials. pH was between 6 and 7 and ORP values between −600 and −700 mV in all such vials. Total 2-CN concentration (CT) declined with time (Fig. 3A). A plot of Ln[dCT/dt] versus Ln[Ca] yielded a linear fit (Fig. 3C). The rate constant (k1) and order (N) of 2-CN dehalogenation by HCIF-S1 was obtained from this plot (see equations 1a and 1b) as 9.81×10⁻³ h−1 g−1 iron L and 1.495, respectively. A plot of Log (Cs) versus Log (Ca) also yielded a linear fit (Fig. 3D), suggesting that the aqueous and sorbed 2-CN concentrations were in equilibrium, and could be described by a Freundlich isotherm (see equation 2). The Freundlich isotherm constants K and m were determined from Fig. 3D to be 5.10×10⁻² (μmol g−1 iron)/(μmol L−1) and 0.53, respectively.
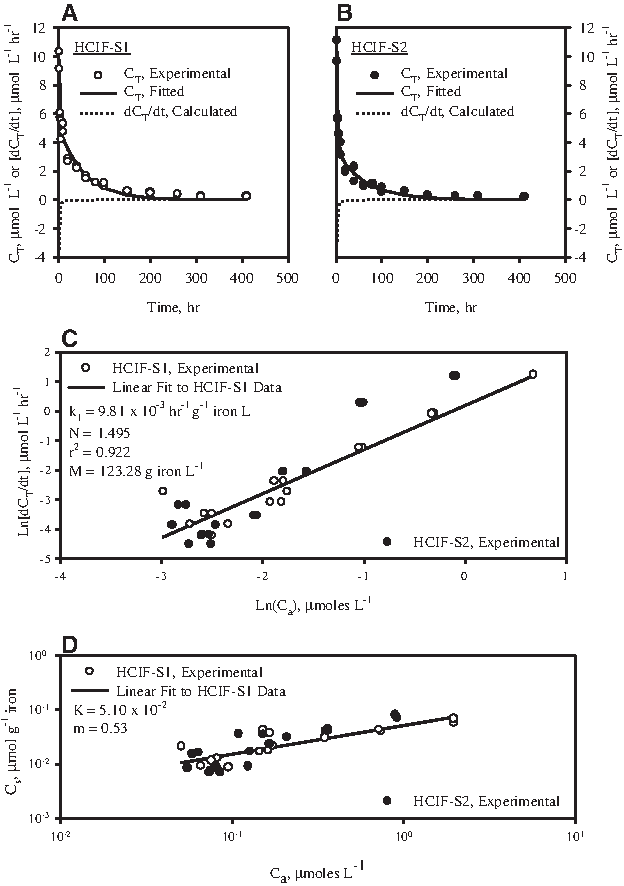
Reductive dehalogenation of 2-chloronaphthalene (2-CN) by HCIF-S1 and HCIF-S2.
CT, Ca, and Cs time series data of 2-CN dehalogenation by HCIF-S1 are presented in Fig. 4. The data show a general overall decline in CT (Fig. 4A), an initial rapid decline in Ca followed by a slower decline (Fig. 4B and inset), and an initial rapid increase in Cs followed by a slow decline (Fig. 4C). These results can be simulated with equations 1–4 using values of k1, N, and m determined earlier and by assuming suitable values of k2 and k3. The ratio of k2 and k3, that is, K, has been determined earlier (see equation 3) to be 5.10×10⁻² (μmol g−1 iron)/(μmol L−1). The mathematical simulation corresponding to k2=5.10×10⁻¹ L g−1 h−1 and k3=10 h−1 was observed to fit the data adequately (Fig. 4A–C). The results of the above experiment match well with the results of a similar experiment described by Sinha and Bose (2007) carried out using a similar HCIF sample.
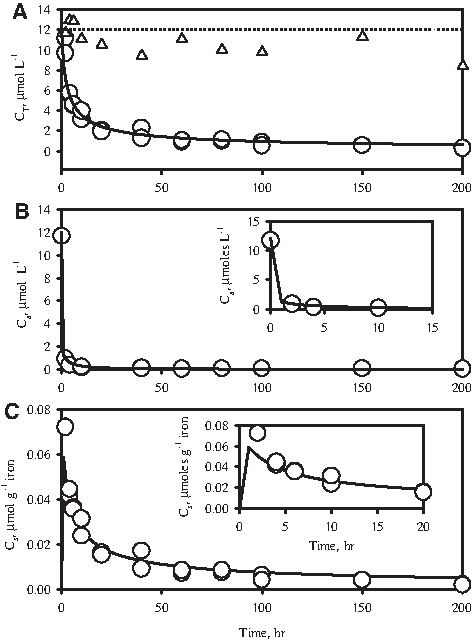
Simulation of reductive dehalogenation of 2-CN by HCIF-S1.
HCIF-S2 was also contacted with 2-CN for various time periods. pH was between 6 and 7 and ORP values between −200 and −400 mV in these vials. Total 2-CN concentration (CT) declined with time (Fig. 3B). The Ln[dCT/dt] versus Ln[Ca] data obtained in this case, when plotted in Fig. 3C, was observed to match with similar data obtained for the experiment using HCIF-S1. This suggested that the rate of 2-CN dehalogenation was nearly same irrespective of whether HCIF-S1 or HCIF-S2 was contacted with 2-CN. The Log (Cs) versus Log (Ca) data obtained, and plotted in Fig. 3D, was observed to match well with similar data obtained for the experiment using HCIF-S1. This suggested that the extent of 2-CN adsorption on HCIF-S1 and HCIF-S2 surface was similar.
Interaction of HCIF-S3 with 2-CN
In experiments involving contacting of HCIF-S3 with 2-CN, pH was between 6 and 7 and ORP was between −26 and −50 mV in all vials. The total 2-CN concentration (CT) declined with time (Fig. 5A). A plot of Ln[dCT/dt] versus Ln[Ca] in this case yielded a linear fit (see equations 1a and 1b and Fig. 5B). The rate constant (k1) and order (N) of 2-CN dehalogenation by HCIF-S3 was obtained from this plot (see equations 1a and 1b) as 2.62×10⁻⁷ h−1 g−1 iron L and 4.24, respectively. A plot of Log (Cs) versus Log (Ca) also yielded a linear fit (Fig. 5C). The Freundlich isotherm constants K and m were determined from Fig. 5C to be 3.31×10⁻⁴ (μmol g−1 iron)/(μmol L−1) and 1.47, respectively.
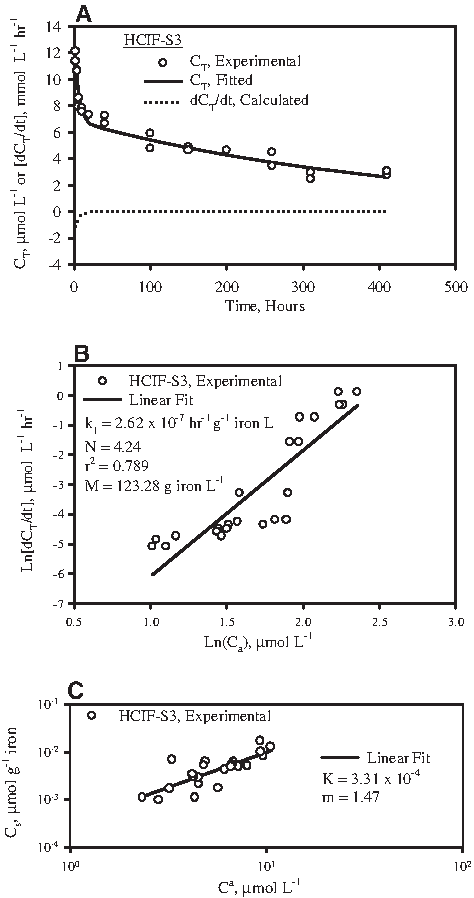
Reductive dehalogenation of 2-CN by HCIF-S3.
CT, Ca, and Cs time series data of 2-CN dehalogenation by HCIF-S3 are presented in Fig. 6. The data show a general overall decline in CT (Fig. 6A), a decline in Ca (Fig. 6B), and an initial rapid increase in Cs followed by a slow decline (Fig. 6C and inset). These results can be simulated using equations 1–4, using values of k1, N, and m determined earlier, and by assuming suitable values of k2 and k3. The ratio of k2 and k3, that is, K, has been determined earlier (see equation 3) to be 3.31×10⁻⁴ (μmol g−1 iron)/(μmol L−1). The mathematical simulation corresponding to k2=3.31×10⁻⁵ L g−1 h−1 and k3=10 h−1 was observed to fit the data adequately (Fig. 6A–C).
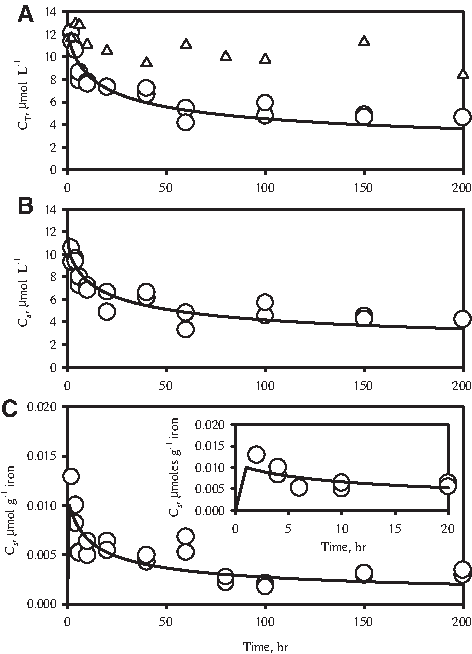
Simulation of reductive dehalogenation of 2-CN by HCIF-S3.
Based on comparison of data on interaction of 2-CN with HCIF-S1, HCIF-S2, and HCIF-S3, it was concluded that the rate of dehalogenation of 2-CN by HCIF-S3 was considerably slower than the other two cases. Also, the extent of the sorption of 2-CN on HCIF-S3 surface was less and the rate of adsorption was considerably slower than in the other two cases.
The impact of addition of Fe(II) during interaction between HCIF-S3 and 2-CN was investigated. Three concentrations of Fe(II), 10, 50, and 100 mg L−1, were tested. As earlier, the pH in all vials was between 6 and 7. However, ORP was −26, −175, and −360 mV, respectively, in vials containing 10, 50, and 100 mg L−1 Fe(II). Figure 7 shows a plot of Ln[dCT/dt] versus Ln[Ca] during HCIF-S3 interaction with 2-CN in the presence of Fe(II). The lines of best fit corresponding to (1) HCIF-S3 interaction with 2-CN in the absence of Fe(II) (Fig. 5B) and (2) HCIF-S1 and HCIF-S2 interaction with 2-CN (Fig. 3C) are reproduced in Fig. 7 for comparison. Addition of Fe(II) was clearly demonstrated to enhance the rate of 2-CN dehalogenation. However, no effect of the concentration of added Fe2+ was apparent. Hence, data corresponding to all three added Fe(II) concentrations were pooled together and a line of linear fit was drawn. The rate constant (k1) and order (N) of 2-CN dehalogenation by HCIF-S3 in the presence of Fe(II) was obtained from this plot (see equations 1a and 1b) as 1.21×10⁻⁶ h−1 g−1 iron L and 4.04, respectively. The k1 value obtained in this case was thus higher by nearly an order of magnitude in comparison to the k1 value (2.62×10⁻⁷ h−1 g−1 iron L) obtained during the interaction of HCIF-S3 with 2-CN in the absence of Fe(II). However, the rate of 2-CN dehalogenation by HCIF-S3, both in the absence and presence of added Fe2+, is orders of magnitude smaller than the rate of 2-CN dehalogenation by HCIF-S1 and HCIF-S2 (k1=9.81×10⁻³ h−1 g−1 iron L).
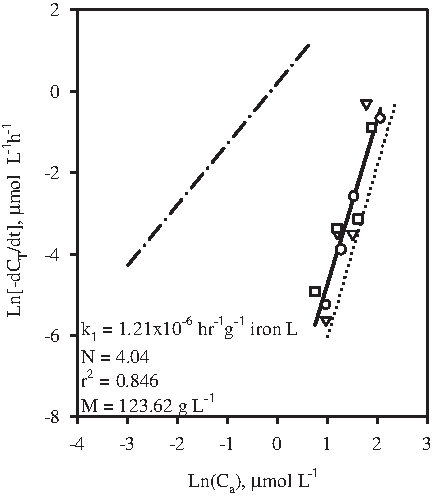
Rate of 2-CN dehalogenation by HCIF-S3 in the presence of added Fe(II). (○) Added Fe2+: 10 mg L−1; (∇) added Fe2+: 50 mg L−1; (□) added Fe2+: 100 mg L−1; (—) linear fit; (—·—) rate of 2-CN dehalogenation by HCIF-S1/HCIF-S2 (from Fig. 3C); (¨¨¨¨¨¨¨¨) rate of 2-CN dehalogenation by HCIF-S3 (from Fig. 5B).
Discussion
The SEM image of HCIF-S1 (Fig. 8A) revealed a surface with cracks and crevices clearly visible. The SEM images of HCIF-S2 and HCIF-S3 (Fig. 8B and 8C, respectively) show considerable changes in surface morphology when compared with HCIF-S1. This is probably due to the presence of oxide coating on these surfaces, as identified by the XRD (Fig. 1) and Mössbauer (Fig. 2) spectra of HCIF-S2 and HCIF-S3 surfaces.
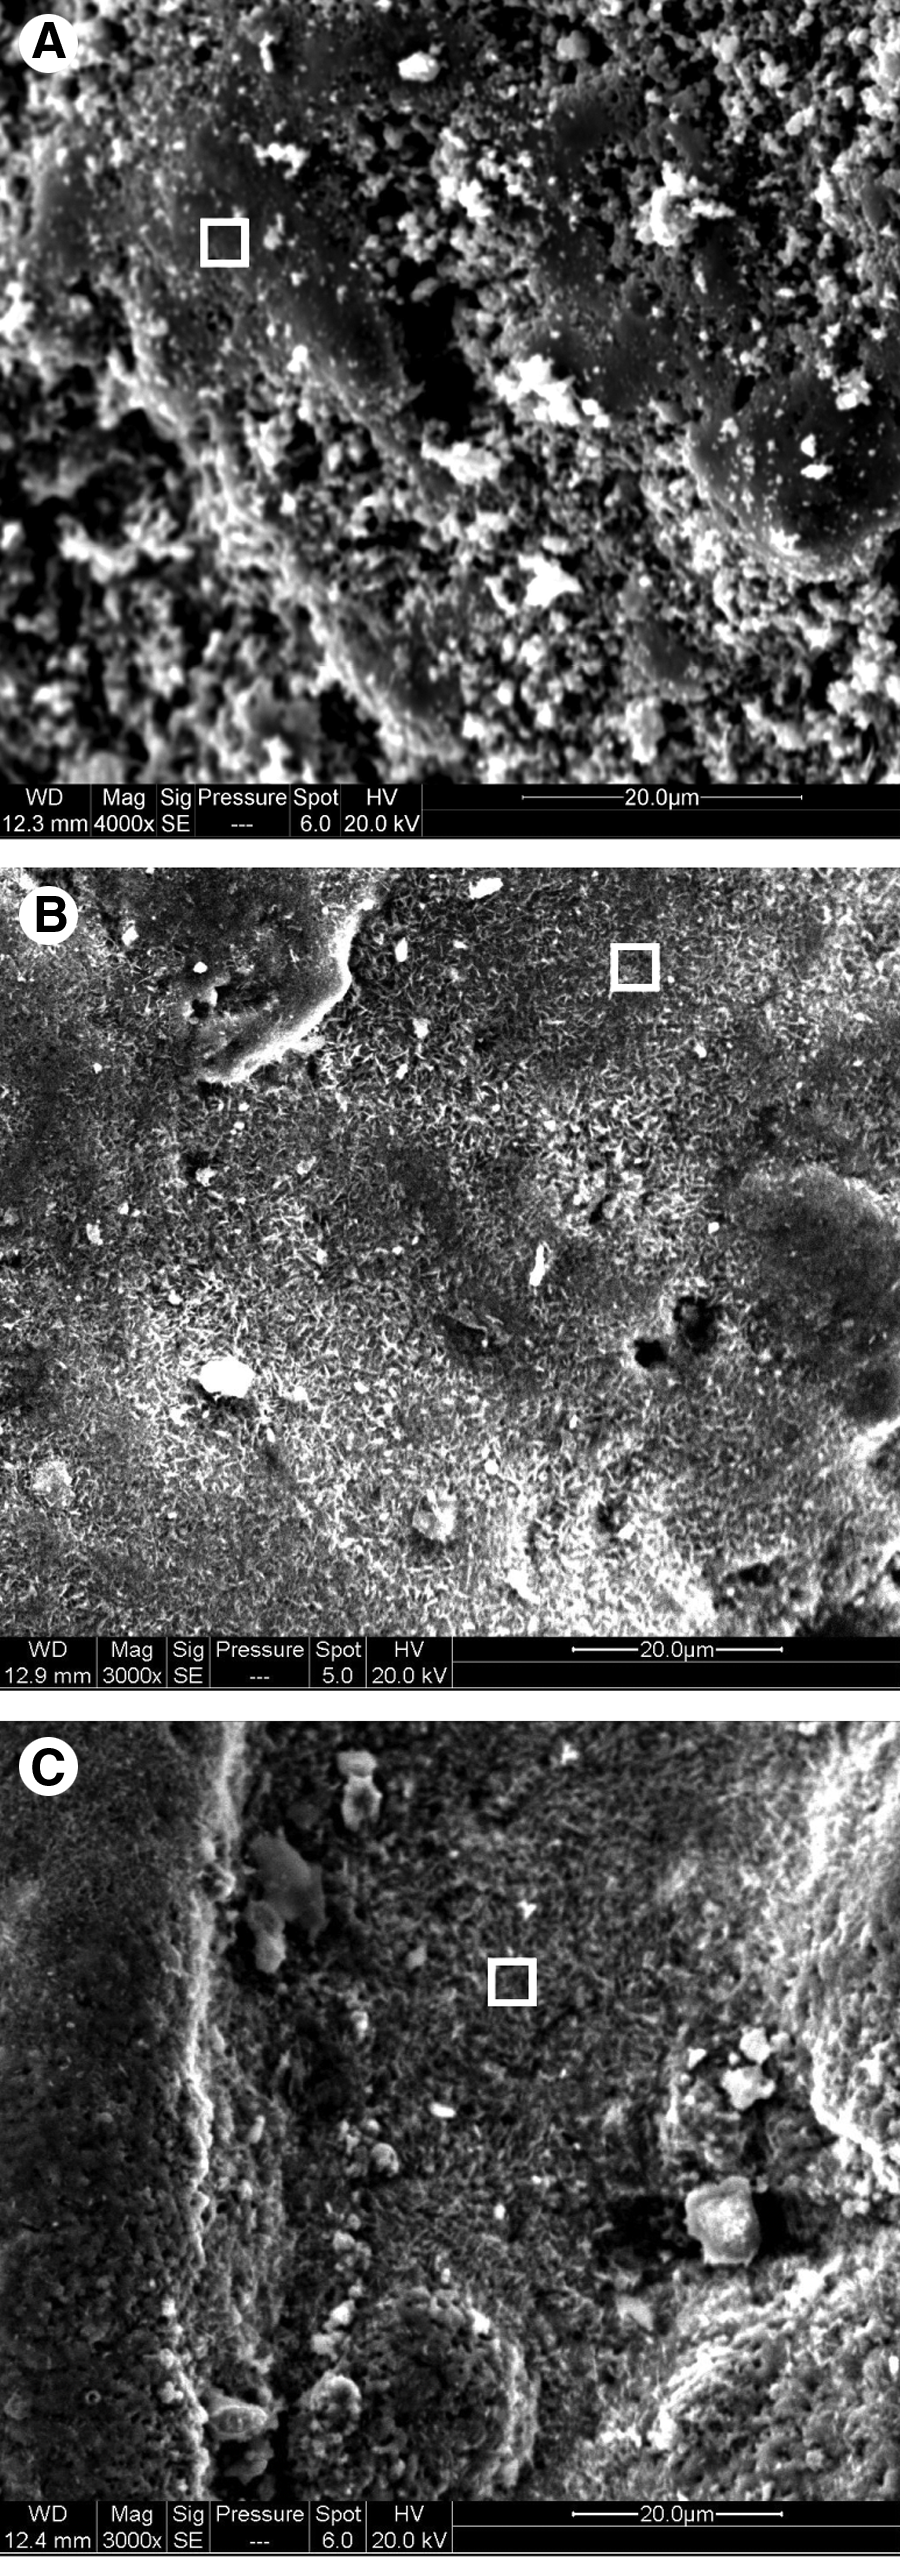
Scanning electron micrographs.
The EDS results obtained for HCIF-S1, HCIF-S2, and HCIF-S3 surfaces are presented in Table 1. The abundance values presented in Table 1 are the average obtained from four points on the surface. It is assumed that notwithstanding surface heterogeneity, the values presented in Table 1 are representative of the surface. Abundance of iron was highest on HCIF-S1 surface and the least on HCIF-S3 surface. As far as abundance of oxygen was concerned, the situation was exactly reversed. These results are consistent with the initial presence of oxide phases in HCIF-S2 and HCIF-S3 surfaces and are in qualitative agreement with the XRD and Mössbauer spectra presented in Figs. 1 and 2. The EDS results presented in Table 1 further indicate that the abundance of carbon was nearly same in HCIF-S1 and HCIF-S2 surfaces, but declined sharply on HCIF-S3 surface. These observations are in qualitative agreement with the Mössbauer spectroscopy results, which indicate that cementite (Fe3C) was present on HCIF-S1 and HCIF-S2 surfaces, but not on HCIF-S3 surface. It appears that shielding of the cementite and graphite phases on the iron surface by iron oxide coating may account for the reduction in carbon abundance on HCIF-S3 surface.
HCIF, high-carbon iron filings.
The Mössbauer spectroscopy results (Fig. 2B) suggest that a large portion of the oxide coating on the HCIF-S2 surface was magnetite. Magnetite is a semiconductor and has an electrical conductivity close to that of metallic iron (Schmuki et al., 1995; Balko et al., 1998; Farrell et al., 2000). Based on the results of this study, it appears that formation of a magnetite coating does not substantially impact electron transport required for reduction of 2-CN at the HCIF surface. Hence, the rate of 2-CN dehalogenation by HCIF-S1 and HCIF-S2 was approximately the same (Fig. 3A).
Preliminary experiments demonstrated that 2-CN does not adsorb on pure iron (data not shown). It has also been demonstrated that nonionic compounds such as 2-CN do not adsorb on iron oxide surfaces (Clausen and Fabricius, 2001). Thus, the observed adsorption of 2-CN on the HCIF surface may be attributed to partitioning on carbon present in the form of graphite/cementite on HCIF surface. The EDS results (Table 1) demonstrate that abundance of carbon on HCIF-S1 and HCIF-S2 surfaces was nearly the same. These observations may explain the fact that the extent of adsorption of 2-CN on HCIF-S1 and HCIF-S2 surfaces was nearly the same (Fig. 3D).
The Mössbauer spectroscopy results (Fig. 2B) suggest that the surface oxide coating on HCIF-S3 surface was mostly maghemite, hematite, and δ-FeOOH. These oxide minerals have an insulating character (Mayne et al., 1950) and may thus inhibit electron transfer required for 2-CN dehalogenation. This may explain the substantial decline in 2-CN dehalogenation rates observed during interaction with HCIF-S3 surface (compared with HCIF-S1 and HCIF-S2) observed in this study. Addition of Fe(II) ions enhanced the dehalogenation rate of 2-CN by HCIF-S3 (Fig. 7). Other researchers have also demonstrated similar effects (Buerge and Hug, 1997; Charlet et al., 1998; Strathmann and Stone, 2002) on Fe(II) addition. In this context, Huang and Zhang (2002) proposed that when aqueous Fe(II) ions were adsorbed and incorporated into the maghemite lattice, maghemite could be locally converted to magnetite, enhancing the conductivity of the oxide layer and allowing transfer of electrons from metallic iron to the contaminant at the oxide–water interface.
Finally, adsorption of 2-CN on HCIF-S3 was shown to be substantially diminished in comparison to 2-CN adsorption on HCIF-S1 and HCIF-S2. As discussed earlier, 2-CN adsorption is probably related to the carbon content of HCIF surface. The EDS results (Table 1) indicate that the carbon content of HCIF-S3 surface is considerably lower when compared with HCIF-S1 and HCIF-S2 surfaces. This reduced carbon content of HCIF-S3 surface may explain the reduced adsorption of 2-CN on this surface.
It should also be pointed out that the surface characterization studies discussed earlier all correspond to the dry HCIF surface, that is, before it was contacted with the aqueous phase containing 2-CN. It is probable that these surfaces undergo transformation as soon as they are immersed in water. However, the rate of such surface transformation is expected to be slow, in comparison to the duration of experiments reported in this study. Thus, the assumption that the essential surface characteristics of HCIF-S1, HCIF-S2, and HCIF-S3 vis-à-vis 2-CN dehalogenation remain unchanged over the experimental duration is most likely valid.
Summary and Conclusions
The main objective of this study was to investigate the temporal variations in HCIF-mediated HOCs' dehalogenation rates due to deposition of iron oxide minerals on the HCIF surface. For this purpose, the interaction of 2-CN with three types of HCIF was investigated. The three HCIF samples (HCIF-S1, HCIF-S2, and HCIF-S3) were prepared to roughly represent the surface characteristics of HCIF after short-, medium-, and long-term exposure to aqueous 2-CN in anoxic conditions. The study demonstrated the following:
1. During interaction with HCIF-S1 (Fig. 3), 2-CN was observed to partition substantially to the HCIF surface (Freundlich isotherm parameters K and m being 5.10×10⁻² and 0.53, respectively), whereas the residual aqueous 2-CN underwent reductive dehalogenation (dehalogenation rate constant k1=9.81×10⁻³ h−1 g−1 iron L and order N=1.495). Results were similar during 2-CN interaction with HCIF-S2 (Fig. 3). 2. During interaction with HCIF-S3, both the extent of 2-CN adsorption (Freundlich isotherm parameters K and m being 3.31×10⁻⁴ and 1.47, respectively) and dehalogenation rate (dehalogenation rate constant k1=2.62×10⁻⁷ h−1 g−1 iron L and order N=4.24) were substantially diminished when compared with previous cases (Fig. 5). 3. Addition of ferrous ions enhanced the HCIF-S3–mediated 2-CN dehalogenation rate (Fig. 7) by about an order of magnitude (dehalogenation rate constant k1=1.21×10⁻⁶ h−1 g−1 iron L and order N=4.04). 4. The composite interaction of the HCIF surfaces with 2-CN could be simulated using the isotherm and dehalogenation rate parameters determined and by assuming suitable values for the 2-CN adsorption and desorption rate constants (Fig. 4 for HCIF-S1 and Fig. 6 for HCIF-S3). 5. Based on XRD (Fig. 1), Mössbauer (Fig. 2) spectroscopy, SEM (Fig. 8), and EDS (Table 1) investigations of the HCIF surfaces, it was concluded that under oxygen-deficient conditions, initial rusting of HCIF surface may result in the formation of Fe(II)/Fe(III) oxides such as magnetite, which, because of their semiconducting nature, allow electron transport necessary for the 2-CN dehalogenation process. However, continued rusting of the HCIF surface and the resulting formation of Fe(III) oxides such as maghemite, hematite, and δ-FeOOH inhibits electron transport and thus hampers 2-CN dehalogenation. The reduced 2-CN adsorption on HCIF-S3 was attributed to the reduced carbon content of surface because of shielding of surface by the Fe(III) oxide layer.
The results of this study clearly indicate that although the deposition of corrosion products on HCIF surface may not adversely impact the 2-CN dehalogenation process in the short-to-medium term, a long-term reduction in 2-CN dehalogenation rate is expected. However, the long-term 2-CN dehalogenation rate may be slightly enhanced through addition of Fe(II) ions or through in situ production of Fe(II) ions through microbiological reactions.
Footnotes
Author Disclosure Statement
No competing financial interests exist.