
Abstract
Abstract
Chromium–cerium mixed oxides supported on TiO2, mesoporous SiO2, and TiO2-SiO2 were prepared by the impregnation method for the catalytic oxidation of NO to NO2. Activities of Cr-Ce mixed oxides as well as the nature of supports, molar ratio of Cr and Ce, load of the Cr-Ce mixed oxides, and calcination temperatures were investigated. For the optimal Cr-Ce/TiO2 catalyst, the NO conversion reached the thermodynamic equilibrium limitation of 80.7% at a reaction temperature of 330°C with a space velocity of 10,000 h−1. The H2O in the feed gas greatly depressed the catalyst activity by forming nitrate species on the surface of the catalyst, but the catalytic activity recovered with the removal of H2O. Moreover, increased temperatures alleviated the negative impact of H2O. Water together with SO2 in the feed gas exerted irreversible effects on the catalyst because of the generation of sulfite and sulfates on the catalyst surface. A heat treatment at 350°C for 6 h only partially restored the activity of the poisoned catalyst.
Introduction
In response to these disadvantages, the simultaneous removal of SO2 and NO x by wet flue gas desulfurization (FGD) has been proposed as an alternative technology. Nitric oxide, however, is minimally soluble in aqueous or alkaline solution. There would be a very low efficiency for direct absorbance of NO x from the flue gas with FGD. Studies have shown (Tong, 2006), however, that if the NO in flue gas is partially (50%–60% NO2/NO x ) oxidized to NO2, then NO absorption by water or an alkaline solution could attain a high rate and efficiency (>90%) because of the equimolecular absorption of NO and NO2 described by the following reaction: NO+NO2→N2O3. Therefore, the partial oxidization of NO in flue gas is critical for the simultaneous removal of NO x and SO2 by FGD. Many efforts have been made to develop a catalyst for the oxidization of NO. Xue and others (Xue et al., 1996; Després et al., 2004; Schmitz et al., 2006) found that platinum catalysts, such as Pt/SiO2 and Pt/Al2O3, have good activities for NO oxidation. The industrial application of these catalysts has been restricted, however, because of the cost of noble metals and catalyst deactivation by SO2. Yang and other researchers (Yung et al., 2007; Irfan et al., 2008; Wang et al., 2008a, 2008b) focused on the studies of low-cost transition-metal catalysts, specifically cobalt catalysts. However, there were problems of SO2 and H2O poisoning. Chromium catalysts have also attracted much attention. For example, Takayasu and other researchers (Takayasu et al., 1975a; Shiba et al., 1996; Lu et al., 2000) showed that chromium catalysts are highly active for NO oxidation, and other researchers (Takayasu et al., 1975b; Ordóñez et al., 2008) reported a moderate resistance of chromium catalysts to SO2 poisoning when compared with other transition metal oxides. Moriceau et al. (1998) prepared Cr-Ce-O mixed oxide catalysts and found that these catalysts had superior activity and selectivity in oxidative dehydrogenation. Moriceau et al. (1998) attributed the behavior of the Cr-Ce-O mixed oxide catalysts to the Ce doping in the Cr catalysts. Some authors (Matsumoto, 2004; Qi et al., 2004; Krishna et al., 2007) also reported that ceria enhances the mobility of oxygen on the catalyst surface and promotes the oxidization of NO because of its oxygen storage and redox properties.
The appropriate match between carrier and active component is important for improving catalytic performance. Xie et al. (1998) stated that the active components could spontaneously disperse into a monolayer or submonolayer on the surface of the catalyst support and that the support promotes the dispersion of active components by offering advantageous energetic and geometric positions. Nanoscale TiO2 has the advantages of high dispersibility, voidage, and ease of loading with active components (Sreekanth et al., 2006) as well as has been widely used as a support for catalysts in NO oxidation and reduction (Busca et al., 1998; Fountzoula et al., 1999; Yung et al., 2007; Wang et al., 2008a; Li et al., 2009). TiO2 used as the catalyst support is resistant to SO2 poisoning. Peña et al. (2004) reported that the loading of transition-metal oxides, such as Mn, Cr, and Cu oxides, onto anatase TiO2 could inhibit the sintering and phase transition of the support and thus enhance the dispersion of these transition-metal oxides on the support. Peña et al. (2004) also stated that the adsorption of SO2 on the Cr/TiO2 catalyst was hindered because of the large number of Brønsted and Lewis acid sites on the catalyst. Similar reports (Rynkowski et al., 2000; López et al., 2004) show that the loading of CeO2 on TiO2 support can promote the thermal stability of the catalyst, preventing particle sintering and micropore collapse and resulting in particular redox properties of the catalyst.
Therefore, in this study, the mixed oxides of Cr and Ce were loaded onto a TiO2 support to produce a Cr-Ce/TiO2 catalyst for NO oxidation. The behavior of the resultant catalyst for NO oxidation was investigated. For comparison, mesoporous SiO2 (MPS) and TiO2-SiO2 (TS) were also used as catalyst supports. MPS has a high specific surface area ranging from 500 to 1,400 m2/g and an excellent resistance to sulfur poisoning (Huang et al., 2008). Kobayashi et al. (2005) reported that active constituents loaded on the TS support perform with high activity at low temperatures.
Experimental
Catalyst preparation
Anatase-type TiO2 (Nanjing Haitai Co. China; SA=80 m2/g, average size=10 nm) was used as the TiO2 support. The TiO2-SiO2 support was prepared by a coprecipitation method in the following steps: a solution of Ti(SO4)2 (AR, Aldrich) in distilled water was mixed with silicium collosol at a 4:1 TiO2:SiO2 molar ratio. After 1 h of stirring in the Ti(SO4)2–silicium mixture, ammonium hydroxide of 25 wt.% was added dropwise at a rate of 5 mL/min, until a pH of 9–10 was reached. The precipitate was then aged for 10 h at 40°C, washed with deionized water three times, dried for 10 h at 150°C, and calcined at 500°C in a muffle furnace in air for 3 h to afford a white TS support. Finally, the product was ground into small particles of 40–80 mesh for the following catalyst preparation.
MPS was prepared by a microemulsion method. Dodecyl amine (AR) and ethyl orthosilicate (AR) with a mass ratio of 1:3.8 were added to a solution of 1:1 (v/v) ethanol:water of 120 mL. After agitating for 22 h, the reaction mixture was filtered under suction, washed with the ethanol, dried at 120°C for 2 h, and calcined at 600°C in air for 5 h to afford a white MPS support.
The Cr-Ce/TiO2, Cr-Ce/TS, and Cr-Ce/MPS catalysts were prepared by an impregnation method. The planned amounts of Ce(NO3)3·6H2O (AR; Aldrich) and Cr(NO3)3·9H2O (AR; Aldrich) were dissolved in 100 mL distilled water, and the desired support, either TiO2, TS, or MPS, was added. The mixture was stirred for 2 h, dried at 120°C for 12 h, and calcined at 250–550°C for 6 h. After cooling to ambient temperature, the product was ground and filtered to provide catalyst particles of 40–80 mesh.
Catalyst characterization
Brunauer-Emmett-Teller (BET) surface area, pore volume, and pore size of the catalysts were determined using N2 desorption by a NOVA-1000 instrument (Malvern Instruments Ltd.) at 77 K. X-ray diffraction measurements (XRD) were performed with Cu Kα radiation on a Bruker D8 Advance X-ray diffractometer. Scans were taken over a range of 2θ angles from 10° to 80° at a speed of 4°/min. Fourier transform infrared spectroscopy (FTIR) was conducted on a Bruker EQUNINOX55 spectrometer at ambient temperature, with scan ranging from 4,000 to 400 cm−1. Before characterization, the spent catalyst samples were flushed with N2 at the reaction temperatures for 4 h to remove physically adsorbed species. After cooling to room temperature, the catalyst sample was mixed with KBr at a mass ratio of 1:150, followed by grinding and pelleting.
Catalytic activity measurement
Catalyst evaluation was carried out in a stainless-steel tubular fixed bed reactor (20 mm inner diameter). Catalyst powder (10 mL) was put on a sieve-like distributor in the middle of the reactor, which was placed in a tubular furnace equipped with a programmable temperature controller. The feed gas for the reaction consisted of 873 mg/m3 NO, 8% O2, 10% water vapor (when needed), and 798 mg/m3 SO2 (when needed), with the balance made up by N2. The total flow rate was 1,300 mL/min, which corresponded to a gas hourly space velocity (GHSV) of 10,000 h−1. Oxygen was directly fed into the reactor to avoid the reaction of NO with O2 in the pipeline or in the mixing bottle before entering the reactor. The concentrations of NO and NO2 at the inlet and outlet of the reactor were continuously monitored by a chemiluminescent 42C-HL NO
x
analyzer (Thermo Environmental Instruments, Inc.). The conversion efficiency of NO was defined as follows:
Results and Discussion
Catalyst characterization
The BET characterizations show that the specific surface area of TiO2, TS, and MPS are 109.683, 172.492, and 1,111.81 m2/g, respectively. The MPS has the largest surface area, whereas TiO2 has the smallest. Accordingly, TiO2, TS, and MPS have average pore diameters of 7.011, 3.434, and 2.463 nm, respectively, and pore volumes of 0.357, 0.171, and 1.000 cm3/g.
Table 1 lists the BET surface areas, pore size, and pore volume of the Cr-Ce/TiO2 catalysts calcined at different temperatures with Cr:Ce (molar)=2:1 and 30 wt.% total load of Cr-Ce mixed oxides based on the mass of the supports. Calcination temperatures greatly affect the surface area of the Cr-Ce/TiO2 catalysts. In the calcination temperature range of 250°C–550°C, the largest surface area of the Cr-Ce/TiO2 catalyst was obtained at 350°C. From 350°C to 550°C, the surface area diminished from 86.399 to 38.652 m2/g, whereas the average pore size increased from 3.410 to 17.786 nm.
The numbers in parentheses are the calcination temperatures.
Figure 1 shows the results of XRD analysis on the Cr-Ce/TiO2 catalysts at different calcination temperatures. There are diffraction peaks at 25.3°, 37.7°, 48.0°, 53.8°, 55.2°, 62.7°, 68.9°, and 75.2° in the spectra of the catalysts, which could be attributed to anatase-type TiO2 (Zhang et al., 2000). The spectrum of catalyst calcined at 250°C (spectrum D) is almost identical to that of catalyst calcined at 350°C (spectrum C), in which there is no evidence for other crystalline phases except TiO2. This similarity indicates that the Ce and Cr oxides in the two catalysts are amorphous and well dispersed on the TiO2 supports. In the spectrum of the catalyst with a 450°C calcination temperature (spectrum B), characteristic diffraction peaks belonging to crystalline phases of Cr2O3 are observed, whereas the diffraction peaks of CeO2 are weak. Moreover, at a calcination temperature of 550°C, as shown in spectrum A, the Cr2O3 diffraction peak became sharper and more intense. Further, a clear diffraction peak for CeO2 is also observed at 2θ=28°. This peak suggests a better crystallinity and a larger grain size of Cr2O3 and CeO2 on the catalyst at the increased calcination temperature. From the above observation, a higher calcination temperature in the catalyst preparation leads to better crystallinity but poor dispersion of Ce and Cr oxides on the TiO2 support.
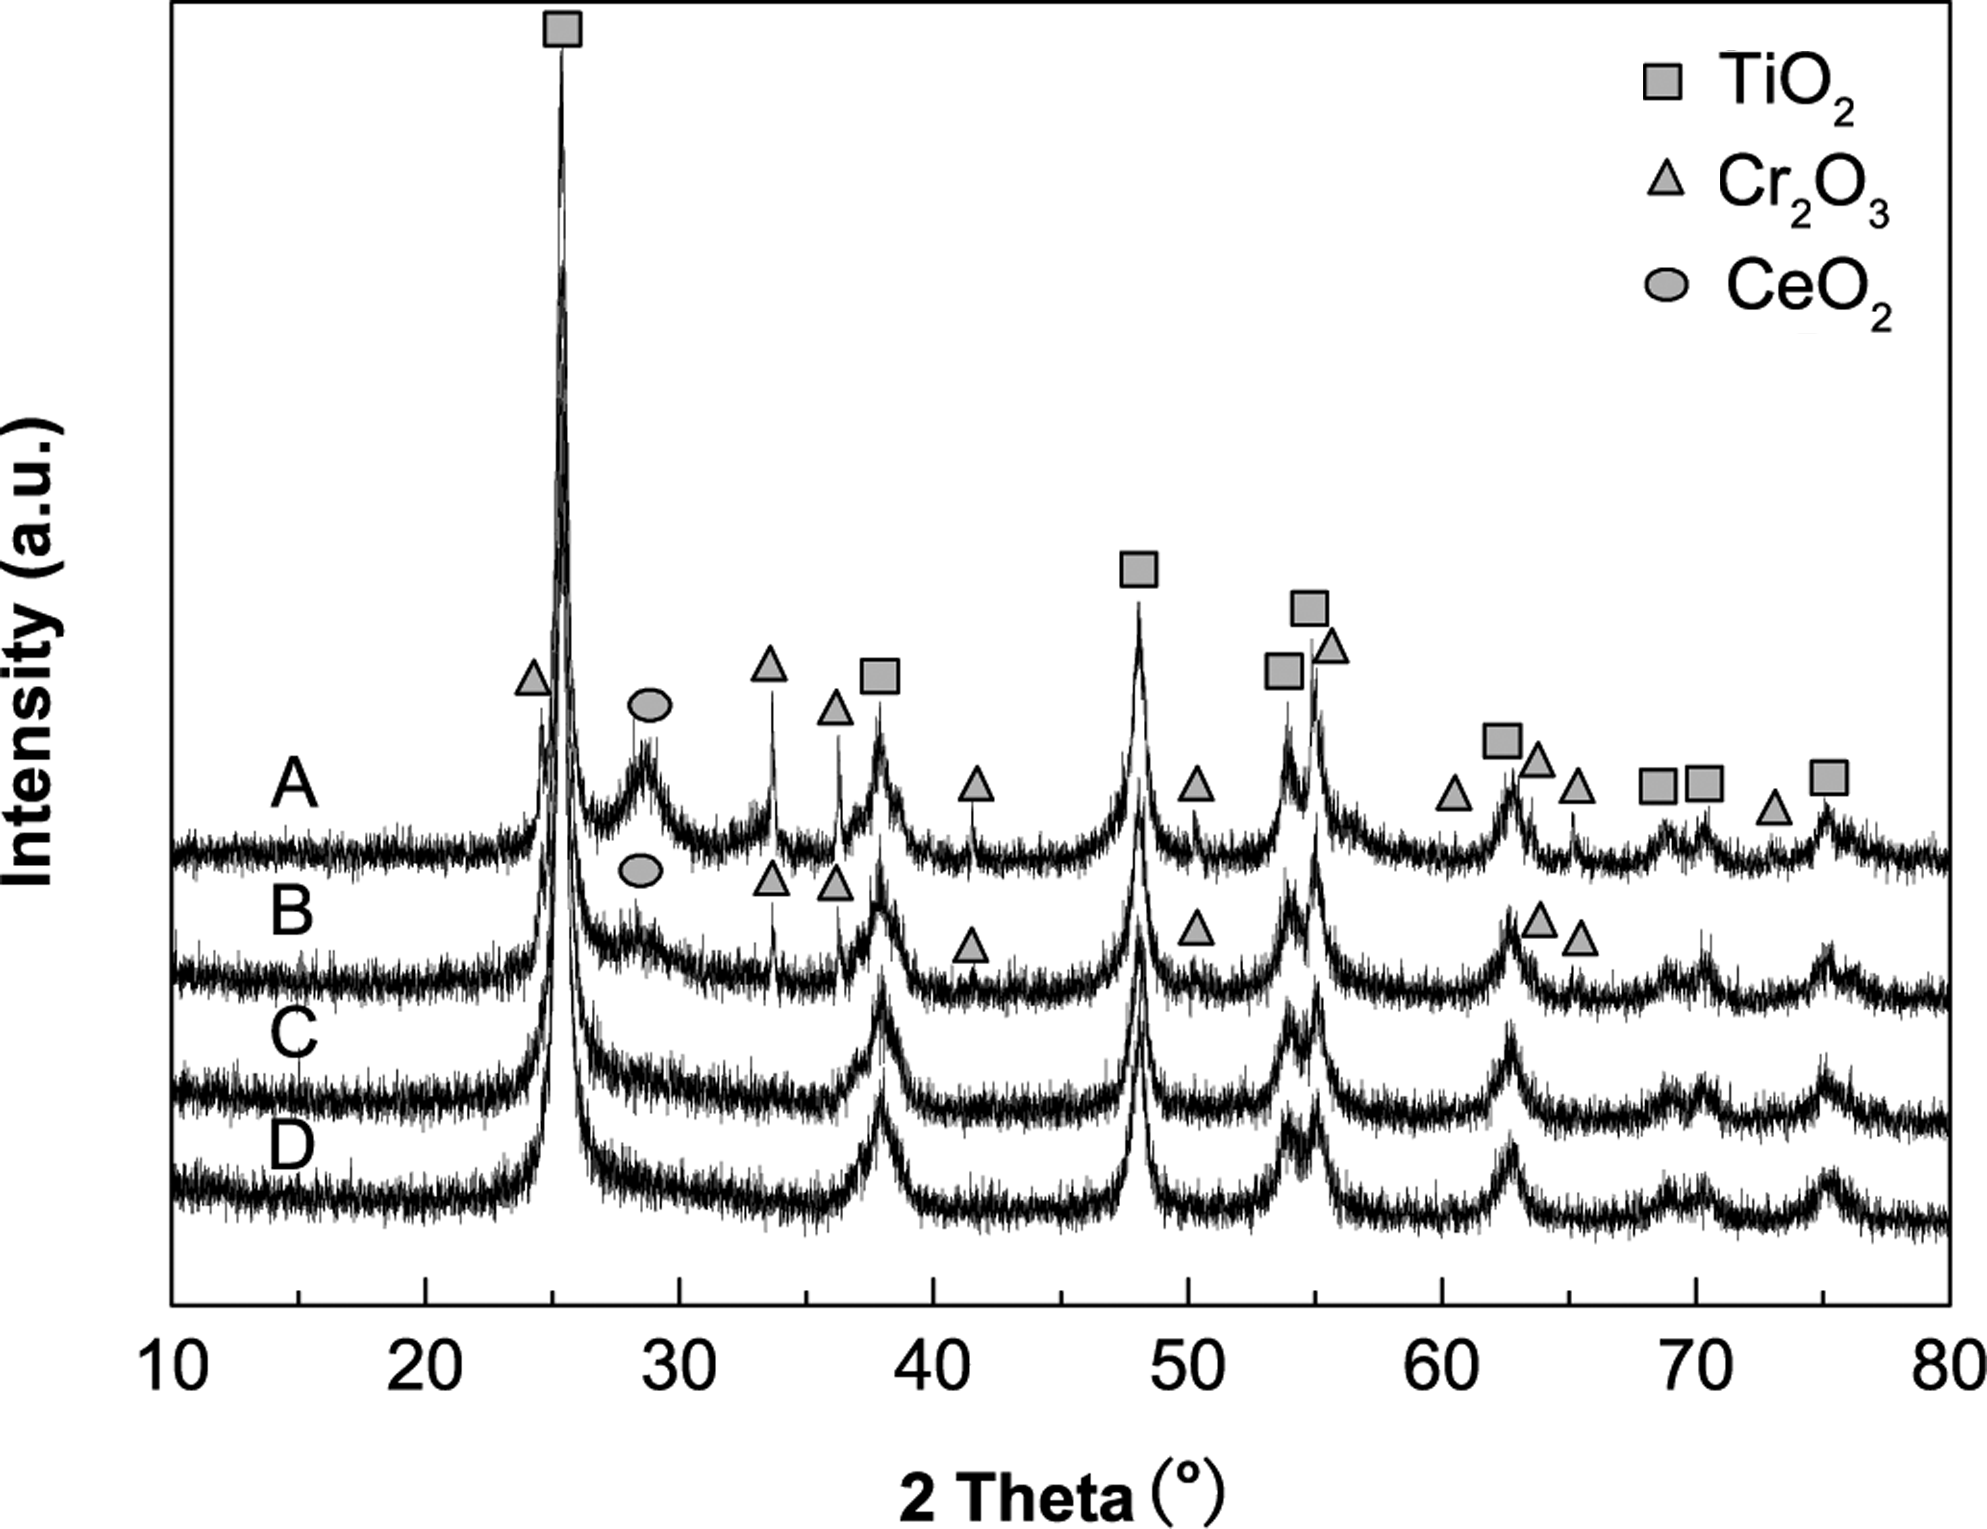
XRD patterns of Cr-Ce/TiO2 catalysts calcined at different temperatures. Testing conditions: Cr:Ce=2:1, 30wt.% Cr-Ce oxides load. Calcination temperatures: A, 550°C; B, 450°C; C, 350°C; D, 250°C.
In consideration of the results of BET and XRD analyses, the small surface area of the catalyst calcined at 250°C is probably due to the blockage of catalyst micropores by incomplete decomposition of nitrate species. In contrast, the catalysts calcined at temperatures above 350°C have small surface areas, which are due to the transformation of the amorphous phase of the Cr-Ce mixed oxides to the crystalline phase and the size enlargement of the crystal.
Effects of the supports on catalytic activity
As shown in Fig. 2, the effects of the catalyst supports on NO oxidation were investigated by loading Cr-Ce mixed oxides on TiO2, TS, or MPS supports with Cr:Ce (molar)=2:1, 30 wt.% total load of Cr-Ce mixed oxides, and 350°C calcination temperature. The catalyst supported by TiO2 shows the highest activity, and the maximum NO conversion of 80.7% was achieved at 330°C over the Cr-Ce/TiO2 catalyst. Further increases of the reaction temperature decreased the NO conversion because of the limitations of thermodynamic equilibrium. The volcano-shaped curve, however, was not observed over Cr-Ce/TS and Cr-Ce/MPS catalysts. The maximum NO conversion was 60.9% and 52.1% at 350°C for the two catalysts, respectively. The fact that the Cr-Ce/MPS catalyst did not exhibit the highest activity even though MPS had the largest specific surface area suggests that the primary factor affecting the catalytic activity was not merely the specific surface area of the supports, but rather other factors such as the combination of Cr-Ce oxides and the supports.
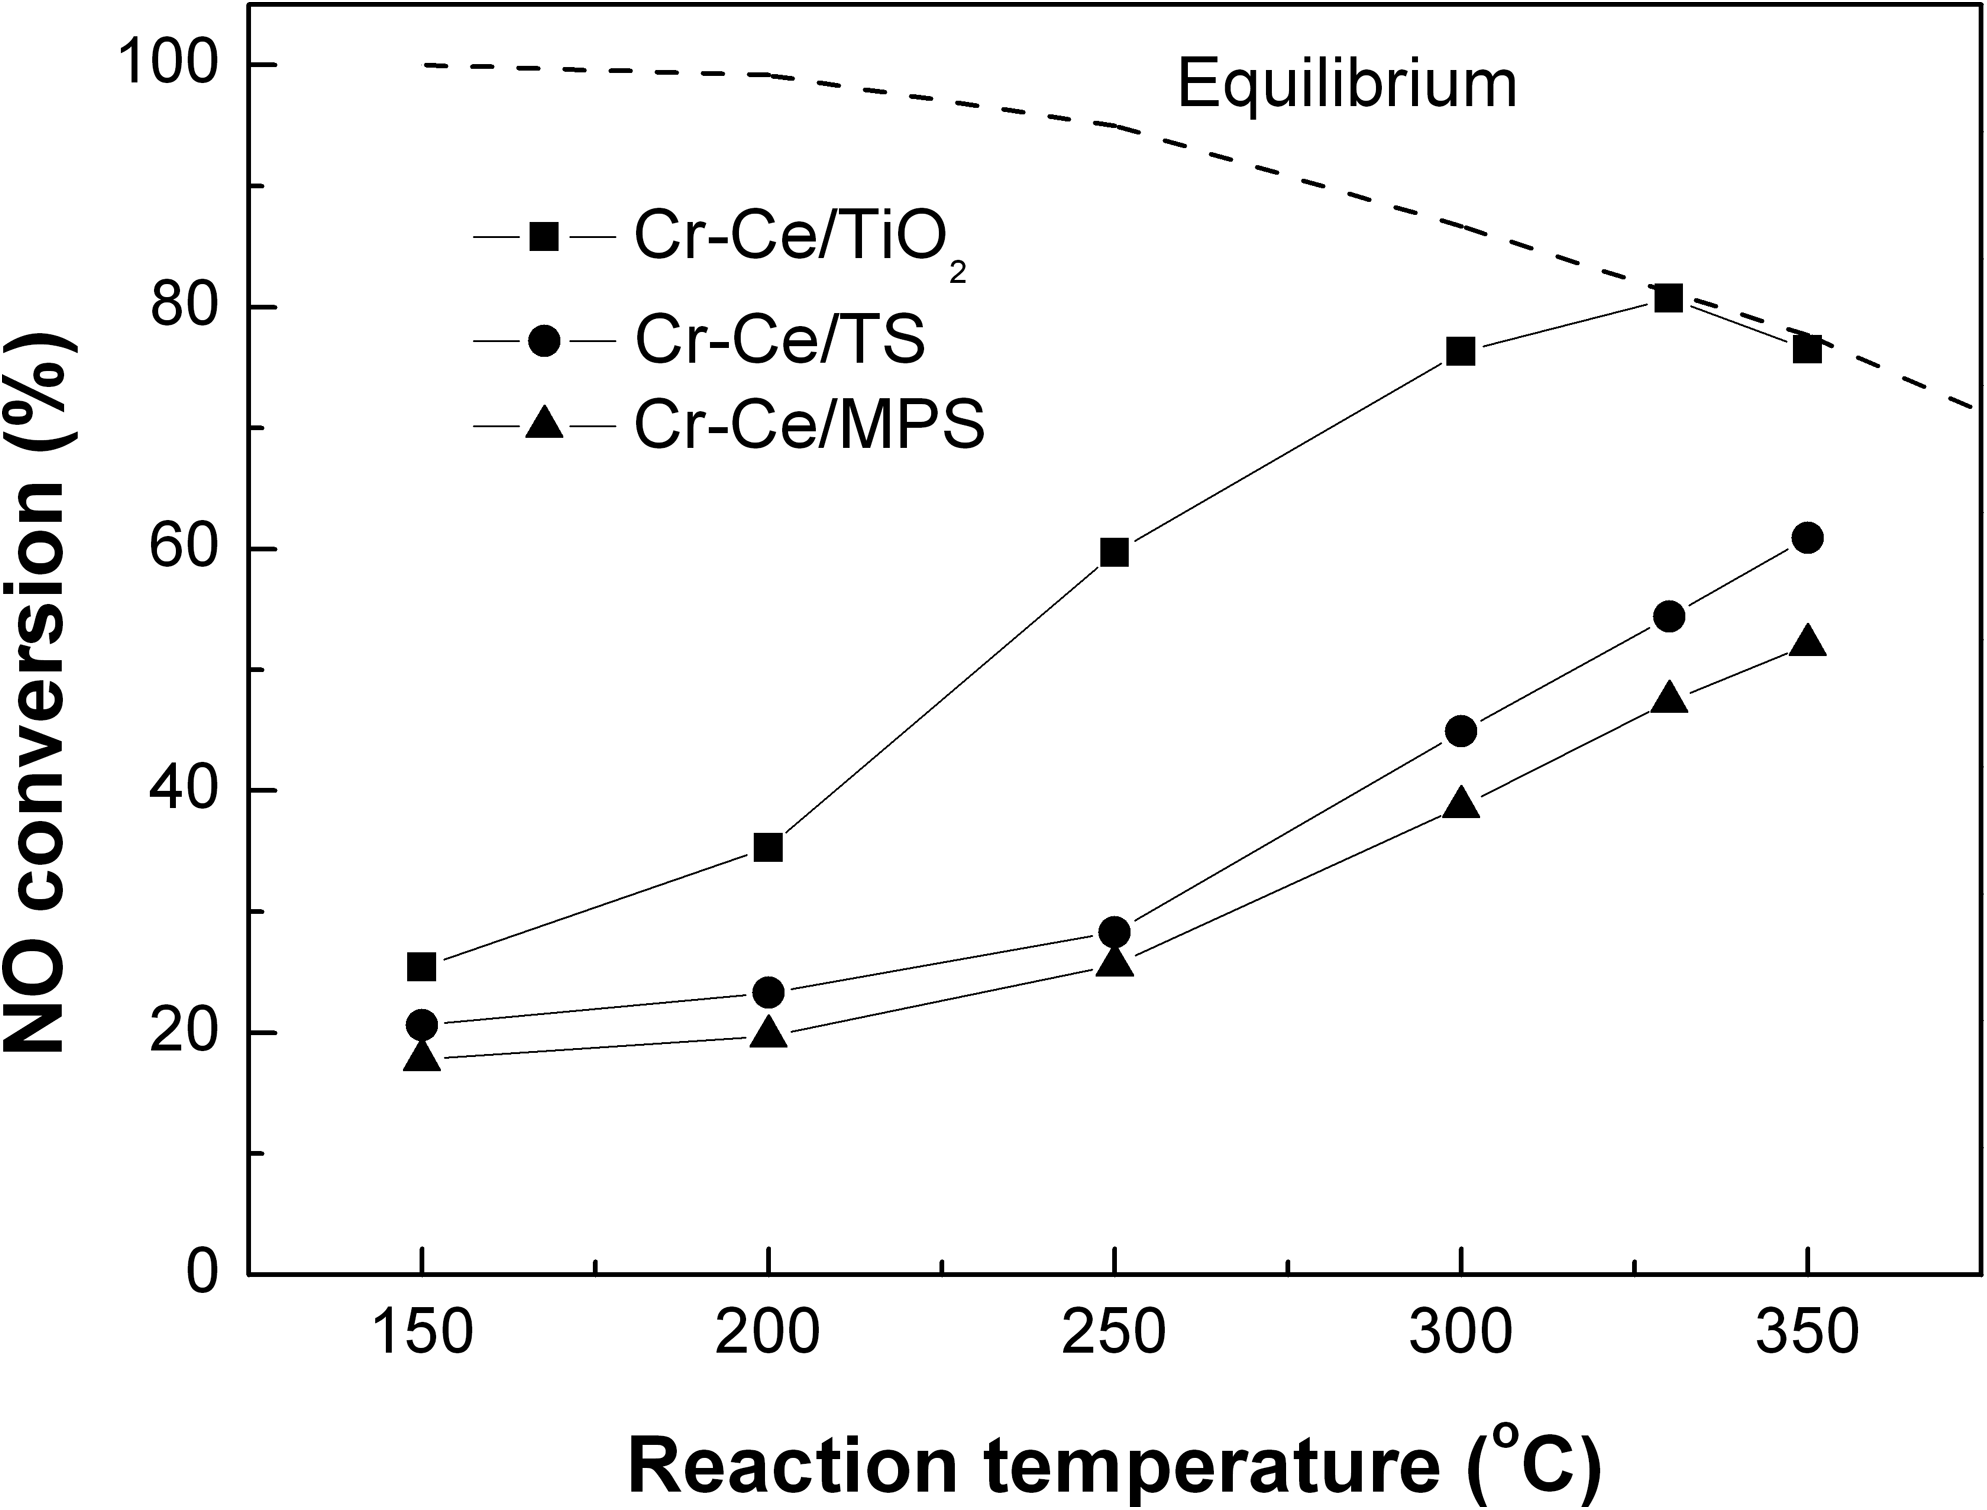
NO conversions over Cr-Ce/TiO2, Cr-Ce/TS, and Cr-Ce/MPS catalysts. Catalytic activity testing conditions: [NO]=873 mg/m3; [O2]=8%; balance N2; GHSV=10,000 h−1.
Effects of molar ratio of Cr to Ce on catalytic activity
Cr-Ce/TiO2 catalysts with the same total load of Cr-Ce oxides (30 wt.%) and calcination temperature (350°C) but with different molar ratios of Cr:Ce (1:0, 3:1, 2:1, 8:5, 1:1, and 0:1, denoted as Cr, Cr3Ce1, Cr2Ce1, Cr8Ce5, Cr1Ce1, and Ce, respectively) were prepared to determine the effects of the molar ratio of Cr to Ce on the catalytic activity for the oxidation of NO to NO2. As shown in Fig. 3, catalytic promotion for NO conversion of Cr/TiO2 catalyst was enhanced by doping with a little Ce; at Cr:Ce=2:1, Cr-Ce/TiO2 catalyst showed significantly improved activity; further enhanced proportion of Ce in Cr-Ce/TiO2 catalyst resulted in decrease of NO conversion. This result indicates that there were distinct synergistic effects between the Cr and Ce oxides at the Cr:Ce mole ratio of 2:1. Additionally, the reaction temperature for maximal NO conversion decreased from 350°C with Cr/TiO2 to 330°C with Cr-Ce/TiO2 at Cr:Ce=2:1.
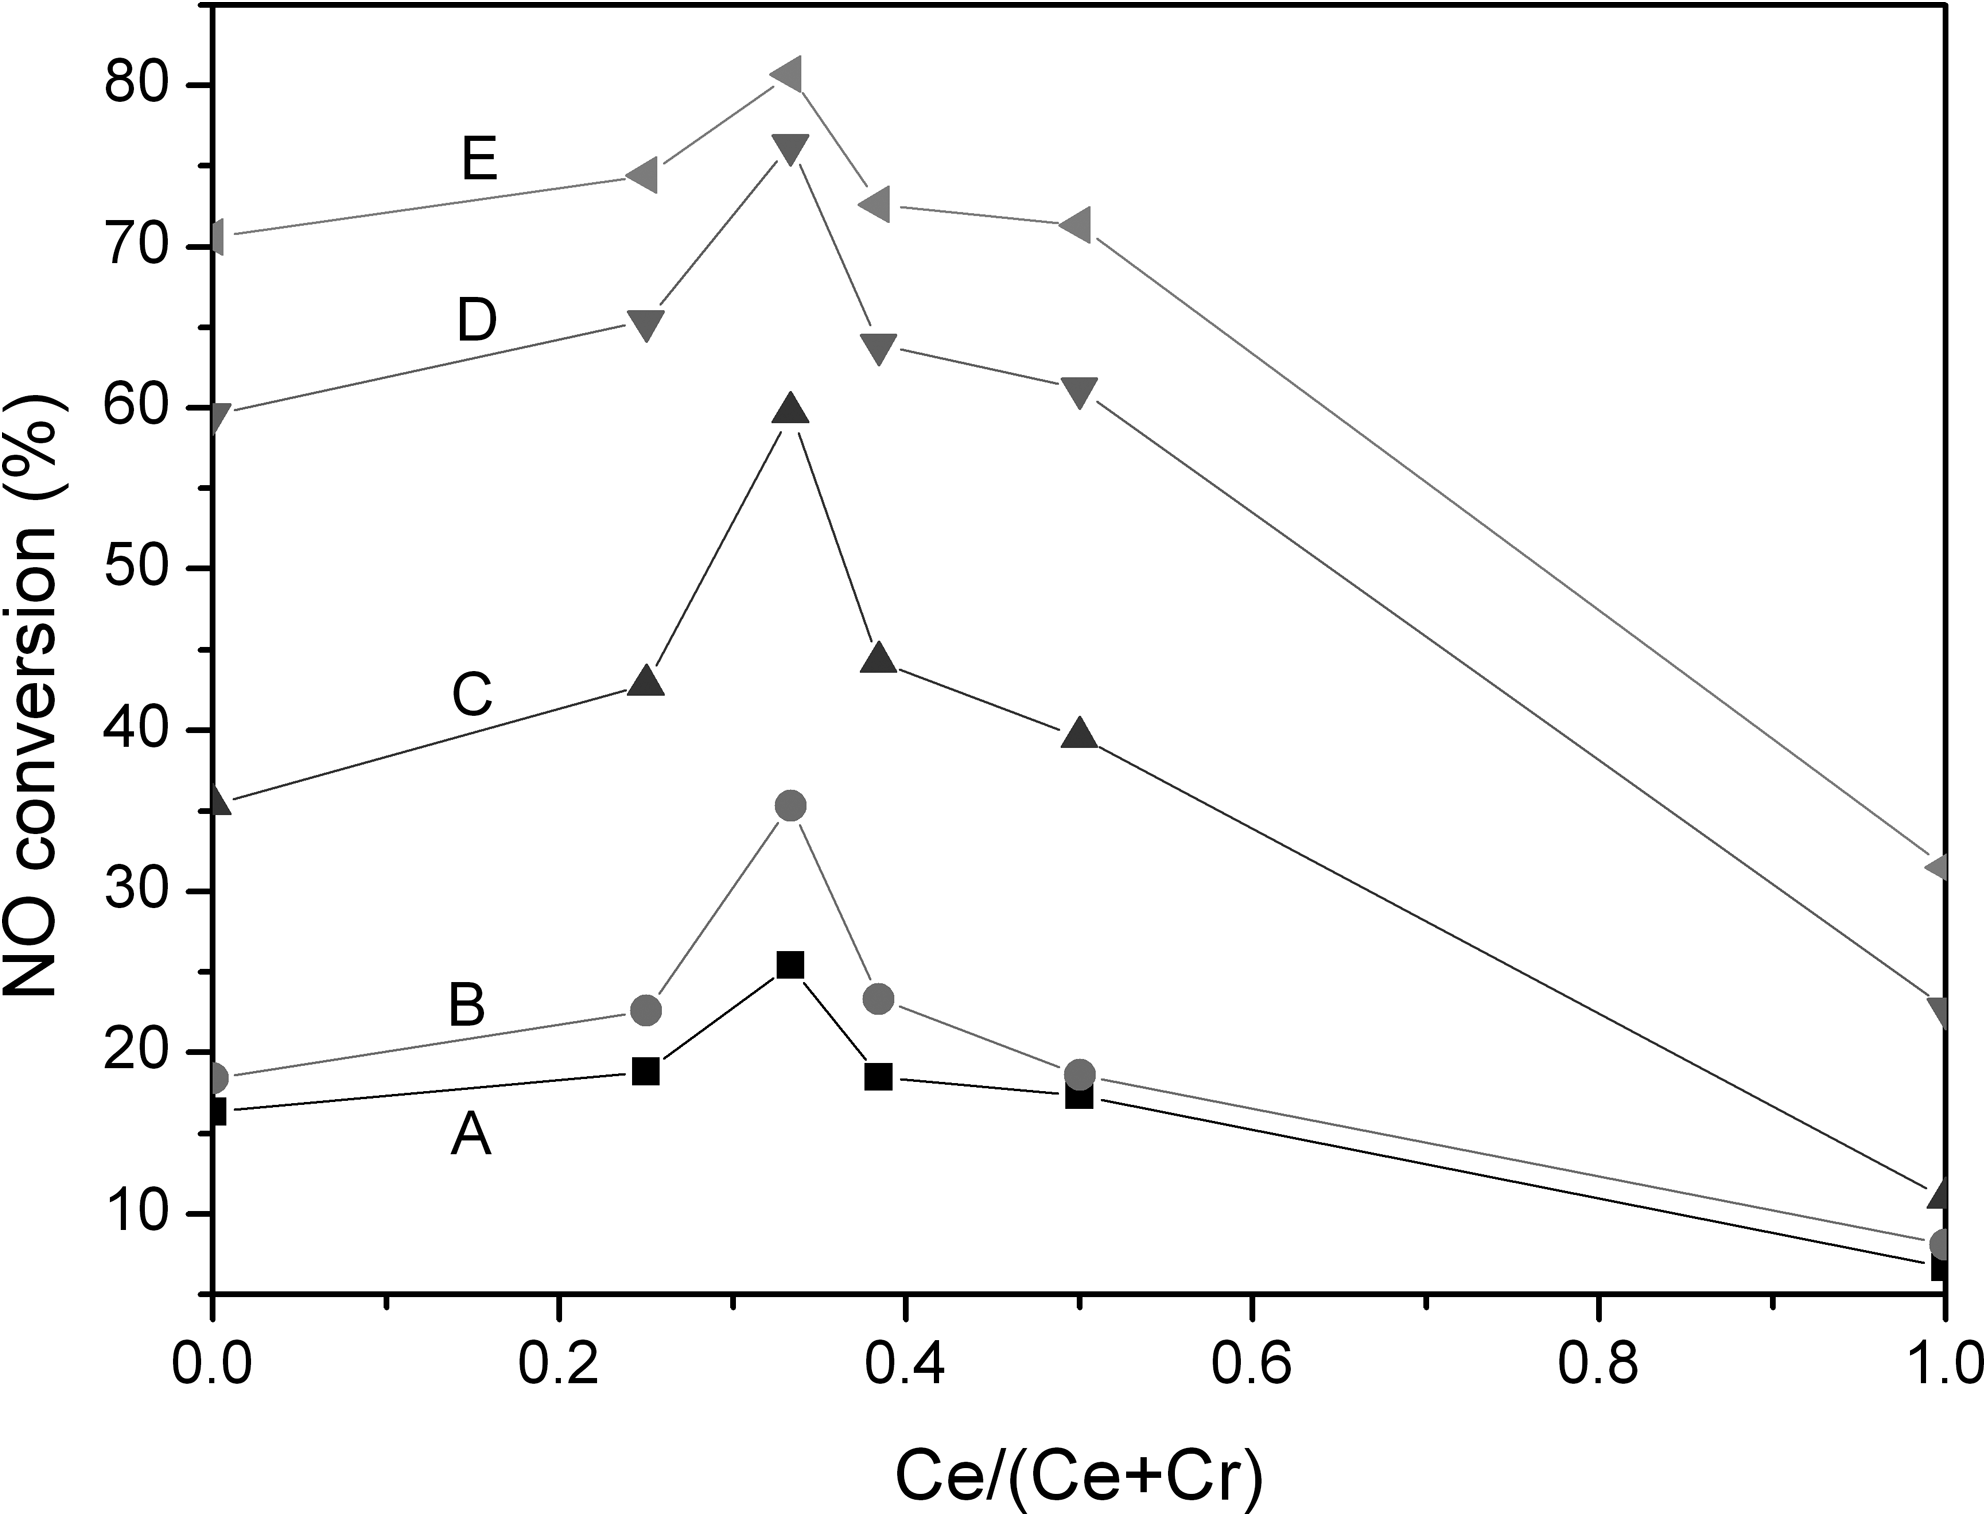
NO conversion over Cr-Ce/TiO2 catalysts (calcined at 350°C) with 30 wt.% Cr-Ce oxides load and with different Cr:Ce molar ratios. Catalytic activity testing conditions: [NO]=873 mg/m3; [O2]=8%; balance N2; GHSV=10,000 h−1. Reaction temperatures: A, 150°C; B, 200°C; C, 250°C; D, 300°C; E, 330°C.
Effects of the total load of Cr-Ce mixed oxides on catalytic activity
Figure 4 illustrates the effects of the total load of Cr-Ce mixed oxides on the catalyst activity. When the total load of Cr-Ce oxides was 30% of the mass of the TiO2 support and calcination temperature 350°C, the Cr-Ce/TiO2 catalyst reached its highest activity. At different reaction temperatures, however, the sensitivity of the NO conversion to the change of the total load of the active components was different. Standard variance analysis of the NO conversion data over Cr-Ce/TiO2 catalysts at different reaction temperatures provided values of standard deviation 2.73 at 150°C, 6.62 at 200°C, 15.25 at 250°C, 10.93 at 300°C, and 2.30 at 330°C. This analysis shows that below 200°C the NO conversion over the Cr-Ce/TiO2 catalysts varied slightly with the load change of the Cr-Ce mixed oxides because of the low activity of the catalysts. At the reaction temperature of 250°C, however, the NO conversion was sensitive to the change of the total load of the active components. A small variation in the amount of Cr-Ce mixed oxides can greatly influence the NO oxidation reaction over the Cr-Ce/TiO2 catalyst. At higher reaction temperatures (300°C and 330°C), however, the load of active components has smaller impact on the catalytic activity.
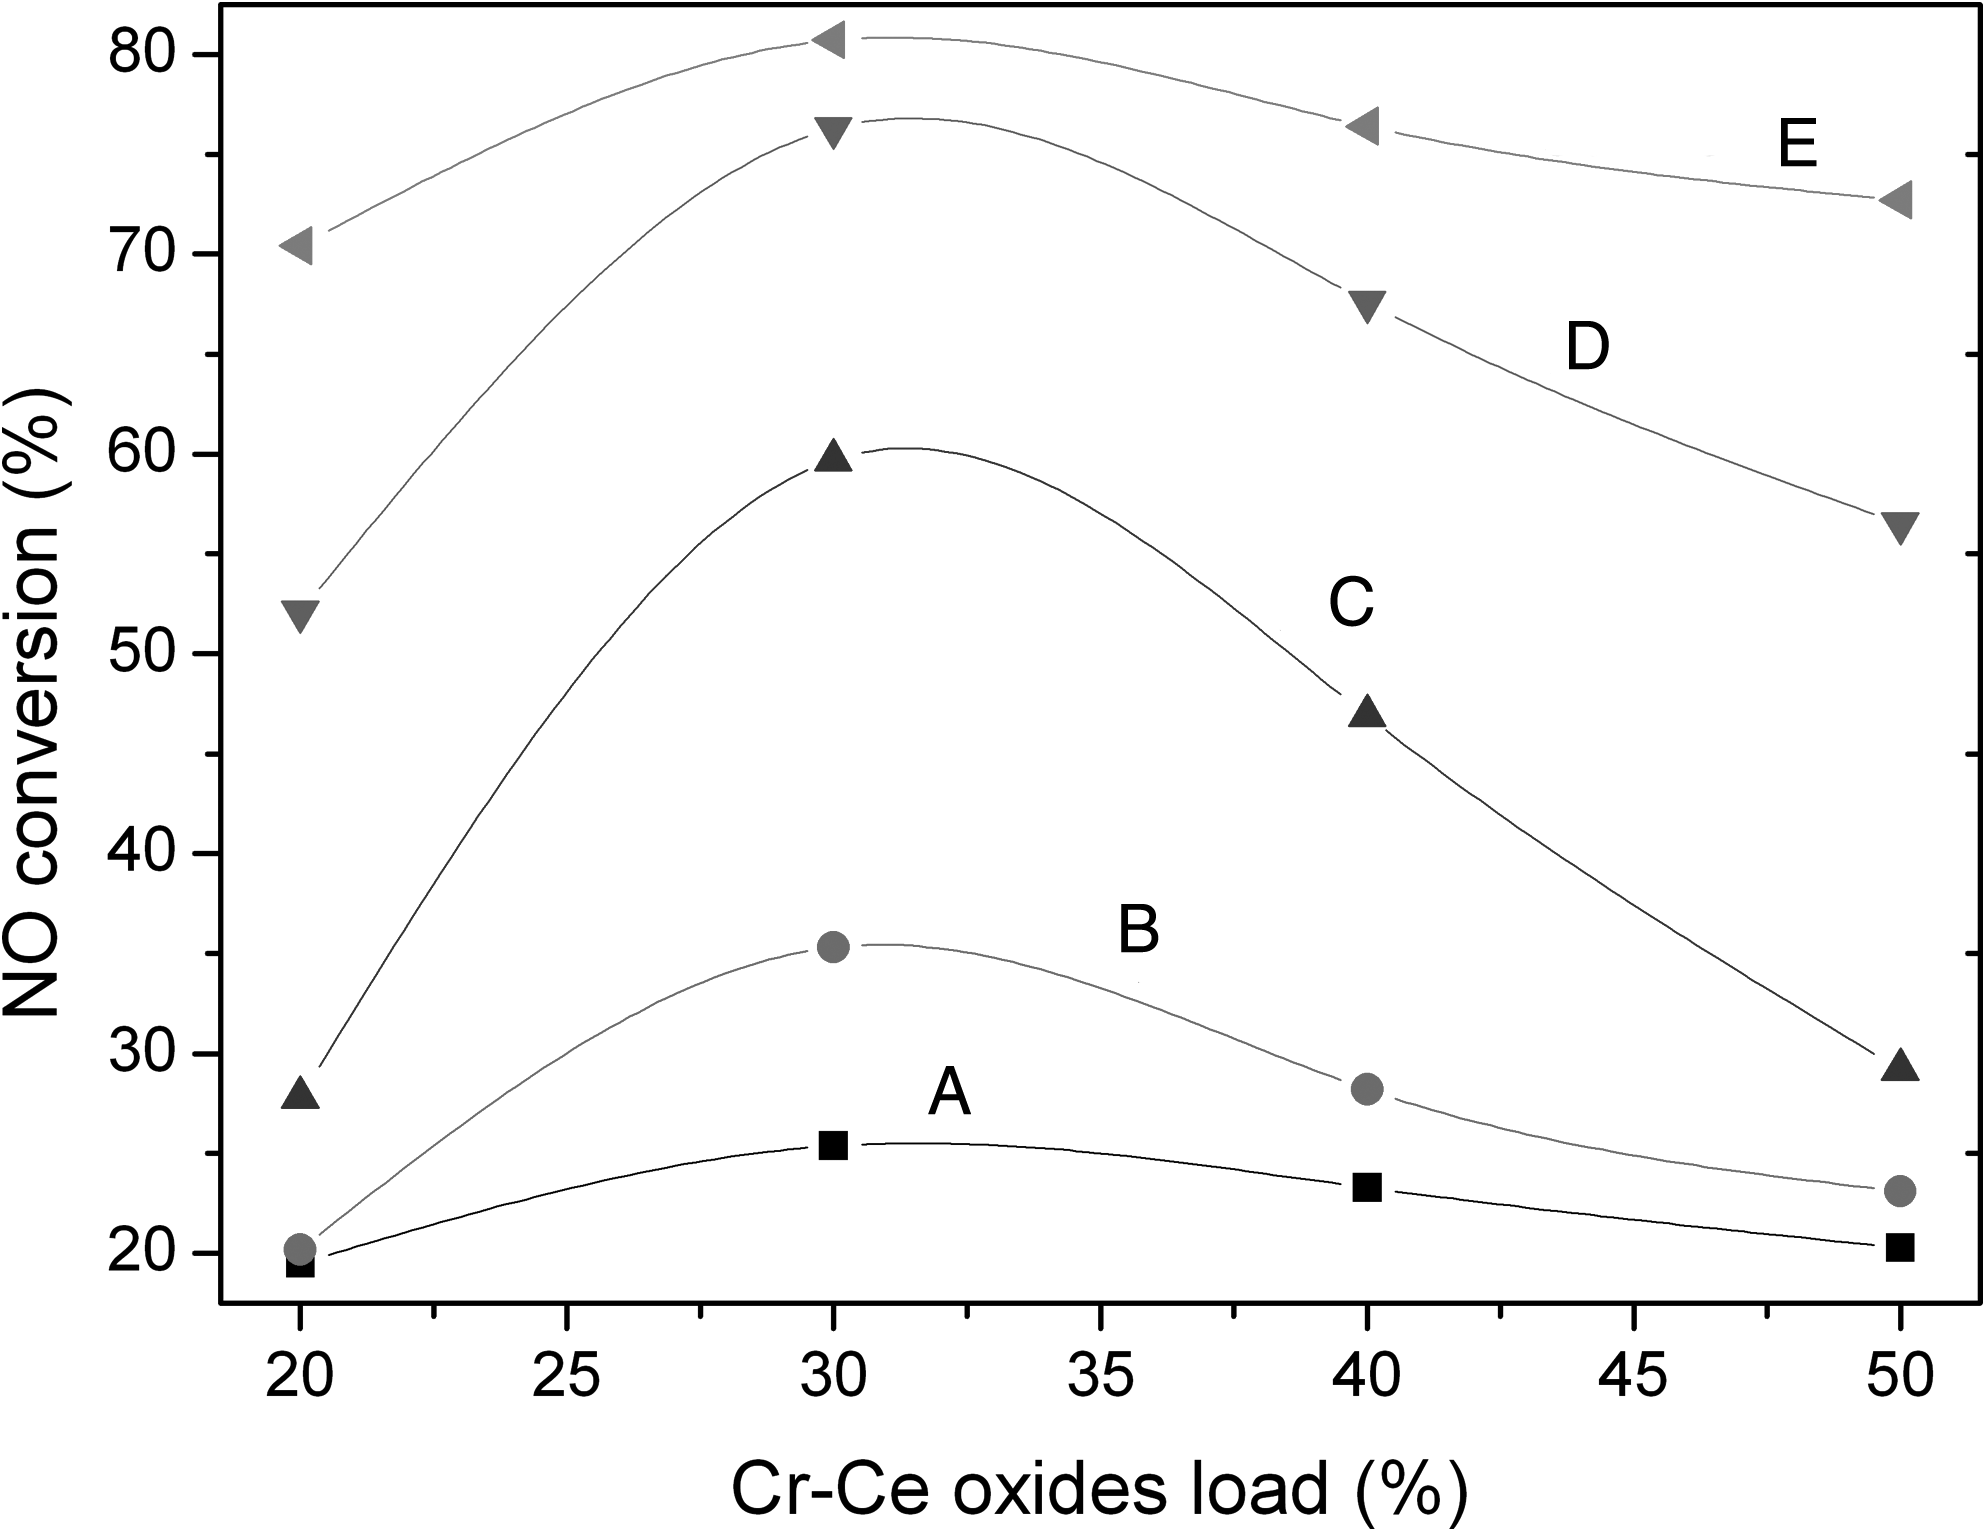
NO conversion over Cr-Ce/TiO2 catalysts with different total loads of Cr-Ce mixed oxides. Catalytic activity testing conditions: [NO]=873 mg/m3; [O2]=8%; balance N2; GHSV=10,000 h−1. Reaction temperatures: A, 150°C; B, 200°C; C, 250°C; D, 300°C; E, 330°C.
Effects of calcination temperatures on catalytic activity
Figure 5 shows the catalytic activities for NO oxidation over Cr2Ce1/TiO2 catalysts prepared at various calcination temperatures. The activity order for the resulting catalysts was 350°C>250°C>450°C>550°C. Although the XRD analyses showed that the active components in Cr-Ce/TiO2 catalysts calcined at both 250°C and 350°C were both amorphous and well dispersed, the catalyst calcined at 250°C was less active than that calcined at 350°C. This difference may be due to the incomplete decomposition of the nitrate precursors and failure of the formation of appropriate active phase structure at 250°C. When the calcination temperature was higher than 350°C, the catalytic activities decreased with increasing calcination temperatures. This change is consistent with the previous XRD and BET results showing that increased calcination temperatures result in the enlargement of crystal grains and the shrinkage of specific surface area. Therefore, the calcination temperature of 350°C is crucial for the activity of the Cr-Ce/TiO2 catalyst and seems to be a critical point affecting the dispersion and phase state of the active constituents on the TiO2 support.
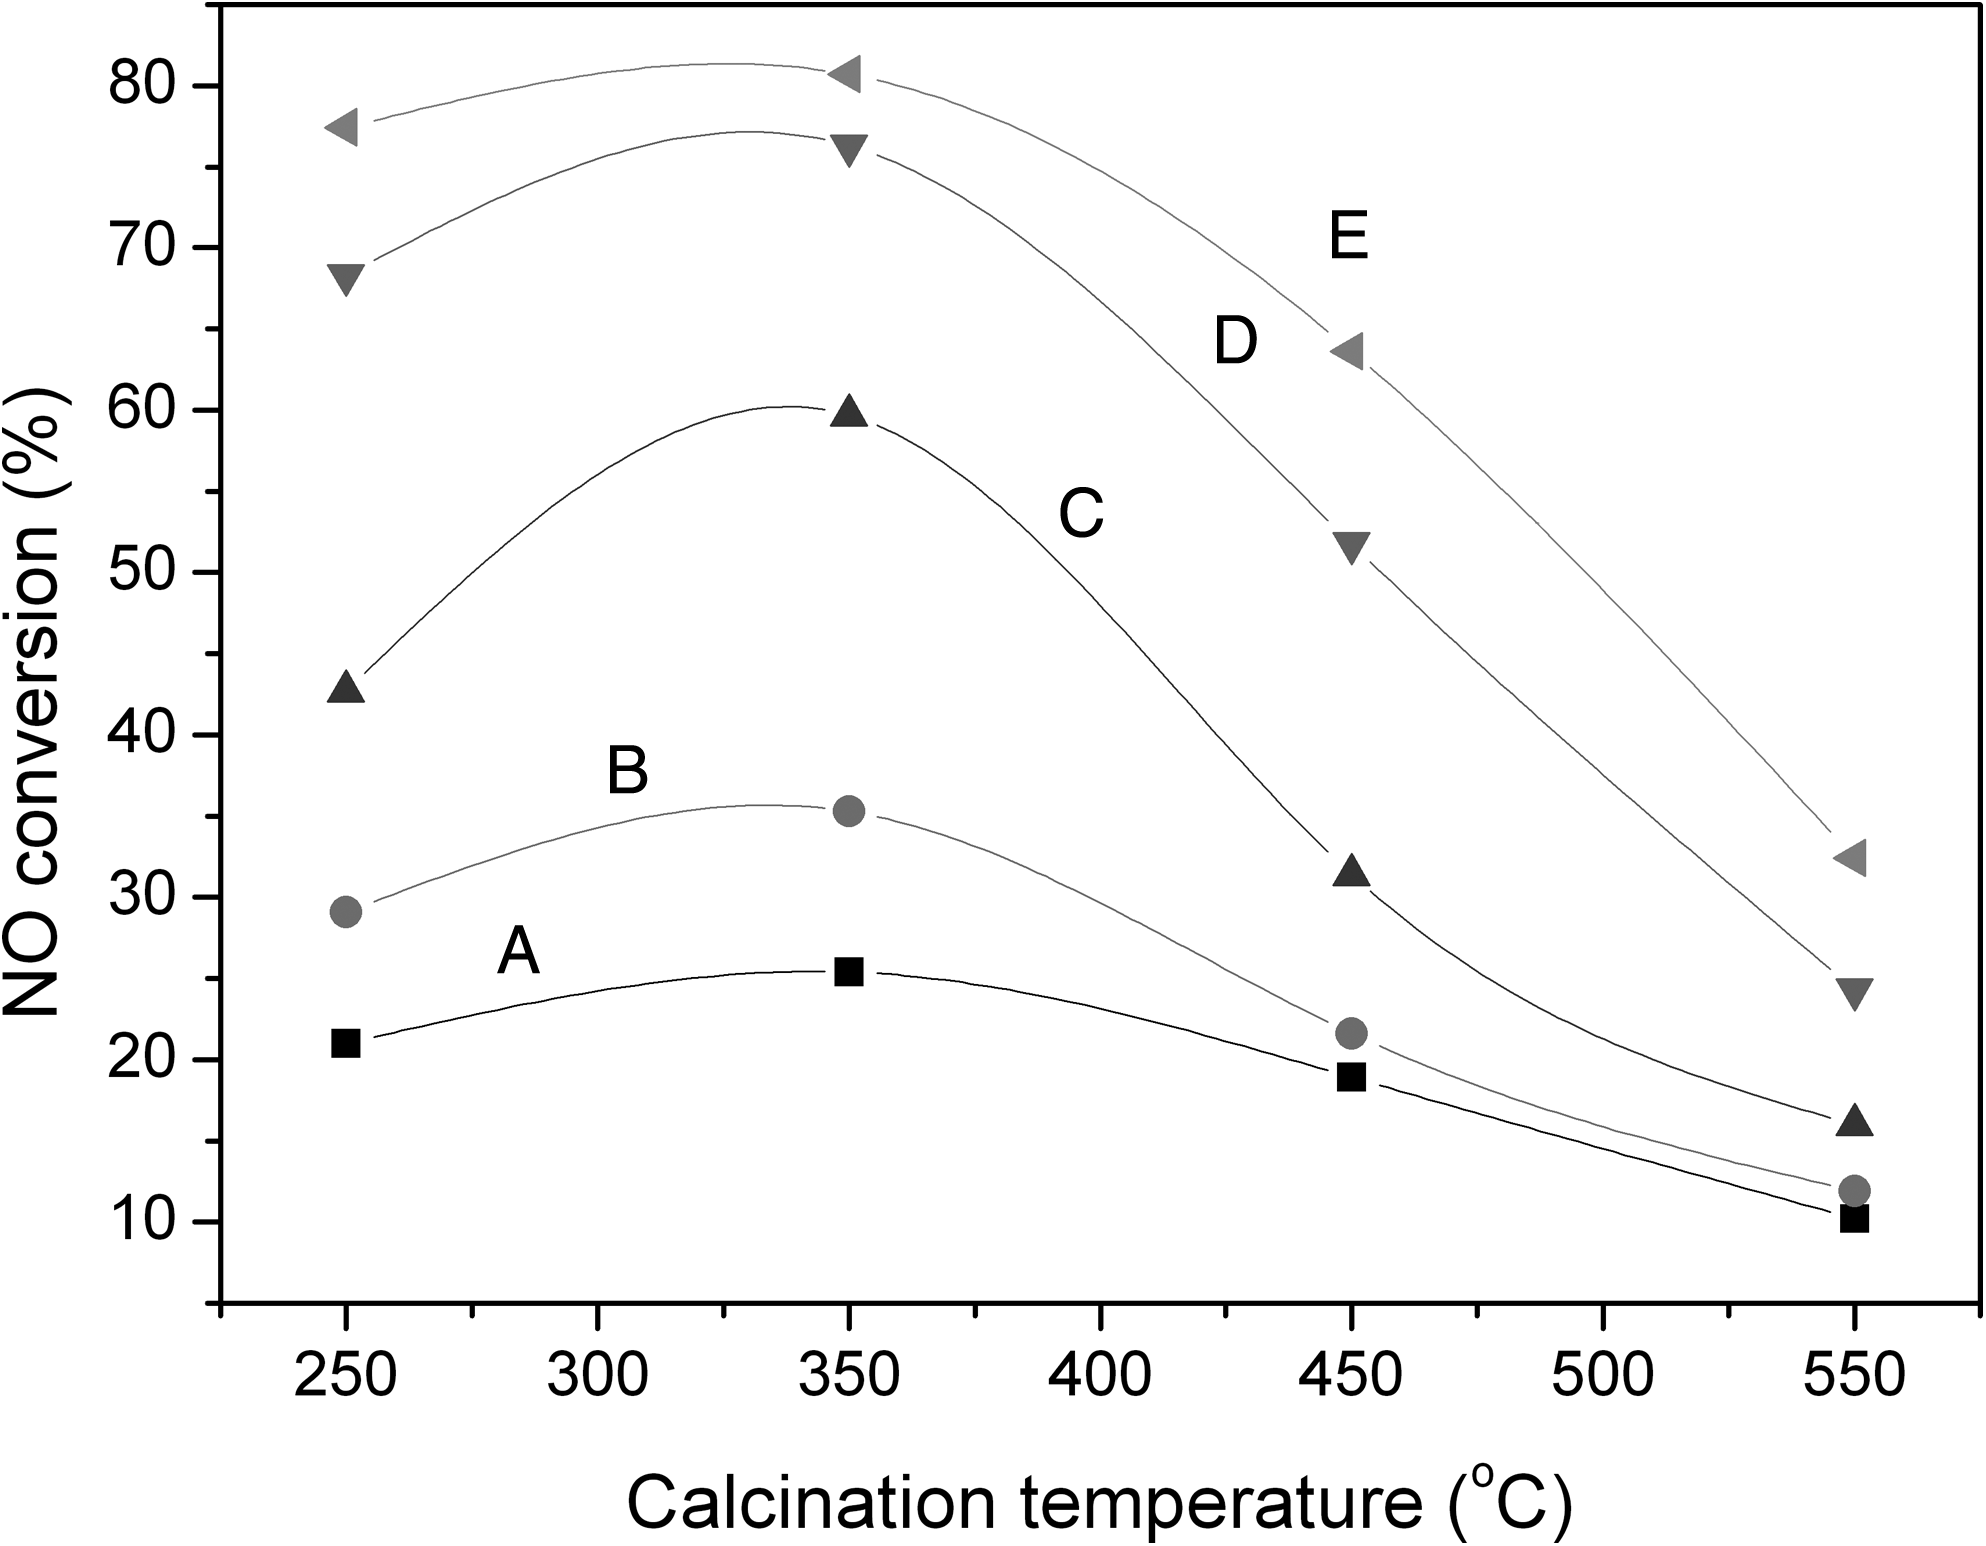
NO conversion on Cr2Ce1/TiO2 catalysts with 30 wt.% Cr-Ce oxide load calcined at different temperatures. Catalytic activity testing conditions: [NO]=873 mg/m3; [O2]=8%; balance N2; GHSV=10,000 h−1. Reaction temperatures: A, 150°C; B, 200°C; C, 250°C; D, 300°C; E, 330°C.
Effects of H2O on catalytic activity
Many studies have reported an inhibitory effect of H2O on the oxidation of NO to NO2 over various catalysts (Mochida et al., 1994; Mochida et al., 1997; Giles et al., 2000). Some causes were found: (1) NO reacts with O2 to form NO2, which is then is converted to HNO3 in the presence of water; (2) the dynamic adsorption of NO on a catalyst appears to be inhibited by H2O; and (3) NO2 adsorbed on catalysts is in the form of nitrate, which reacts with H2O to produce NO and NO2 per the following reaction: 2NO3−+H2O → 2OH−+NO+NO2+O2.
In this study, the effects of H2O on NO oxidation over a Cr-Ce/TiO2 (Cr2Ce1/TiO2) catalyst with 30 wt.% Cr-Ce loading and calcination temperature 350°C were investigated at reaction temperatures of 250°C and 330°C. After the NO oxidation system reached a stable state, water vapor was added to the feed gas to 10% (v/v) and the test process was started. As shown in Fig. 6, the NO conversions increased by 18% at 250°C and 5% at 330°C within 20 min after the addition of H2O and then decreased sharply. After 10 h, NO conversion remained 34% at 250°C and 64% at 330°C. During this time, the NO conversions decreased from 59.7% to 35.1% at 250°C and from 80.7% to 63.1% at 330°C. The NO conversion suffered more loss at lower reaction temperatures. After H2O was removed from the feed gas, the NO conversions first decreased and then recovered gradually to their original levels, thus indicating that the effects of H2O were reversible under the reaction conditions.

Effect of H2O on the activity of Cr2Ce1/TiO2 catalyst (calcined at 350°C). Catalytic activity testing conditions: [NO]=873 mg/m3; [O2]=8%; [H2O]=10%; balance N2; GHSV=10,000 h−1.
Fresh catalyst, spent catalyst isolated from H2O, and the spent catalysts with 10% H2O at reaction temperatures of 250°C and 330°C were analyzed with FTIR as shown in Fig. 7. In the spectra of all catalysts, broad peaks at 3,424 cm−1 belonging to O-H stretches were observed (Kantcheva and Vakkasoglu, 2004). The peaks near 1,635 and 1,628 cm−1 belonged to water at the surface of the sample. In the two spectra of the spent catalysts that reacted at 250°C (spectra B and C), the peak at 1,385 cm−1 showed nitrate species on the catalysts (Qi et al., 2004). A similar phenomenon was reported by Yung et al. (2007), who found nitrate species on the catalyst after NO or NO2 adsorption. In spectrum C, the peak at 1,385 cm−1 was weaker than in spectrum B. This suggests that addition of H2O in the feed gas results in the formation of more nitrate species on the surface of the catalyst. The addition of H2O promotes the following reaction: 3NO2+H2O → 2HNO3+NO; this is followed by the conversion of the active components to metal nitrate salts. Therefore, the effects of this reaction include not only the consumption of NO2 to yield NO, but also the change in catalyst composition. The spectrum of the spent catalyst that reacted at 330°C with H2O (spectrum A) was almost identical to the spectrum of the fresh catalyst (spectrum D), and the peak at 1,385 cm−1 vanished from the spectrum of 330°C (spectrum A). This similarity gives evidence that H2O had fewer effects on the catalyst that reacted at 350°C than that at 250°C. Obviously, the observation that increased temperatures reduced the effects of H2O on the catalysts agrees with the results of previous catalytic activity tests. After the removal of H2O from the feed gas, the activity of catalyst gradually recovered by the decomposition of nitrate on the surface of the catalysts.
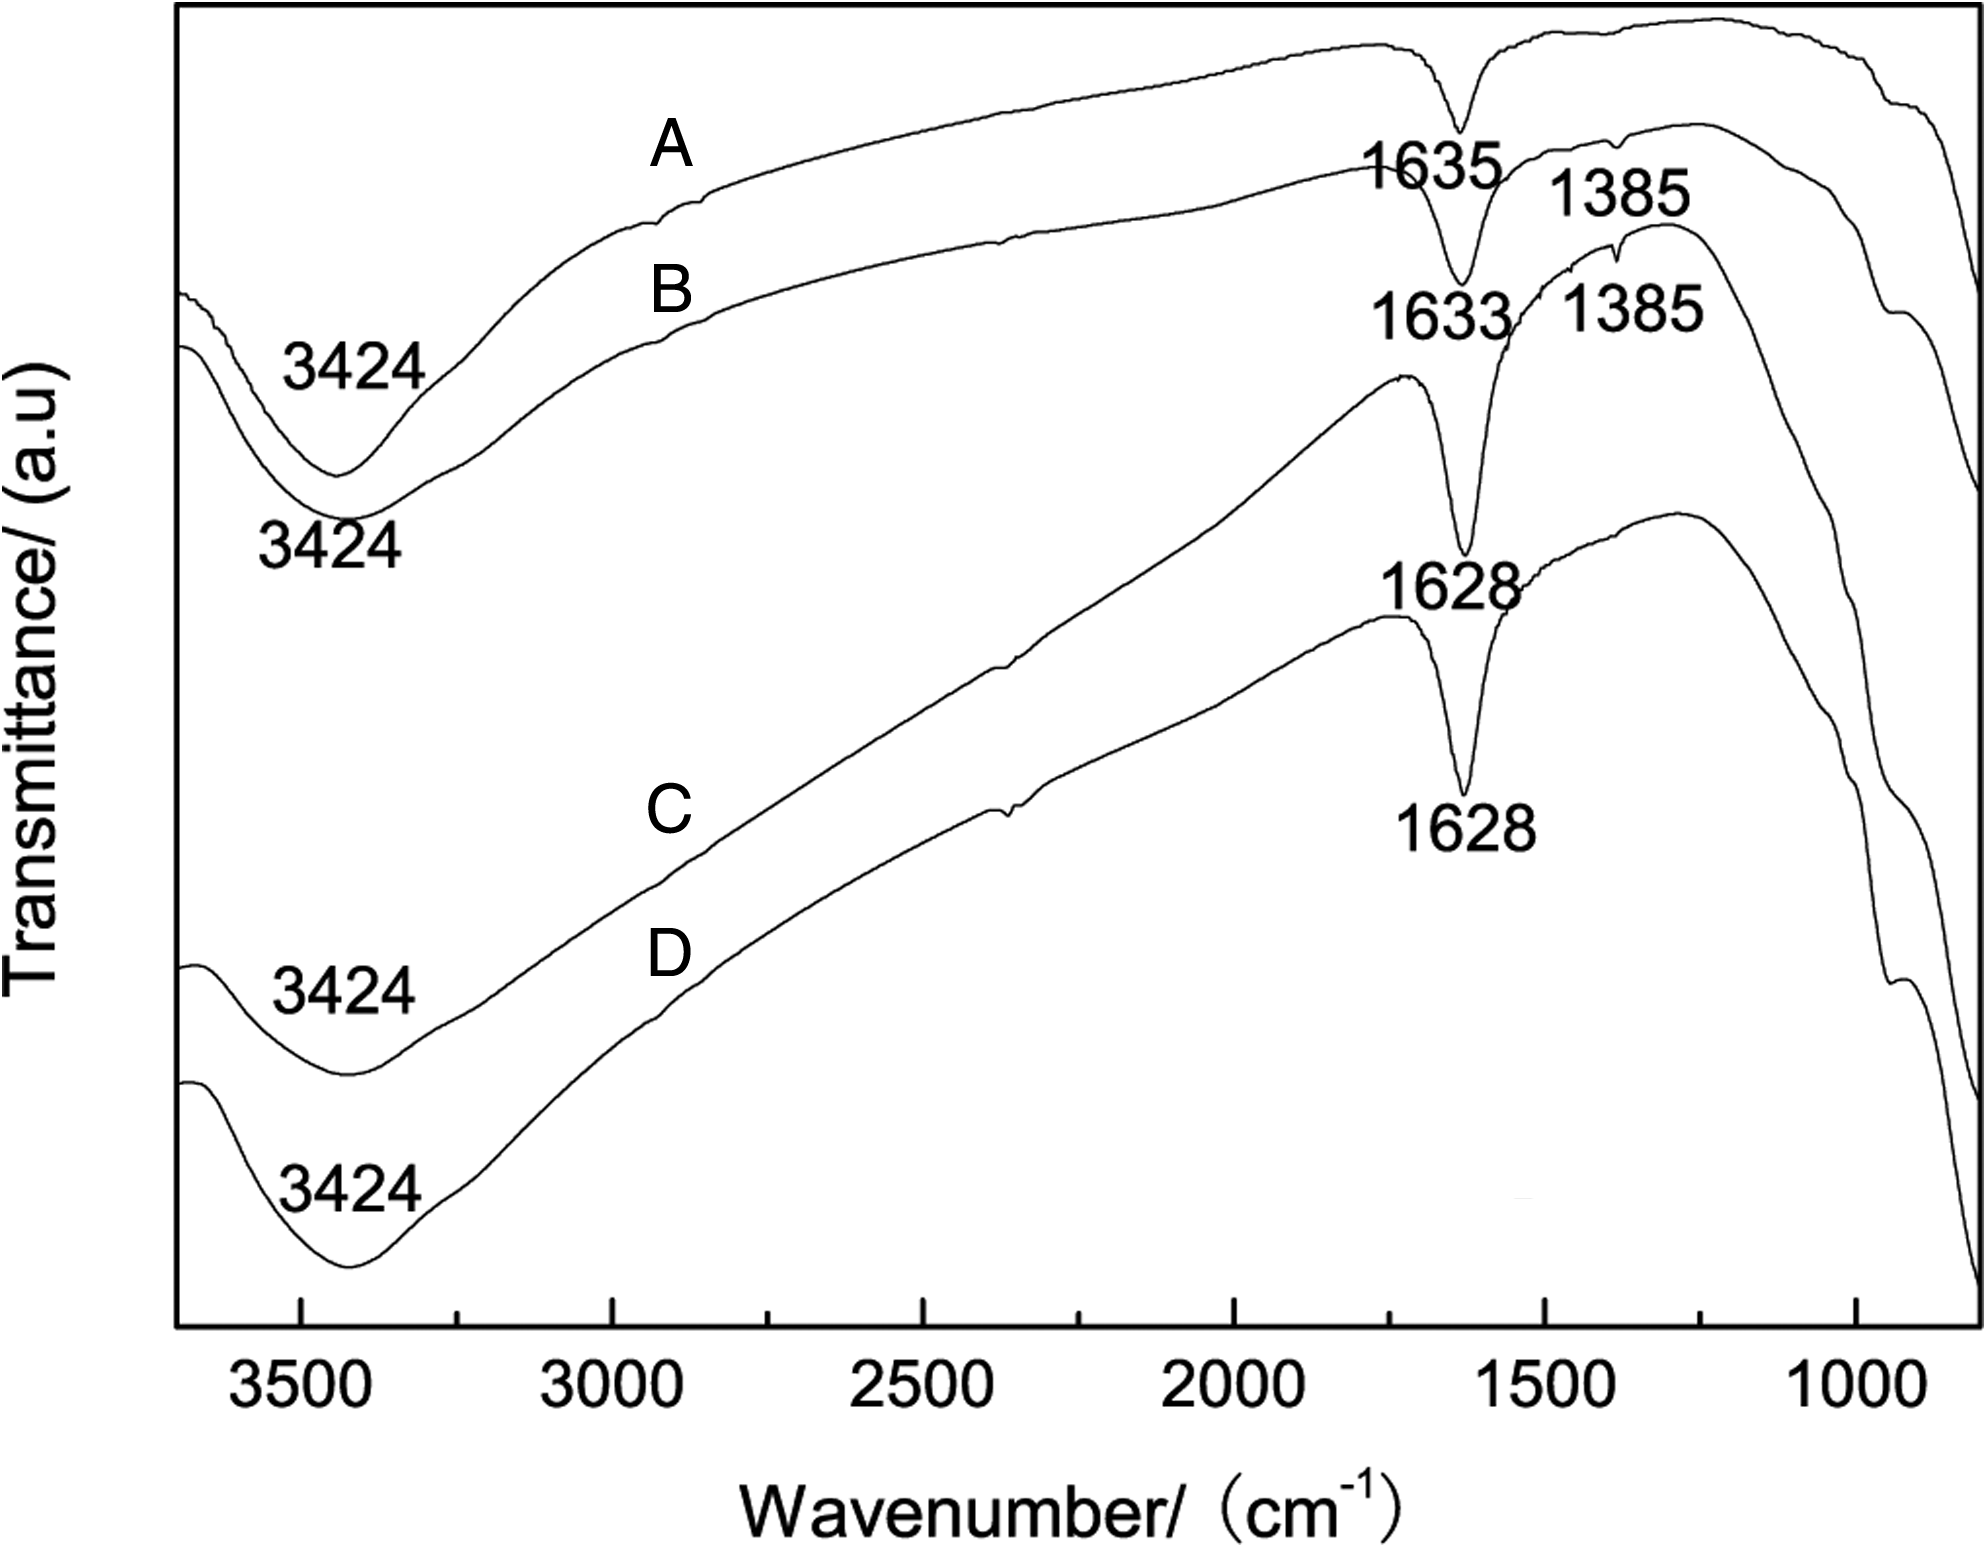
FTIR analyses of the fresh and spent catalysts. A, spent catalyst with H2O at 330°C; B, catalyst after activity test at 250°C; C, spent catalyst with H2O at 250°C; D, fresh catalyst.
Effects of H2O and SO2 on catalytic activity
Figure 8 shows the combined effects of H2O and SO2 on NO conversion over the Cr-Ce/TiO2 (Cr2Ce1/TiO2, 30 wt.% Cr-Ce loading, and calcination temperature 350°C) catalyst at 330°C. After 10% H2O and 798 mg/m3 SO2 were introduced into the feed gas, the NO conversion decreased slowly from 80.7% to about 62.4% in 10 h. After the removal of H2O and SO2, the NO conversion recovered to 71.6% in 2 h. A 6-h heat treatment at 350°C was given to the poisoned catalyst, and the subsequent activity test on the catalyst heat-treated at 330°C for 8 h showed an NO conversion of 78%. The conversion was stable although lower than the original NO conversion of 80.7%.
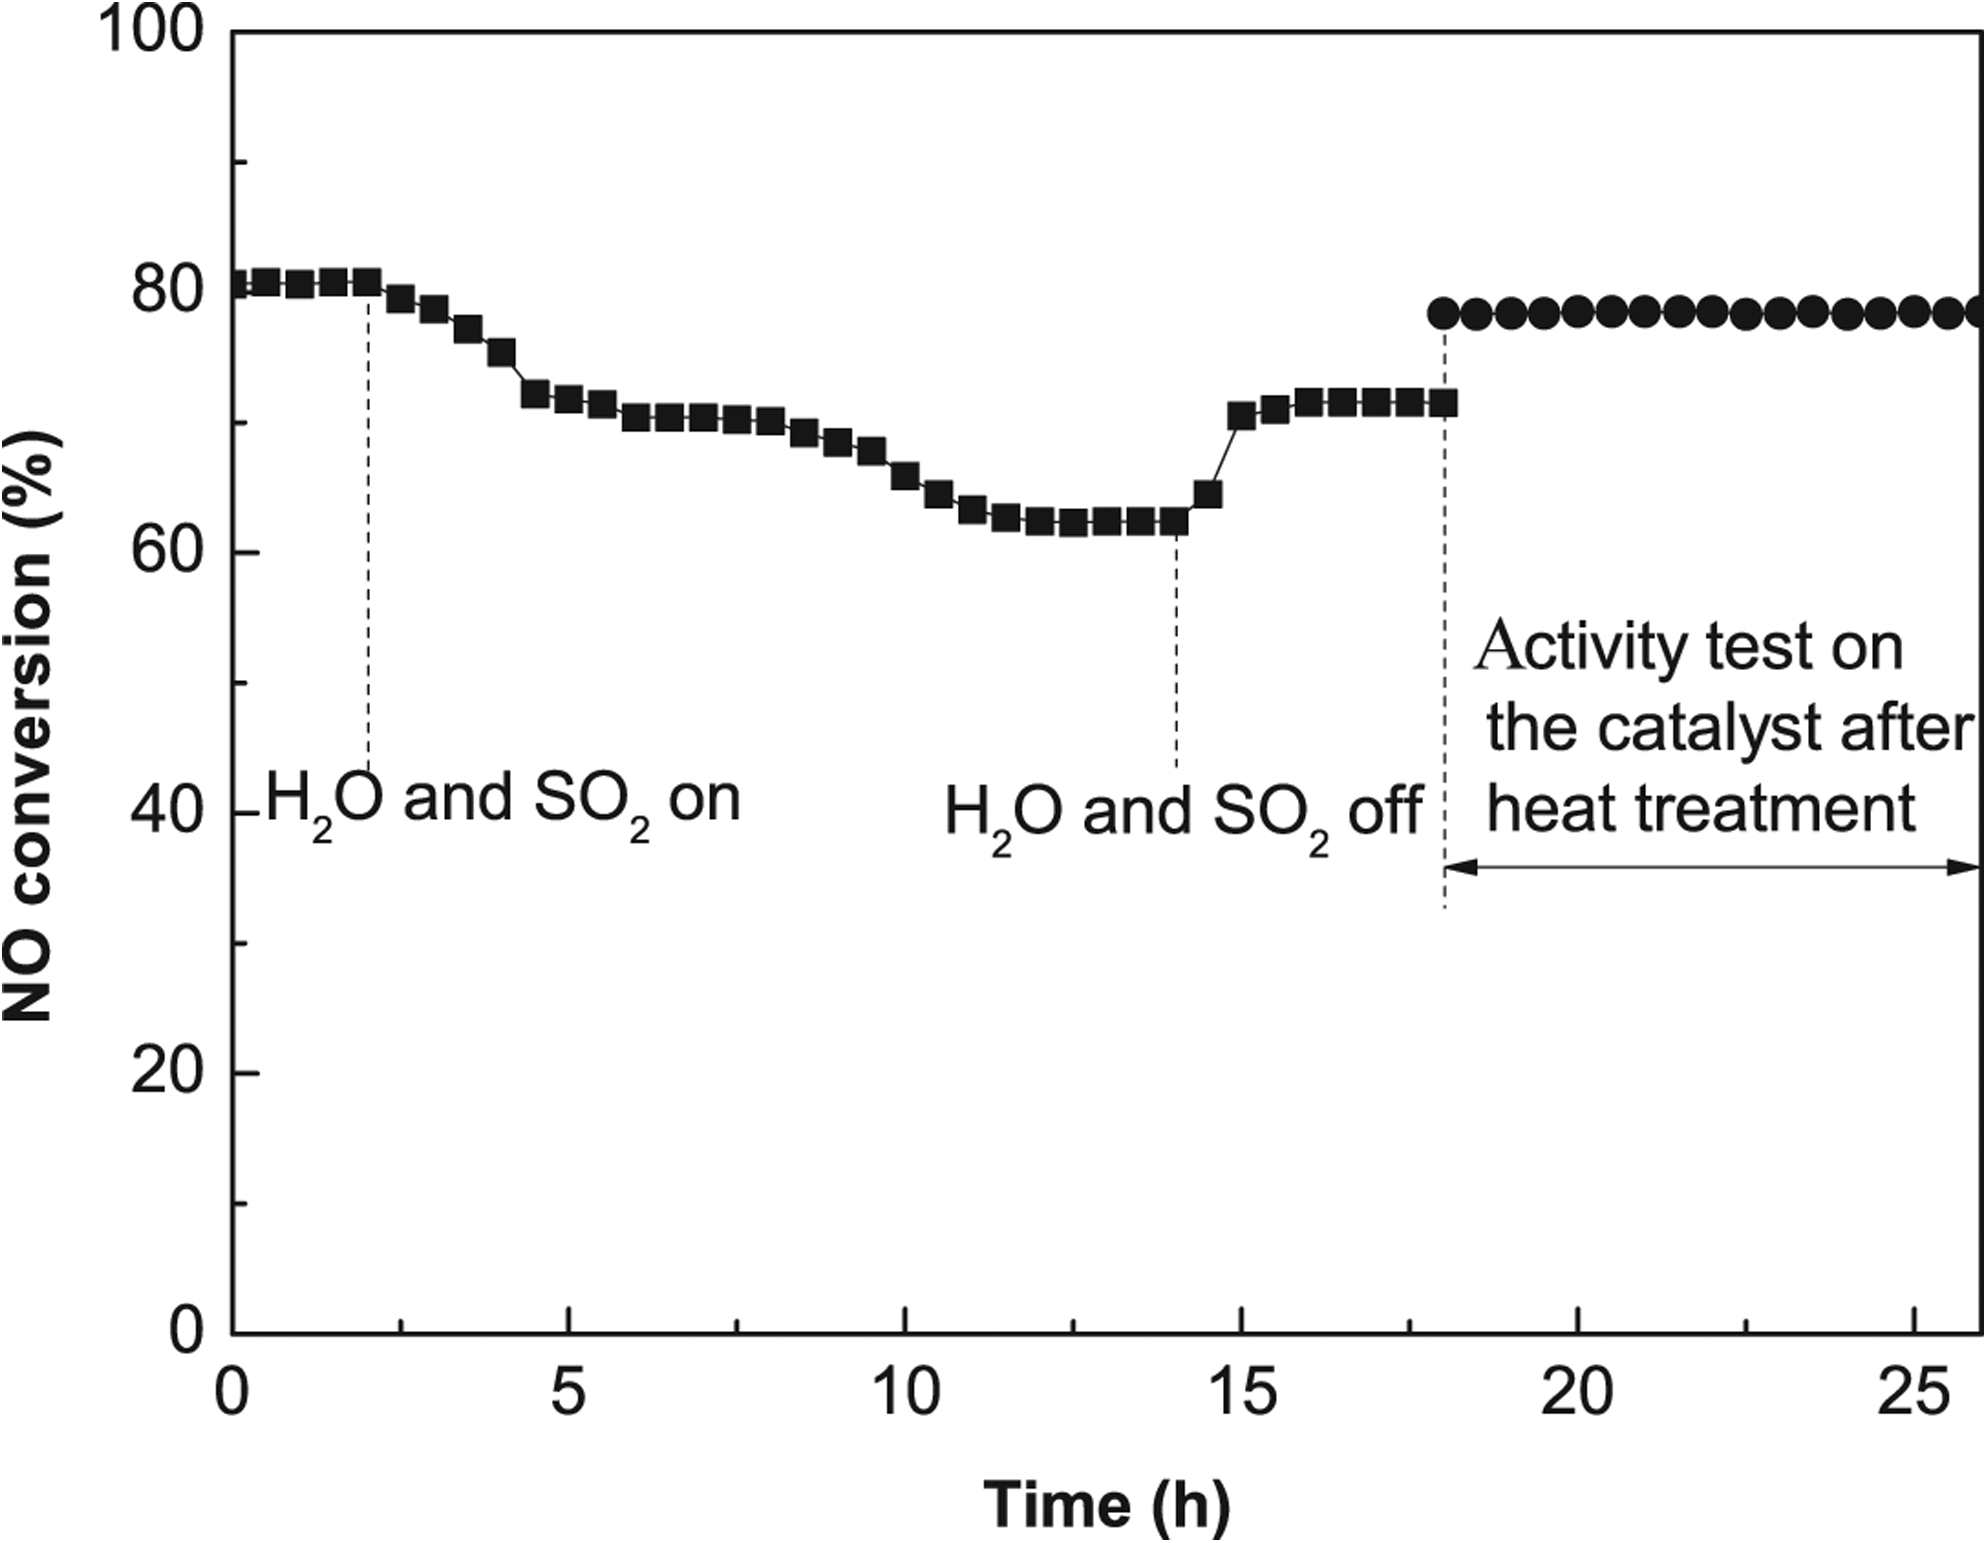
Activity test over Cr2Ce1/TiO2 (calcined at 350°C) with H2O and SO2. Catalyst activity testing conditions: [NO]=873 mg/m3; [O2]=8%; [H2O]=10%; [SO2]=798 mg/m3; balance N2; GHSV=10,000 h−1.
Figure 9 illustrates the FTIR analysis results of the fresh catalyst, the catalyst poisoned by H2O and SO2, and the recovered catalyst after a heat treatment at 350°C for 6 h. Compared with the spectrum of the fresh catalyst, the spectrum of the catalyst poisoned by H2O and SO2 showed two additional weak peaks at 1,123 and 937 cm−1, the characteristic stretch peaks of sulfates and sulfites, respectively (Pretsch et al., 1981). After a heat treatment at 350°C for 6 h, the peak at 1,123 cm−1 shifted to 1,130 cm−1 and the peak at 937 cm−1 disappeared. This change suggests that the sulfite on the catalyst surface decomposed from the heat treatment, whereas sulfate species were left because of the high decomposition temperature (>650°C) of sulfate. The partial decomposition of sulfite and sulfate on the surface of catalysts was likely one of the reasons that the poisoned catalyst did not completely recover its activity with the heat treatment. Therefore, deactivation of the catalyst by H2O and SO2 was not reversible under the reaction conditions, and the NO conversion was recovered uncompletely by removing the H2O and SO2 from the feed gas. The weakness of the sulfate and sulfite peaks in the spectra of the poisoned catalyst, together with the stable NO conversion rate of 62.4% in 10 h at the presence of H2O and SO2, implies that the Cr-Ce/TiO2 catalyst is considerably resistant to H2O and SO2 poisoning.

FTIR spectra of fresh, poisoned, and heat-treated catalysts. A, Fresh catalyst; B, Catalyst poisoned by SO2 and H2O; C, Catalyst after heat-treatment.
Conclusion
Compared with MPS and TS catalyst supports, TiO2 can integrate well with Cr-Ce mixed oxides to form a Cr-Ce/TiO2 catalyst with high NO oxidation activity. The optimal catalyst preparation conditions include the following: Cr:Ce=2:1, 30% total Cr-Ce mixed oxide load based on the mass of the support, and calcination at 350°C for 6 h. An NO conversion ratio of 80.7% at the maximum limitation by the thermodynamic equilibrium was obtained under the reaction conditions of 330°C reaction temperature, 873 mg/m3 NO, 8% O2, GHSV=10,000 h−1, and N2 balance with the resultant catalyst.
With 10% H2O in the feed gas, the catalyst activity was inhibited because of the nitrate species formed on the catalyst surface. The effects of added H2O diminished at increased reaction temperatures, and at temperatures above 330°C the effect of H2O was no longer noticeable. Under the combined influence of 10% H2O and 798 mg/m3 SO2 in the feed gas, the NO conversion over the Cr-Ce/TiO2 catalyst was stable around 62.4% for 10 h. A small amount of sulfate and sulfite was found on the surface of the poisoned catalyst. With heat treatment at 350°C for 6 h, the poisoned catalyst partially recovered its activity by decomposing adsorbed sulfite.
Footnotes
Acknowledgments
This work was supported by the Science Foundation for the Excellent Youth Scholars of Ministry of Education of China (20070010017) and the Foundation for Key Discipline Construction of Beijing.
Author Disclosure Statement
The authors declare that no competing financial interests exist.