
Abstract
Abstract
The presence of nonpoint source (NPS) pollution due to agricultural activities at the Three Gorges Reservoir Area in China has been of concern to the public in recent years. Due to the extent of the polluted area and seasonal dispersion mode, sediments have greatly impacted the water quality in the area. Generation and formation of adsorbed NPS pollution involves great uncertainty, which makes monitoring and controlling pollution very difficult. Rainfall erosivity factors, which are calculated by surface rainfall data from watershed hydrological simulation, and sediment delivery ratios were both selected and determined as the dynamic factors, whereas blind number theory was introduced and used to describe and deal with the factors' uncertainty of the Revised Universal Soil Loss Equation (RUSLE). Through the integration among blind number theory, dynamic factors, and pollution load model, parameter uncertainty and model dynamics could be better understood in the new and comprehensive pollution load model using GIS technology. Results indicated that rainfall runoff and sediment delivery ratio had significantly affected the uncertainty of final adsorbed NPS pollution load simulation results; the magnitude of adsorbed nitrogen and phosphorus loads from different land use types in descending order in turn was glebe, grassland, paddy fields, forestland, and urban land. This work provides a theoretical basis for control and management of soil loss and NPS pollution in the Three Gorges Reservoir Area, and these data are also useful in evaluating potential soil loss and NPS pollution loads in the watershed.
Introduction
The essential of the adsorbed NPS pollution is soil erosion. Soil erosion is considered an important process in NPS pollution in many terrestrial environments (Ning et al., 2006). Soil erosion is a natural process in which earth materials are entrained and transported across a given surface (Nyakatawa et al., 2001; Baskan et al., 2010). Soil erosion is a critical environmental problem as it leads to removal of fertile topsoil, which is crucial for agriculture, and increased levels of sedimentation in the rivers, causing water eutrophication. Other problems caused by soil erosion include loss of soil nutrients, declining crop yields, and reduction in soil productivity (Renard et al., 1997). Moreover, soil moved by erosion carries nutrients, pesticides, and other harmful farm chemicals into rivers, streams, and ground water resources (Nyakatawa et al., 2001). In China, soil erosion affects an area about 3.6 × 10⁶ km2, covering nearly 37% of the total land area of the country (Wang et al., 2009). Soil erosion by rainfall and its associated detrimental effects on soil productivity is an important problem over the greater part of China, and soil erosion is a growing problem in hilly cropland in southern China. Soil erosion not only decreases agricultural productivity, but also reduces the water availability (Veihe et al., 2003; Kouli et al., 2009). In the current study, an effort to predict potential soil loss has been conducted. Many erosion and water quality models have been developed; among them, Universal Soil Loss Equation (USLE) (Wischmeier and Smith, 1978) and its revised version, the Revised Universal Soil Loss Equation (RUSLE) (Renard et al., 1997), are the most widely used models for estimating long-term soil loss though it has several shortcomings. Soil loss is commonly predicted using the RUSLE consisting of rainfall–runoff erosivity factor, soil erodibility factor, slope steepness and length factor, land cover management factor, and support practice factor (Shen et al., 2010), whereas RUSLE has widely been used for predicting annual average soil loss for specific areas (Chhabra et al., 2010). Because of the spatial and temporal variability of multiple factors and their interactions, uncertainty of soil erosion needs to be incorporated into the modeling; for these reasons, modeling soil loss is very complicated. It is important to know both the estimates and the uncertainties associated with them when predicting soil loss at unknown locations, so the effect of the uncertainty on NPS pollution simulation models has recently been of interest in the NPS pollution field (Sohrabi et al., 2002). In general, the uncertainty of soil erosion model consists of three parts: structural uncertainty, input data uncertainty, and parameter uncertainty (Lindenschmidt et al., 2007). While the uncertainty of model parameters arises because parameters attained through empirical estimation and optimization of observed values cannot ensure the precision and reliability of the predicted results (Beck, 1987). In our study, parameters of rainfall erosivity factor and sediment delivery ratio (SDR) in the equation were selected and determined as the dynamic uncertainty factors to conduct the model simulation.
Due to Xiaojiang River's special geographic location and water system situation, it is of great importance to study the uncertainty parameter that affects the uncertainty of pollution load, and to provide the necessary references for investigating the total NPS pollution load of the entire Three Gorges Reservoir Area. Many methods are available for the study of parameter uncertainty, such as sensitivity analysis, the bootstrap method, the discrete Bayes method, maximum likelihood, the neural network method, and the fuzzy mathematic method. These methods can identify parameters that do or do not significantly influence model simulations of real-world observations for specific catchments (Shen et al., 2008). Modeling provides a quantitative and consistent approach for estimating the soil erosion and sediment yield under a wide range of conditions (Huang et al., 2010). Therefore, a modified and revised form of the USLE was incorporated as a core module of soil erosion modeling. In the modification, a newly integrated methodology was developed for quantification of adsorbed NPS pollution of the watershed, whereas the rainfall erosivity and SDR were introduced into the RUSLE as dynamic factors. First, changes in precipitation will induce changes in the erosive power of rainfall and hence changes in soil erosion rates (Zhang et al., 2010). Rainfall erosivity changes will have important impacts on runoff and adsorbed NPS pollution. Rainfall erosivity factor, unlike other natural factors, such as relief or soil characteristics, is of paramount importance among natural factors affecting soil erosion, and is not amenable to human modification (Angulo-Martínez and Beguería, 2009). It represents a natural environmental constraint that limits and conditions land use and management. Therefore, estimating rainfall erosivity is central to assessment of soil erosion risk (Wang et al., 2002). Second, SDR is also a very important factor affecting soil loss.
According to the objective stochastic and subjective uncertainty of the rainfall factor, soil erosion factor, terrain factor, vegetation cover management factor, water and soil conservation factor, and SDR factor of modified USLE, the aim of this study was thus to identify main dynamic parameters of the rainfall erosivity factor and SDR and to understand their uncertainty to soil erosion and adsorbed NPS pollution load in Xiaojiang River Watershed using the integrated model based on blind number theory (Liu et al., 1999). The findings of the study are to provide a theoretical basis for proposing pragmatic suggestions and control practices for dealing with adsorbed NPS pollution in the Xiaojiang River Watershed. Besides, the aim is also to provide a scientific method for simulating dynamic annual adsorbed NPS pollution load in certain typical watershed.
Materials and Methods
Study area
Xiaojiang, with a basin area of almost 5,276 km2 and a length of 182.4 km, is located in the central part of the Three Gorges Reservoir Area. It originates in Zhong-gu village, Kai-xian, Chongqing Municipality. Xiaojiang Watershed lies in eastern longitude 107°42′–108°54′ and northern latitude 30°41′–31°42′, and it is also the largest tributary in the central section of north shore in the Three Gorges Reservoir Area. It gathers into the Yangtze River through Peng-xi River, the average gradient of riverway is 0.125%, Dong-he River is the source of Xiaojiang, and the main tributaries are Nan-he River, Pu-li River, and Tao-xi River (Fig. 1). The terrain is high in north and low in south, and the average gradient of watershed is about 8.72%. The watershed is in the sub-tropical monsoon climate zone, the climate of the watershed is mild and humid, the average temperature is 18.6°C, the average rainfall is 1100–1500 mm, and the average runoff for 36 years is 3.58 billion m3 from 1962 to 1998. Most of the watershed is within the border of Kai-xian and Yun-yang County, Chong-qing, and the average population density is 369 people/km2. The watershed is mostly hilly or non-hilly purple soil, with some paddy soil as well.
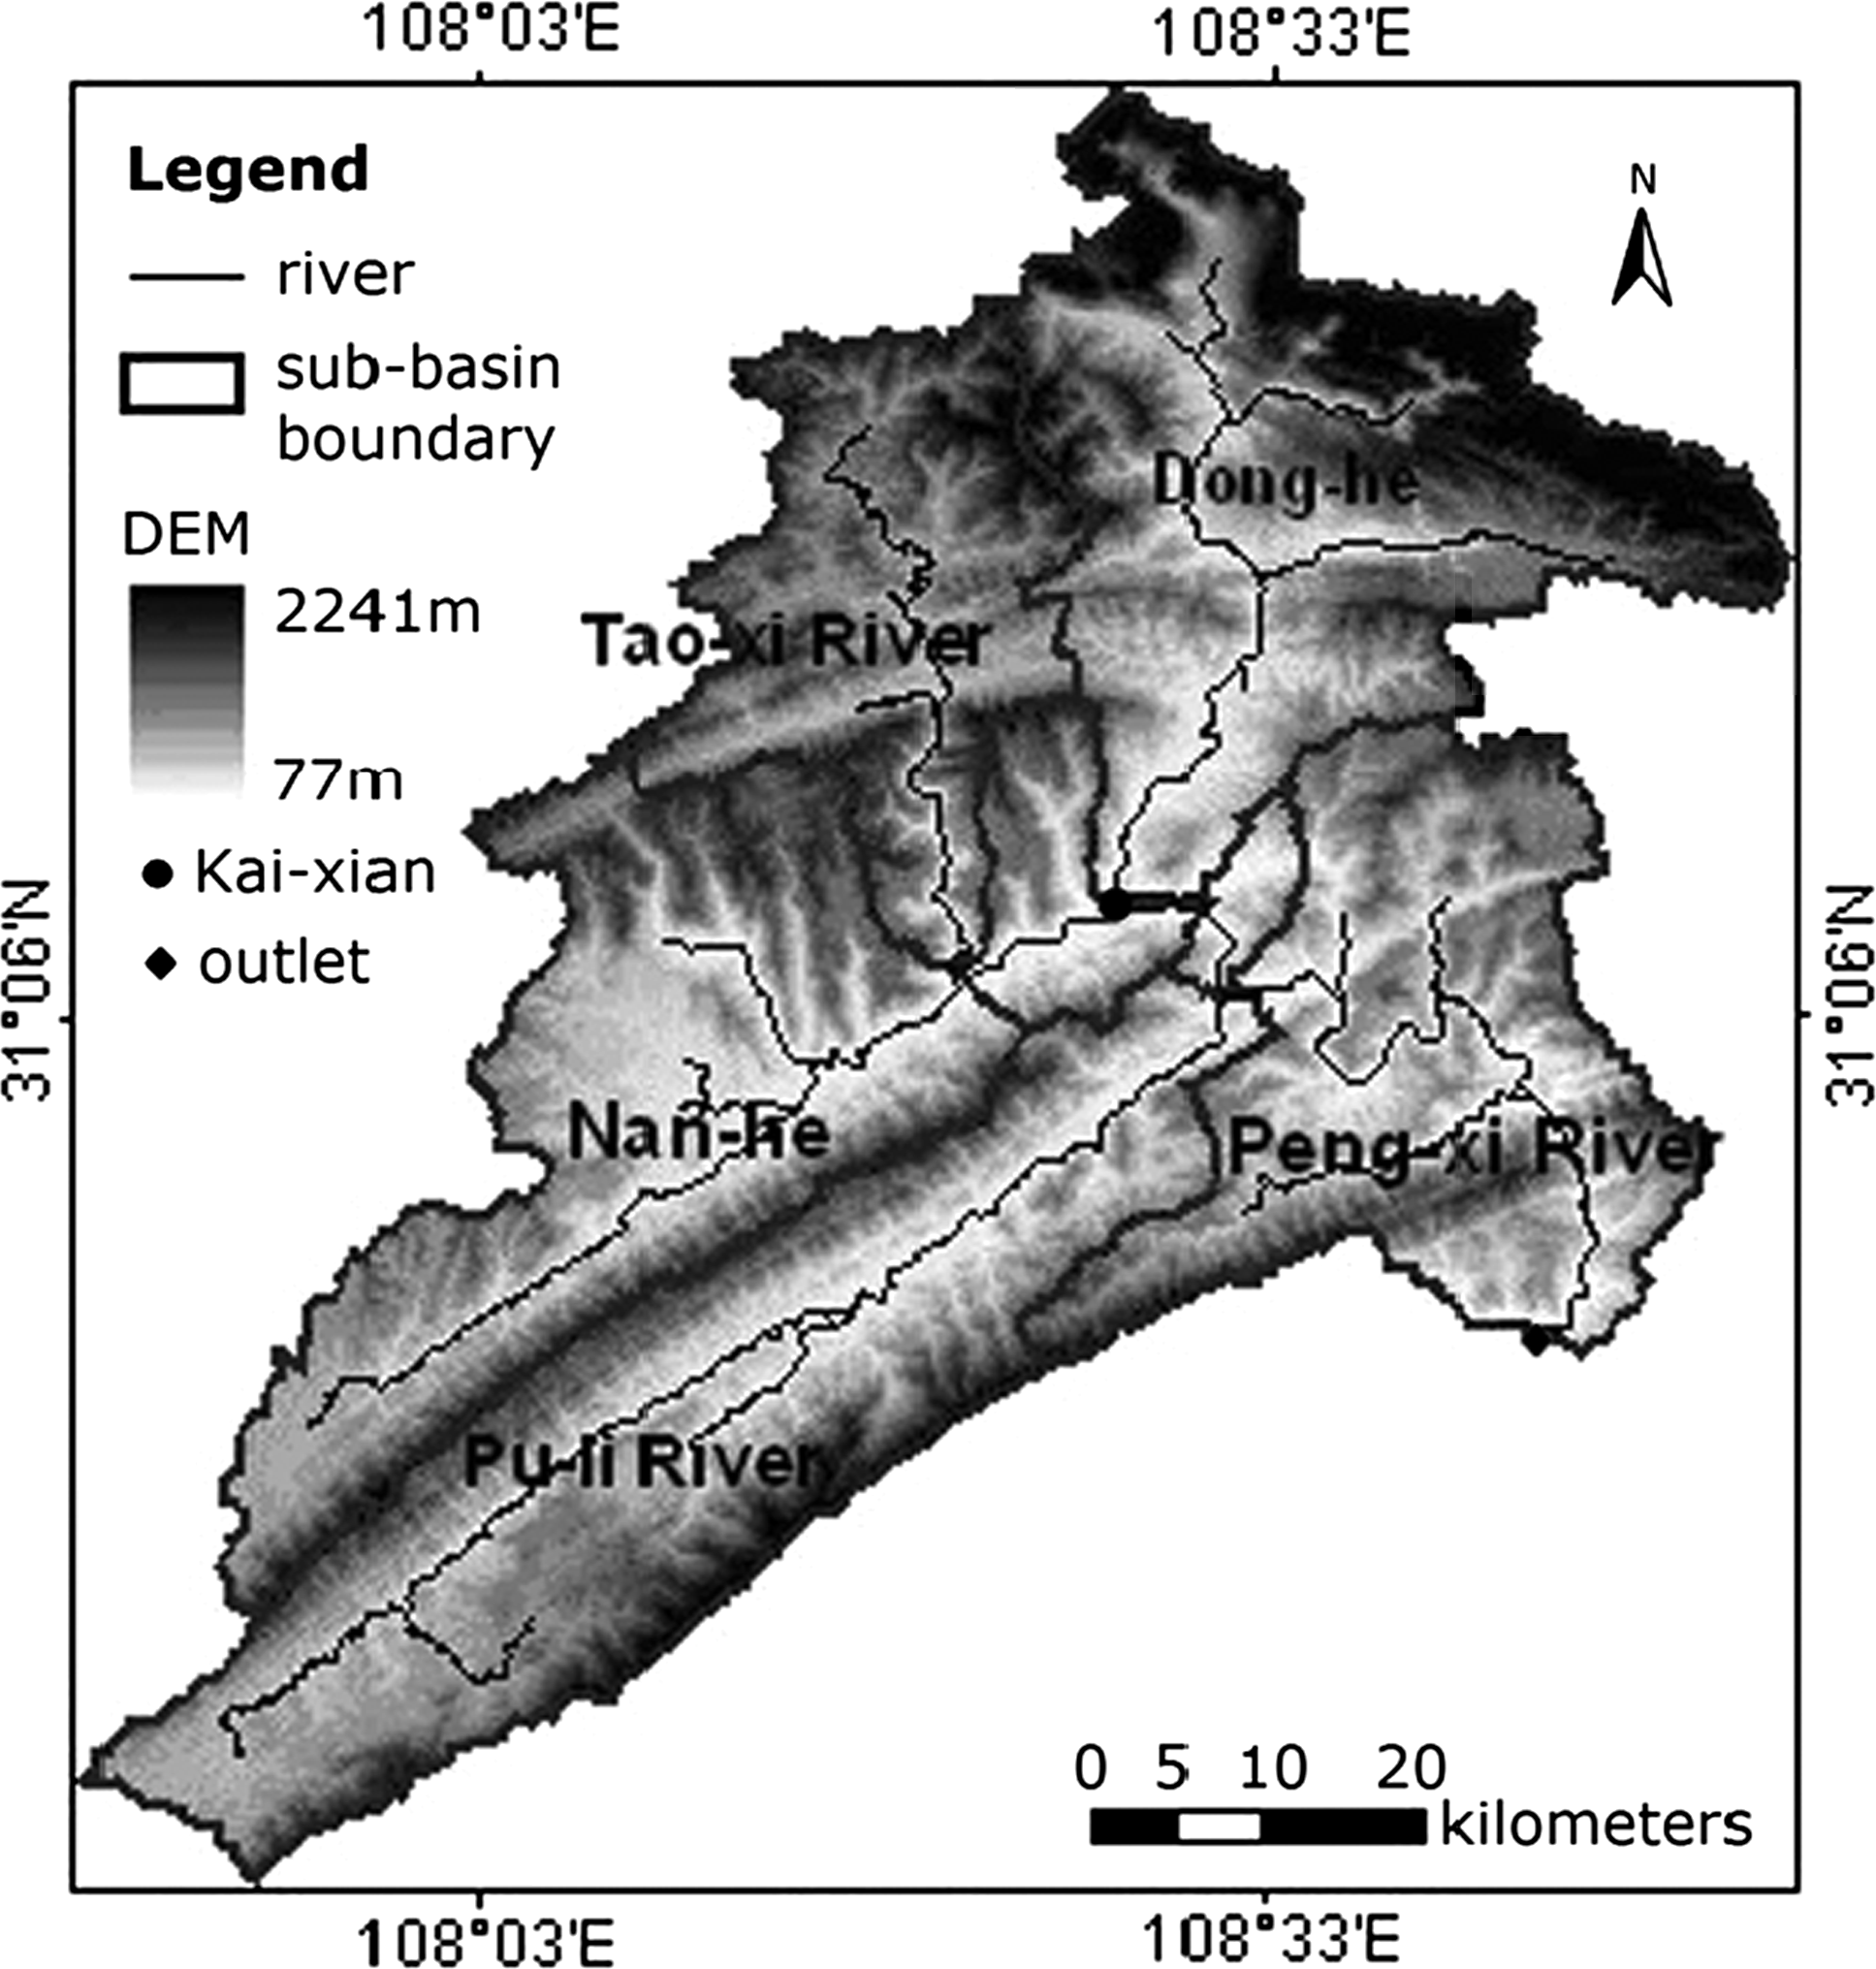
Digital elevation model (DEM), topography, river of Xiaojiang Watershed.
Basic data sources
Using GIS and statistical techniques, it was possible to derive an environmental database for the Xiaojiang Watershed as follows: DEM (Fig. 1), administrative divisions (Fig. 2), and re-classified land use types (Fig. 3 and Table 1).
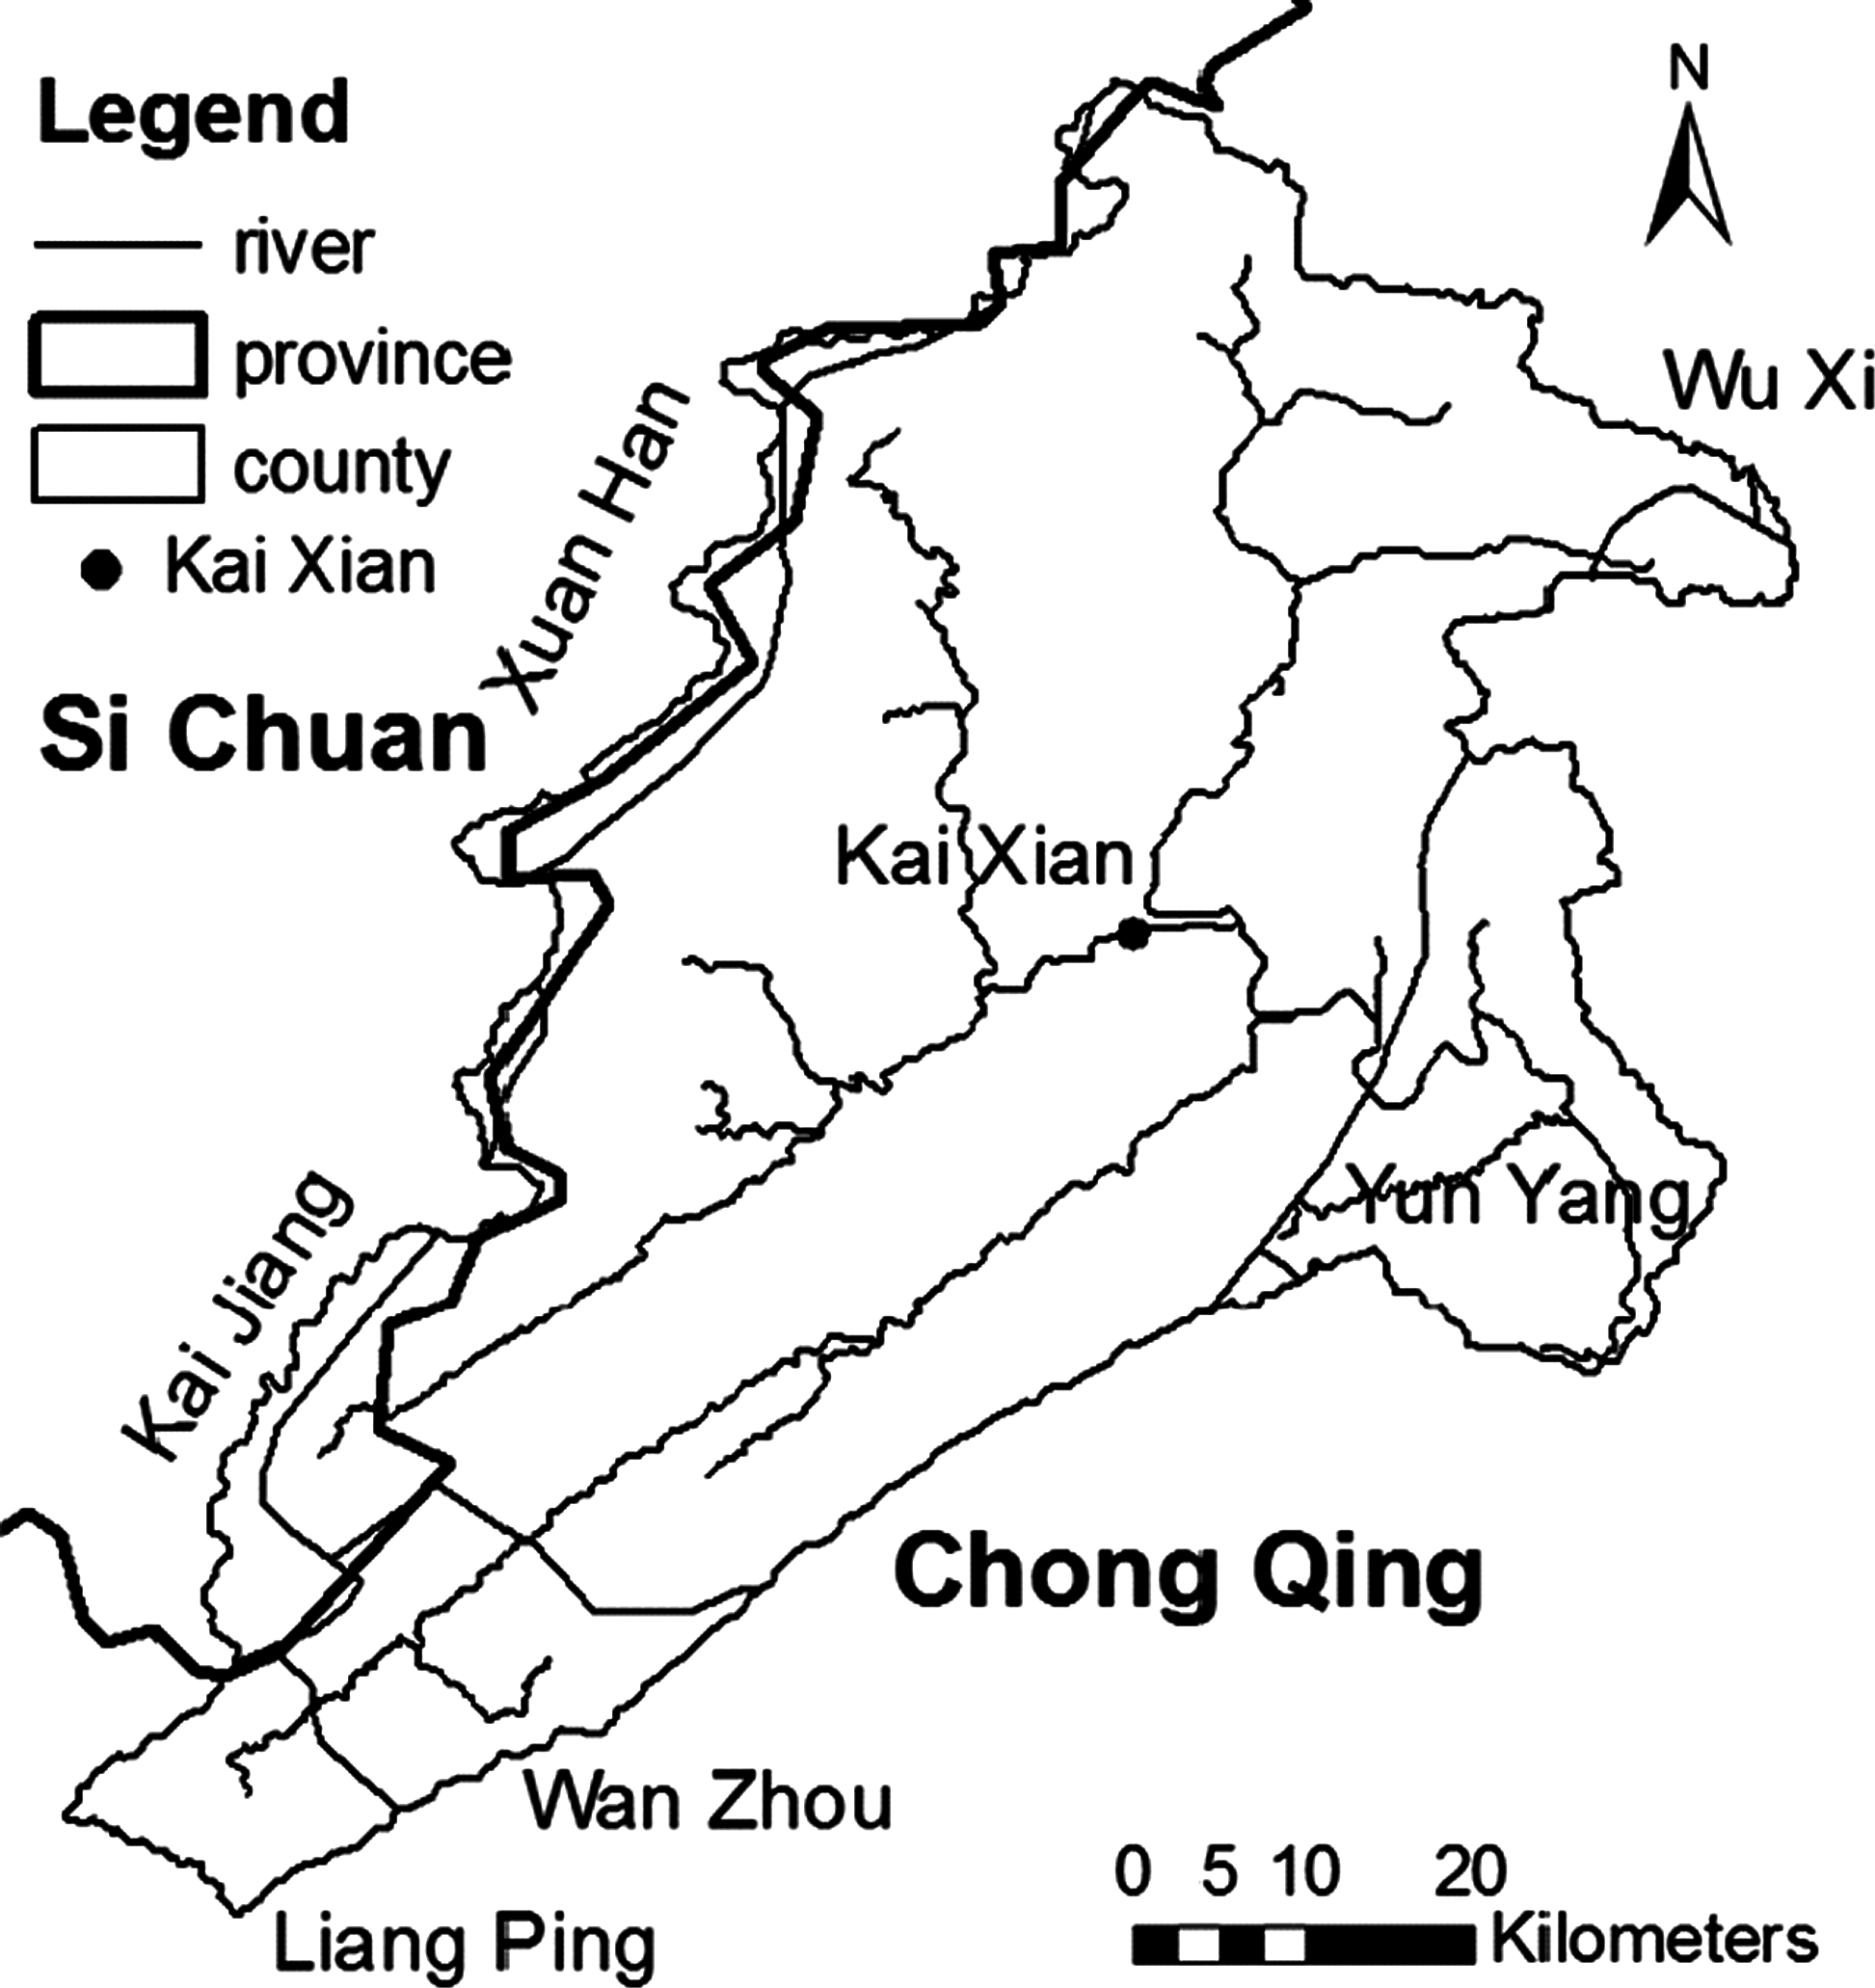
Administration divisions of Xiaojiang Watershed.
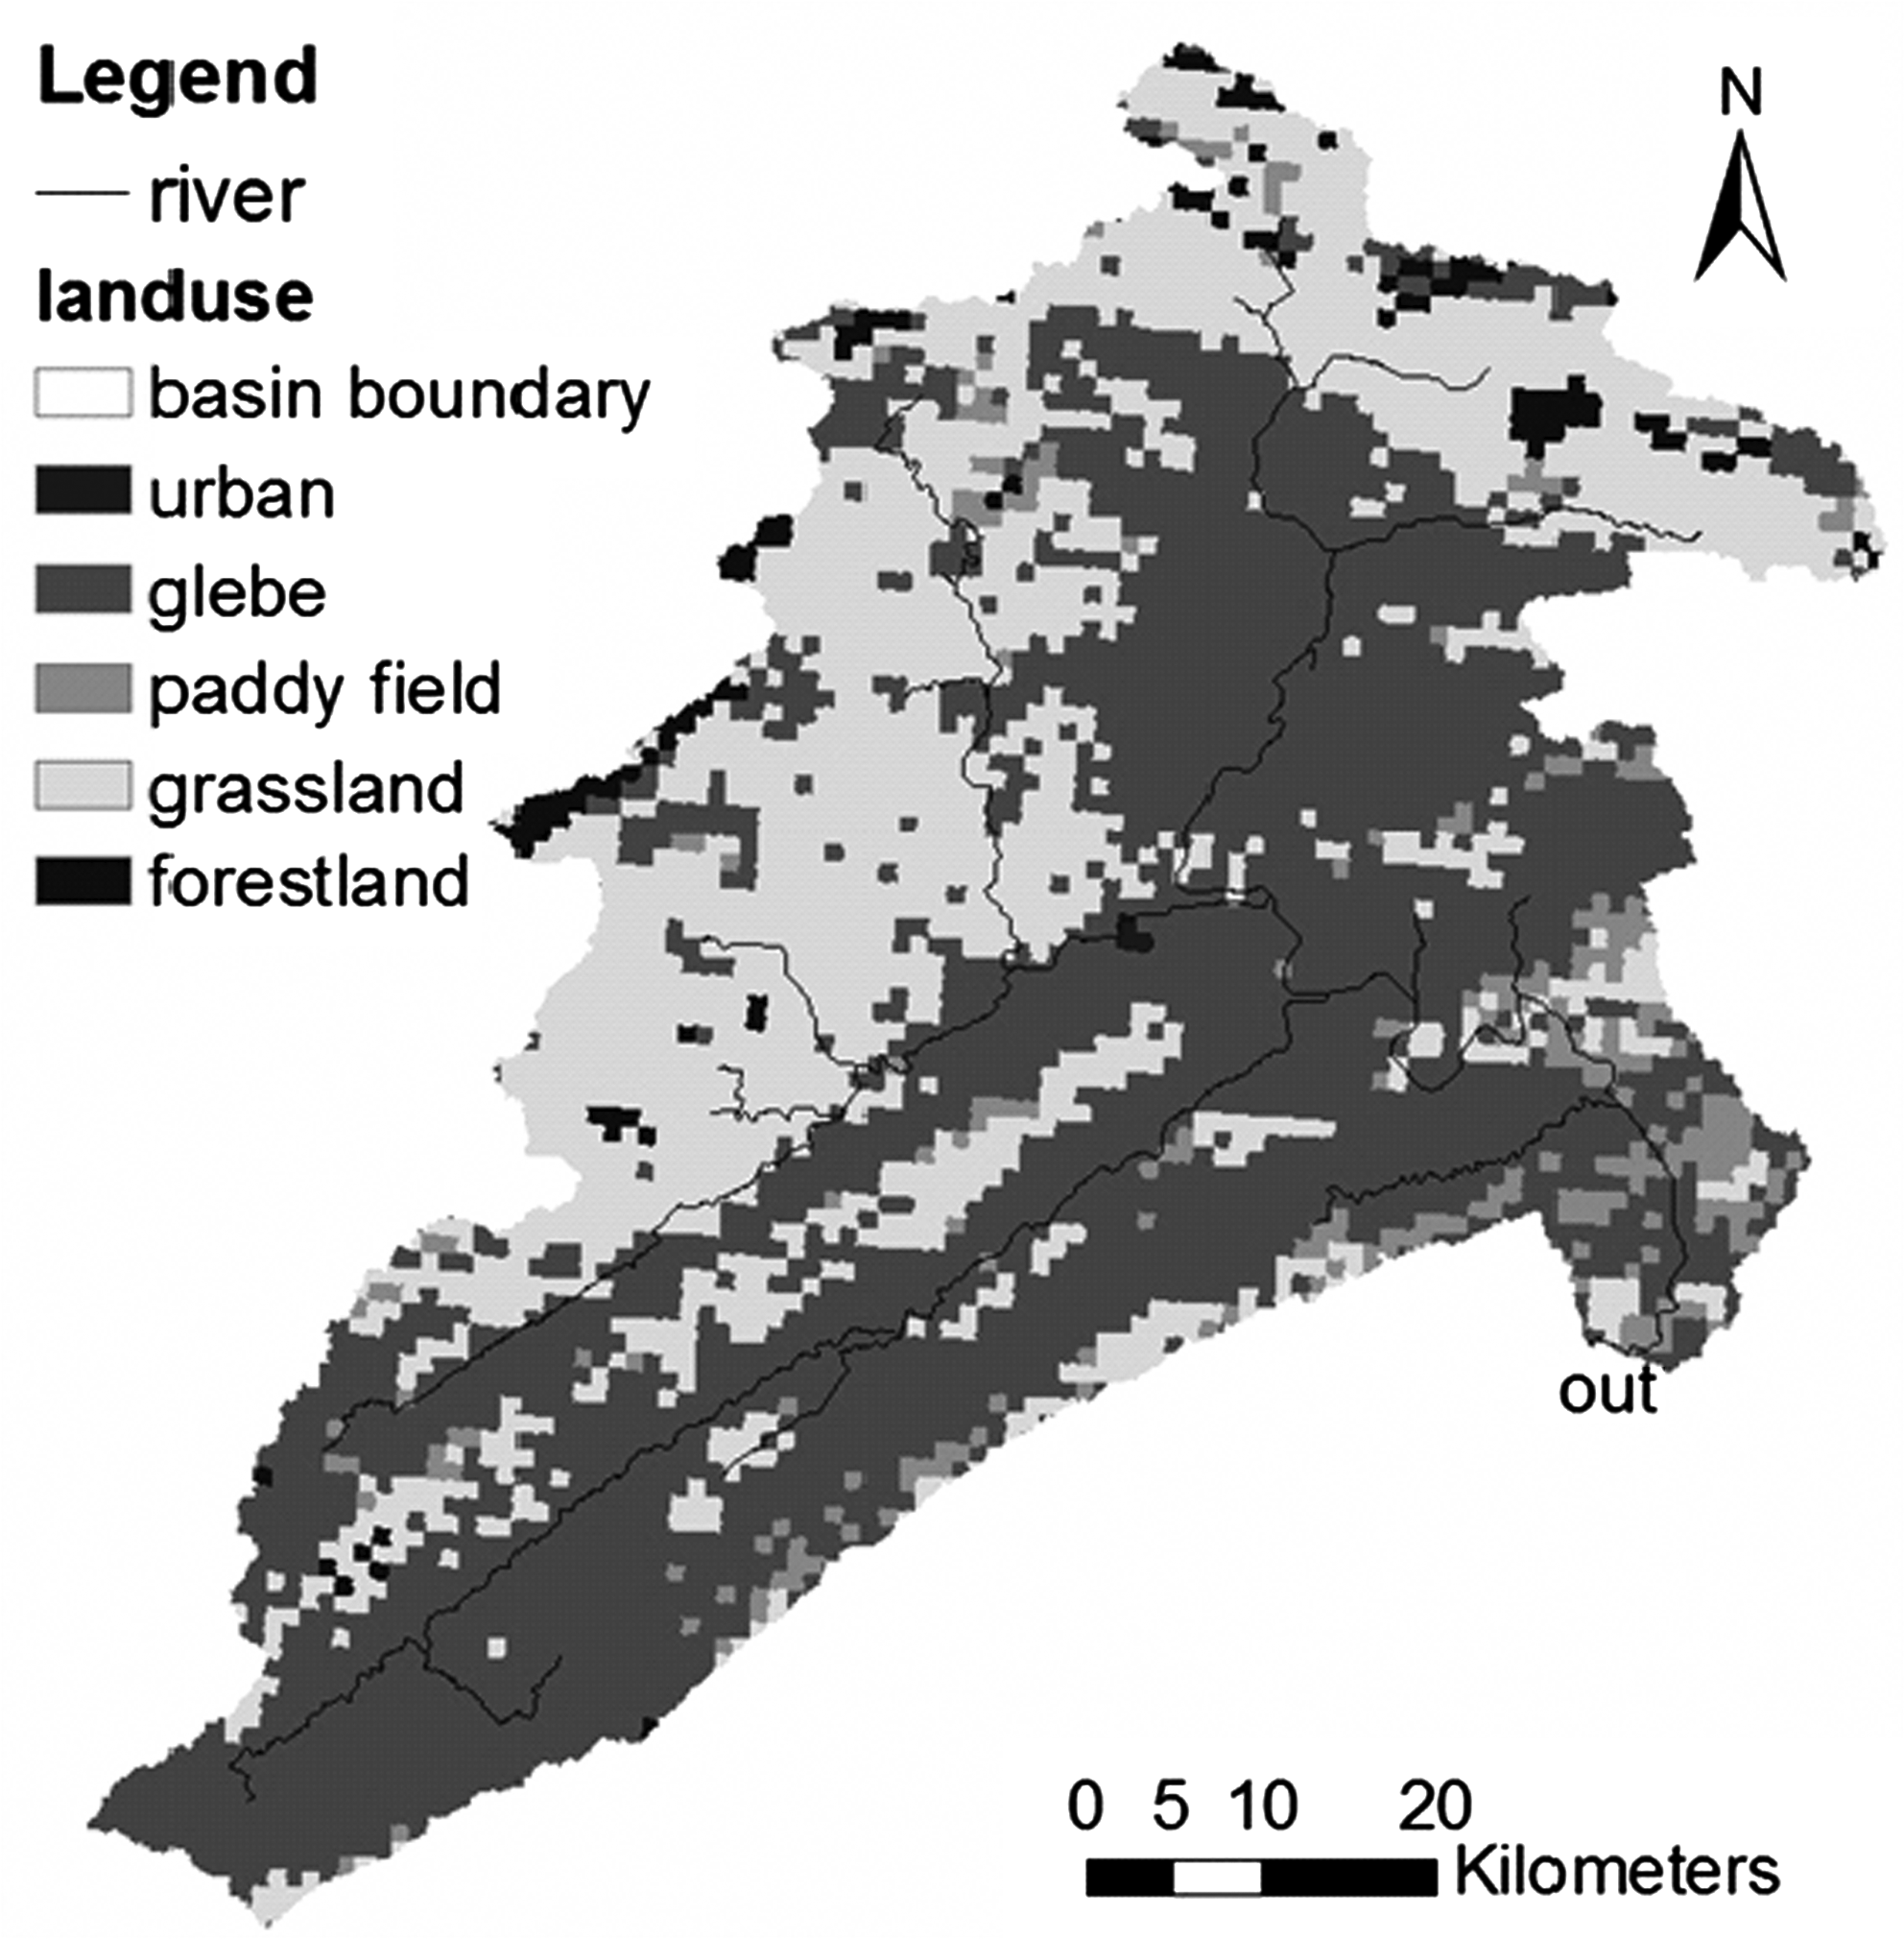
Different land use types of Xiaojiang Watershed.
Adsorbed NPS pollution load model
Soil erosion and sediment output model
The RUSLE (Renard et al., 1997), originally proposed by Wischmeier and Smith (1965, 1978), is the most widely used prediction equation in the world; it was designed to predict long-term average annual soil loss. It was expressed as follows:
where X is the modulus of soil loss (t/km2/a); R is the rainfall erosion driving force factor (J · cm/m2/h); K is the soil erodibility factor; LS is the topographic factor (L is the slope length factor, S is the slope steepness factor); C is the vegetation cover and management factor; and P is the soil and water conservation factor.
The soil from rainfall erosion is transported into the main river by surface runoff, and eventually reaches the export of the watershed; it is regarded as sediment output, and the calculation equation of sediment output is
where Qs is the sediment output (t); A is the regional calculation area (km2); and λ is the SDR.
Because the USLE is for the static and annual average condition, rather than the dynamic process of changes from year to year, for the study of the change process over time of adsorbed NPS pollution load caused by soil erosion, the dynamic formula for sediment output amount each year needs to be built. The annual changes of sediment output in the watershed are mainly related to the changes of soil erosion, whereas the annual changes of rainfall runoff and human activities in the watershed surely affect sediment yield environment and sediment transport (Higgitt and Lu, 1999; Rustomji and Prosser, 2001). To get the annual changing processes of soil erosion and the adsorbed NPS pollution load caused by soil erosion, a new dynamic sediment output model needs to be built; K factor and LS factor in the model are determined by soil types and topographical features of the underlying, but it will not change over short time; C factor and P factor are related to human activities such as land management, soil and water conservation measures and so on; land management activities will remain basically unchanged in Xiaojiang Watershed over the past decades, and the values of C factor and P factor are also generally unchanged. Because of the differences between spatial and temporal distribution of rainfall runoff in the watershed, the changes of R factor and λ factor are the dominant factors that lead to the changes of soil loss year after year. The annual variations of Ri are mainly due to the changes of hydrological conditions about annual rainfall and rainfall intensity. While the hydrological cycle and land management activities have impact on the annual changes of λi in the watershed, so λi will be divided into the two parts of λr,i factor impacted by the hydrological cycle and λm,i factor impacted by land management activities; in view of the almost unchanged surface characteristics of Xiaojiang watershed last decade, λm,i can be approximately taken as a constant, and it can be combined into λr,i, that is λi = λr,i. Therefore, Equation (2) can be revised to Equation (3) for calculating the annual sediment output Qs,i, and the pollution model framework is shown in Fig. 4, and the specific explanation is in the section, “The integration of pollution load model and blind number theory.”
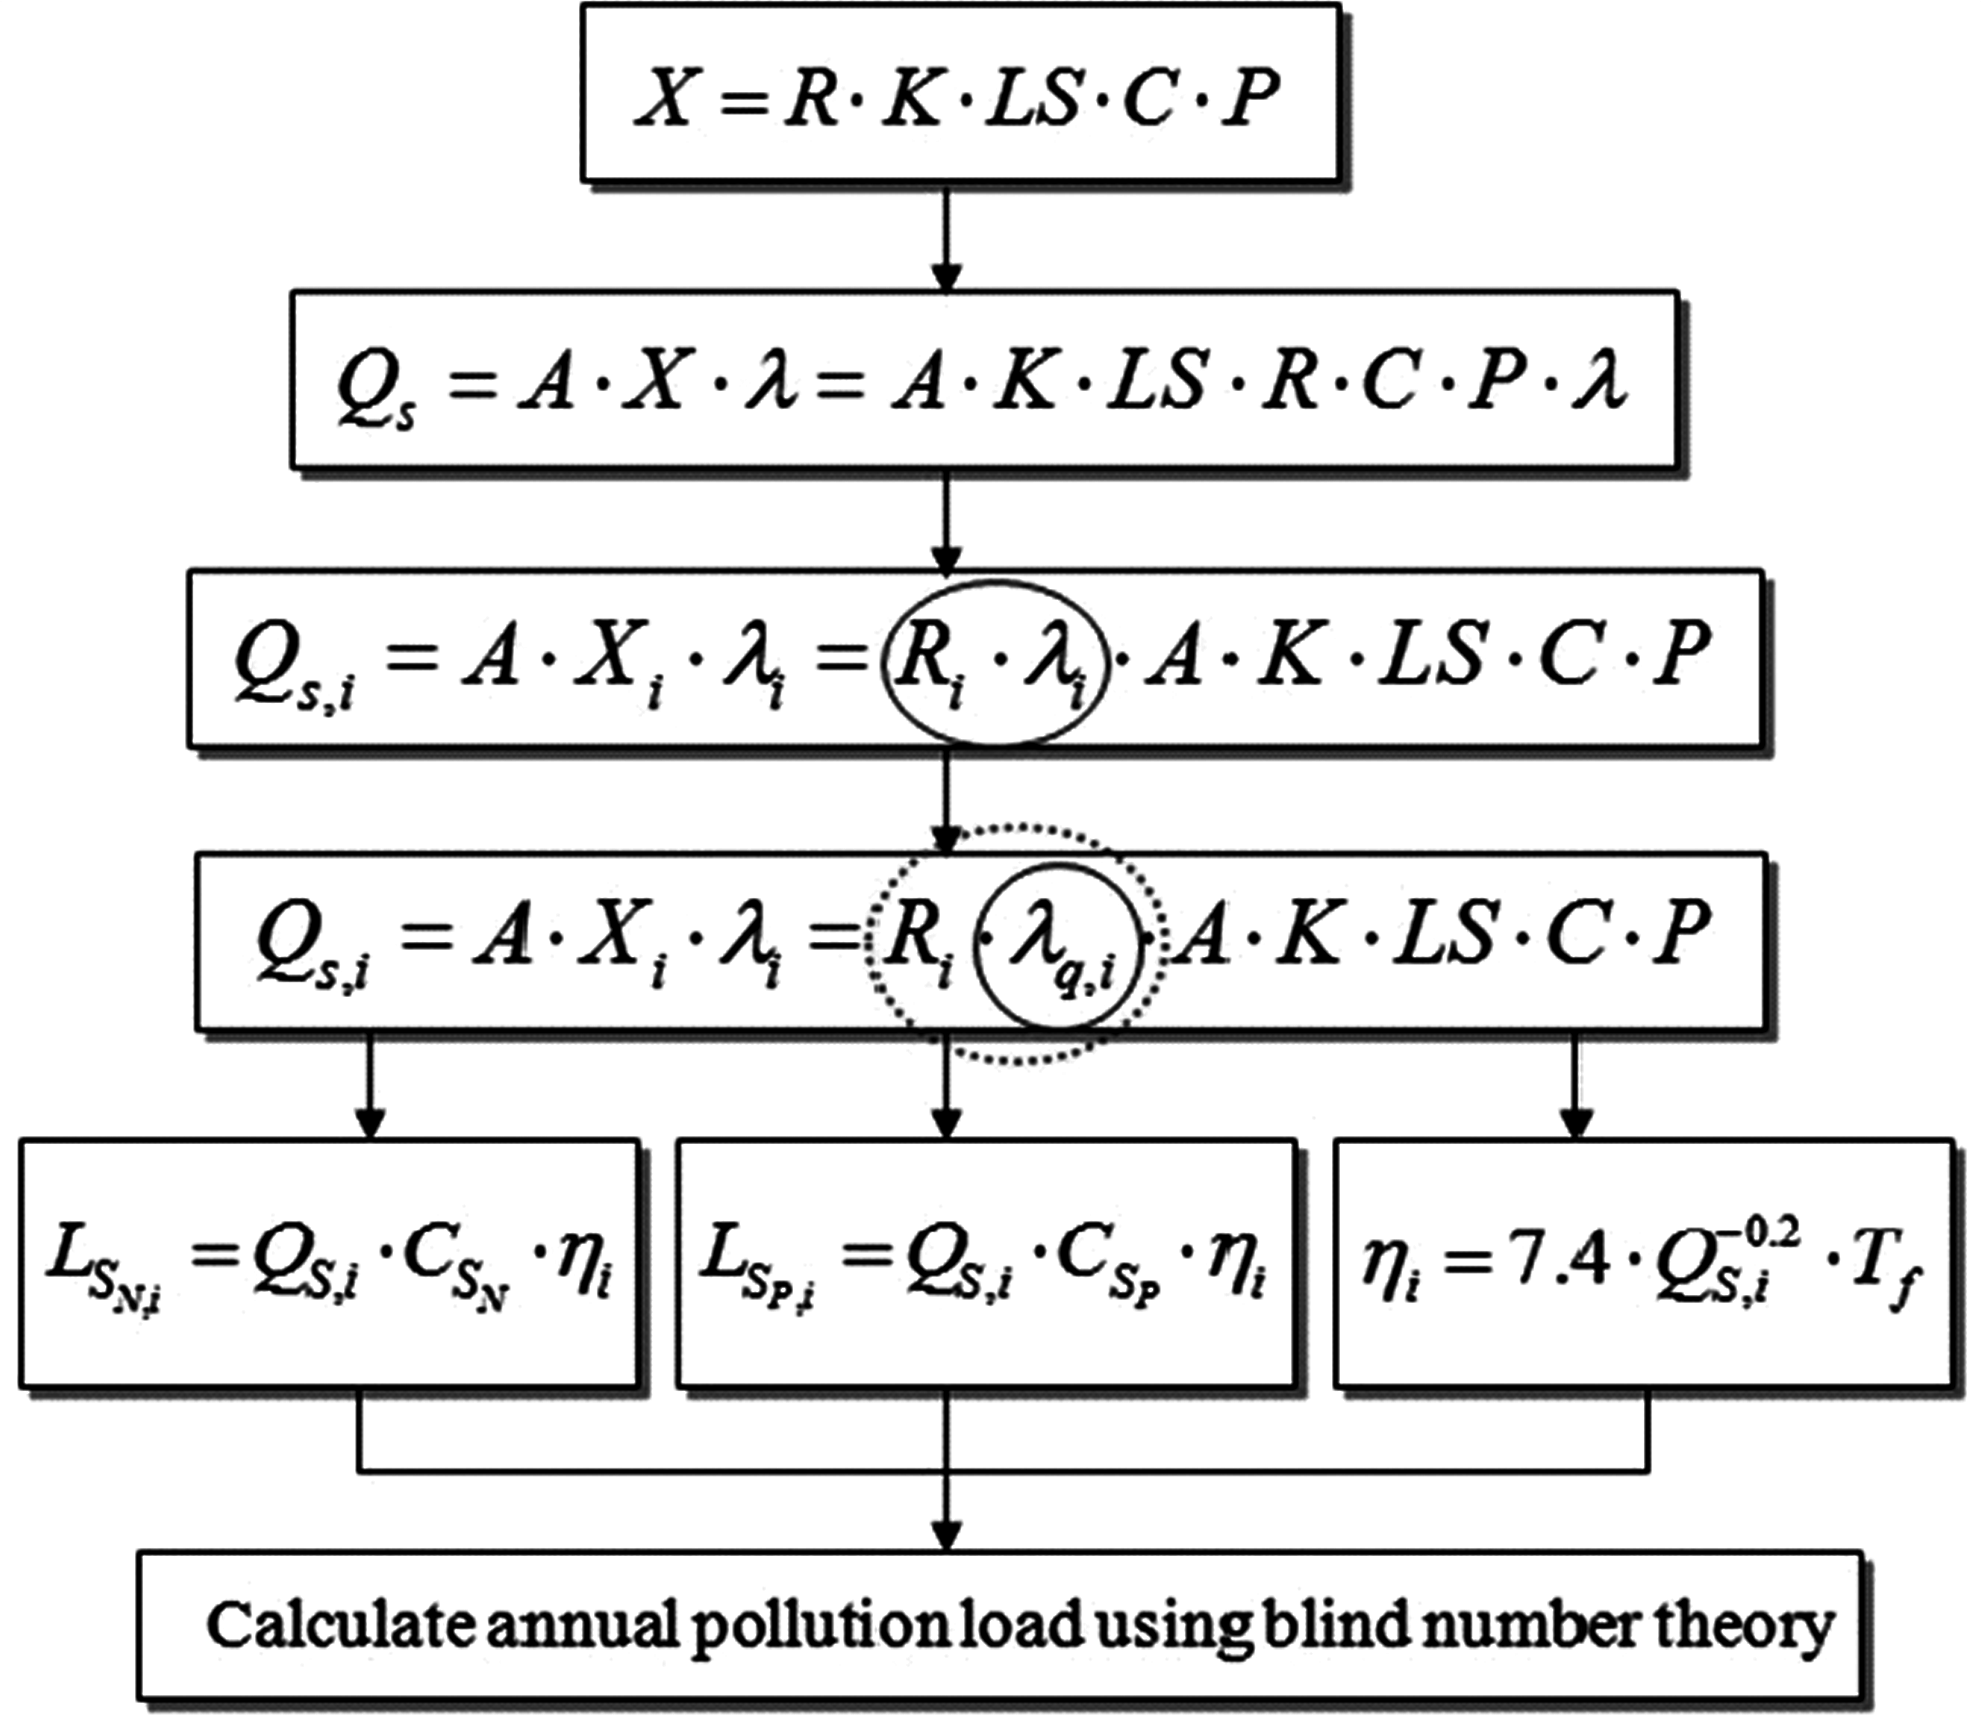
Basic framework map of model.
where Ts,i is the annual soil erosion volume (in tonnes).
Equations of the impact factors
Rainfall erosivity and SDR factors are believed to be the primary factors that affect NPS pollution. Rainfall erosivity is the main driving force of NPS contamination (Shen et al., 2008), and SDR also plays an important role in NPS pollutant transport (Sims et al., 1998; Liu and Singh, 2004). The SDR concept was determined according to the Runoff Curve Numbers and the USLE methods (Vanoni, 1975); it helps to yield estimations of NPS pollution loads with respect to soil erosion, sediment transport, and nutrient fluxes, such as total phosphorus (TP) and total nitrogen (TN). Therefore, with reference to relevant literature (Ding et al., 2010), the estimation methods of the impact factors are summarized as follows,
(1) λr,i factor: The average annual SDR where Si is the annual sediment yield rate (kg/s); Qi is the annual runoff (m3/s). Second, statistics showed that the annual rainfall and annual runoff had a linear relationship (Woo et al., 2009), SDR was mainly based on driving force factor of runoff, and rainfall and runoff were the dominant impact factors to determine the sediment transport force. According to the power function relationship between the sediment yield rate and runoff, Equation (4) was used to calculate annual soil erosion volumes, whereas the calculation of annual sediment output was based on the statistical formula (5) derived from the measured data of the basin. Then, it could be found that Besides, by the establishment of buffer zone according to the slope and the distance to the riverway, the annual spatial and local SDR of the watershed (Fig. 5) was obtained using weighted average method based on watershed average SDR (Rustomji and Prosser, 2001). (2) R factor: Because of nonlinear variability of rainstorms over space and time, predicting the R factor at any time for any unknown location using a dataset of rainfall observations is a complex modeling and mapping process (Wang et al., 2002). Reference to Zhou (1995), Zhang et al. (1995), and Cao et al. (2007) and other research results, the Equation (7) was determined to calculate the value of rainfall erosivity factor R using simulated surface rainfall data; the simulated rainfall data were the basin surface meteorological data, which could well improve and express the accuracy of monthly rainfall data in the watershed; it was calculated and obtained from SLURP (Semi-distributed Land Use-based Runoff Processes) hydrological model (Wu et al., 2010).
where Pi is monthly rainfall (mm) and R is the factor of the rainfall erosivity (J · cm/m2/h). According to Equation (7), we obtained the spatial distribution map of R factor by spatial interpolation method with the assumption that the R factor is a constant over time and linearly varying over space (Fig. 6). (3) For the other factors, K factor was based on the equation given by Wischmeier and Smith (1965, 1978). The empirical equation of Brown (Lu, 1999) was used to calculate LS factor; C factor was mainly related to vegetation cover and land-use type (Cai et al., 2000). With reference to relevant studies (Shi et al., 2002; Meng, 2005), we obtained the different P values through the investigation of soil and water conservation measures in different land-use types of the watershed.
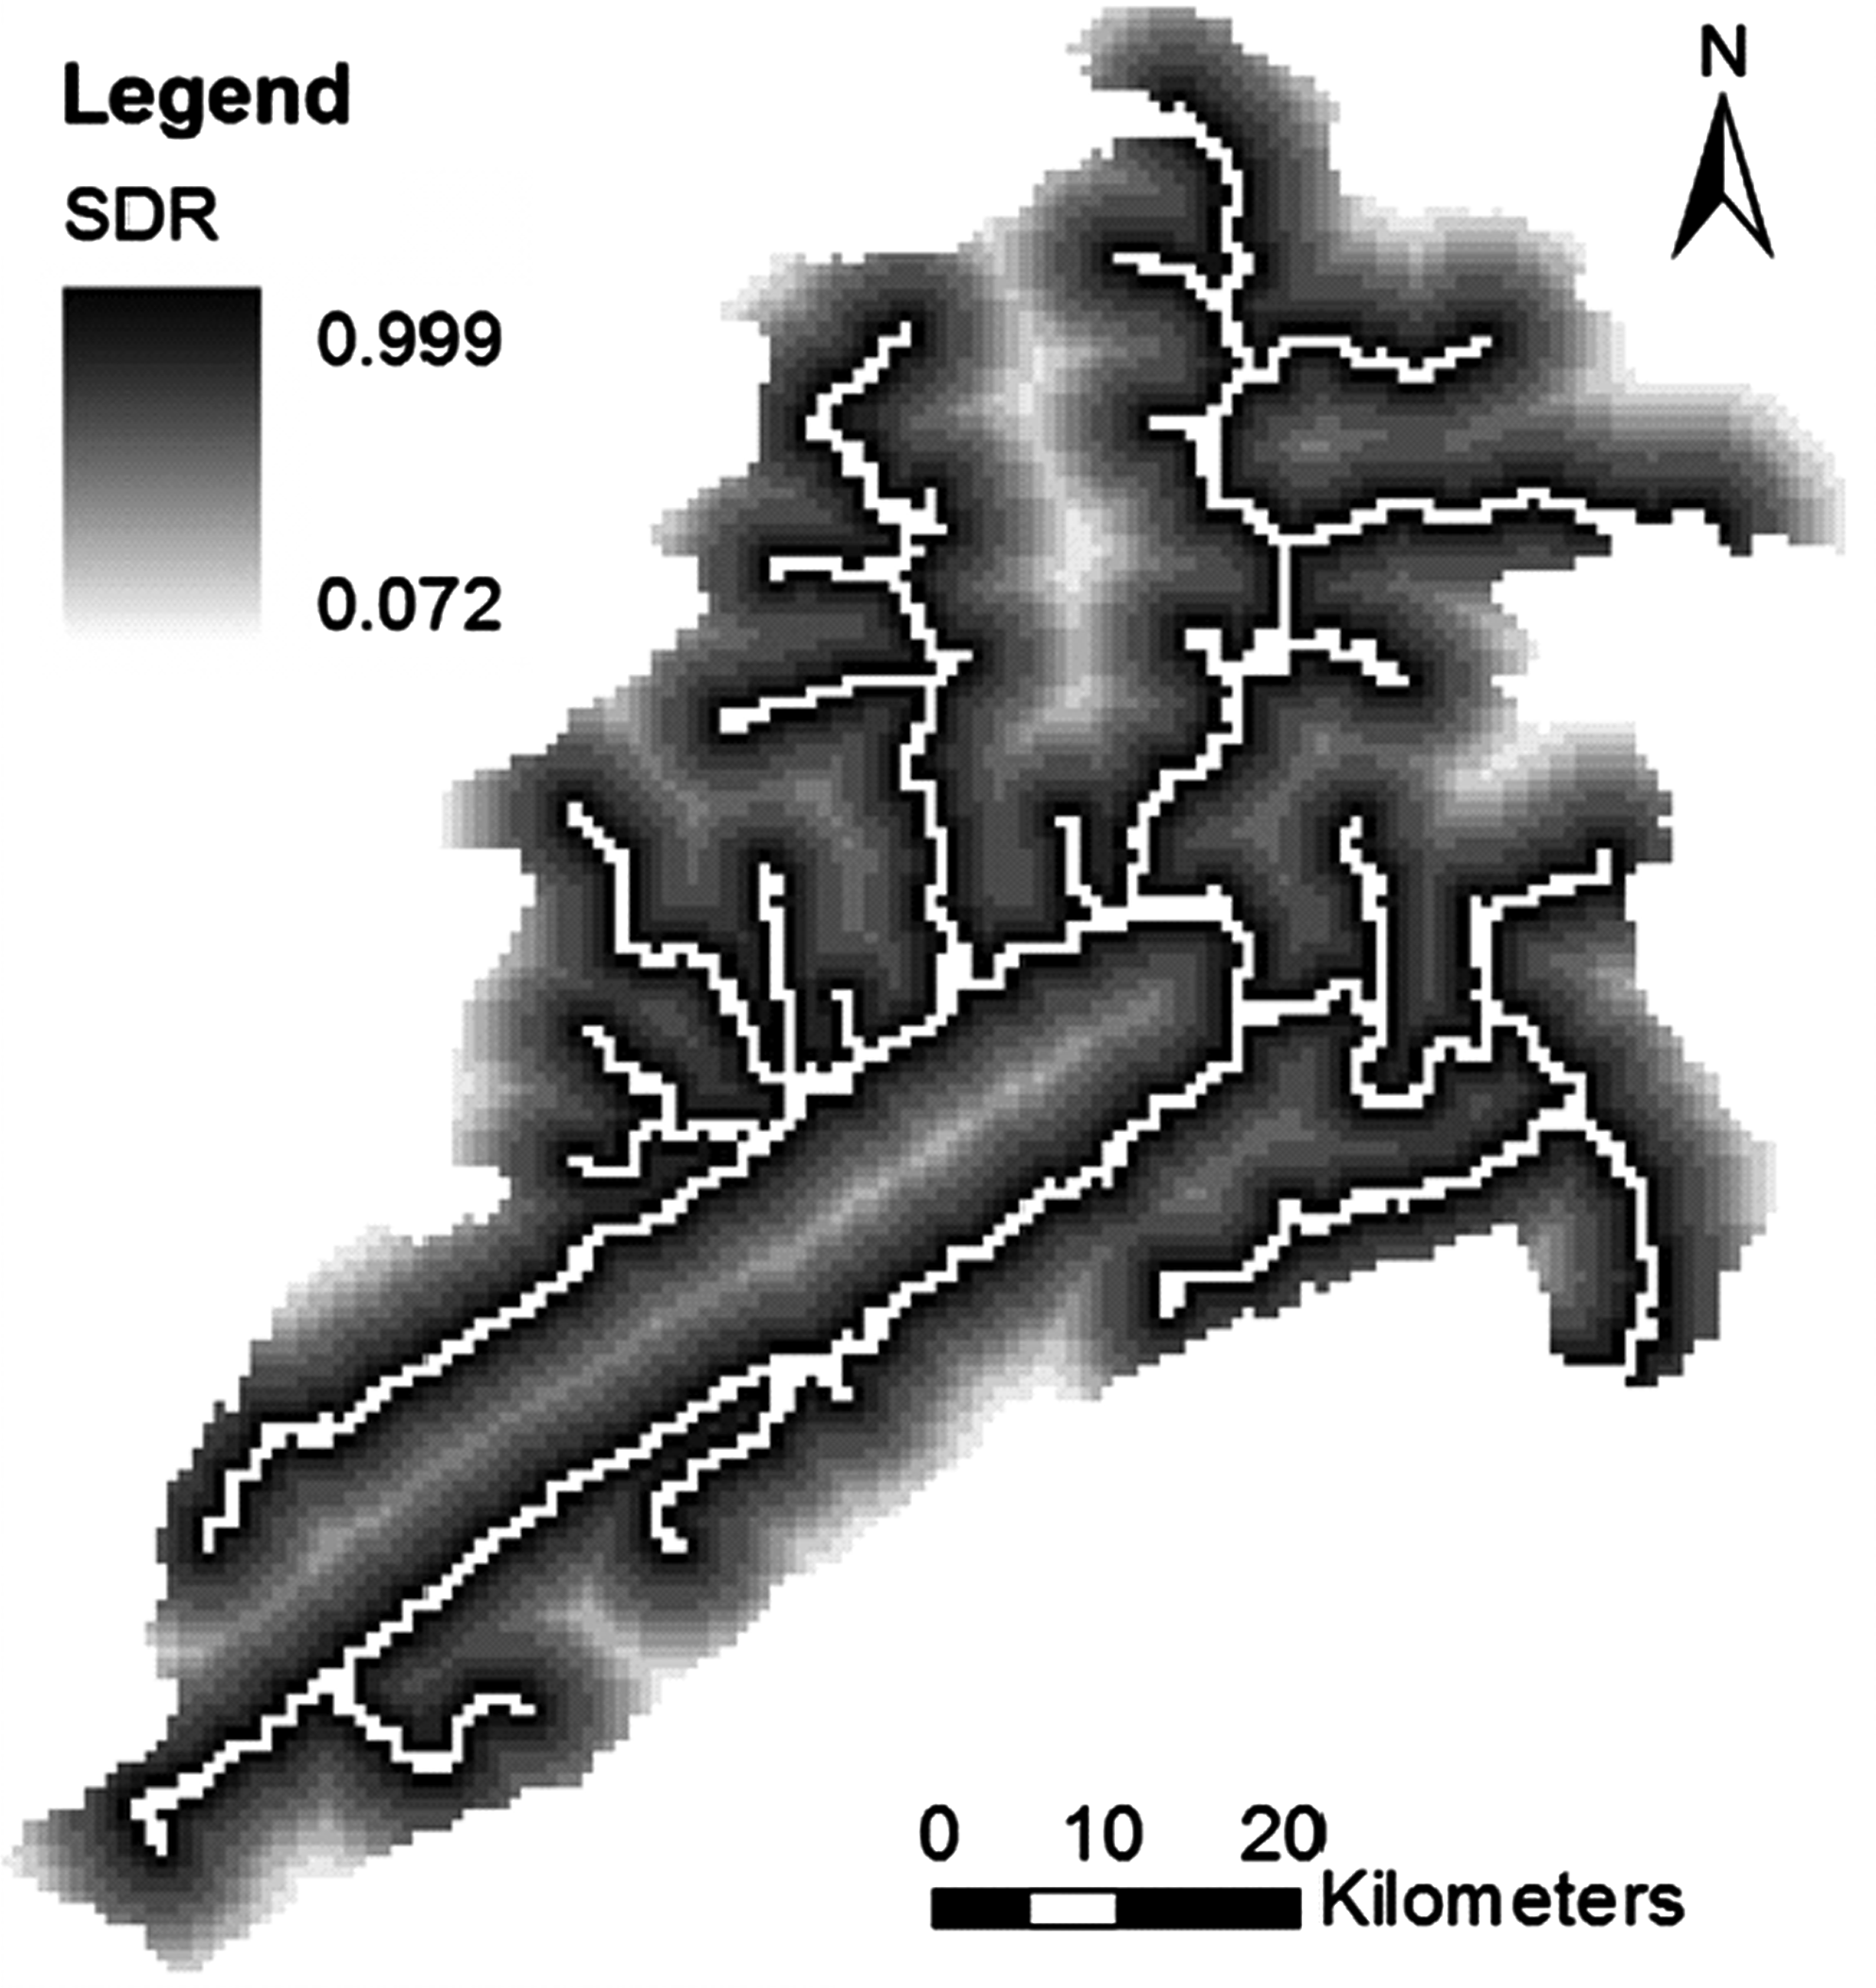
Sediment delivery ratio of Xiaojiang Watershed.

Spatial distribution map of rainfall erosivity factor.
Dynamic pollution load model based on blind number theory
Blind number theory
Basic concept of the blind number: At present, there are methods of handling uncertainties such as probability and statistics, fuzzy mathematics, gray mathematics, and unascertained mathematics. According to the concept of “geometry chaos,” any complex information is called as “information chaos.” In the category of information chaos, that having two or more complex information about random, fuzzy, gray, and uncertainty is known as the blind information. Blind number (Wang, 1990) is the mathematical tool to express and deal with the blind information.
The assumption that H(I) is gray number interval set that consists of a series of xi gray interval, then
While i ∉ j, xi ∉ xj, and
The algorithms of blind number: The calculations of blind number include the credibility and possible values; the algorithms are summarized below: in case of * denotes an algorithm in H(I), for example, it is certain kind of +, −, ×, ÷. Given that the blind number A and B, respectively, are,
1. Table 2 is called the possible values with edge “*” matrix. Two perpendicular straight lines are known as the vertical axis and horizontal axis; 2. Table 3 represents the credibility with edge “·” matrix. The m × n rank matrix composed of the elements of the first quadrant is called “·” matrix of the credibility under the “·” computing of A and B, it is called the “·” matrix of credibility. Here in the A, B possible values with edge “*” matrix, the elements of i row and j rank (xi * yi) are correspondence to the elements of i row and j rank (α
i
· β
j
) of the credibility with edge “·” matrix. The multiplication of blind number meets allocation. 3. After having received the above two matrices, the same elements of “*” matrix could be merged, the merging process is that making its corresponding elements cumulatively add in the corresponding credibility with edge “·” matrix, and ultimately the computing results of blind number are gained.
The integration of pollution load model and blind number theory
According to the blind number theory, the impact factors of RUSLE can be described and expressed by blind number; then, the parameters of R, K, LS, C, P, and λ will be referred to as a blind factor, that is,
The above factors are connected with Equations (1) and (2), so the calculation models of soil erosion and sediment transport are expressed by the form of blind number through Equations (12) and (13), namely,
where X, Qs,i, A represents the same meaning as the former; λ i is the annual SDR.
Adsorbed NPS pollutants take the process of soil erosion as the transmission carrier, and its pollution load of the watershed export is impacted by many factors, which conclude the amount of the soil erosion generated in slope surface of the watershed, the background content of pollutants in the soil, the enrichment ratio in the process of the transport, and the SDR. By analyzing the relevant literature (Xue et al., 2005; Cao et al., 2008; Li and Shi, 2008; Lu et al., 2008; Yu et al., 2008), in virtue of the uncertainty theory and Fig. 4, the annual adsorbed nitrogen and phosphorus pollution load models in the watershed export were expressed by the form of blind number as follows:
where LsN,i and LsP,i are, respectively, the adsorbed NPS nitrogen and phosphorus pollution load in of watershed export in i year, t/a;
Calculation methods of the factor information
Based on the analysis of the geographic conditions, ecological conditions, management level, and environmental information databases of the watershed, GIS technology was combined to generate spatial distribution maps of various factors in accordance with the above-mentioned methods of the parameter determination, then the blind information of various factors in the watershed was obtained through GIS statistics, and then we extracted the possible value range of each factor and the reliability of the blind information about the factors (Li et al., 2005), thereinto, formula (17) represented the blind information of factor R. Finally, information of each factor on the entire scope of the watershed was obtained. According to the algorithm and the processing technology of the blind number theory (Wang, 1990; Liu et al., 1999), the interval of possible value and reliability were calculated (Table 4) (take appearance frequency of the data within the gray zone as credibility of corresponding interval).
Results and Discussion
Annual soil erosion and sediment transport modulus
1. The calculation of watershed annual soil erosion should take into account the yearly changes of rainfall erosion factor Ri and the yearly changes of SDR λ i , according to the equations of the factors, the annual value of R factor and λ factor are in Table 5.
2. Accurate prediction of soil loss is important for assessing soil erosion hazard and determining suitable land use and soil conservation measures for a catchment. Therefore, combining with Ri and λ i , annual soil erosion modulus and sediment transport modulus were calculated through the dynamic sediment output model (Fig. 7).
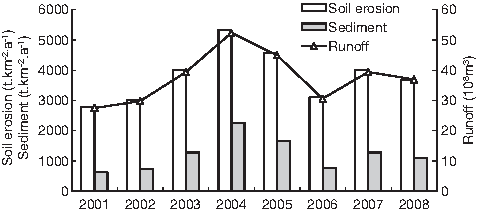
Annual soil erosion and sediment modulus in Xiaojiang watershed.
It can be seen that the difference of the runoff leads to the large changes of soil erosion modulus (Fig. 7). In 2001–2008, the soil erosion modulus of 2004 is the largest. This situation is related to the annual rainfall runoff, and is also closely to rainfall intensity and rainfall duration. For example, rainfall intensity was bigger in 2004 than other year, and heavy rain lasted long, so the soil erosion modulus was the largest. The relationship of the SDR and runoff is a power function, and the mutations in runoff can induce a significant change of SDR; at the same time, the annual sediment delivery and sandiness of the export in the watershed are closely related to soil erosion modulus and SDR, and they are also closely related to the rainfall runoff and the situation of a large rainstorm. Therefore, reasonable soil and water conservation measures are of great significance to reduce sediment loss.
Annual adsorbed nitrogen and phosphorus load of watershed export
Annual pollution load of different land use types
The land use types after reclassification are five categories in Xiaojiang Watershed. The areas of different land use types about urban land, glebe, paddy, grassland, and forest are, respectively, 3.266, 2911.883, 310.128, 1890.042, and 160.682 km2. It is clear that the areas of glebe and grassland occupy a large proportion; it is about 91.01%, but urban land is comparatively low.
According to the pollution load Equations (14) and (15), the annual adsorbed nitrogen and phosphorus NPS pollution loads of different land use types in the watershed export were calculated. Taking the year of 2008 as an example (Figs. 8 and 9), we know that the output load of adsorbed TN and TP pollution in glebe is the biggest over the years; it accounts for >55% of total land-use output. It is followed by grasslands and paddy fields, and the output load of urban land is at least. This is mainly related to the development of agricultural land, hilly land of purple soil is more, and urban land is less than others in Xiaojiang watershed. The yearly trends of nitrogen and phosphorus pollution load are linearly related to rainfall. The greater the rainfall, the more the adsorbed nitrogen and phosphorus load is carried by sediment transport.
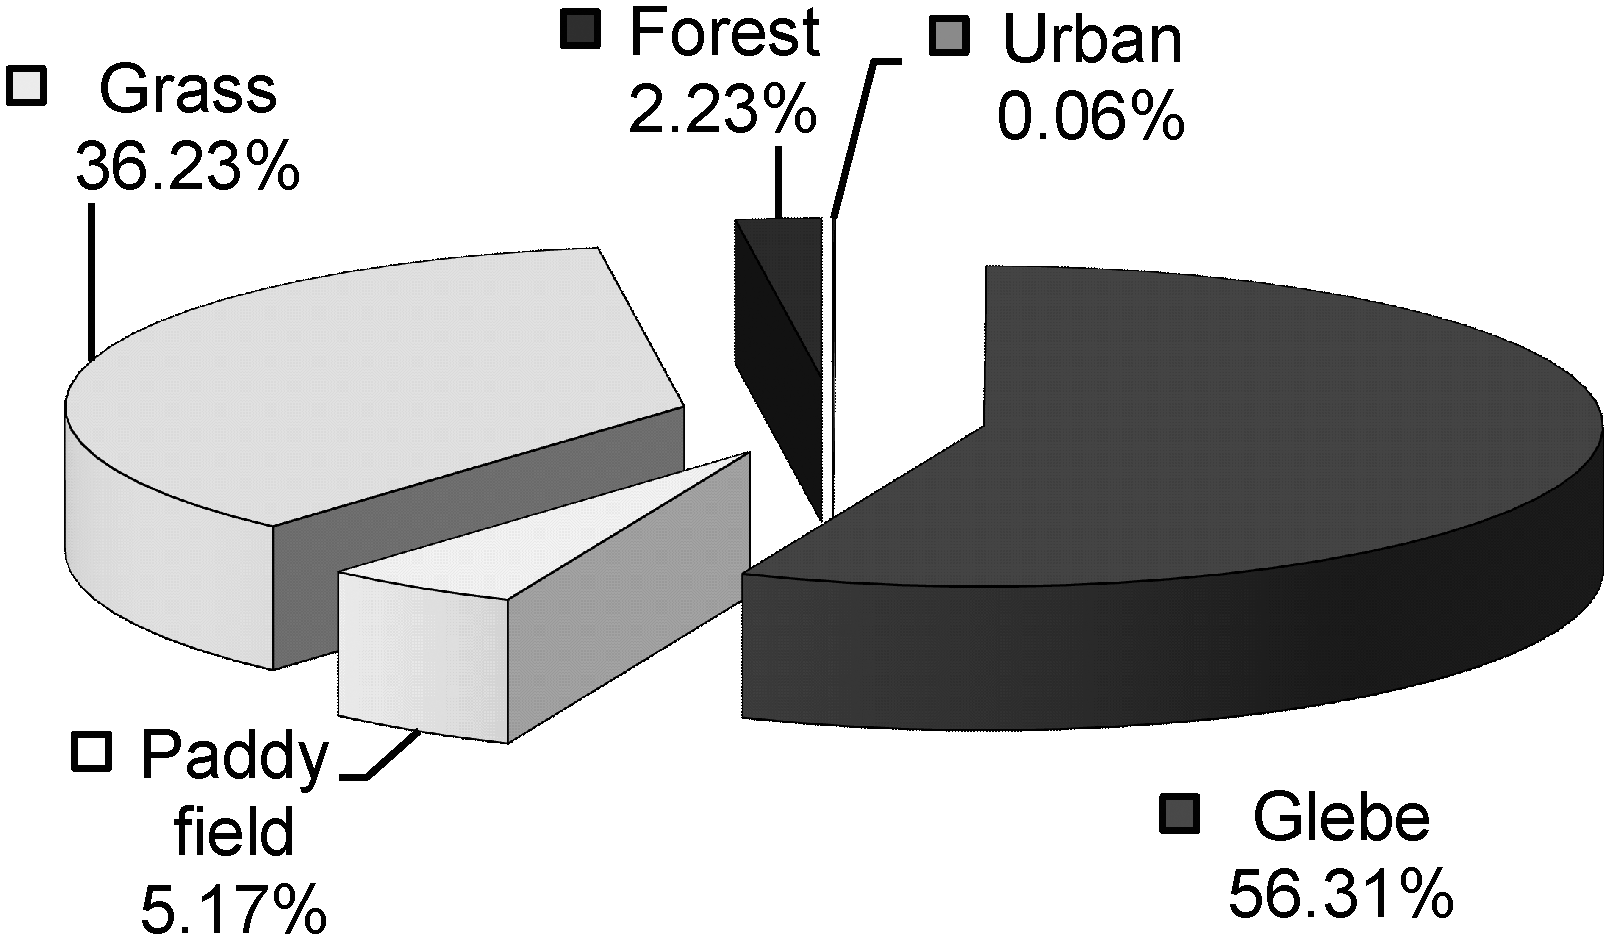
TN load distribution of different land use types in 2008. TN, total nitrogen.
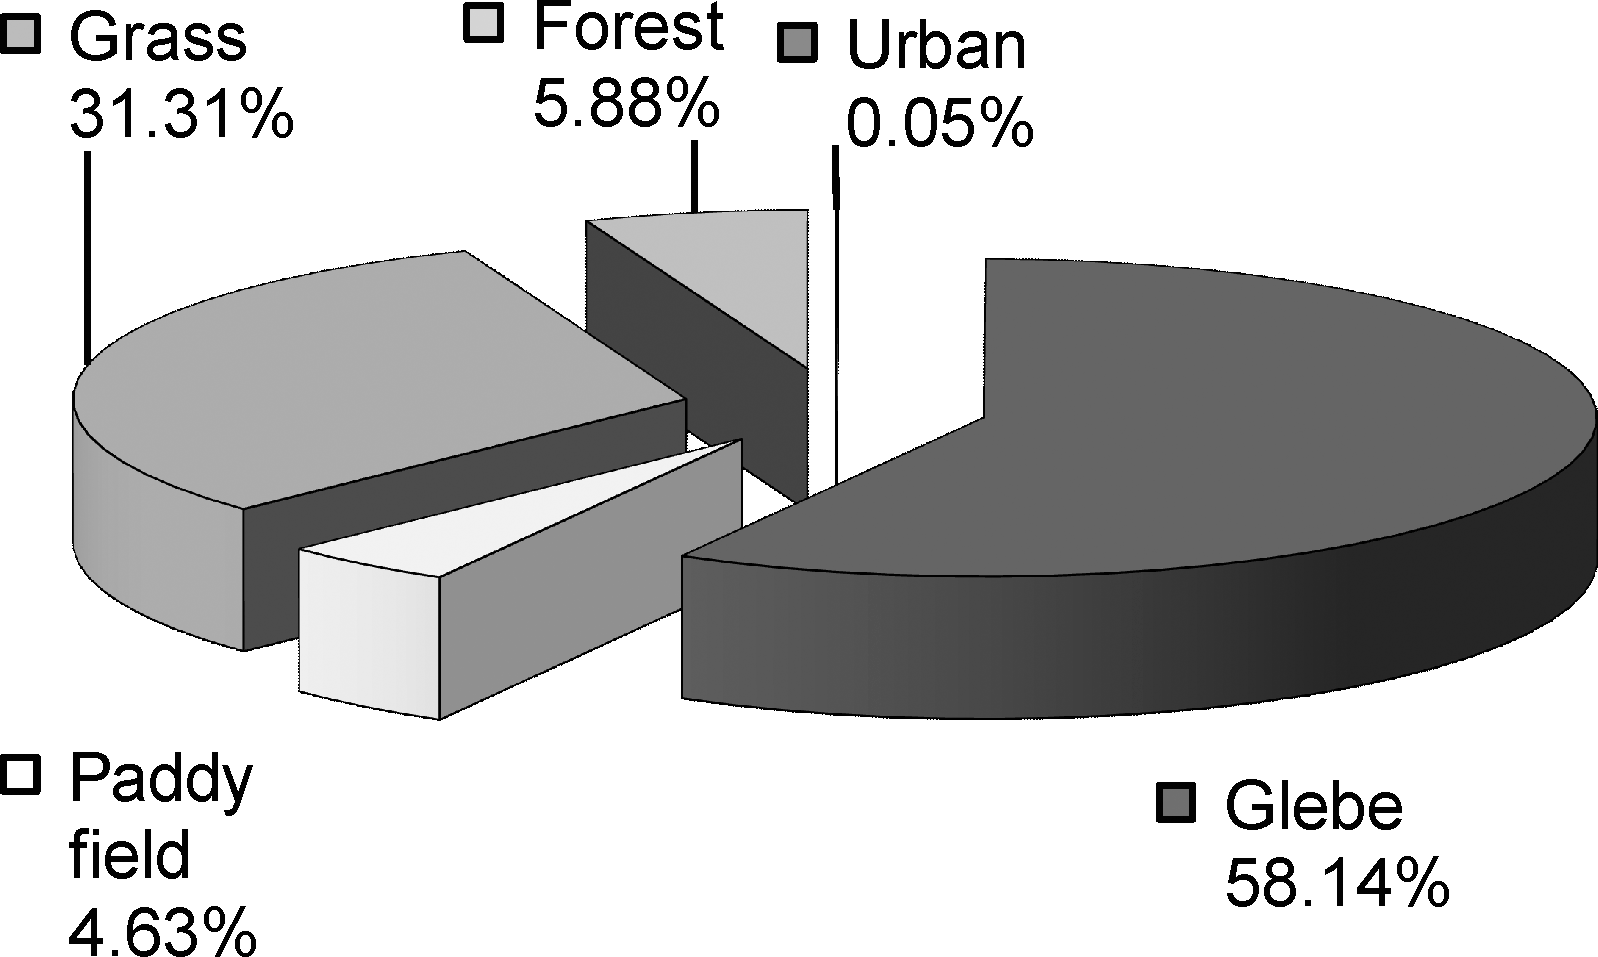
TP load distribution of different land use types in 2008. TP, total phosphorus.
Spatial distribution of pollution load
Taking the spatial distribution map of nitrogen and phosphorus load in 2007 as an example, we found that the spatial distribution of nitrogen load (Figs. 10 and 11) exhibited almost the same pattern as phosphorus. This similarity demonstrated that the NPS-N and NPS-P pollution were consistent with Xiaojiang watershed to some extent. The most severe regions of NPS nitrogen and phosphorus pollution in the watershed are mainly distributed in the Pu-li River basin, especially the upstream of Pu-li River, the downstream of East River, the populated areas along the coast of Nan-he, the population congregate in the surrounding of Kai-xian county, as well as Peng-xi River Basin. These areas mainly have glebe, paddy field, and other farmland, whereas Tao-xi River Basin, the upper reaches of the East River, the surrounding of lower reaches in Nan-he, because the grassland and forestland are the majority, the output of nitrogen and phosphorus pollution is relatively small. The spatial distribution of NPS nitrogen and phosphorus pollution load is mainly affected not only by the differences of spatial distribution about land-use types within the watershed, but also by the human activities. In general, glebe land brings about much nitrogen and phosphorus pollution loads, and it is followed by paddy fields. The pollution loads of forest land are the lowest.
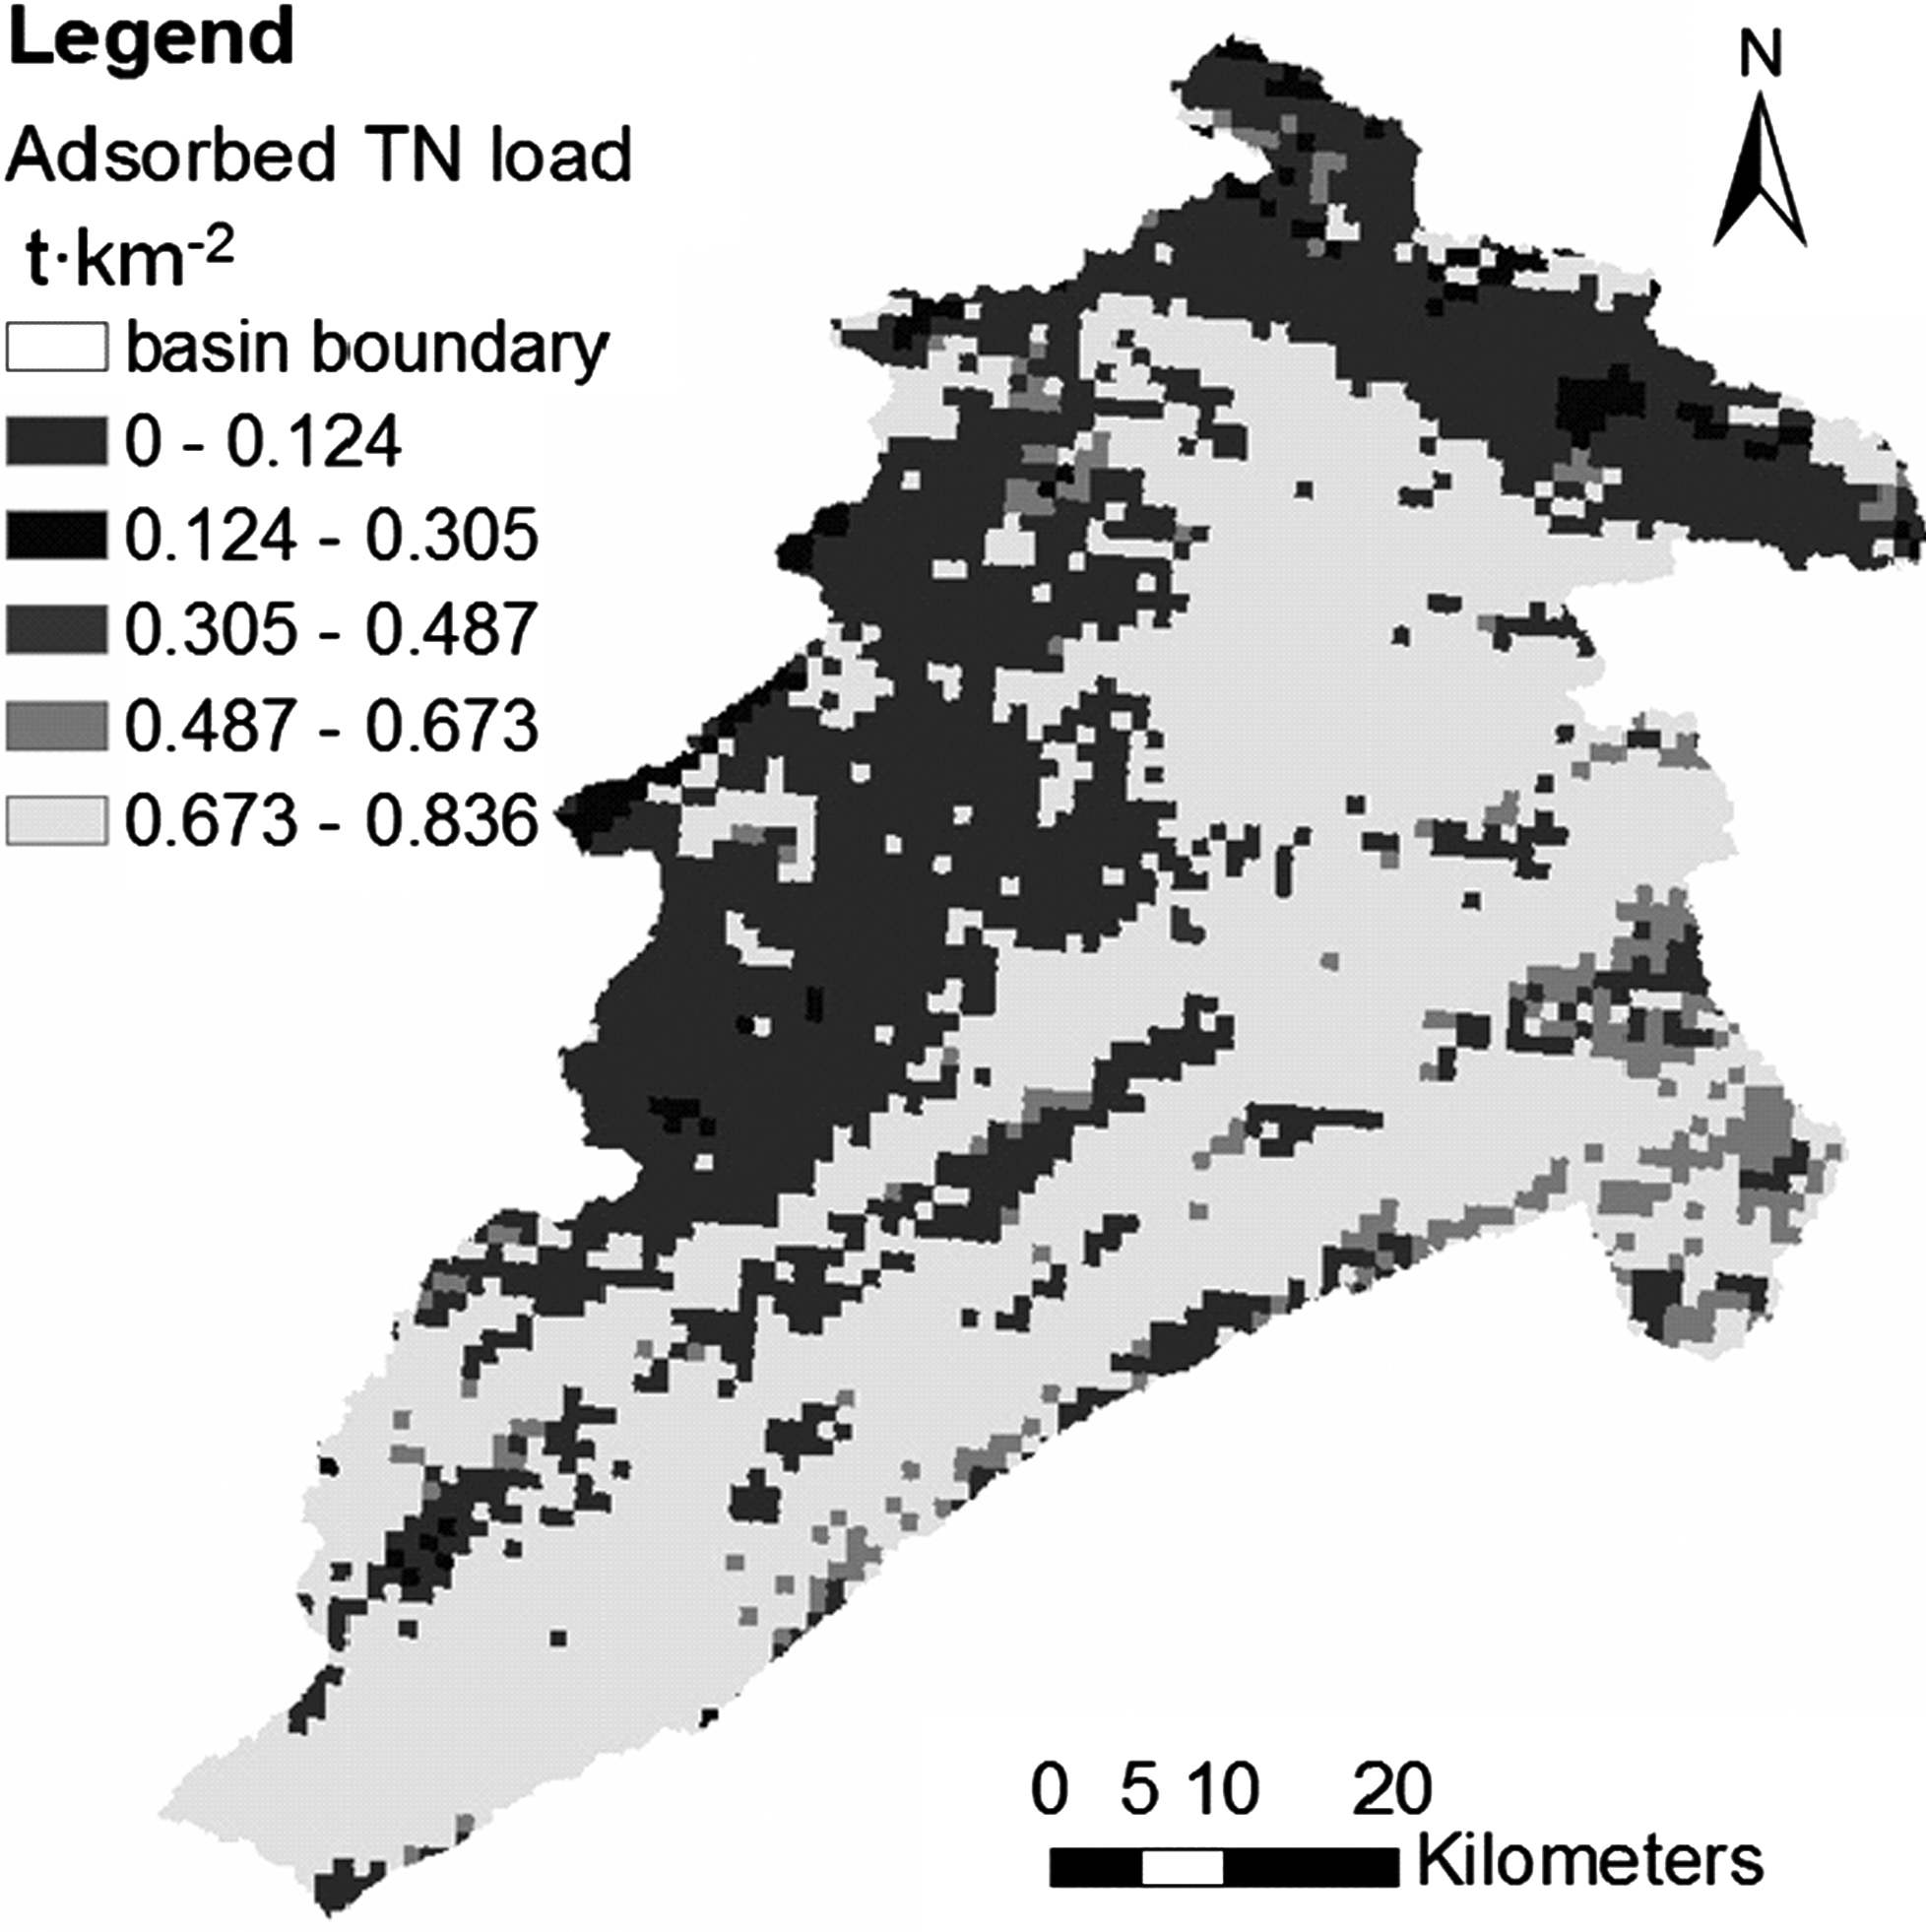
Spatial distribution of adsorbed TN load in 2007.
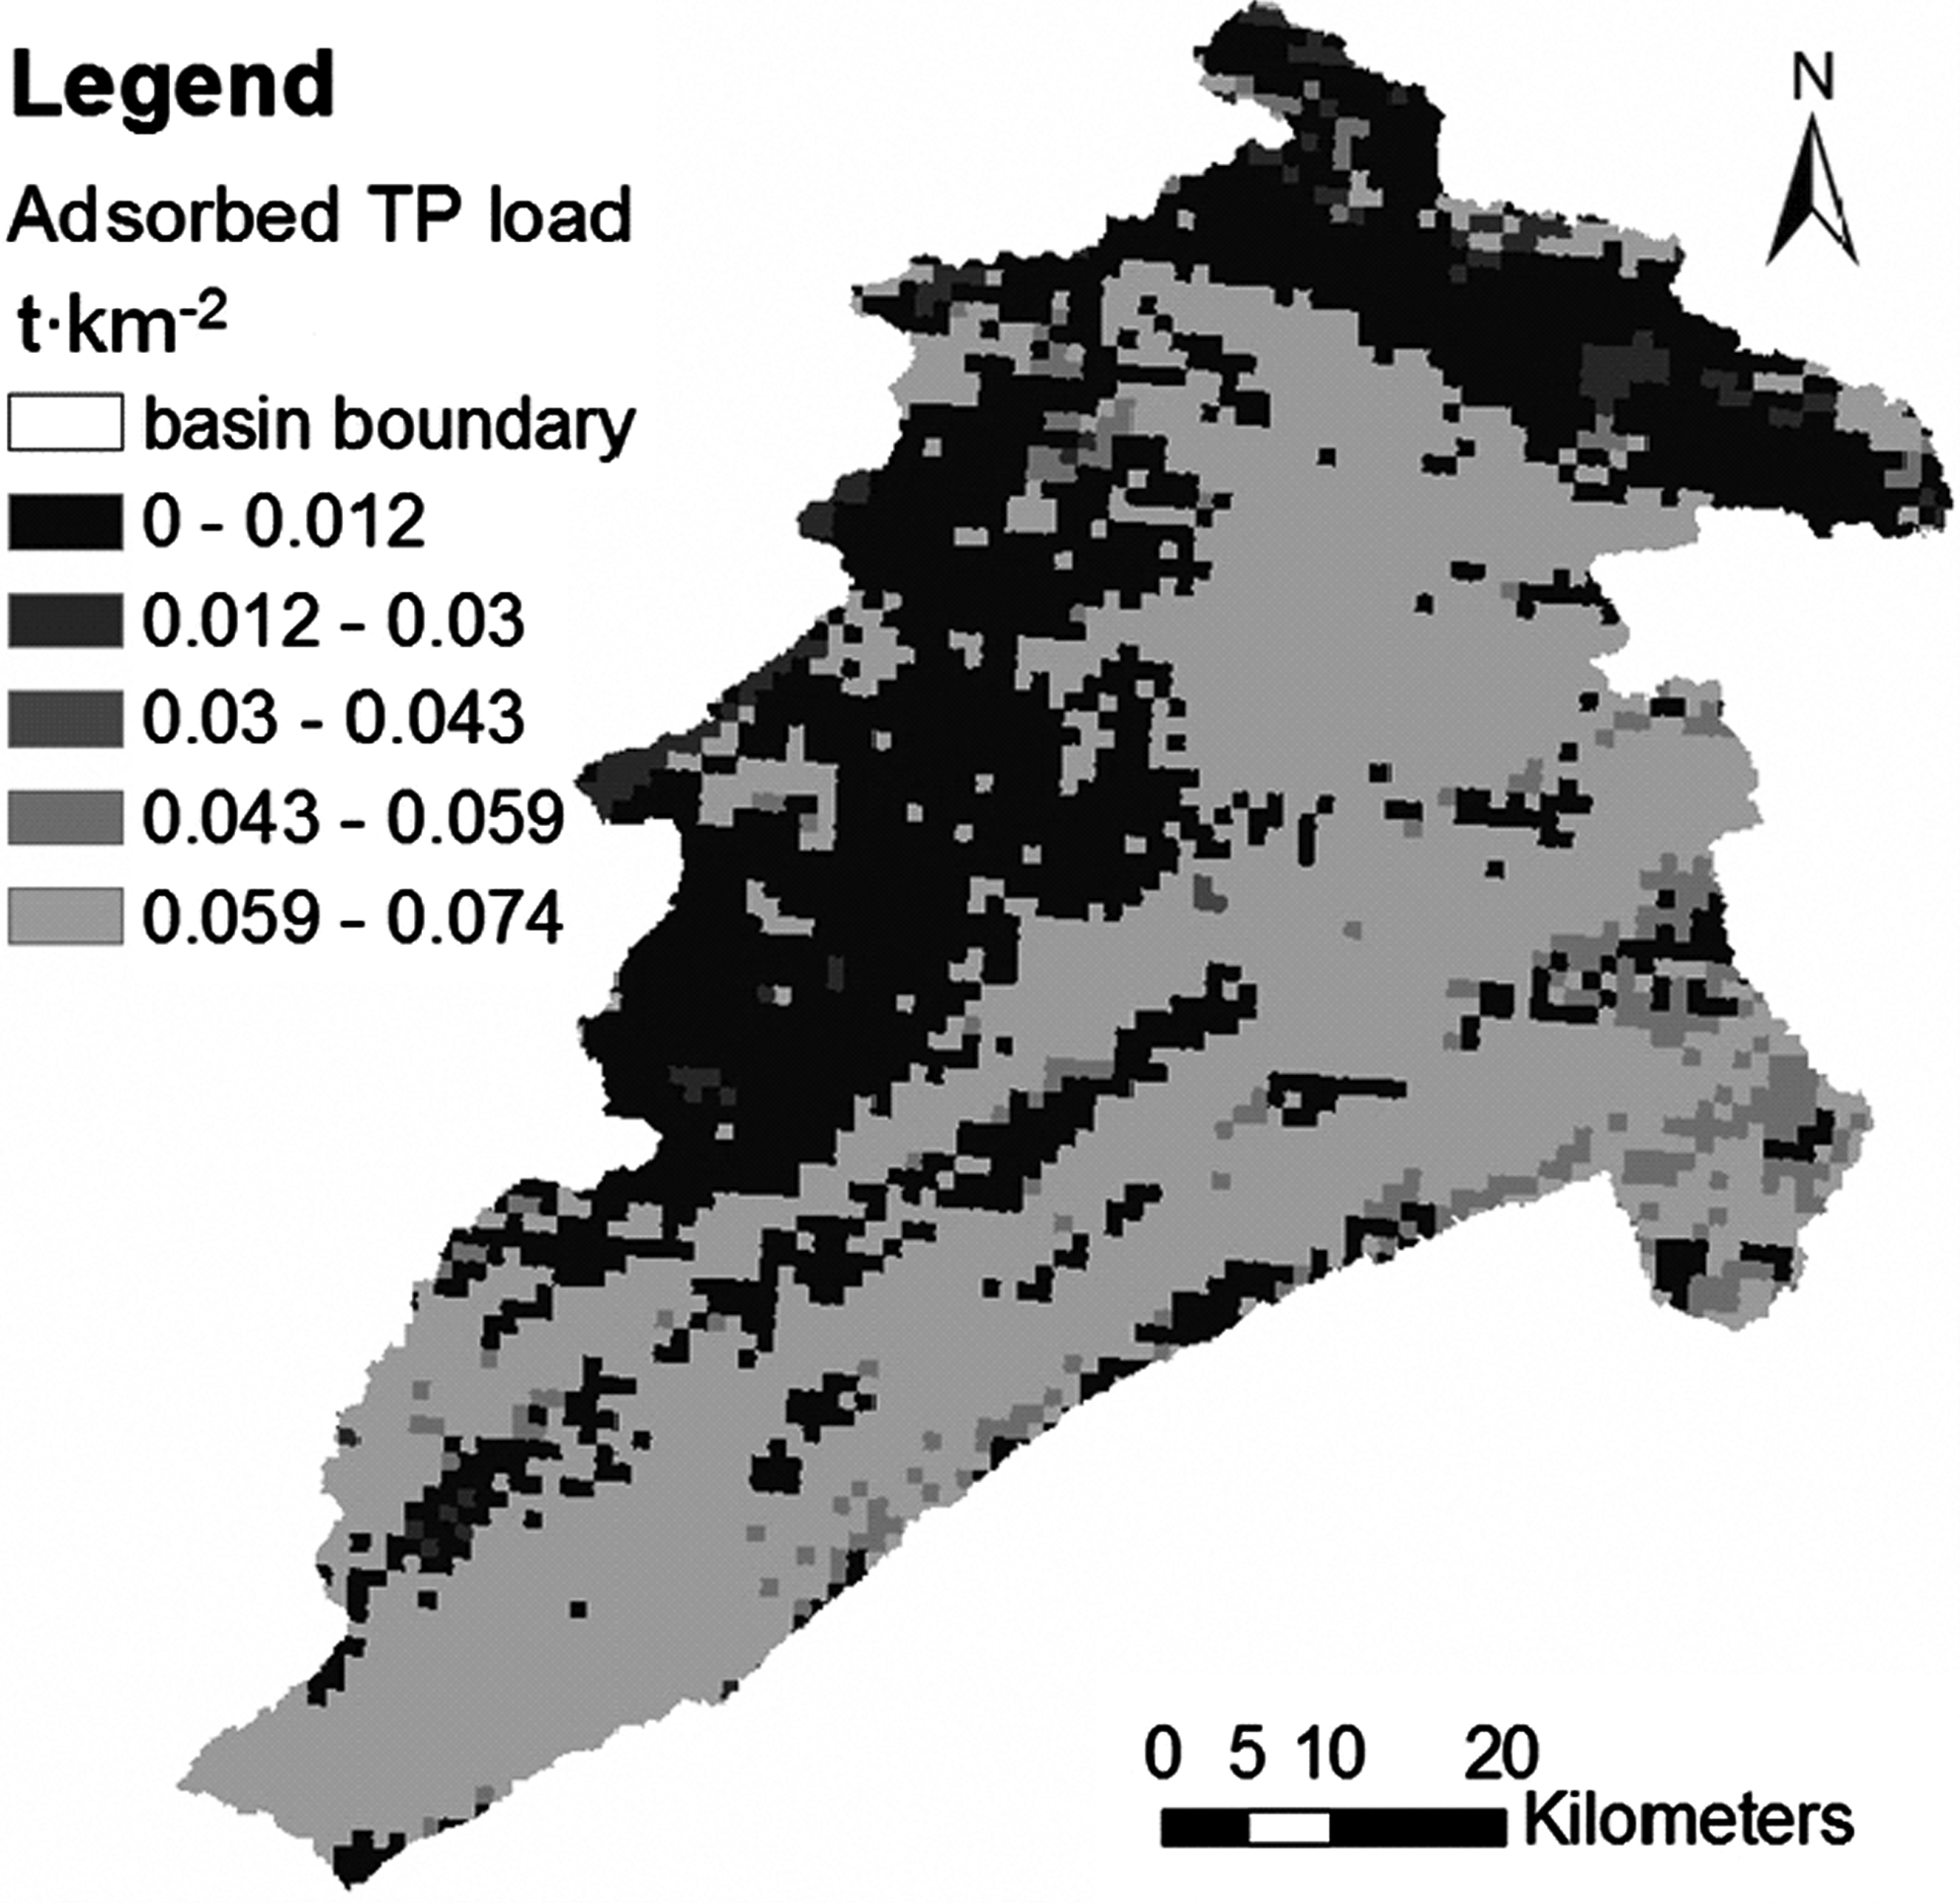
Spatial distribution of adsorbed TP load in 2007.
Model validation
The hydrological estimation method (Chen et al., 2003) was used to estimate the measured data of watershed export, and adsorbed nitrogen and phosphorus NPS pollution load can be derived and obtained through the monitoring water quality data in export section of Xiaojiang. Adsorbed TN pollution load accounts for about 50.74% of the total NPS pollution TN load; it is in accordance with the dissolution and adsorption principles of nitrogen. TP pollution load accounts for the absolute advantage of total NPS pollution load; the result is 85.98%; it is basically the same as the actual situation, and the result is also consistent with the adsorption and dissolution principles of the phosphorus. A sudden increase of the TP load in 2004 from the hydrological estimation is in accord with a sudden increase of the measured TP concentration (Liu and Tan, 1999; Yu, 2005). Seen from Figs. 12 and 13, the relative error is comparatively small, the maximum relative error is −14.5%, and the simulation results are still satisfactory. The reason that variability exists from one year to the next is likely related to yearly differences in rainfall and is especially exacerbated in years of flooding.

Contrast of measured and simulated values of TN load.

Contrast of measured and simulated values of TP load.
Conclusions
1. Modeling is an effective way to study the process of soil erosion quantitatively. Under certain time–space conditions, an integrated methodology was developed for quantification of adsorbed NPS pollution load from watershed due to soil erosion. The rainfall erosivity factor and SDR were selected as important impact factors. Blind number theory was coupled with NPS pollution model to accurately express the uncertainty of parameters, and the use of interval and the corresponding credibility had significant and active effects on the simulation results. Using GIS spatial analysis technology, the factors denoted in the form of intervals had been more in line with the essential; at the same time, the use of the credibility could be better able to indicate the probability about the appearance frequency of data in the factor intervals. Therefore, this article changed the discrete data into continuous gray intervals for each factor, and it took the appearance frequency of each data in interval range as its credibility in gray interval. Overall, the uncertainty method had an important role in the quantitative estimation of absorbed NPS pollution.
2. Adsorbed nitrogen and phosphorus pollution loads from different land use types in descending order in turn were glebe, grassland, paddy fields, forestland, and urban land. The spatial distribution of adsorbed NPS pollution was closely related to the land use distribution in the watershed. Rainfall erosivity R factor and SDR factor were the main parameters affecting soil erosion and adsorbed NPS pollution load. So, parameter uncertainty analysis could be combined with pollution management practices, such as contour farming measures, returning farmland to forest and grass, farmland step project measures and best management practice (BMP), and total maximum daily load (TMDL), to provide a theoretic and scientific basis for controlling NPS nitrogen and phosphorus pollution.
Footnotes
Acknowledgments
This work was supported by National Major Science and Technology Special Projects of water pollution control and management (2009ZX07104-001 and 2009ZX07104-002), and Jiangsu Provincial Key Laboratory of Environmental Science and Engineering Open Issues (Zd91201). This is contribution number 62 from the Urban Water Research Center, University of California, Irvine.
Author Disclosure Statement
No competing financial interests exist.