
Abstract
Abstract
Catalytic incineration of toluene over γ-Al2O3-supported copper–manganese oxide catalysts in the temperature range of 433 K–553 K was investigated using a fixed-bed flow reactor. Catalysts were characterized using Brunauer-Emmett-Teller surface area analysis, scanning electron microscopy, temperature-programmed reduction, temperature-programmed oxidation, X-ray photoelectron spectroscopy, and X-ray diffraction. Incineration of toluene was achieved at temperatures up to 553 K and it was found that the weight ratio of reactants (Cu:Mn) was optimized to be 15:10. Brunauer-Emmett-Teller surface area results had no correlation with the activity of the catalysts. Results of temperature-programmed reduction/temperature-programmed oxidation and X-ray photoelectron spectroscopy showed that the redox peak of the 15Cu-10Mn catalyst shifted at lower temperatures and the binding energy shifted toward higher oxidation levels. These results show that high binding energy and high redox capacity are the causes of high activity. It was assumed that Cu1.5Mn1.5O4 forms the active sites of the catalysts, as confirmed by X-ray diffraction. It seems that the redox activities and the high oxidation state of the catalysts are responsible for catalytic activity.
Introduction
One of the most effective methods of the emission of VOCs is their adsorption using activated carbon followed by thermal and catalytic oxidation. The technique typically requires high temperatures and is, therefore, costly. Alternatively, the use of catalysts that degrade VOCs via oxidation pathways can effectively reduce the required temperature by hundreds of degrees and can save considerable costs and equipment space compared with thermal oxidizers (Patterson et al., 2001; Cooper and Alley, 2002). A number of reports have shown that metal catalysts are useful in the catalytic oxidation of toluene (Scire et al., 2003; Grbic et al., 2004; Rodrigues, 2007; Kim et al., 2008; Masui et al., 2010). These catalysts have high activity, especially at low temperatures. However, due to their high costs and susceptibility to oxidation, they are not the most practical. Metal oxides, on the other hand, are cheaper and much more thermally stable, relative to zerovalent metal catalysts. Further, metal oxides allow higher catalyst loading, which consequently leads to a higher active surface area. For example, Wang's study (2004) showed that CuO/γ-Al2O3 was the most active of the metal oxide catalysts that were tested. Li et al. (2004) found that catalytic conversion of toluene on Mn-Zr mixed oxides that were prepared by the reverse microemulsion method was very high. In addition, Co-doped ZrO2 and Cr-doped ZrO2 catalysts are highly promising catalysts for the combustion of toluene (Choudhary et al., 2004). In a study of the mixed oxide support ZrO2-Y2O3, copper was a powerful catalyst for propene and toluene oxidations (Labaki et al., 2003). Lee et al. (2004) found that zeolite-NaX and zeolite-NaY show catalytic activity for toluene oxidation at a temperature of 250°C. So, transition metal catalysts that were supported on mixtures of metal oxides are highly active for the oxidation of VOCs. Manganese oxides are among the most efficient transition metal compounds in catalytic combustion (Morales et al., 2006). Recent studies have shown that CuOx-MnOx mixed oxides show higher surface areas and high toluene combustion activity. Data now exist on the application of Cu-Mn doped on supports such as Cu-Mn/MCM-41, Cu-Mn/beta-zeolite, Cu-Mn/ZSM-5, and Cu-Mn/porous silica (Li et al., 2006, 2008). Previous research (Kim et al., 2008) has shown that Mn-Ce/γ-Al2O3 are also active in the combustion of VOCs. Although several of the above-mentioned reports have described various oxidation catalysts, little has been done to elucidate the general mechanisms by which these reactions occur.
The objectives of the experiments were characterization and investigation of catalysts composed of varying ratios of copper and manganese supported on γ-Al2O3 using an impregnation method with respect to their actions on the oxidation of toluene. The surface state, adsorption–desorption behavior, and oxidation–reduction characteristics of the catalysts were analyzed by X-ray diffraction (XRD) and x-ray photoelectron spectroscopy (XPS), which the results were effective in assessing the chemical state and active sites of the prepared catalysts.
Experimental
Catalyst preparation
Copper–manganese catalysts were prepared using the standard impregnation method. Aqueous solutions of precursors Cu(NO3)2·3H2O and Mn(NO3)·6H2O were mixed in a ratio of 5:10, 10:10, 15:10, and 20:10 by metal weight percent. The support was used commercial γ-Al2O3 (Aldrich) of 155 m2g–1 Specific Brunauer-Emmett-Teller (BET) powder. Supports and mixed solutions were heated to 343 K for 1.0 h in a rotary evaporator, and the solvent was dried out at 393 K for 24 h. After being pulverized to a particle size of <150 mesh, they were calcined in an oven with the air supply at 773 K for 5 h.
Measurement of activity
The catalysts were tested for toluene oxidation using a Continuous-flow fixed-bed quartz reactor (1/4 inch; Micromeritics). The concentrations of toluene, 79% N2 and 21% O2, were fed to the reactor at controlled rates using mass-flow controllers and passed over the catalyst (100 mg). Gases were analyzed using on-line gas chromatography with flame ionization detectors. These experiments were carried out under the conditions of total gas hourly space velocity 30,000 h–1 and toluene concentrations of 30, 75, and 150 ppm.
The BET surface areas of catalysts were determined by N2 adsorption at 77 K using the ASAP 2400 (Micromeritics).
XRD (PANalytical) measurements were obtained using a PANalytical X'pert PRO MRD system with Cu Kα (λ=0.1543 nm) radiation. The step scans were taken over the range of 2θ angles from 20° to 80° in steps of 0.0167°.
XPS were measured on an Escalab 250 XPS spectrometer (V.G. Scientific) with Al Kα (CAE=50 eV). The binding energy (BE) values were referred to the C1s peak of contaminant carbon at 285 eV.
Temperature-programmed reduction (TPR) of catalysts was carried out at a 10% H2 in Argon flow. Before TPR, 0.1 g of catalyst was treated by flowing O2 at 773 K for 60 min, and then cooled down to room temperature. The catalyst was then heated at a rate of 2.5 K/min, and the flow of reactor gas was controlled with 20 mL/min of H2/Ar gas. The consumed H2 amount was determined by a thermal conductivity detector. The temperature-programmed oxidation (TPO) of catalysts was carried out with 2% O2/He. After measurement of TPR, the catalysts were cooled down to room temperature and then heated at the rate of 3 K/min and performed under the 20 mL/min flow. The O2 consumption amounts were determined by a thermal conductivity detector.
Results and Discussions
Catalytic activity
Toluene oxidations occur at the temperature range of 433 K–553 K over the copper–manganese oxide catalysts as shown in Fig. 1. Complete conversion of toluene was found to occur below 553 K. Any organic intermediates that might be adsorbed on the surface of the catalysts during oxidation were not detected by FT-IR (data not shown). In addition, any other gases except carbon dioxide and water vapor during oxidation were not detected by GC-MS (data not shown). Among the toluene concentrations of 30, 75, and 150 ppm, the catalysts showed their good activity at lower toluene concentrations. These results indicate that increasing reactant concentration and excessive copper content result in diminishing conversion. Similar trends have been previously observed; for example, Kim (2002) observed that increases in reactant concentration results in a decrease in catalytic activity. This result means that the increase of toluene concentration diminishes conversion.
Effect of concentration and temperature of toluene over Cu-Mn catalysts.
Such a phenomenon is observed normally for catalytic oxidation of VOCs. Identical result reported at the lower the concentration, the lower the light-off temperature as reported for the toluene conversion (Okumura et al., 1999). The maximum activity was obtained for the 15Cu-10Mn catalyst. Based on the well-known first-order kinetic equation, the values of reaction constant have been computed. The computed reaction constants for 150 ppm of toluene conversion using 5Cu-10Mn, 10Cu-10Mn, 15Cu-10Mn, and 20Cu-10Mn are 1.09×10⁻⁵, 1.09×10⁻⁵, 2.5×10⁻⁵, and 1.69×10⁻⁵, respectively.
At 150 ppm concentration, the 15Cu-10Mn catalyst achieved nearly 50% toluene conversion at 513 K, and complete toluene conversion was observed at 533 K.
In the catalytic reaction, a high concentration of water is generated. In the pollution control systems of industrial process, water not only reacts with existing materials but also obstructs catalytic reaction. It is important to understand the amount of feasible water in catalytic reaction.
Wang (2004) showed that when water vapor (vol. 10%) was added to a catalyst bed, the conversion of toluene reduced significantly, since H2O adsorbs more strongly than toluene to some active sites. The loss in catalytic activity was attributed to the fact that water molecules adsorb strongly on the active sites. Therefore, we investigated the effects of water vapor on the catalytic activity of the Cu-Mn catalysts. When the catalytic activity reached a steady value at 553 K, water vapor (vol 1%, 5%, and 10%) was introduced to the catalyst bed for 20 h. As can be seen from Fig. 2, addition of 1% water did not affect the conversion of toluene. However, 5% water vapor decreased the catalytic activity after 12 h, by up to 10%, whereas 10% of water vapor decreased the catalytic activity within the first hour and the maximum effect was 20%. Thus, at high water vapor concentrations, the conversion of toluene decreased due to competitive water adsorption. These results clearly demonstrated that the Cu-Mn catalyst is stable in water of low concentration comparatively.
Effects of water content on catalytic oxidation of toluene over 15Cu-10Mn catalyst (water concentration=1%, 5%, and 10%; toluene concentration=100 ppm; reaction temperature=533 K).
XRD
The XRD patterns of the Cu-Mn mixed oxide catalysts are shown in Fig. 3. Most of the diffraction peaks correspond to the spinel phase Cu1.5Mn1.5O4 (JCPDS card number 01-70-0262), and peaks of the CuO phase are also present. The XRD patterns presented here do not show characteristic peaks of manganese oxides. The XRD pattern of 5Cu-10Mn shows that the amorphous phase and the manganese oxide phases are not detected. Thus, even though the amount of manganese is greater than that of copper, manganese oxide phases are not detected. Normally, the <5%-doped sample shows amorphous phase. This probably indicates that manganese ions incorporate in spinel lattice. Morales et al. (2009) investigated that Cu/Mn ratio of 0.2 presented amorphous phase as well as Mn2O3 and Cu1.5Mn1.5O4 phases, which were prepared at calcinations temperature of 1073 K.

X-ray diffraction (XRD) patterns of Cu-Mn oxide catalysts.
Conversely, the XRD patterns at 10Cu-10Mn show crystallization of Cu1.5Mn1.5O4, 15Cu-10Mn, and 20Cu-10Mn catalysts, which comprise Cu1.5Mn1.5O4 as well as CuO. In case of using the urea-nitrate combustion method (Papavasiliou et al., 2005), it was shown that in the spinel phase the Cu1.5Mn1.5O4 existed, but peaks of the Mn2O3 phase are also present. Also, XRD peaks due to CuO or Cu2O oxides are not detected. Alonso et al. (2000) prepared catalysts by mechanical mixing of powder oxides and reported that the chemical composition of these compounds can be varied within a broad range and the copper excess can be absorbed in the lattice without segregation of CuO. From these researches, it is concluded that the XRD phases rely on stoichiometric value and method.
Tang et al. (2006) reported that the diffraction patterns of MnOx-CeO2 mixed oxides at Mn/(Mn+Ce) ≥0.75 show crystallization of Mn2O3, whereas those at Mn/(Mn+Ce) ≤0.5 consist of only broad peaks that they attributed to CeO2 due to the existence of solid solution between Mn2O3 and CeO2. Herein, the variation in the Mn/(Cu+Mn) mole ratios is 5Cu-10Mn:0.7, 10Cu-10Mn:0.54, 15Cu-10Mn:0.44, and 20Cu-10Mn:0.37. In this case of combined Cu-Mn, considering that the ratios of Mn/(Cu+Mn) of the catalysts is <0.75, the crystallization of MnOx is amorphous or small crystallite, but observation of CuO and CuMnOx is expected. Next, these data were compared with Cu/(Cu+Mn) mole ratios, 5Cu-10Mn:0.3, 10Cu-10Mn:0.46, 15Cu-10Mn:0.56, and 20Cu-10Mn:0.63. When the ratios of Cu is >0.5, the crystallization of CuO is detected. These results are expected since some manganese ions are incorporated into Cu1.5Mn1.5O4 spinel structure as similar phenomena with the study of Mn-Ce. We assumed that the small Mn concentration enters the CuO lattice as Mn3+ ions in octahedral positions like in spinels as in the literature (Alonso et al., 2000).
Table 1 summarizes the crystallite ratios of Cu1.5Mn1.5O4 and CuO. As the copper content increases, intensities of CuO characteristic peaks increase and the characteristic peaks of Cu1.5Mn1.5O4 are observed as the main phase. Increase in the CuO phase does not have a main influence on the activity of the catalysts; therefore, the active sites of the catalyst are assumed to be Cu1.5Mn1.5O4 rather than CuO.
–, no data available.
Figure 4 shows a comparison of the changes in diffraction patterns before and after conversion of toluene. The XRD patterns seldom show change in peaks; consequently, the intensity of CuO peaks decreases negligibly after conversion of toluene, but those of Cu1.5Mn1.5O4 show no shift. Thus, it is reasonable to assume that Cu1.5Mn1.5O4 as the active site is very stable and that this stability is responsible for the observed increase in the activity of catalyst.
XRD patterns of 15Cu-10Mn oxide catalyst before and after reaction.
XPS
Information on the chemical state of the surface was obtained using XPS, and the results are shown in Table 2. The BE of Cu 2p3/2 for the 5Cu-10Mn and 10Cu-10Mn catalysts are 932.8 eV, and the BE of Cu 2p3/2 for the 15Cu-10Mn increased as the copper content increased to 933.1 eV. The BE of Cu 2p3/2 for the 20Cu-10Mn decreased to 932.45 eV as the copper content increased. The Cu 2p3/2 region of 5Cu-10Mn, 10Cu-10Mn, and 20Cu-10Mn catalysts indicates the presence of a Cu+/Cu2+ state, and the Cu 2p3/2 region of 15Cu-10Mn catalysts indicates the presence of a Cu2+ state. The BE of Mn 2p3/2 for the catalysts of 5Cu-10Mn, 10Cu-10Mn, 15Cu-10Mn, and 20Cu-10Mn are 641.85 eV, 641.60 eV, 642.15 eV, and 641.45 eV, respectively, whereas the BE of Mn2+ region of Mn 2p3/2 is 641.00 and that of Mn4+ region of Mn 2p3/2 is 642.40. The Mn 2p3/2 region of 5Cu-10Mn, 10Cu-10Mn, and 20Cu-10Mn catalysts indicates the presence of a Mn2+/Mn4+ state, and the Mn 2p3/2 region of 15Cu-10Mn catalyst indicates the presence of a Mn4+ state. Therefore, the BE region of 15Cu-10Mn indicates the presence of a Cu2+ and M4+ state. So, in general, the increase in BE was exhibited with the increase in oxidation state (Niemantsverdriet et al., 2000). The higher oxidation states increase the catalytic activity (Jeon and Seo, 2002). Therefore, the oxidation state is easily reduced and this may suggest that this results in increased catalytic activity.
TPR and TPO
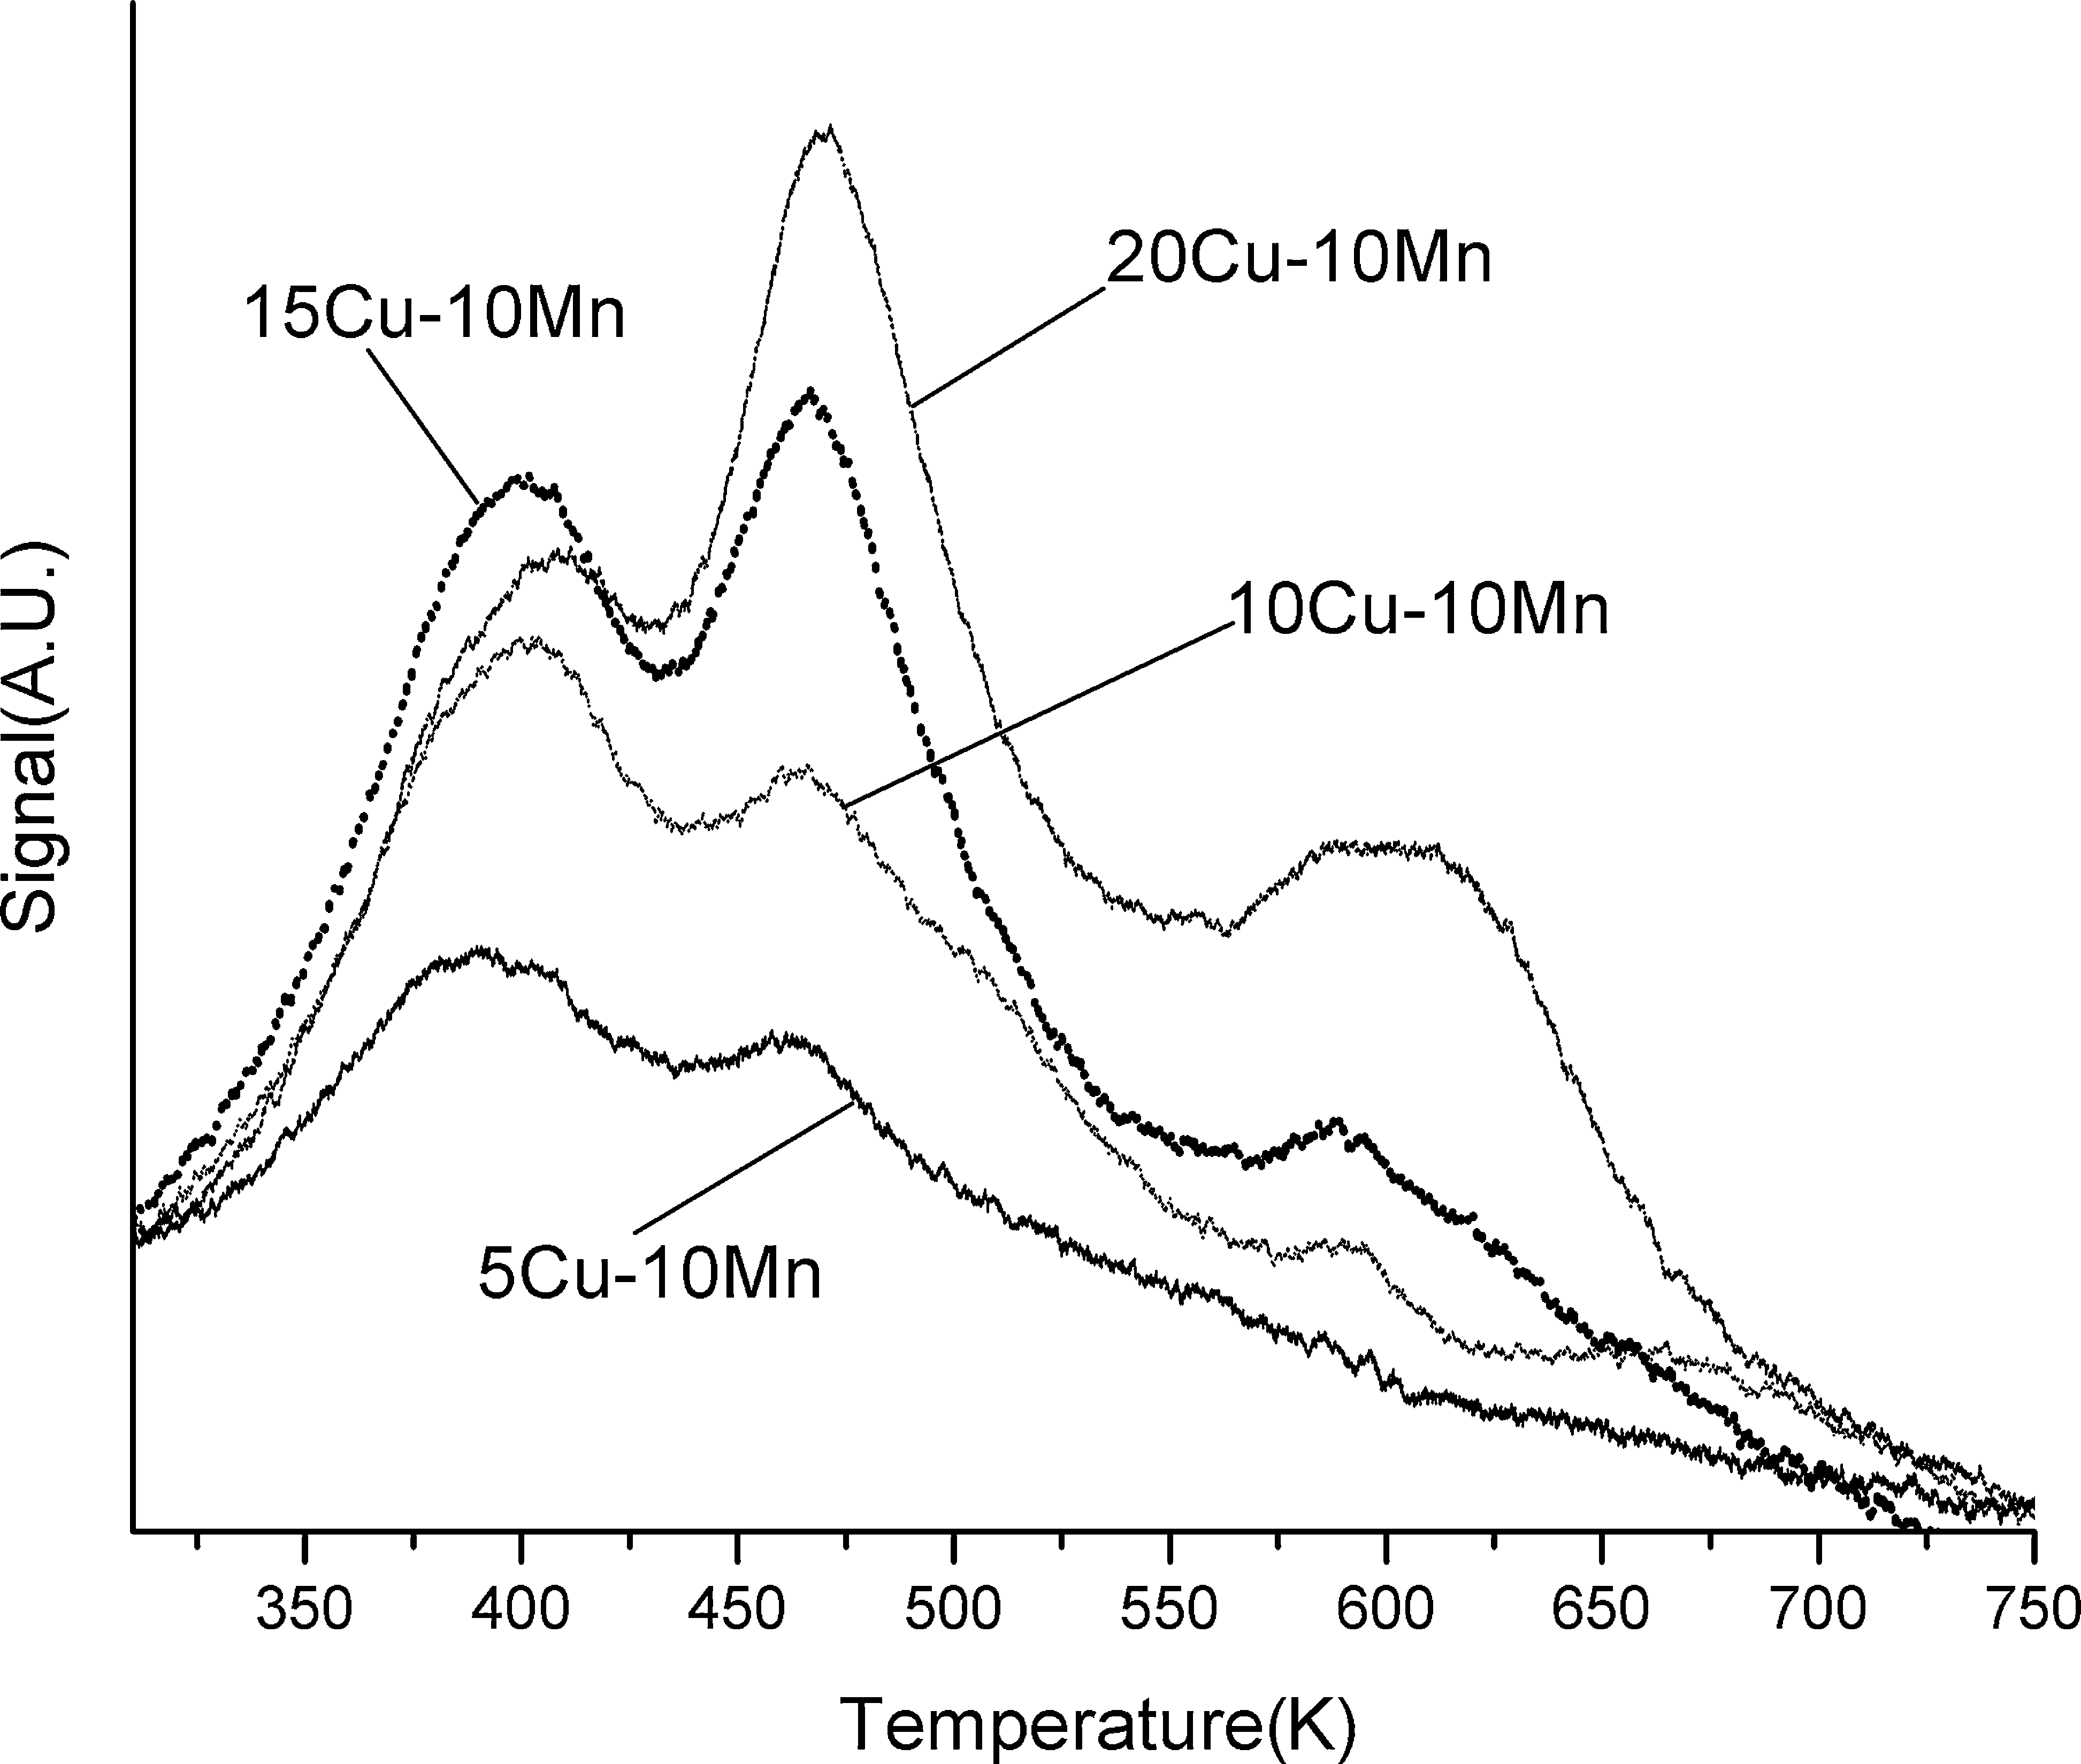
TPR analysis usually shows the degree of reduction of the metal oxides using calculations of the quantity of hydrogen consumed. TPR therefore indicates the possible species produced during calcinations and thus provides insights of possible interactions of different species with the metal oxides. TPR experiments of the prepared catalysts are shown in Fig. 5. From the results of Fig. 5, two H2 consumption peaks at 445 K and 451 K were observed on 5Cu-10Mn catalyst. H2 consumption peaks at 433 K and 519 K were observed at relatively lower temperatures for the 10Cu-10Mn catalyst and at 426 K and 500 K for the 20Cu-10Mn catalyst, whereas the other three peaks at 427 K, 455 K, and 503 K were observed on the 15Cu-10Mn catalyst. At the first reduction peak, the reduction signal of 15Cu-10Mn was greatest in magnitude. From the results shown above, the H2 consumption peaks are sharp, which is characteristic of Cu and Mn oxides. This would indicate that the supported Cu-Mn phase is in the form of bulk-like oxide particles with a low interaction with the support surface (Alvarez-Galvan et al., 2004). After the TPR experiment, TPO experiments were performed to investigate reoxidation characteristics of the catalysts, as shown in Fig. 6; Cu-Mn catalysts were easily reoxidized; and the reoxidation capacity of 15Cu-10Mn catalysts is highest at 373 K–433 K, which is different from that of catalysts with other Cu amounts. Therefore, these results confirm that the activities of catalysts are dependent on their redox properties.
Temperature-programmed reduction curves of Cu-Mn oxide catalysts.
Temperature-programmed oxidation curves of Cu-Mn oxide catalysts.
XRD patterns that correspond to the reduction step of the 15Cu-10Mn catalyst are shown in Fig. 7 and Table 3. In the case of the 15Cu-10Mn catalyst, reduction starts at 350 K, and TPR profile consists of three peaks at 427 K, 458 K, and 500 K. After each reduction step finished, the XRD patterns of catalyst were measured.
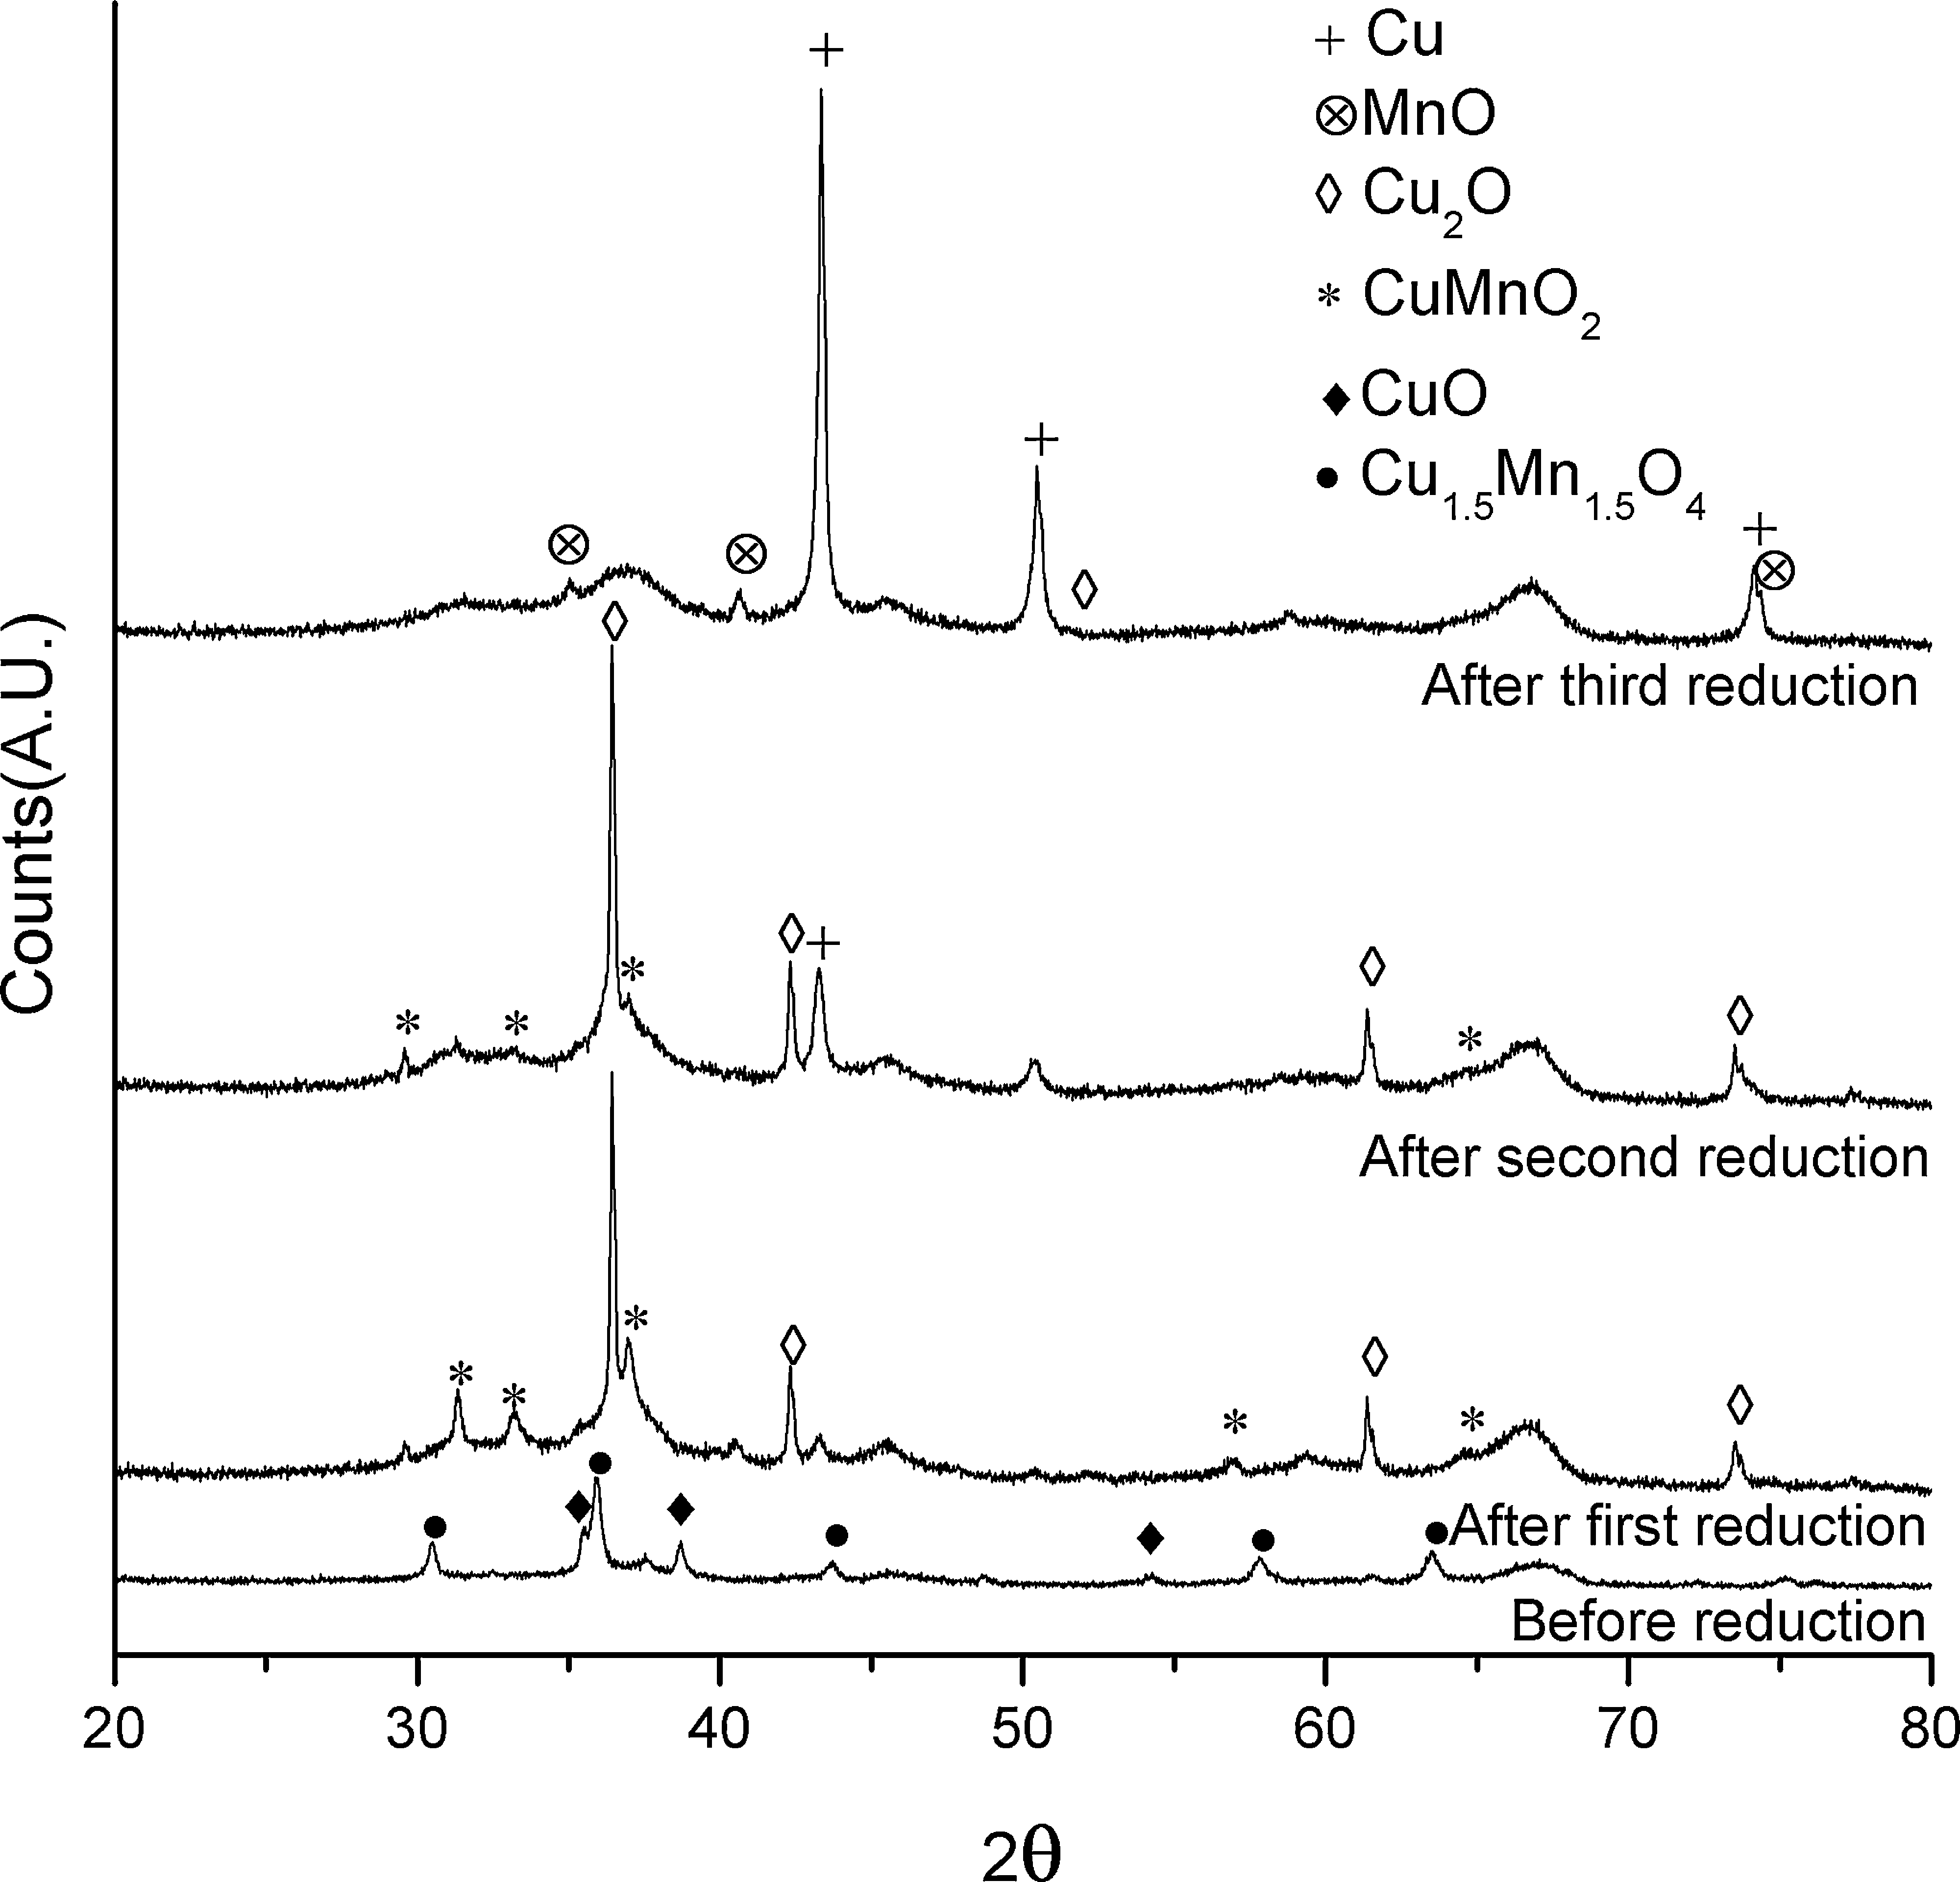
XRD patterns of Cu-Mn oxide catalysts for the reducing step.
In general, TPR profiles of copper oxides exhibit a two-step reduction of the Cu2+ to metallic copper (Cu2+→Cu1+→Cu0), and manganese oxide exhibits a reduction of Mn4+→Mn3+→Mn2+. The TPR profiles of the mixed compounds can be difficult to interpret due to the large number of possible combinations of different oxidation states of copper and manganese over the range of mixed phases that can be present. Amorphous material, in particular, is not generally observable by powder XRD (Mirzaei et al., 2003). The low temperature peaks are considered to correspond to the reduction of Cu2+. In this study, after the first reduction peak, catalysts reduced as follows: CuO→Cu2O and then Cu1.5Mn1.5O4→CuMnO2 and Cu2O. In the second reduction, CuMnO2 was reduced to Cu2O and Cu and the intensity of the CuMnO2 diffraction lines were transformed and decreased. This indicates that the reduction of Cu1.5Mn1.5O4 proceeds easily to Cu at low temperatures. Mn species exist in amorphous states. In the third step, advanced reduction occurs as follows: Cu2O→Cu and CuMnO2→Cu and MnO. From these results, it is assumed that there are probably many active forms of Cu1.5Mn1.5O4 that are capable of oxidizing toluene.
With the aim of uncovering activity-enhancing factors, tests on toluene conversion capacities of 10Mn, 15Cu, 15Cu-10Mn, and 0.5(15Cn-10Mn)-0.5(15Cu) (15Cu-10Mn and 15Cu are mixed 1:1 weight ratios) catalysts were performed. Comparing 15Cu and 10Mn at 500 K shown in Fig. 8, we found that the conversion of 10Mn catalyst is better than 15Cu because the absorption ability of oxygen and toluene at low temperature is high. Above 500 K, the conversion of 15Cu is high because the activity of lattice oxygen of Cu is better than that of Mn. In other words, there is a tendency that lattice oxygen drops off and attaches to catalyst surfaces easily. The toluene conversion capacity of 15Cu-10Mn exceeds that of 0.5(15Cn-10Mn)-0.5(15Cu). Moreover, when the TPR peaks of 15Cu-10Mn, 15Cu, and 15Mn are compared with our result and references (Dow et al., 2000; Hu et al., 2008), the reduction starting peak of 15Cu-10Mn, 15Cu, and 15Mn is activated at 350 K, 440 K, and then 470 K. The first reduction peak is observed at 427 K, 493 K, and then 653 K. These imply that the reduction ability of the Cu1.5Mn1.5O4 catalyst highly influences the catalyst activity. Therefore, it can be reasonably assumed that the most active factor is Cu1.5Mn1.5O4. Accordingly, it seems that the catalytic activity factor is in the order of Cu1.5Mn1.5O4>CuO>MnOx. There is a direct relationship between surface oxygen mobility of the Cu and Mn catalysts and their catalytic activities with respect to the oxidation of toluene. This assumption is quite reasonable, considering that the VOC oxidation occurs through surface lattice oxide ions as the active oxygen species (Scire et al., 2003).

Toluene conversions of single, complex, and mixed catalysts on reaction temperatures (toluene concentration=150 ppm, O2 concentration=21%, and GHSV=30,000 m·h−1g−1).
BET
The BET-specific surface areas of Cu-Mn oxide catalysts are summarized in Table 1. The γ-Al2O3 of 155 m2g−1 surface area was used as support. After Cu-Mn oxides were supported on γ-Al2O3, it was found that the specific surface areas reduced. Further, the surface area gradually decreased as the content of copper in the catalyst mixture was increased. Essentially, the surface area of 15Cu-10Mn, which has the highest catalytic activity observed, was smaller than that of 5Cu-10Mn. Thus, high catalytic activity does not always correspond to high surface area. These results show that the activity of the catalysts can be attributed to the redox activity rather than the surface area.
Conclusions
In this study, catalytic conversion of toluene by Cu-Mn oxides was observed in the temperature range of 433 K–553 K. The 15Cu-10Mn catalyst was shown to achieve a maximum activity: complete toluene conversion was achieved at 533 K. The surface area gradually decreased as the content of copper increased. This indicates that surface area is not a factor as regard to the activity of the catalyst. Most of the diffraction peaks are those of the spinel phase Cu1.5Mn1.5O4, and peaks of the CuO phase are also present. However, peaks of manganese oxides are not detected. After catalytic reaction, the shifting of Cu1.5Mn1.5O4 peaks is not observed. The BE of Cu 2p3/2 and Mn 2p3/2 for the 15Cu-10Mn catalysts is 933.1 eV and 642.15 eV, respectively. The catalysts show high oxidation states and are easily reduced to metallic copper after catalytic oxidation. The specific surface area does not indicate the measured activities significantly, rather high BE and high redox capacity are the causes of high activity. In this regard, the order is Cu1.5Mn1.5O4>CuO>MnOx. The stability of Cu1.5Mn1.5O4 crystal leads to the activity observed at low temperature. Finally, the high activity of the 15Cu-10Mn catalyst on complete toluene oxidation is possibly caused by the presence of the spinel phase and the redox processes.
Footnotes
Author Disclosure Statement
No competing financial interests exist.