
Abstract
Abstract
Constructed wetlands have been popular in ecological engineering regime; yet, modeling the physical, chemical, and biological processes within these wetlands is a long-standing challenge in the past decades. In concert with our field-scale pilot testing of a new-generation subsurface upflow wetland (SUW) system, this article highlights an advancement of modeling the SUW system with a layer-structured compartmental simulation model. This is the first wetland model of its kind to address the complexity between plant nutrient uptake and medium sorption. Such a system dynamics model using STELLA® as a means for a graphical formulation was applied to illustrate the essential mechanism of the nitrification and denitrification processes within a sorption medium-based SUW system, which can be recognized as one of the major passive on-site wastewater treatment technologies in this decade. Model calibration and validation received fairly good R-squared values of 0.9998 and 0.9644, respectively. Such good agreement with the measured data confirms that the developed system dynamics model may provide a reliable tool for designing this particular type of constructed wetland. This work also entails the significant movement of linking green building with green infrastructure as part of the urbanization for nature.
Introduction
Within the constructed wetland, the transition of nitrogen from one phase to another is commonly referred to as the nitrogen cycle. Ammonia combines with organic materials to create ammonium (NH4+). In the presence of ammonia-oxidizing bacteria and nitrite-oxidizing bacteria, ammonium is converted to nitrite (NO2−) and further to nitrate (NO3−). These two reactions are collectively called nitrification. Denitrification, conversely, performed by denitrifying community, is an anaerobic respiration process using nitrate as a final electron acceptor and results in stepwise microbiological reduction of nitrate, nitrite, nitric oxide, and nitrous oxide to nitrogen gas (N2) (Koike and Hattori, 1978). Nitrate removal rates are directly influenced by the slow-growing bacteria that govern nitrification and denitrification.
The term residence time distribution (RTD), characterizing chemical reactors, was first proposed by Danckwerts (1953), which was oftentimes used to discuss the type of mixing in constructed wetland (Werner and Kadlec, 1996). The RTD function is generally measured by injecting an impulse of tracer and measuring the tracer concentration as a function of time at interior wetland points as well as the outlet. Many wetland systems were modeled as a number, N, of stirred tank reactors in series. In fitting experimental data, the form for the Tanks-In-Series model is given by Kadlec and Wallace (2008).
Equation (1) can be considered as single continuous stirred tank reactor (CSTR) when N = 1 and the plug flow reactor, N = ∞ .
In the earlier stage of designing the treatment model, the constructed wetlands were considered as a black box. Scientists focused on the influent and effluent concentration and fit the result with the designed linear or power equation to build the relationship between them. Table 1 shows the regressions for wetland nitrogen and phosphorus removal of subsurface flow (SSF) wetlands (Kadlec and Knight, 1996). This kind of model oversimplified the constructed wetland treatment system, which has an extremely complicated physical, chemical, and biological process. Not only the influent concentration and hydraulic retention time but also hydrodynamic conditions, such as wetland dimension, porosity, and conductivity of media, can affect the removal efficiency of pollutants of concern. Gradually, the first-order kinetics equation or Monod type equations were widely accepted and applied to replace the regression method. Kadlec and Knight (1996) had summarized the nitrogen removal equations of modeling the constructed wetland (Table 2).
C2, concentration at the outlet; C1, concentration at the inlet; q, hydraulic loading rate.
KDENITRN = denitrification half-saturation constant, mg/L.
KORGC = ON half saturation constant, mg/L.
kON, kAN = first–order ON, ammonium loss rate, g/m2/year.
CAN, CDO, CNN, CORGC, CON = concentration of ammonium, DO, nitrite+nitrate, organic carbon, ON, mg/L.
CANi, CONi = inlet concentration of ammonium nitrogen, ON, mg/L.
Q/A = hydraulic loading rate.
DO, dissolved oxygen; ON, organic nitrogen.
Tunçsiper et al. (2006) simulated removal efficiencies of nitrogenous pollutants in SSF and FWS constructed wetland systems. Two types of the models (first-order plug flow and multiple regressions) were used to evaluate the system performances. Nitrification, denitrification, and ammonification rate constants values in SSF and FWS systems were 0.898 day−1, 0.486 day−1, and 0.986 day−1, and 0.541 day−1, 0.502 day−1, and 0.908 day−1, respectively. They found that the first-order plug flow model clearly estimated slightly higher or lower values than observed when compared with the other models. Jou et al. (2008) tried a constructed wetland for restoring a creek. The ecological treatment system removed 64.0% of suspended solids, 43.0% of biochemical oxygen demand (BOD), and 11.0% of ammonia nitrogen. A first-order biokinetic model was used to estimate the reductions of BOD and nitrogenous BOD. They reported that the first-order biokinetic model appeared useful for estimating BOD and nitrogenous BOD reductions in a constructed wetland. However, the fatal limitation of the first-order kinetics is that the constructed wetland system is required to keep the same flow rate, concentration, and ideal plug flow. To make the dynamic modeling of the constructed wetland processes more acceptable and flexible, Pastor et al. (2003) proposed the design optimization of constructed wetland for wastewater treatment by combining a first principal model and an artificial neural network, which had a main advantage for better representing highly nonlinear multiinput/multioutput system. Tomenko et al. (2007) compared multiple regression analysis and two artificial neural networks-multilayer perceptron and radial basis function network in terms of their accuracy and efficiency when applied to prediction of the BOD concentration at effluent and intermediate points of subsurface flow constructed wetlands. The dataset was normalized and transformed using principal component analysis to increase the efficiency of the modeling. Artificial neural network models were eventually cross-validated to find optimal network architectures and values of training algorithm parameters.
The models mentioned above just provide a limited understanding of specific items, which were even separately analyzed. The mechanistic approach for modeling constructed wetland systems has been highly regarded by people who prefer mystery of the whole wetland treatment process. Wynn and Liehr (2001) developed a mechanistic compartmental simulation model, which included six linked submodels: the carbon cycle, the nitrogen cycle, a water balance, an oxygen balance, autotrophic bacteria growth, and heterotrophic bacteria growth. Darcy's law was used to describe the flow through the media. The wetland was regarded as either a single CSTR or a series of CSTRs instead of plug flow reactors, which was considered to be a better reactor model for simulating nonideal plug flow. Monod kinetics was utilized to describe microbial growth rate. Transformations, such as nitrification and denitrification, were then linked directly to microbial growth. In general, except for the oxygen, the result of effluent BOD, organic nitrogen (ON), ammonium, and nitrate concentration fit the model well.
Langergraber (2001) presented a multicomponent reactive transport module CW2D to model the biochemical transformation and degradation processes in SSF constructed wetlands (CWs). The mathematical structure of CW2D was based on that of the ASMs (Henze et al., 2000). The CW2D consisted of 12 components, 9 process, and 46 parameters. The HYDRUS-2D was incorporated by using Richards equation to describe the variably saturated water flow conditions. Water uptake by plant roots was accounted as a sink term in the flow equation. The components considered ammonium, nitrite, nitrate, and nitrogen gas; dissolved oxygen (DO); organic matter; inorganic phosphorus; and heterotropic and two species of autotrophic microoranisms. The rates of the biochemical elimination and transformation processes were described by using Monod-type of equation. Recently, Giraldi et al. (2009a, 2009b) developed a mathematical model (FITOVERT) to analyze the hydrodynamics of a one-dimensional vertical flow CW under three different saturation conditions: complete saturation, partial saturation, and complete drainage by dosing rhodamine WT in steady state conditions. Richards equation was used for modeling the variably saturated conditions, while van Genuchten-Mualem functions was used to describe the relationships between pressure head, hydraulic conductivity, and water content. In particular, the porosity reduction due to bacteria growth and accumulation of particulate component (i.e., clogging process) can be simulated by FITOVERT. When researchers revel in improving CWs, the complexity of the latest generation model insensibly deters the public prevalence of the CW model application. Massive complicated partial differential equation let the CW engineer flinch, which ties up the development of CW design and operation. The limited useful results from real practice further retard the calibration and optimization of the theoretical modeling work. To break this vicious cycle, some intuitive and accessible model should be developed to fit the gap. The objective of this research is to develop a simplified compartmental dynamics simulation model of subsurface upflow wetlands (SUWs) to provide a dependable reference and tool for design of SUW, a competitive candidate of on-site wastewater treatment technologies.
Facility and Sampling Method
Site description
In this study, a subsurface upflow constructed wetland (SUW) system receiving septic effluent from a student dormitory handled 454 L (120 gallons) per day influent for a wastewater treatment study using the green sorption medium along with plant species. The wastewater was intermittently pumped into the constructed wetland by about 15.12 L (4 gallons) at a time. It had been shown that green sorption medium consisting of recycled and natural materials provides a favorable environment for nutrient removal (Xuan et al., 2009). There were four parallel cells in this test bed each with the dimensions of 1.52 m wide × 3.05 m long × 0.91 m deep (5 ft wide × 10 ft long × 3 ft deep). Each of four cells consisted of an impermeable liner, a gravel substrate layer, a sand layer, a green sorption medium layer, a growth medium layer, and selected plants, and a gravel-filled gravity distribution system including header pipe, distribution pipe, collection pipe, flow meter, and a planted bed of the special green sorption medium with an underdrain collection system. Two polyvinyl chloride pipes with fabric filter at bottom were inserted into the gravel layer close to the inlet of each cell to introduce more oxygen for promoting nitrification. Three sets of plant species were tested against the control case where there was no plant species (Xuan et al., 2009).
The main criteria for choosing plants in this study included (1) native—long-term survival or minimal environmental problems; (2) perennial—function all year long and do not need to replant after harvesting; (3) good rooting system—help nitrification; (4) high yield—evaporate more water since yield and water use are closely correlated (i.e., this criterion is flexible); (5) high protein content—plant will take more nitrogen since protein content is correlated with nitrogen content; and (6) tolerate trimming or grazing—harvest biomass and consequently remove nutrients. Three kinds of herbaceous perennial plants, Canna (Canna flaccida), Blue flag (Iris versicolor L.), and Bulrush (Juncus effusus L.), were eventually selected due to the features of the local availability, biomass production, nutrient content, and the similar size. Seedings of those three kinds of plant were purchased from local nursery and planted 2 months before the experiment period. Since the wetland plants had been acclimated and taken shape during the experiment, the plant growing rate was treated as a constant for simplification. The research team at University of Central Florida decided to follow six criteria to screen those possible sorption media to support both pollution control and plant growth: (1) the relevance of nitrification or denitrification process or both, (2) the hydraulic permeability, (3) the cost level, (4) the removal efficiency as evidenced in the literature with regard to adsorption, precipitation, and filtration capacity, (5) the availability in Florida, and (6) additional environmental benefits. All of the four treatment units (cells) in our wetland system were filled from bottom to top with gravel, sand, “Pollution Control Media” denoted as PC medium hereafter, and “Expanded Clay Growth Media” denoted as G medium hereafter. The 15.24 (6-inch) sand layer had the main function of removing the pathogen from the septic effluent and worked as a buffer layer between gravel and PC medium layers. A 30.48 cm (12 inch) layer of the PC medium (50% Cytrus grove sand, 15% tire crumb, 15% sawdust, and 20% lime stone) was used to remove most of the nutrients, total suspended solid, and BOD, at the depth of 30.48 cm (12 inches) beneath the G medium layer. At the top place, a 30.48 cm (12 inch) growth medium layer (75% expanded clay, 10% vermiculite, and 15% peat moss) was used to support the root zone. Since nitrification is considered to be the primary rate-limiting step for nitrogen removal unless the wastewaters are prenitrified or the oxygen can be diffused more efficiently into the upper layer of the root zone via some specific growth medium, the expanded clay growth medium was used to ensure vibrant plant growth and the efficient oxygen diffusion. Once the wastewater fully saturated the gravel layer, the water level would rise up gradually, passing through the sand and PC medium layer up to the outlet (Fig. 1). Chowdhury et al. (2008) reported a bromide tracer study in a similar SUW. They found that a gravel layer added at bottom caused the flow to be mostly in the vertical direction, which provided strong evidence for our hydraulic pattern hypothesis. The samplers were installed at the interface between different layers with three depths. Horizontally, the samplers in the four wetland cells were located at 33%, 67%, and 100% along the length of the wetland. Sample identities (IDs) here were defined for following discussion as below: (1) port B—mixture of bottom three samples; (2) port M—mixture of middle three samples; and (3) port T—mixture of top three samples. Figure 1 illustrates the wetland configuration in this study.

Locations of the sample points in the wetland cross section (Xuan et al., 2009).
Sampling and analyses
The water quality in wetland system was monitored weekly from September 2 to September 30 in 2009. DO, pH, and temperature were measured on site by HACH HQd field case. Besides, a 24 h composite sample was taken from every sampling port periodically for measuring ammonium–nitrogen (NH4+), nitrite–nitrogen (NO2-N), nitrate–nitrogen (NO3-N), total nitrogen, and total phosphorus. The amount of the sample was taken in proportion to the actual waste load. A clean polyethylene jug was used to store each sample for other parameters analysis. Once the samples were taken, the containers would be stored at a chilled cooler (4°C) until the 24 h composite samples were completed. Samples that require appropriate preservatives were taken care of according to quality assurance/quality control (QA/QC) protocol: 200 mL of each sample must be filtered through a 0.45 micron filter; 100 mL of the filtered samples shall be preserved at pH <2.0. Each sample was delivered to the external certified laboratory in an appropriate ice chest within the same day to ensure the integrity of the samples. At the beginning and the end of the study period, plant samples were collected randomly in a 30 × 30 cm2 area and analyzed for measuring nitrogen content in plant tissue. Plant samples were sent to an agricultural lab located in Orange City, FL.
Development of System Dynamics Model
System dynamics, being designed based on system thinking, is a well-established methodology for studying and managing complex feedback systems. It requires constructing the unique causal loop diagrams or stock and flow diagram to form a system dynamics model for applications (Forrester, 1961, 1968; Randers, 1980; Vizayakumar and Mohapatra, 1993). System dynamics modeling has been used to address practically every sort of feedback system the application matrix has covered several issues, including environmental impact analysis of coalfields (Vizayakumar and Mohapatra, 1991, 1993), lake eutrophication assessment (Vezjak et al., 1998), pesticide control (Ford, 1999), wetland metal balance (Wood and Shelley, 1999), groundwater recharge (Abbott and Stanley, 1999), lake watershed management (Guo et al., 2001), river pollution control (Deaton and Winebrake, 2000), and solid waste management (Mashayekhi, 1993; Sudhir et al., 1997; Karavezyris et al., 2002; Dyson and Chang, 2005).
As one of the most advanced graphical system programming dynamic software packages, STELLA® was used to develop the mathematical model for the SUW in this study to address mechanistic processes. It shows a very friendly intuitive icon-based graphical interface. As icons of stock and flow are drawn on front canvas layer, model equations are automatically generated on the equation layer beneath. Simulation runs can be carried out entirely along the prescribed timeline. Results can be presented via graphs, tables, and animations with the running simulation.
Conceptual model
There are five main nitrogen transformations in constructed wetlands (Kadlec and Wallace, 2008).
ON to ammonium nitrogen (ammonification or mineralization). ON cannot be extracted by plants directly but is gradually transformed to NH4+ by heterotrophic microorganisms:
Ammonium nitrogen to nitrate nitrogen (nitrification). In aerobic oxidized condition, ammonium transforms to NO3− through the process of nitrification in two steps by ammonia-oxidizing bacteria:
and by nitrite-oxidizing bacteria:
When there is adequate oxygen available, nitrification can also occur in the oxidized rhizosphere of plants.
Nitrate nitrogen to gaseous nitrogen (denitrification). Denitrifiers use the oxygen from NO3− instead of O2 to convert NO3− to nitrogen oxide and N2.
Nitrate or ammonium nitrogen to ON (assimilation or immobilization). Immobilization can be considered as the reverse reaction of mineralization. Inorganic nitrogen (NO3− and NH4+) is converted to ON by microbes and used by plants, which roughly is counted as plant uptake in the model.
Biomass nitrogen to ON (decomposition). Since the plant grew well and had no residue in late summer, this part of nitrogen transformation can be ignored.
Assume that each medium layer was a CSTR. On the basis of the above understanding, the conceptual model for nitrogen removal of SUW is shown in Fig. 2.
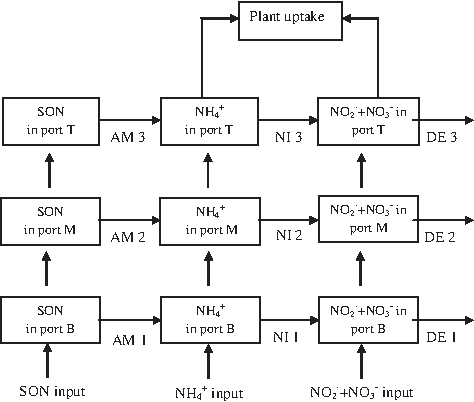
General conceptual model of nitrogen removal in subsurface upflow wetland. SON, soluble organic nitrogen; AM, ammonification; NI, nitrification; DE, denitrification.
Implementation of system dynamics model
The stock and flow diagram of nitrogen removal in SUW using STELLA simulation program is presented in Fig. 3, in which the modeling structure follows the layered structure for nitrogen removal. Note that Table 3 shows the description of symbols in Fig. 3 by taking the sand layer as an example.
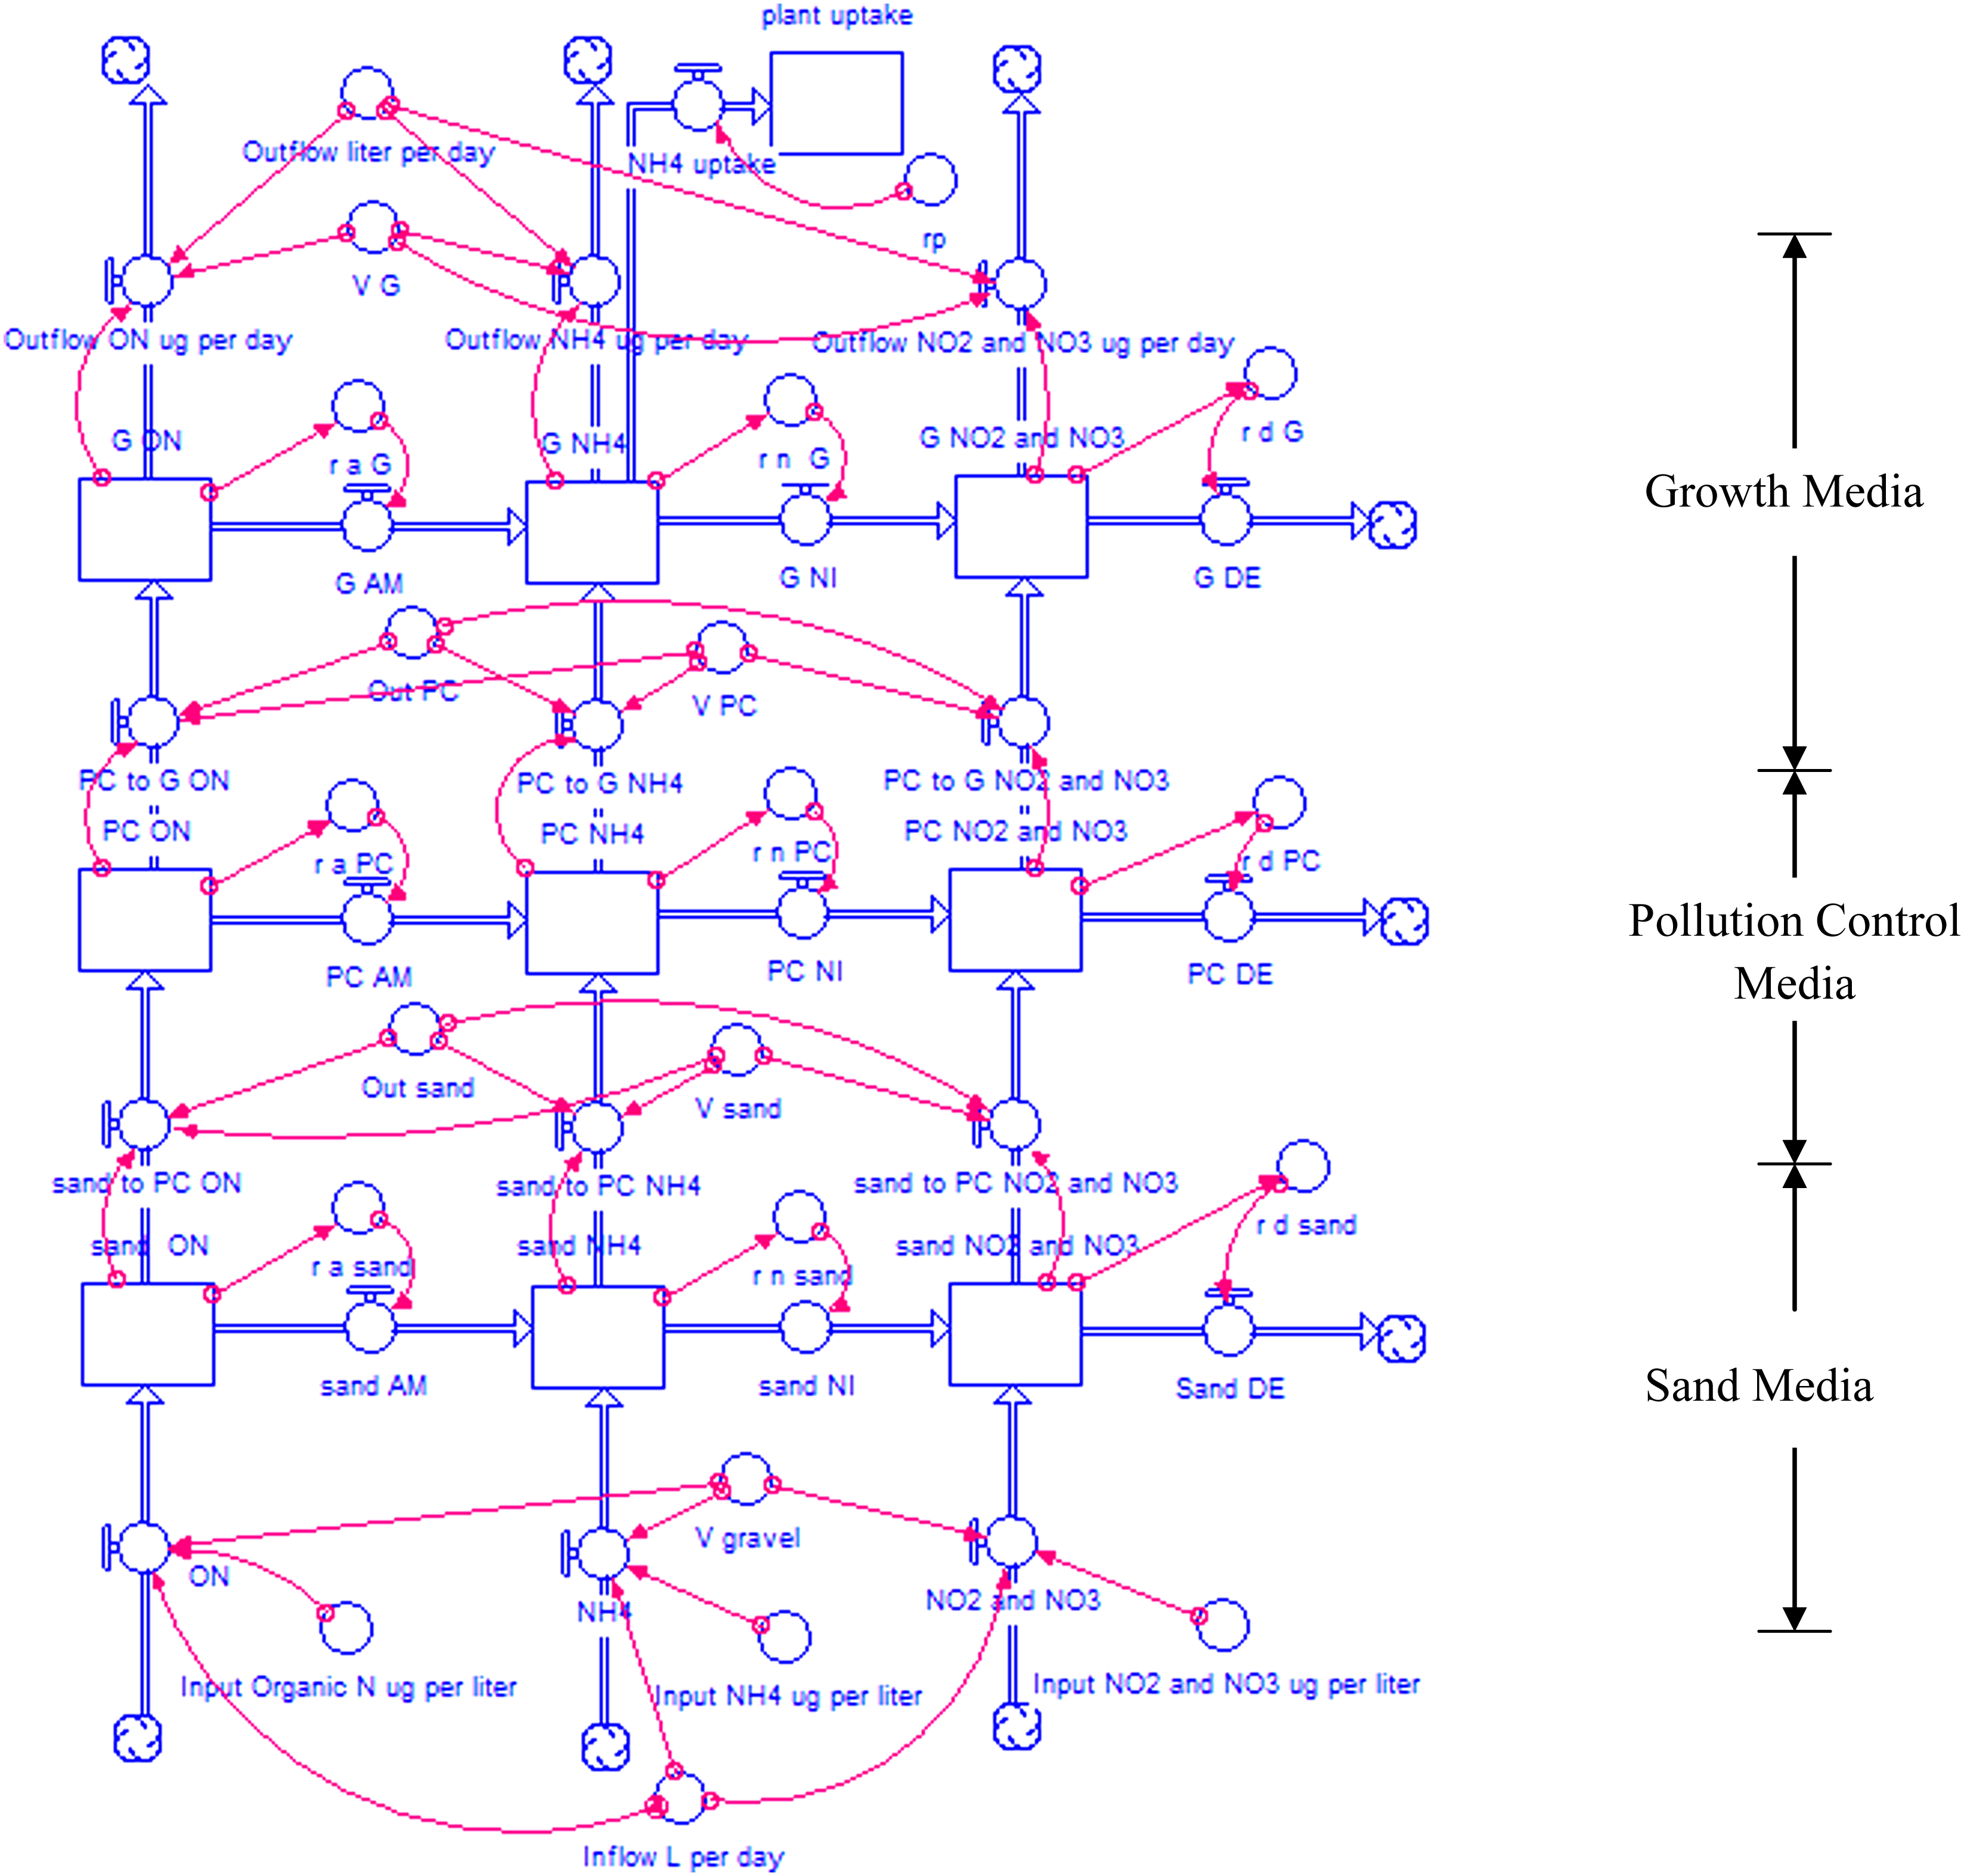
Flow diagram of nitrogen removal model.
Model equations
The equations below are used to predict the ON, NH4, and the sum of nitrite and nitrate (NO2 + NO3). The unit form μg/L/day was used for all flows and stocks. Only plant uptake is a real and ultimate stock (Fig. 3). The rest of nine stocks have their own outflow to reach a steady state condition. Thus, the value in stock can be represented as the instantaneous concentration in a unit volume or a point (i.e., sampling port). Assume that the upflow rate decreased linearly due to the evapotranspiration and plant uptake with the increase of the water level. V is considered as the effective volume (product of volume and porosity) of each layer where water flows. The NO2 + NO3 concentrations in all layers are so low that the NO2 + NO3 uptake by plant is negligible. Figure 4 shows the model equations automatically generated in the Equation interface of STELLA with the measured data as initial value. In our study, September was picked as the experiment period, when wetland plants had been taken shape. So we assume a constant rate of biomass production for simplification. The rest of parameters need to be measured or assumed so that they may be determined holistically via the model calibration stage as summarized by Table 4.
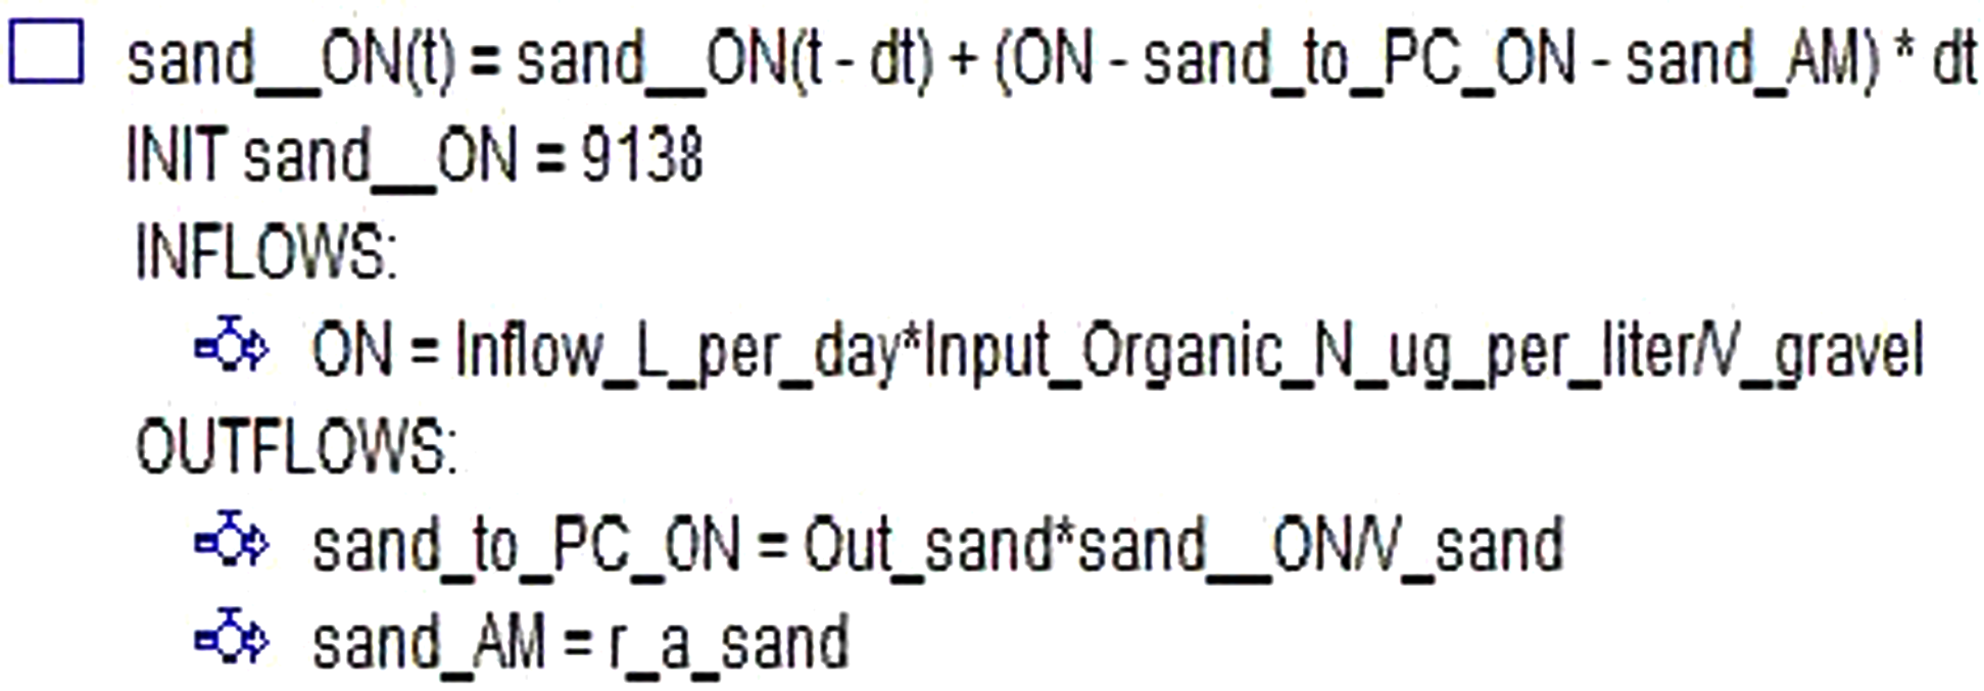
Model equation related to “sand ON” stock.
Results and Discussion
Model calibration
Wetland cell 1 was selected to develop the system dynamics model. Since we assume a constant rate of plant growth, the third run considered to have the average rate of plant growth was used to do the model validation in the next subsection. The average values of results from the other three runs and the hydraulics values listed in Table 5 were used to calibrate the SUW nitrogen removal dynamic model. Runge-Kutta 4 was used as the integration method. The nitrification has a wide range of optimum pH of 7.0–9.0 (Sajuni et al., 2010). The pH below 7.0 adversely affects ammonia oxidation (Lin and Lee, 2001). Besides, the empirical formula is valid for water temperatures between about 5°C and 30°C. The expression of nitrification rate was finally reorganized as Equation (11). The model calibration started from adjusting the ammonification rate (i.e., the nutrient source, ON, in sand layer) to minimize the discrepancies between modeled and measured values. Then, the model calibration can be moved on along the direction of nutrient transport (i.e., from bottom to top) and nitrogen transformation (i.e., from left to right) in relation to all three parameters of interest. The three parameters were intimately related to rate of ammonification, nitrification, and denitrification, and their final values were determined within an effort of model calibration based on other measured parameter values assigned in Table 6. After such errands of model calibration, the final agreement between the measured and simulated values of ON, ammonium (NH4), and the sum of nitrite and nitrate (NO2 + NO3) is shown in Fig. 5. The slope of the regression line was 0.9791, and the correlation (R2) was 0.9998, which supports the model calibration.
CT = e0.098(T−15), for T < 30°C;
CT = e0.098(30−15), for T ≥ 30°C;
CpH = 1 − 0.833 (7.0 − pH), for pH < 7.0;
CpH = 1, for pH ≥ 7.0;

Correlation between the measured and simulated values in model calibration.
Measured: Measured by each researcher according to his or her experimental set up.
Optimized: Derived based on the best fit of local data.
N/A, not applicable.
Model validation
The experimental data for third run were used for model validation. Table 7 lists the measured environmental values of the third run. The correlation between the measured and simulated values is shown in Fig. 6. The slope of the regression line was 0.9532 and correlation (R2) was about 0.9644, which shows the model validation, corroborating previous calibrated data shown in Table 6. The values of sum of nitrite and nitrate (NO2 + NO3) led to a slightly lower R2 value. The extremely low concentration, which is close to the lower detection limit, might increase the deviation. The ammonification rate constant (ka) in PC medium increased up to fivefold compared with that in sand layer. The denitrification rate constant in PC medium was 30% more than that in sand layer and three times as much as in G medium. May et al. (1990) found that most nitrifiers were associated with roots rather than the gravel layer. Similarly, we found higher specific yield of nitrification rate (uN/YN) in G medium, which is the root zone layer.
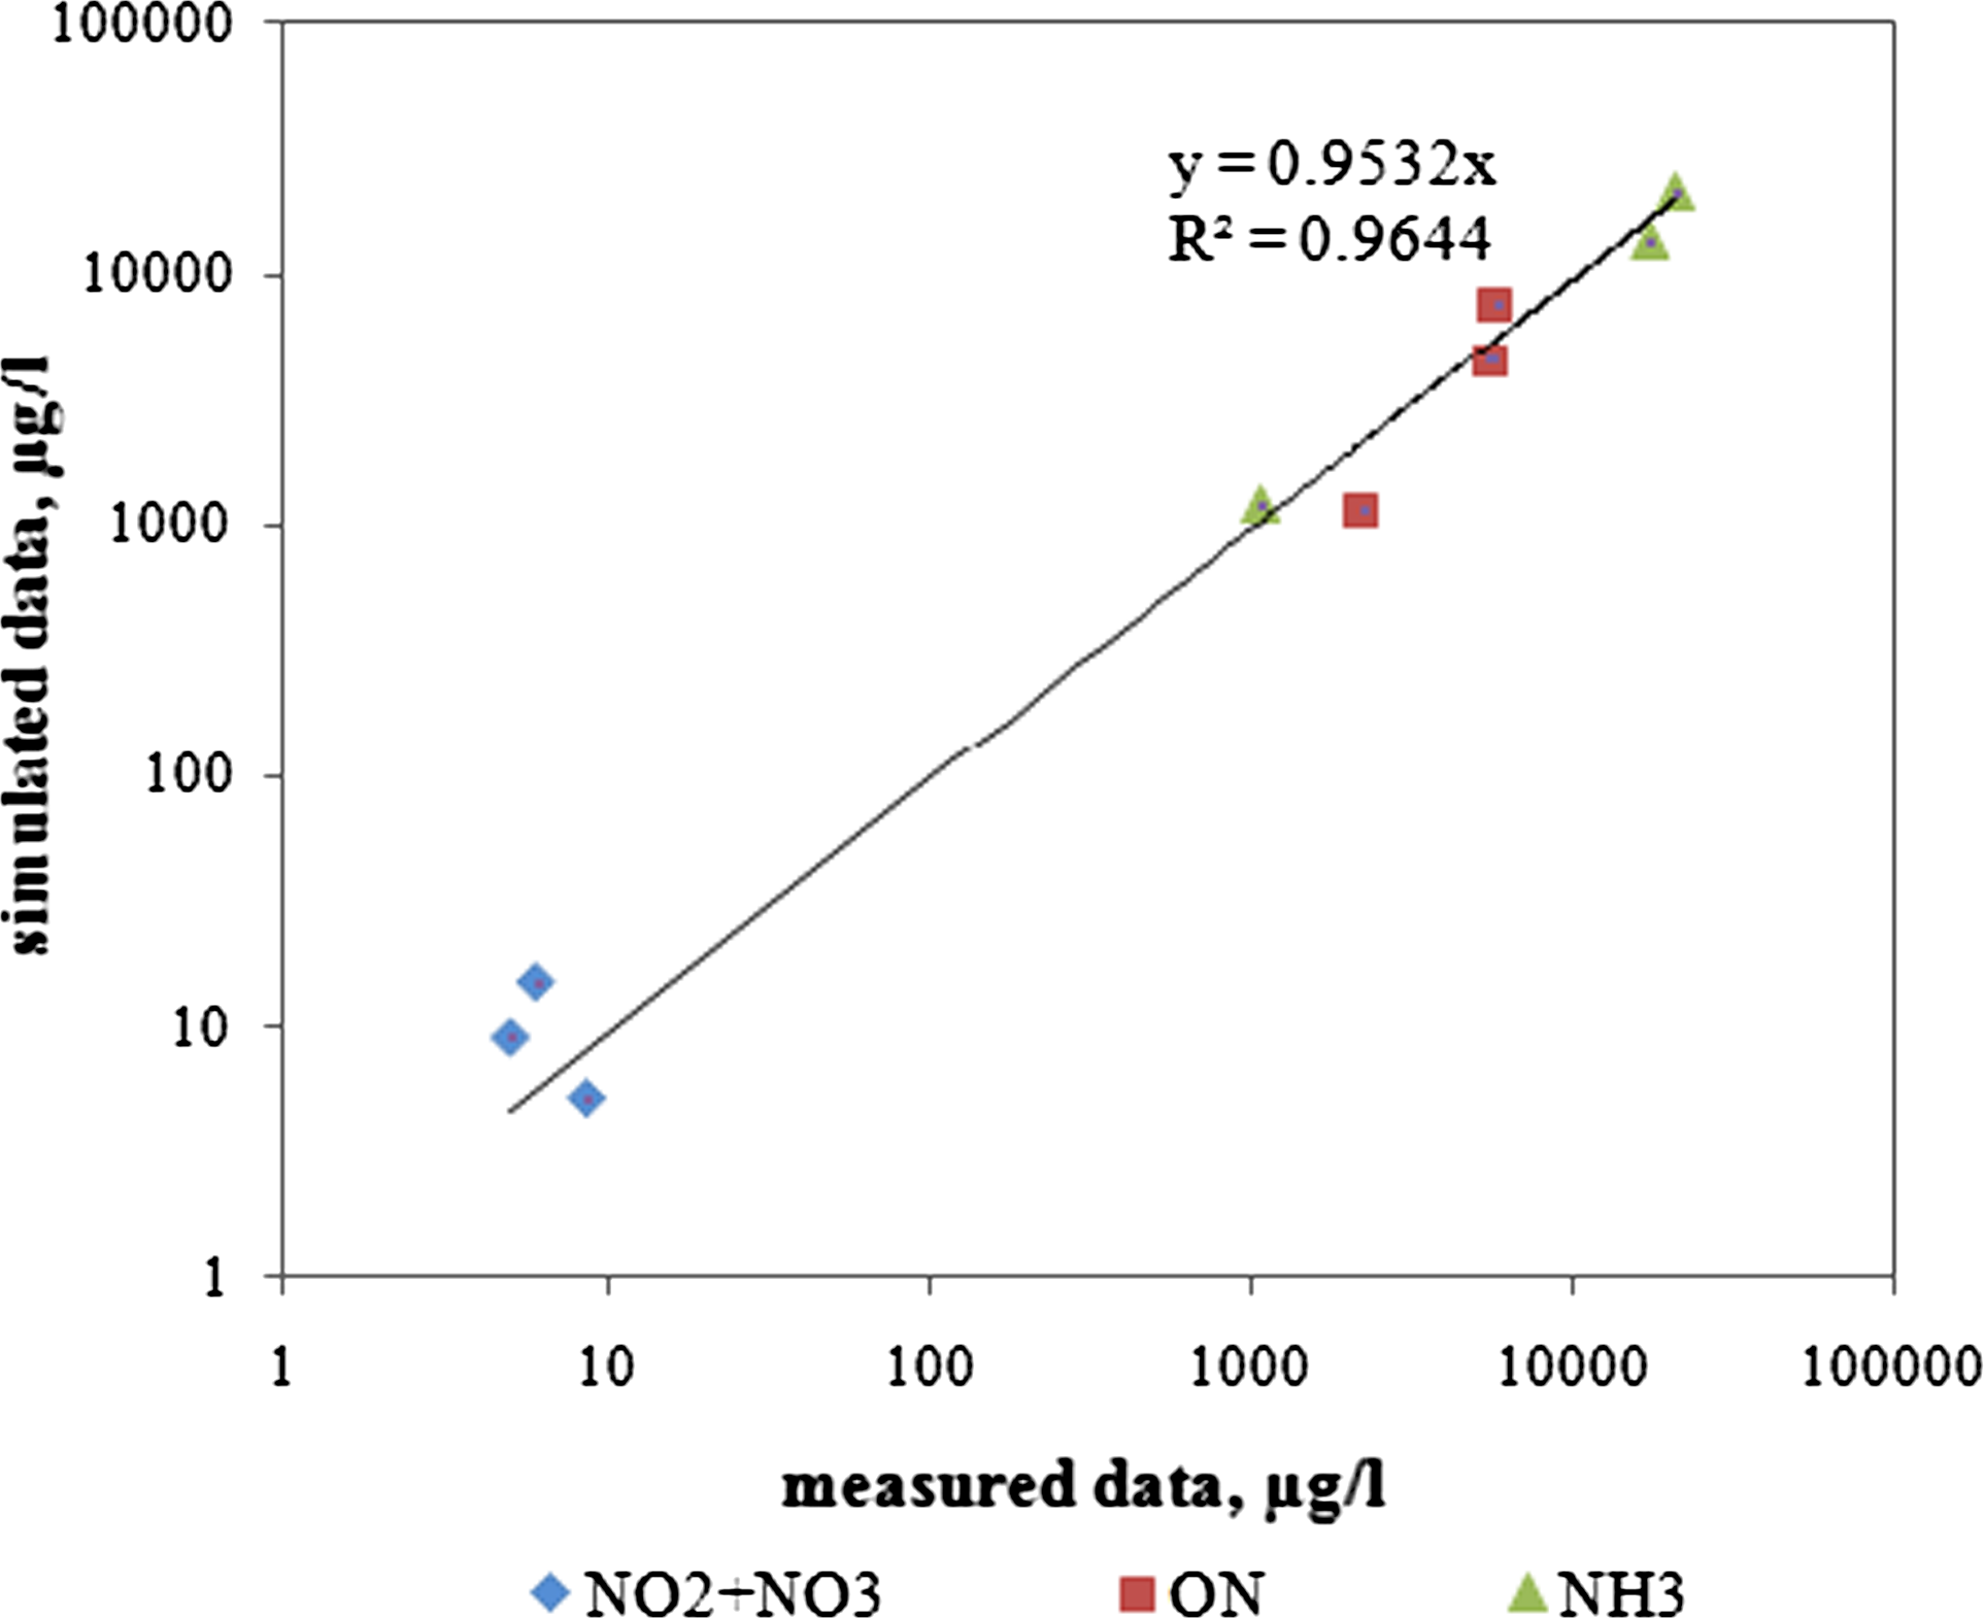
Correlation between the measured and simulated values in model validation.
Sensitivity analyses
The exceptional ability of wetlands for nutrients removal in our study has been fully confirmed. However, the wetland 1 just treated the wastewater with the loading of 113.4 L/day (30 gallons per day), which is smaller than the amount of wastewater produced from most common family. People might wonder how the SUW work under higher loading to fully meet the requirement of household wastewater treatment. In such a case, the superiority of the dynamic simulation model is manifested. A new wastewater loading number input and a gentle press on “run” button relieves all the effort to manually increase the wastewater loading into wetland and collect the water samples for analyses. Keeping the inflow concentration for all three forms of nitrogen 14.0 mg/L of ON, 55.1 mg/L of ammonium (NH4), and 7.0 μg/L of the sum of nitrite and nitrate (NO2 + NO3), 378 L/day (100 gallons per day), 576 L/day (200 gallons per day), 1134 L/day (300 gallons per day), and 1512 L/day (400 gallons per day) were input as the inflow rate into the model interface, all the parameters were kept the same as used in model calibration. The concentrations of ON, ammonium (NH4), and the sum of nitrite and nitrate (NO2 + NO3) from the outlet are shown in Fig. 7.
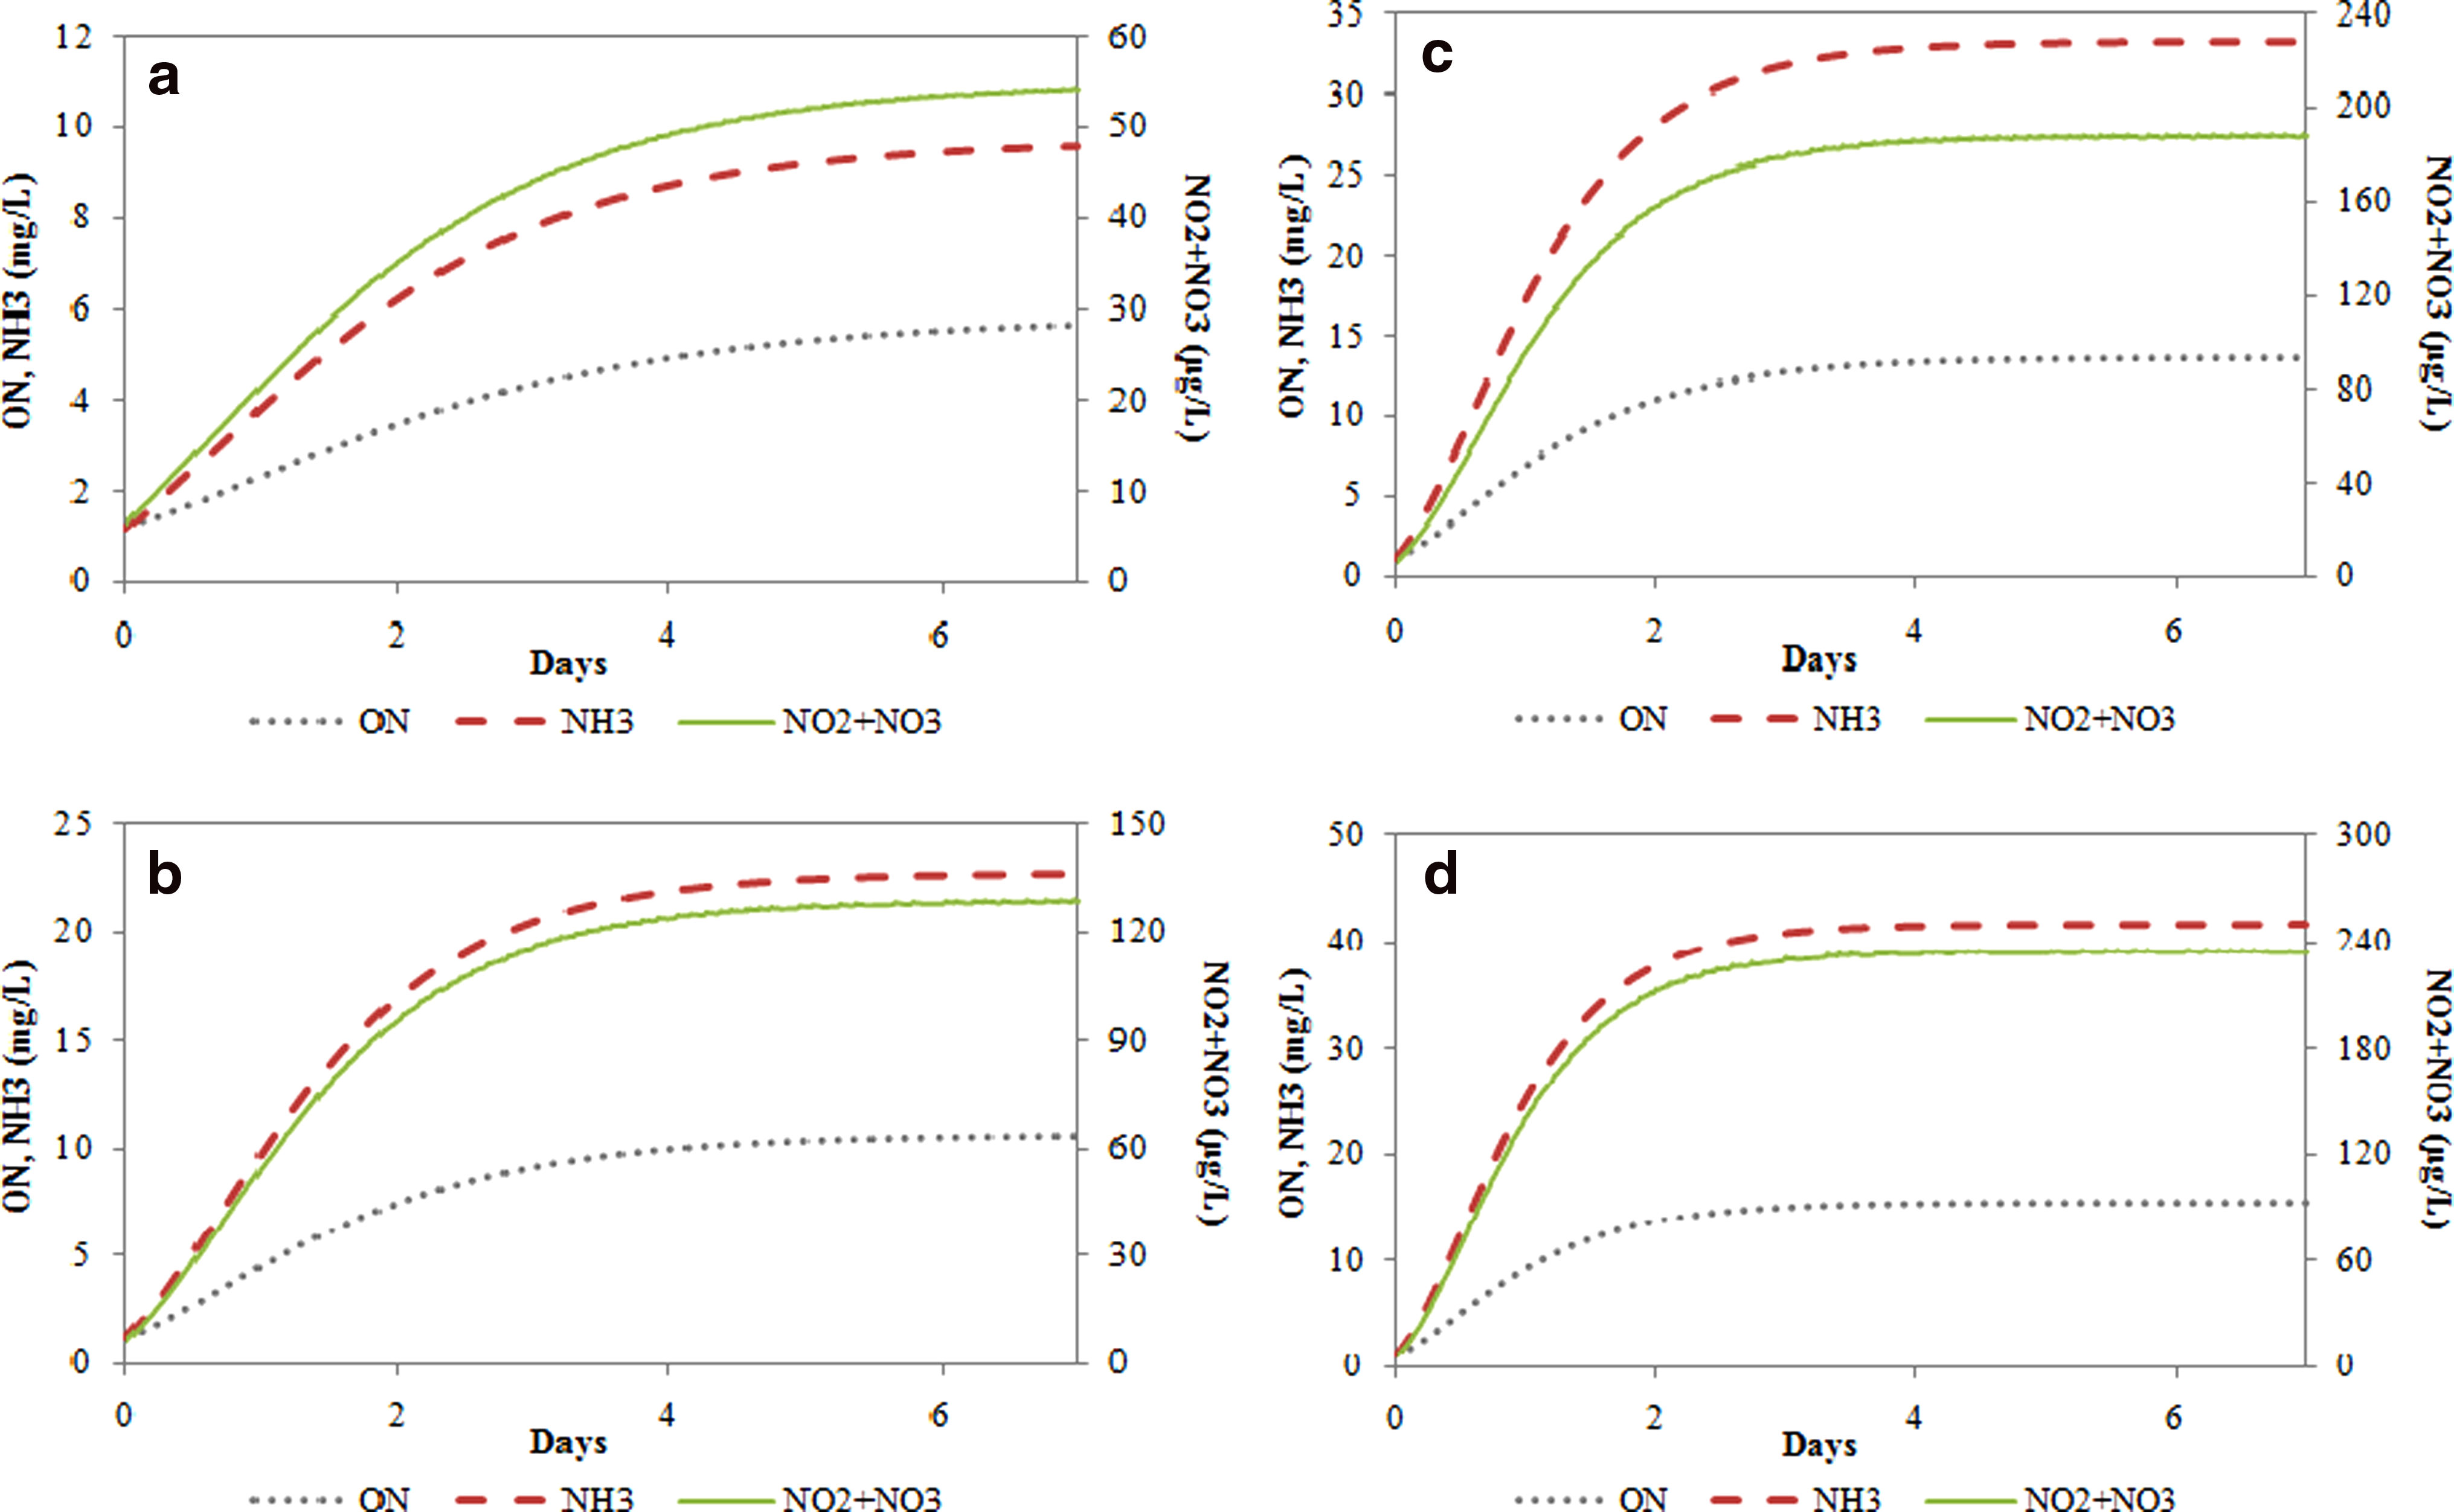
Effluent quality of different wastewater loading:
With the flow rate of 378 L/day, three forms of nitrogen keep increasing with the time. With the increase up to fourfold wastewater loading, the concentrations of NH4 and NO2 + NO3 increased with almost the same ratio. The ON concentration had a less increase after triple loading. With the loading of 1,512 L/day, the concentrations of NH4, NO2 + NO3 and ON were less than 42 mg/L, 250 μg/L and 16 mg/L, respectively. The NO2 + NO3 concentration was still far beyond the maximum contaminant level drinking water standard. With the wastewater loading increase, we can obviously see that the concentrations of nitrogen reach a stable level after the 2-day treatment. That is to say, the dimension of wetland had been overdesigned due to the remarkable nitrogen removal of the medium. Half of original dimension is more than enough. The complexity of nitrification rate has significant influence on the model accuracy. Further sensitivity analyses, especially for the nitrification rate, may certainly help us understand the mechanism according to the nitrogen removal leading to modify the model up to a more sophisticated level in the future. Temperature (T), pH, and DO are the variables of the nitrification rate equation. Certain ranges of these three parameters were introduced to examine how they individually work on the nitrification rate.
As Table 8 shows, the nitrification rate is hardly affected by temperature. Instead, DO and pH value are critical for the nitrification. The lower level of DO resulted in an enlarged range of variation of nitrification rate presumably because of the Monod style expression. The G medium layer had an extreme low DO value, 1.3 mg/L, which might explain the 31.18% decrease of the nitrification rate. Slightly acidic wastewater with pH as 6.67 also might produce a decrease of 27.49% in the nitrification rate.
+, increase; −, decrease.
Recently, two more nitrogen transformations, ANAMMOX (anaerobic ammonia oxidation) and nitrate-ammonification (conversion of ammonia to nitrate under anaerobic conditions), have been studied in the CWs (Dong and Sun, 2007). Both transformations might have contributed the high nitrogen removal efficiency in our study. However, the extent of these reactions in CWs is far from certain. There is still a lack of information about these processes in CWs and their role in treatment process (Vymazal, 2007). Thus, we temporarily count those effects as an integral part of generalized nitrification/denitrification in our model if they do exist. Even they can be confirmed, our system dynamic model will still be useful and applicable after just adding one set of transformation rate to respond to these two more nitrogen transformations.
Conclusions
This mathematical model is our initial attempt to describe the nitrogen removal process in the SUW by using system dynamics model. It is designed to simulate a new wetland system that exhibits high removal of nutrient and bacteria in the specific filtration beds integrated with plant species. The predicted and measured concentrations of the ON, NH4, and NO2 + NO3 in SUW were in good agreement. The ammonification rate constant (ka) in designed medium (PC medium and G medium) increased up to fivefold compared with that in sand layer. The denitrification rate constant in PC medium is 30% more than that in sand layer and three times as much as in G medium. Higher specific yield of nitrification rate (uN/YN) was found in G medium, which is the root zone layer. The vegetation with deeper root, which may reach the bottom of PC medium, is recommended to plant to further increase the DO and nitrification rate and the NH4 uptake during the initial period. The modified nitrification rate expression formula had been used in model validation and proved to be feasible. The sensitivity analyses showed that current dimension of wetland can be halved. In short, the developed mathematical model in this study could provide a dependable reference and tool for design of constructed SUW, a competitive candidate of on-site wastewater treatment technologies.
Footnotes
Acknowledgments
The authors are grateful for the financial support provided by an Urban Nonpoint Source Research Grant from the Bureau of Watershed Restoration, Florida Department of Environmental Protection.
Author Disclosure Statement
No competing financial interests exist.