
Abstract
Abstract
Drying is widely recognized as an essential step in the management of waste activated sludge. Despite growing economic, industrial, and environmental interest in sludge drying in recent years, only few studies have been devoted to the stickiness of drying sludge. During the course of drying, activated sludge passes through a highly cohesive, plastic-rubbery phase. This transition occurs at some intermediate moisture content range, which is referred to as the sticky phase of sludge. During this phase, the sludge tends to stick to the dryer walls, which alters its hydrodynamics and often results in severe operational problems and in a corresponding significant reduction of the dryer capacity. This work presents a simple and repeatable lab protocol to map the sticky phase of activated sludge based on the Jenike shear test. When sludge begins to exhibit sticky behavior, there is an increase in the level of shear stress required to make the preconsolidated sludge slip over a steel surface. The protocol is the first of its kind and will prove highly valuable in managing or avoiding the stickiness phenomenon in industrial sludge dryers, for example, by adapting the moisture content of the sludge entering the sludge dryer. As each wastewater treatment plant has a different sludge with its own specific dry solid range of sticky phase behavior, operators should be able to determine this range in a simple and reliable manner.
Introduction
In industrial sludge drying operations, stickiness is a prevalent issue as is the case, for example, in the centrifuge-dryer system used on Monsanto's WWTP in Antwerp, Belgium. This system combines mechanical dewatering of sludge in a decanter centrifuge and thermal drying of the resulting solids in a flash dryer (Peeters, 2010). During the course of drying, activated sludge passes through a highly cohesive, plastic-rubbery phase at some intermediate moisture content range, which is referred to as the sticky phase of sludge (Lowe, 1995; Kudra, 2003; Gray, 2004). As the term indicates, when partially dried, sludge tends to stick to dryer walls, altering its hydrodynamics and causing operational issues, thereby significantly reducing the dryer capacity (Peeters, 2010). Mapping of the sludge sticky phase is therefore indispensable to allow better process control of the stickiness phenomenon in industrial sludge dryers. That is to say, the stickiness phenomenon for a particular sludge dryer can be better controlled in the field, for example, by alterations in the moisture content of the sludge entering the dryer (Peeters et al., 2009a, 2010), depending on the dryness range wherein the sludge goes through its sticky phase.
Stickiness issues are also experienced in the processing of food products. Various techniques have been developed in this field to map the stickiness phenomenon documented by two recent review papers (Adhikari et al., 2001; Boonyai et al., 2004) and confirmed by new measurement techniques that are being developed (Paterson et al., 2007; Intipunya et al., 2009). But, there are relatively few studies dealing with measurement techniques to map the consistency changes (liquid → sticky → solid) of drying sludge over the whole range of dryness up to 100% dry solids (DS) (Kudra, 2003). A lot of research papers can be found regarding the rheological characterization of more or less concentrated sludges up to ∼50% DS (Seyssiecq et al., 2003), and also a simple method for determining the rheological behavior of sludge with low solid concentrations between 5% and 15% has been proposed (Baudez et al., 2004). Because of a lack of test protocols to map the stickiness of drying sludge up to 100% DS, Ruiz and coworkers turned to soil mechanics trials to characterize the textural changes of sludge by quantifying two transitional water contents, so-called Atterberg consistency limits (Ruiz et al., 2007, 2010; Ruiz and Wisniewski, 2008). With empirical tests, the water content at which the transition between liquid and plastic state (so-called liquid limit) and between plastic and solid state (plastic limit) occurs is determined. Although these two defined limits can be valuable in evaluating the textural characterization of sludge, they fail to provide information on the region in which the sludge exerts its most sticky behavior. This article, therefore, aims at filling the gap in fast and reliable test protocols to map sludge's consistency changes during the course of drying until finally dry dust solids are obtained.
The method of shear testing is widely applied in powder technology for the design of storage bins, silos and hoppers, gravity flow blenders, contact bed reactors, chutes, feeders, and pneumatic conveying systems (Carson and Wilms, 2006). It was originally developed by Jenike (1964) as part of the general formalism for silo design and has since become the industry standard for characterizing the flow properties of powders. In this article, the applicability of the Jenike shear test is studied to measure the sticky phase of drying sludge. Although some authors have already described its use in characterizing powder stickiness during drying (Papadakis and Bahu, 1992), this would be its first use outside the world of powder handling. A standardized protocol is described in detail and some industry-scale results are provided.
Experimental
Sludge and conditioners
Fresh excess sludge samples were obtained from the clarifier underflow of the WWTP of the Monsanto production site in Antwerp (Belgium). The sludge volume index was determined following the Dutch norm NEN 6624 (1982) and the sludge volatile fraction according to the procedures in Standard Methods (APHA-AWWA-WEF, 2005). Aged cationic polymer (Secoblend; P.C.S. Pollution Control Service GmbH) is taken from the polymer make-up tank in the field at a concentration of 0.66 wt% active substance (a.s.) and further diluted in the lab with tap water to a concentration of 0.20 wt% a.s. After homogenization for 15 min, using a shaking table at 150 rpm (Shaker VKS 75 Control; Bühler), the active polymer concentration is obtained, which is same as that applied in the field to condition the sludge feed in the decanter centrifuge. Clay additive (Sepiolita-100; Tolsa), another sludge feed conditioner used at this particular centrifuge-dryer installation, is also taken from the field.
Sludge conditioning
The sludge conditioning is aimed at mimicking similar sludge characteristics during the test as those encountered during normal operating conditions, including the addition of clay and cationic polymers (Peeters et al., 2009b). More specifically, while gently mixing 800 mL of sludge with a lab magnetic stirrer, 1.9 g of clay is added. This is at the same level as that applied during the centrifuge-dryer operation. After homogenization of this mixture for 2 min, 200 mL of the diluted (0.20 wt% a.s.) polymer solution is added, being equivalent to a ratio of ∼25 kg polymer a.s./ton DS. Next, mechanical stress is applied to the sludge flocs in a typical jar test apparatus (Floc-Tester; Aqualytic) to impose shear forces, thus simulating shear forces acting on the flocs in the decanter centrifuge; the conditioned mixture is agitated for 15 min in a 1-L beaker with a flat single-bladed paddle type stirrer at a controlled speed (and shear) of 230 rpm. Then, this conditioned sludge is allowed to settle for 5 min in the 1-L beaker, and the supernatant is decanted. This conditioned sludge typically has a dryness of 10%–15% DS. Samples with higher DS concentrations are obtained by drying 40 g of sludge (initially at 10%–15% DS) in a lab drying furnace (T5028; Heraeus) at 100°C until the desired dryness is obtained. The dried sample is homogenized with a mortar and pestle before being used in the shear test.
Shear test protocol
A schematic diagram of the shear testing device is presented in Fig. 1, and Fig. 2 shows a picture of the main components. First, conditioned sludge (2) is put in the open (hollow) steel cylinder (3), which is placed on the left side of the stainless steel surface (1), that is, the starting position of the cylinder for the test (Fig. 1). This open cylinder has an internal diameter of 5.5 cm and a height of 10 cm and is further characterized by a weight of 388 g and a wall thickness of 2.5 mm. Sludge (∼15 g) is brought into this open cylinder and uniformly distributed over the circular surface. Next, the sludge is consolidated for 1 min on the stainless steel surface by means of a massive cylinder [4(Position A) in Fig. 1] of 2.2 kg, which fits, with its external diameter of 5.3 cm, closely in the open cylinder. In this way, a normal stress of 9.1 kPa is applied, which presses the sludge onto the steel surface, inducing adhesion of the sludge to the steel surface. The open cylinder is connected by the flexible steel cable (5) and the small wheel (6) to the recipient (7), which is used to increase the shear stress on the sludge (Fig. 1). The purpose of the wheel is to redirect the flexible steel cable in a vertical direction. Initially, the recipient is filled with small weights equivalent to a weight of 100 g and hangs freely in the air, next to the lab table. Then, the massive (preconsolidation) cylinder is removed from the sludge sample [4(Position B) in Fig. 1]. From that moment on, small weights of ∼3 g each are introduced approximately every 5 s into the recipient until the open cylinder containing the activated sludge starts sliding over the steel surface and finally reaches the final mark on this surface (open cylinder indicated in Fig. 1 as 3′). Once the cylinder starts sliding, the addition of weights is stopped (in the recipient indicated as 7′) and the total weight M (kg) of the recipient is recorded. After the first test, the open cylinder is placed back in the start position (3) and the sludge sample is made loose, gently mixed with a laboratory spoon in the open cylinder itself (typically during 20 s), and again distributed uniformly over the circular contact surface as was done during the first trial with this sample. The procedure is repeated again as described above, for the second time, after first removing sludge residuals from the steel surface with a tissue. A third trial is also performed to get three repeats of the shear test for the same sample. The test has then been run with samples of increasing solids content.
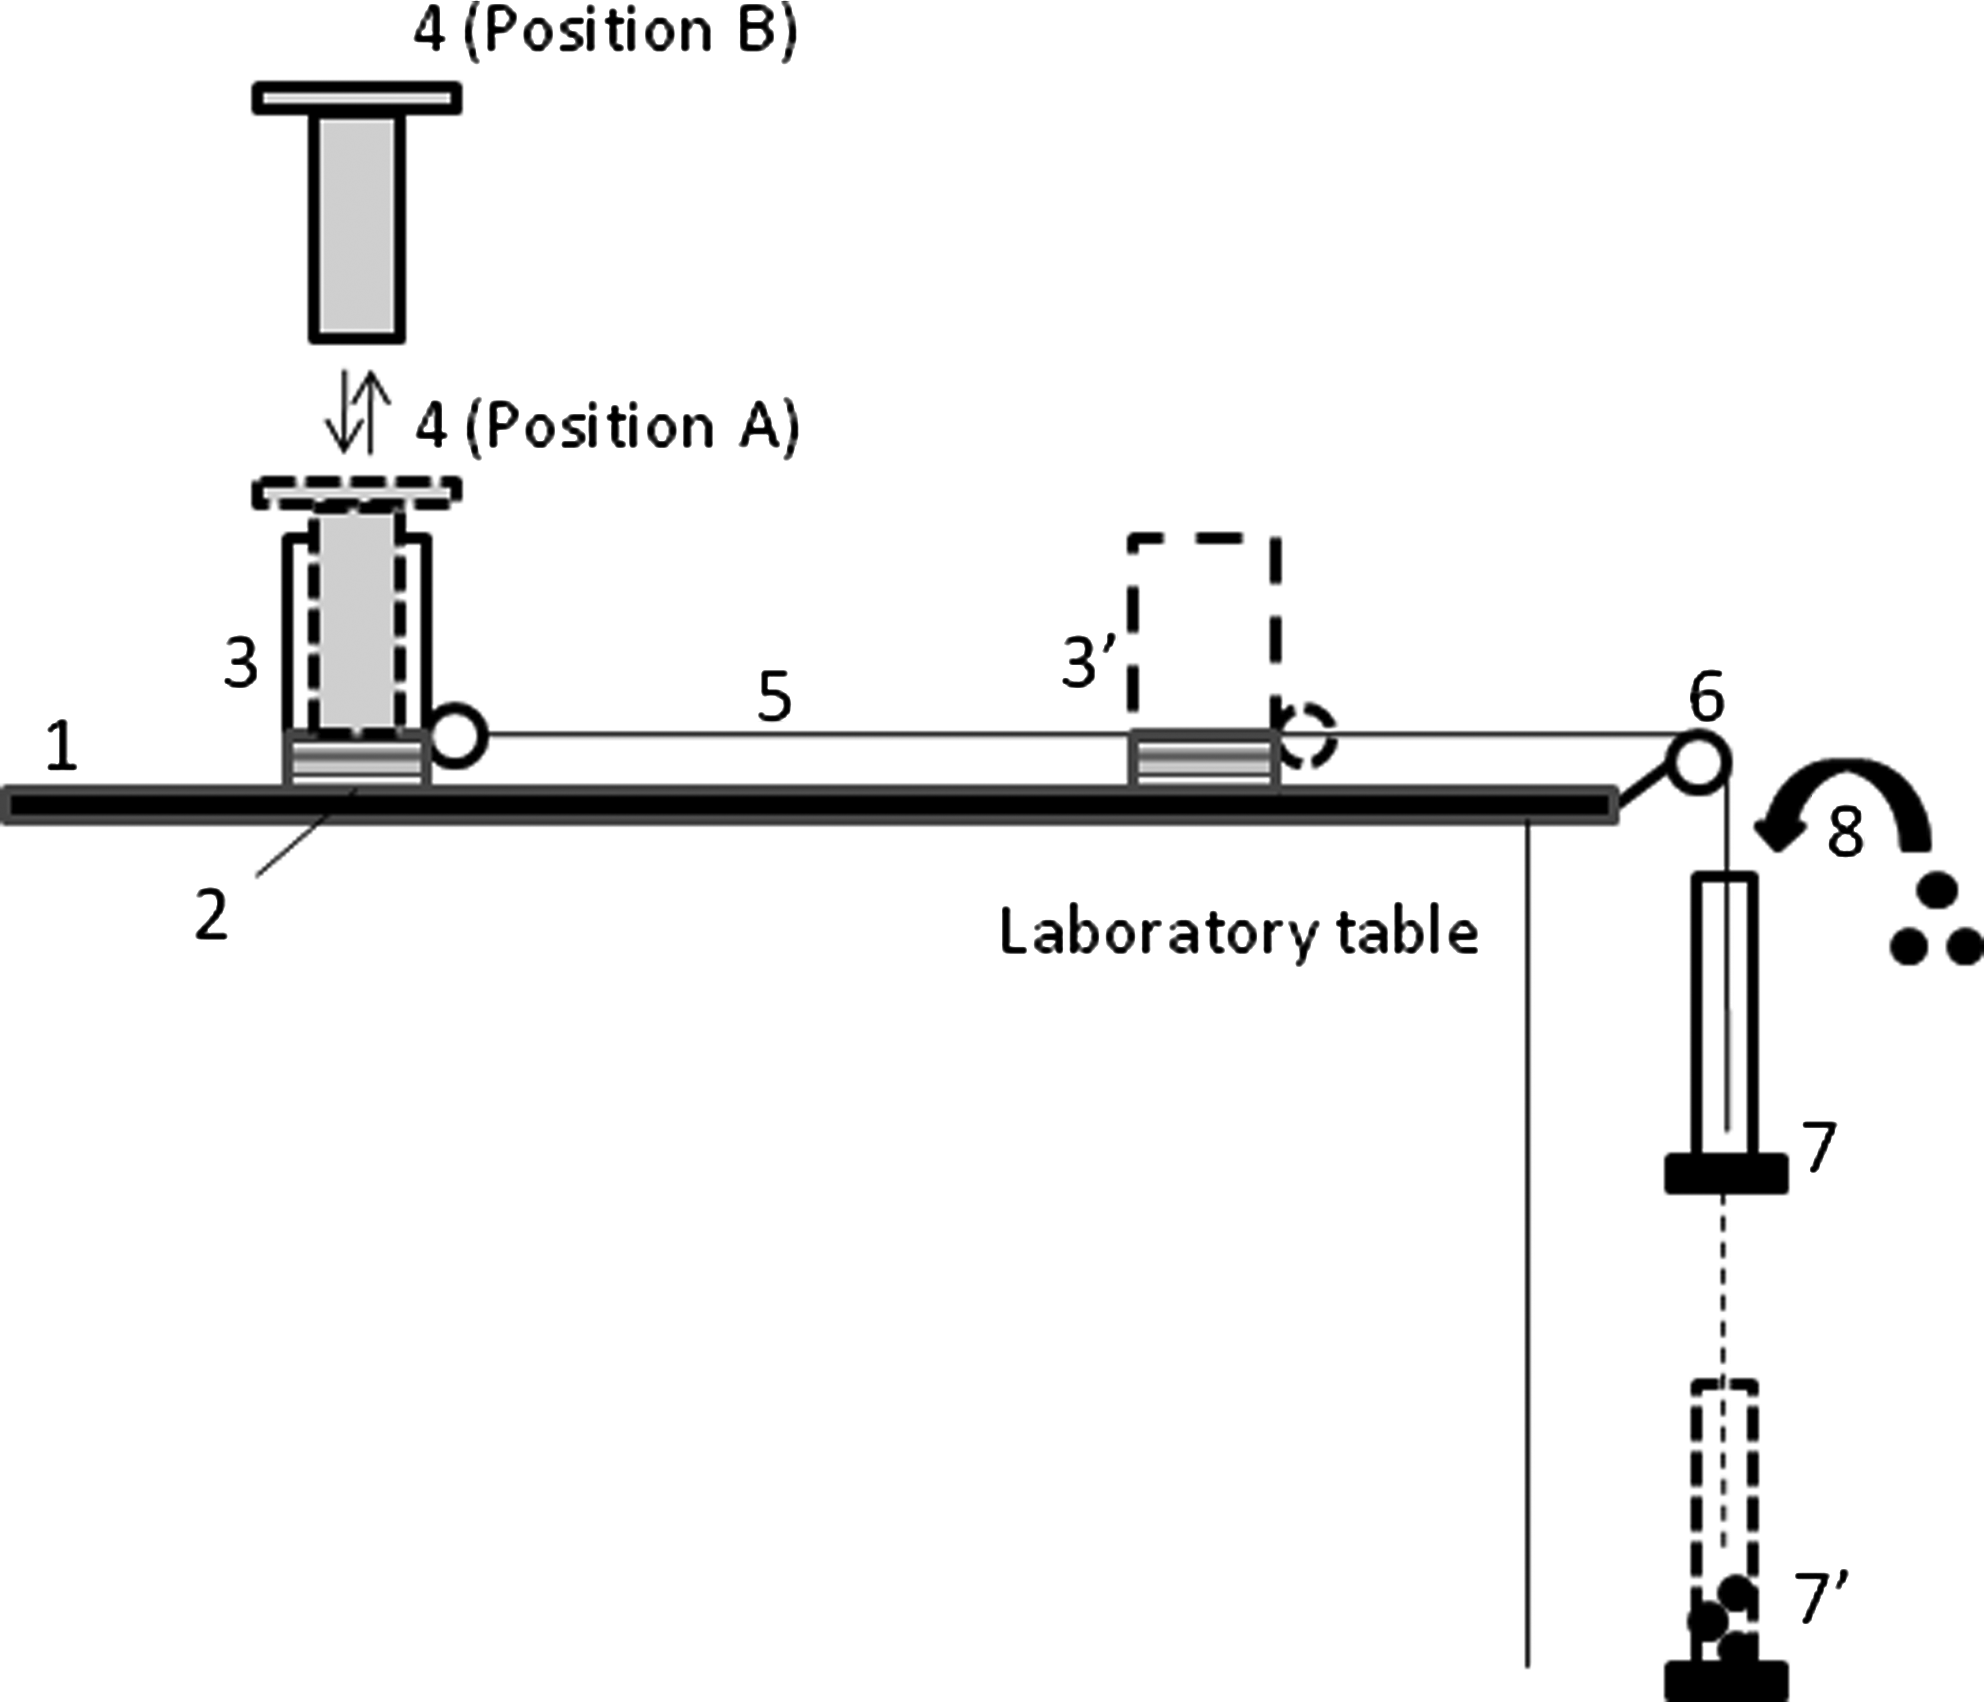
Shear test scheme (1, stainless steel surface; 2, activated sludge sample; 3, open cylinder in begin position; 3′, open cylinder in end position; 4, massive cylinder; 5, flexible steel wire; 6, small wheel; 7, recipient to contain weights in begin position; 7′, recipient in end position; 8, small weights); the massive cylinder (4) is brought in Position A to consolidate initially the activated sludge on the stainless steel surface and then brought into Position B afterward.
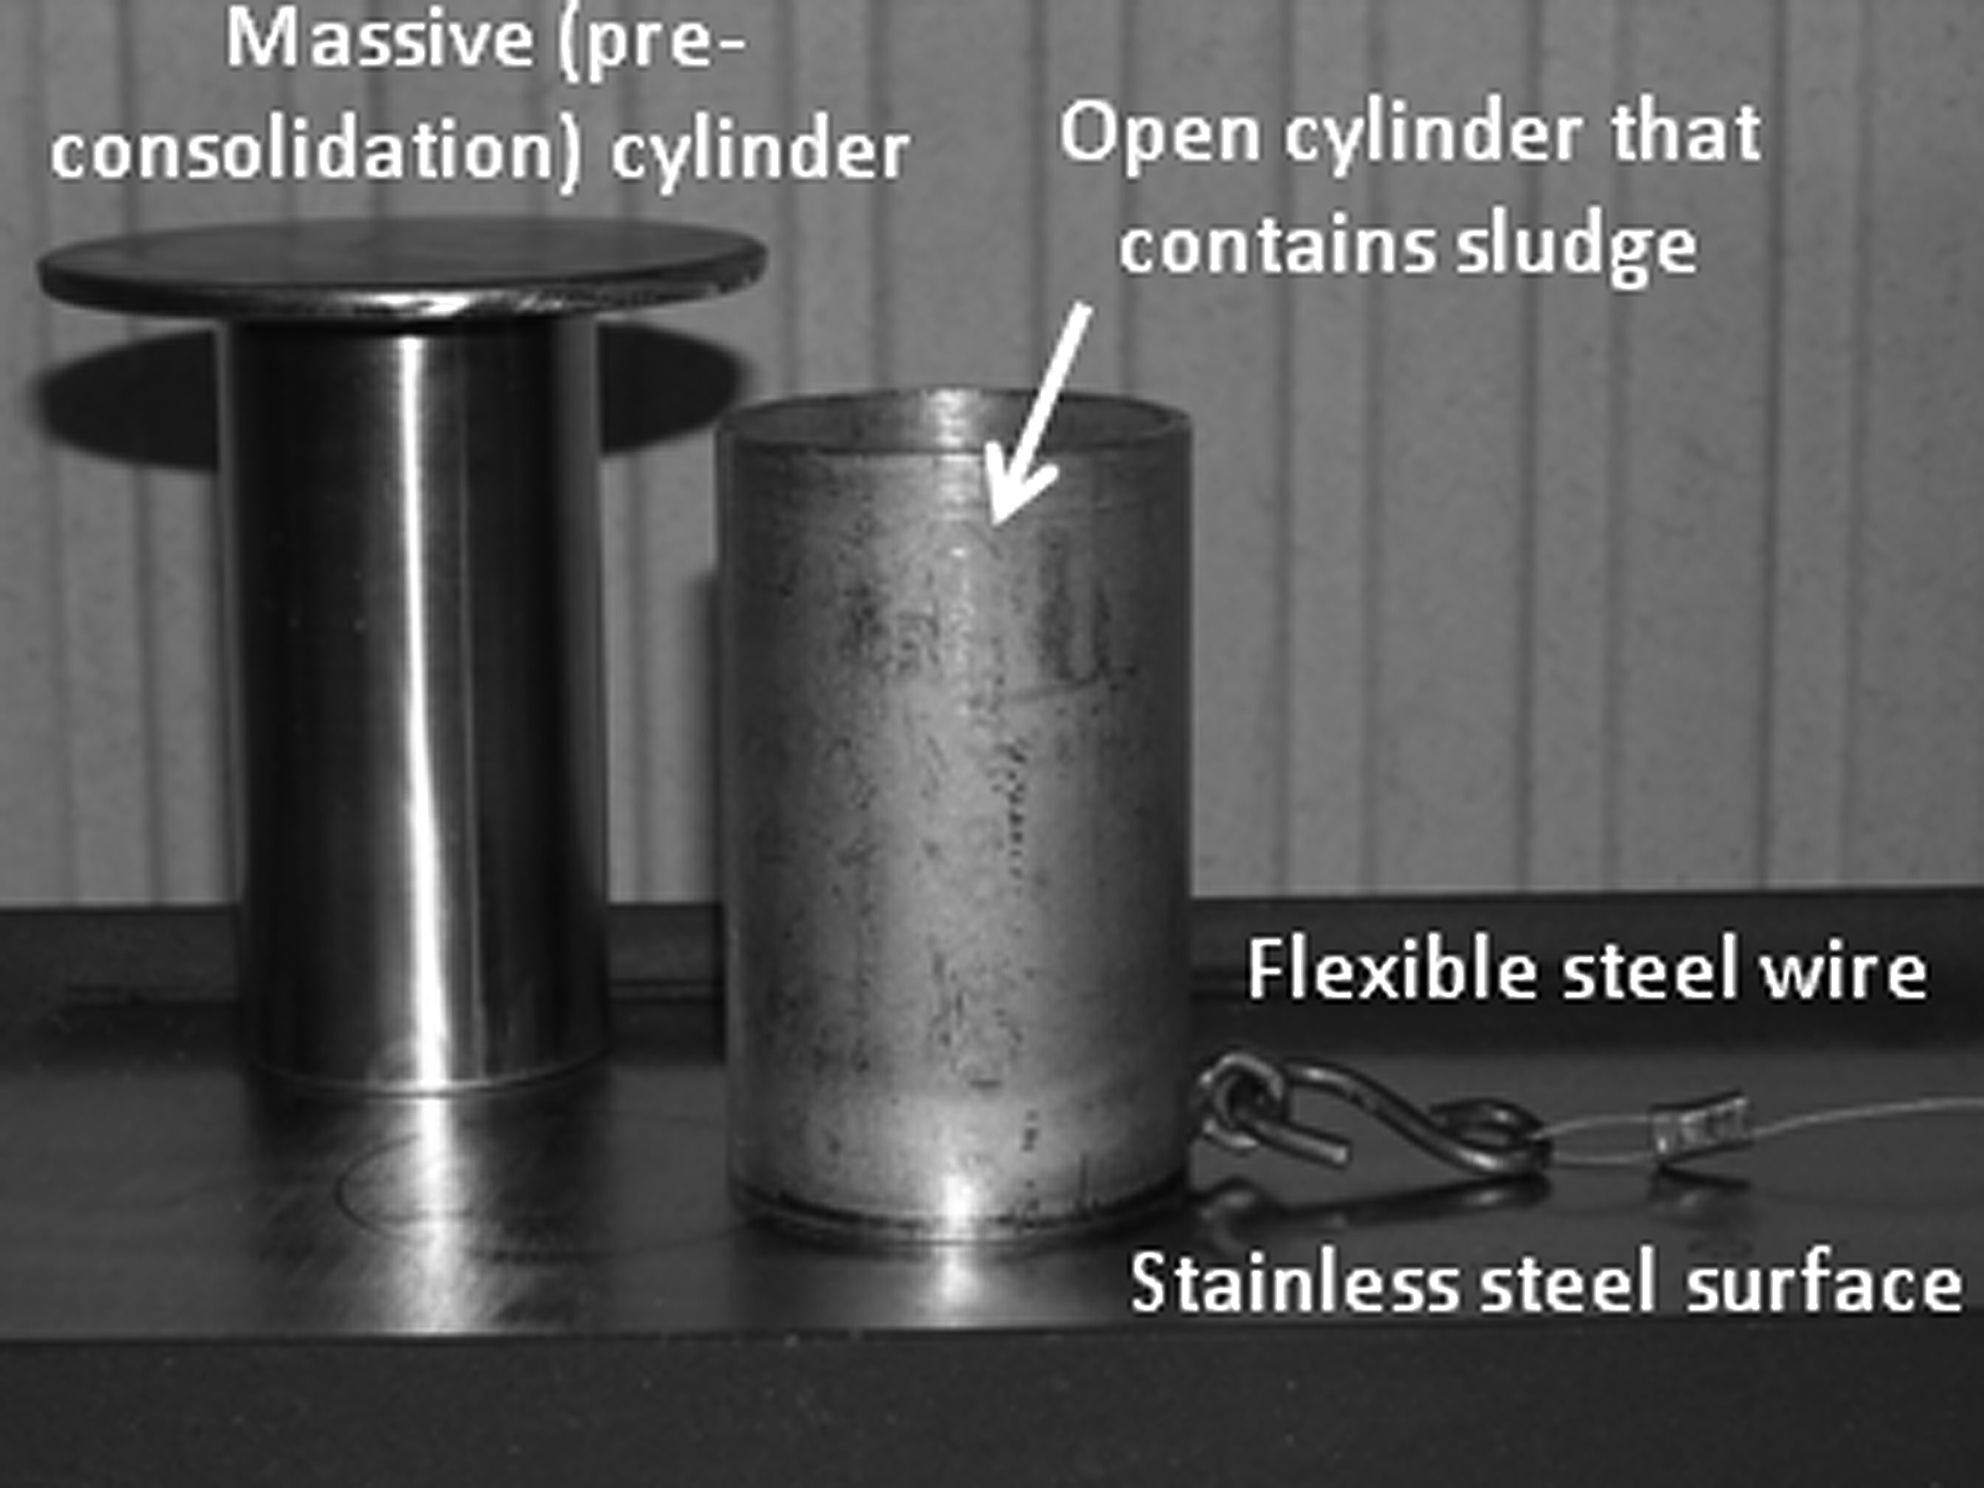
Open cylinder that contains the sludge sample to be tested and the massive (preconsolidation) cylinder.
Finally, the shear stress τ (N/m2) that is needed to cause slipping of the consolidated sludge is calculated for every repeat and plotted as function of the sludge dryness:
Statistical analysis
Analysis of variance was performed with the MINITAB® software package.
Results and Discussion
Two separate test runs (taking 2 days for one analyst) were executed, with excess sludge taken from the plant on different dates, referred to as Test 1 and Test 2. The sludge volume index and volatile fraction remained quite constant in this period at a level of 50 mL/g and 70%, respectively. Figure 3 presents the results of the shear test. The shear stress τ needed to cause slippage of the sludge over the steel surface varied between 600 and 1,700 Pa. The repeatability of the test is very good as can be seen in Fig. 3 from the three consecutive repeats of every sludge sample. Further, a one-way analysis of variance performed on the data of Test 1 revealed that 98% of the variation in the shear stress is explained by the variation in sludge dryness; for the data of Test 2, this number amounts to 96%.

Mapping of the sticky phase of activated sludge by means of the shear test (black data: Test 1; gray data: Test 2) (95% confidence interval for the mean).
At low sludge dryness (still wet sludge), only a low shear stress is needed to make the sludge slip over the steel surface (750 Pa at the lowest dryness tested being 10% DS). With increasing dryness, the sludge shows increasing resistance to movement over the surface until it clearly exhibits the most sticky behavior when partially dried in the range from 25% to 40% DS. In this region of dryness, the sludge turns into a sticky, plastic-rubbery phase and the shear stress needed in this region to cause slipping is ∼1,700 and 1,550 Pa for Test 1 and Test 2, respectively. The higher shear stress in Test 1 could possibly be explained by a somewhat higher clay-to-biosolids ratio as a result of lower mixed liquor suspended solids (MLSS). Beyond the 40% dryness, the sludge's resistance to slip over the surface decreases again with increasing dryness, first with a steep slope until a dryness of 50% DS (crumbly material) and finally with a smooth slope until 100% dry-dust granular sludge solids are obtained.
The dryness range from 25% to 40% DS, wherein the Monsanto sludge exhibits its sticky phase, is at the lower side of the ranges found elsewhere in the literature, mostly cited as a general statement without referring to the test protocol used (if any). A range of 35%–50% DS has been found experimentally for municipal sludge after anaerobic digestion (Kudra, 2003); Chun and Lee (2004) state that lump formation in the sticky phase happens from 50% to 60% DS. A larger range of 25%–75% DS is reported for the sludge of a WWTP that receives 85% industrial and 15% municipal wastewater (Arlabosse et al., 2004). The Biosolids Technology Fact Sheet on Heat Drying from the U.S. Environmental Protection Agency mentions a sticky phase occurring between 40% and 60% DS (USEPA, 2006). A range of 15%–35% DS is indicated in Gray's reference-handbook Biology of Wastewater Treatment (Gray, 2004), whereas a totally different range of 55%–70% DS can be found in Mujumdar's industry-standard Handbook of Industrial Drying (Chen et al., 2007). Finally, based on soil mechanics-based trials, ranges of 21%–37% DS and 12%–18% DS can be derived for sludges having a volatile fraction of 53% and 75%, respectively (Ruiz et al., 2007; Ruiz and Wisniewski, 2008). Obviously, the wide range of sticky phases found in the literature demonstrates that WWTP operators cannot just take into account the sticky phase they find somewhere in literature and assume it applies for their own WWTP specific sludge. On the contrary, we recommend that every individual sludge drying installation should map the sticky phase range. This clearly demonstrates the need for an easy, unsophisticated method to map the sticky phase of sludge.
The most remarkable observation is that relatively small changes in the sludge dryness in the neighborhood of the sticky region, characterized by the 25%–40% DS range for this sludge under study, have a large effect on the shear stress. This phenomenon of drying activated sludge was also well demonstrated by Kudra (2003), using a continuous torque measurement device on agitated activated sludge while being dried. This pronounced sensitivity of the sludge's physical state on the solids dryness makes drying of sludge rather cumbersome. The Monsanto sludge dryer is specifically sensitive for this problem, because the sticky phase of the sludge occurs already at a solids dryness (25% DS) close to the dryness of the solids entering the flash drying step (where the sludge solids immediately start drying and pass through the sticky phase). Hence, the control of the solids dryness after the initial mechanical dewatering step is critical to avoid drying sludge sticking to the dryer walls (Peeters et al., 2010). Control of the sludge dryness after the centrifugal dewatering step is achieved by controlling the amount of clay additive in the feed toward the centrifuge-dryer installation.
Future research will exploit this protocol to map the sticky phase of different sludge compositions, for example, for sludge mixtures of secondary and tertiary sludge, the latter containing polyaluminium chloride coagulant at the Monsanto WWTP, which was shown to have a positive effect on the sludge dryer fouling (Peeters et al., 2010).
Conclusions
The stickiness phenomenon of drying activated sludge is a tough issue dealt by operational people on a daily basis during drying operations in industry. Essential to an improved knowledge, and hence, better control of this phenomenon during the course of drying, is the mapping of this sticky phase for a particular sludge. The lab protocol proposed in this article, based on the widely applied Jenike shear test in powder technology, allows the mapping of the region of dryness where activated sludge goes through its sticky phase, indicated by a significant increased level of shear stress needed to let preconsolidated sludge start slipping over a steel surface. On the basis of tests with industrial activated sludge (that has to be dried in a centrifuge-dryer system), the protocol proves to be simple and repeatable, thereby confirming its value for the daily management of activated sludge dryer installations.
In practice, this protocol is useful for WWTP operators in charge of sludge dryers who need to map the sticky phase of their particular sludge without sophisticated lab equipment. Mapping of the individual sludge's sticky phase of WWTPs where sludge drying is applied can be highly recommended because of the wide range (and so, useless information) of sticky phases reported in literature.
Footnotes
Acknowledgment
J.F. Van Impe holds the chair Safety Engineering sponsored by the Belgian Chemistry and Life Sciences Federation Essenscia.
Author Disclosure Statement
The authors declare that no competing financial conflicts exist.