
Abstract
Abstract
As toxicity studies of disinfection byproducts (DBPs) progress, enhanced knowledge of the stability of DBPs can help determine the likelihood of DBP occurrence in water and thus enable accurate exposure assessments. To elucidate the roles of functional group, halogen number, and halogen type on the hydrolytic stability of halogenated DBPs, this study reviewed the hydrolysis rate constants (kH) of six groups of DBPs, including haloacetic acids, trihalomethanes, haloacetaldehydes, haloketones, haloacetonitriles, and cyanogen halides. Quantitative structure–property relationship models were developed and validated via previously tested compounds, and by extrapolation, these models were projected to nontested chemicals of emerging health concern, especially iodinated DBPs. In general, the kH values follow the order haloketone > haloacetonitrile > haloacetaldehyde >haloacetic acid > trihalomethane for chlorinated and brominated species, increase with increasing number of halogen atoms within one DBP group, and increase as a function of increasing atomic weight of included halogens (i.e., F < Cl < Br < I). This is the first summary of both regulated and emerging DBPs that uses the novel approach of quantitative structure–property relationship to fit diverse sources of information. Predicted results may orient future studies of the fate and transport of persistent DBP species.
Introduction
DBPs in water are subject to many abiotic and biotic transformation processes (Chen et al., 2008). Early research showed that hydrolysis is an important mechanism of DBP removal, occurrence, and speciation (Hozalski et al., 2001; Liang and Singer, 2003; Zhang et al., 2009). A preliminary study compared the impacts of different mechanisms (biodegradation, photolysis, volatilization, sorption, and hydrolysis) of DBP loss in simulated surface water; the results indicated that hydrolysis is the dominant mechanism of haloacetonitrile (HAN) decomposition (Chen et al., 2008). However, the hydrolytic stabilities of emerging DBPs, such as iodinated trihalomethane (THM), are unknown. Further, the hydrolysis rates of some compounds are difficult to determine experimentally because they are too rapid or too slow or lack commercial or synthetic reference standards (e.g., triiodoacetonitrile).
Quantitative structure–property relationship (QSPR) analysis is a powerful tool that enables prediction of one chemical's activity on the basis of other structurally similar chemicals (Hammett, 1935; Hansch et al., 1995). It is also known as quantitative structure–activity relation, quantitative structure–toxicity relation, linear free-energy relation (Schwarzenback et al., 2003; Carey and Sundberg, 2007; Richardson et al., 2008), etc. They all employ the fundamental Hammett equation (Hansch et al., 1995). This approach is not a substitute for traditional experimental tests but enables prediction of properties on the assumption that compounds with similar structures behave alike and that the property differences are attributable to enthalpy changes caused by the type(s) and number(s) of functional group(s). Applications of QSPR to environmental arena include evaluation of DBP toxicities (Woo et al., 2002; Bull et al., 2007), chlorine demand (Luilo and Cabaniss, 2010), biodegradation and sorption of organic matter (Dickenson et al., 2010), solar photolysis of DBPs (Chen et al., 2010), and hydrolysis of HANs (Glezer et al., 1999). Therefore, it may be appropriate to extend the method to additional DBP groups, as many DBPs share similar molecular structures.
This study quantifies the effects of functional group, halogen type, and halogen number on the hydrolytic stability of halogenated DBPs. After a review of existing studies of the hydrolysis rate constants, pathways, and favorable experimental conditions for DBPs, the study develops, validates, and applies QSPR models to bridge the knowledge gaps between knowns (i.e., tested chemicals) and unknowns (emerging chemicals). The discussion focuses on six groups of chlorinated, brominated, and iodinated compounds, including halomethanes (HMs), haloacetic acids (HAAs), haloacetaldehydes (HAs), haloketones (HKs), HANs, and cyanogen halides (Table 1), but fluorinated species are also discussed to present a complete overview of halogenated species. The results may be combined with other mechanisms (e.g., photolysis, biodegradation, adsorption) to predict DBPs occurrence under various hydrological conditions (Lekkas and Nikolaou, 2004).
The compound was excluded for quantitative structure–activity relationship analysis because the modeling result is much better without it.
The compound was excluded from quantitative structure–property relationship analysis because of different substitution pattern (1,3).
Reckhow, D. (2009). Stability of halogenated DBPs in drinking water. Personal Communication. University of Massachusetts, Amherst, MA.
Modeling Method
To allow comparison of the DBP data collected from a variety of studies both within one group and among different groups, hydrolysis kinetics was assumed to be pseudo-first-order because this allows determination of the rate constant without knowing the initial dosage of DBPs. Also, the study was unified to certain pure water conditions: pH of 7.0–7.5, room temperature of 20°C–25°C, and no interferences (e.g., no sulfite, chlorine, iron), and those data that do not fit these conditions were not included. Under these conditions, carbon–halogen (C-X) fission, carbon–carbon (C-C) breakage, or hydroxyl replacement may occur but not an oxidation state change, which is different from other studies of DBP degradation under reductive and oxidative conditions (Na and Olson, 2004; Chun et al., 2005).
Prior to QSPR analysis, the study employed two methods to convert existing literature data to the conditions of this study. One method is based on the effect of pH on kH, and the other on the effect of temperature on kH. The first method requires inputs of at least three sets of pH and kH values for one compound (e.g., HAN) to calibrate the coefficients (ka, kn, and kb); once these coefficients are known, the kH at any other pH can be calculated using equation (1):
where rH is the hydrolysis rate of the reactant, dC/dt; kH is the hydrolysis rate constant (h−1); C is the DBP concentration; and ka, kn, and kb are the rate constants at acidic, neutral, and basic conditions, respectively.
The second method employs the Arrhenius equation, which describes the effect of temperature on kH. This approach requires at least two sets of inputs (temperature and kH,T) to calibrate the coefficient EA for one compound (e.g., HM); once EA is known, the rate constant at any other temperature can be calculated using equation (2):
where kH,T is the hydrolysis rate constant at a specific temperature, EA is the Arrhenius activation energy (kcal/mol), T is the absolute temperature (K), and R is a constant (1.987 cal/degree-mol).
The above described methods provide an understanding of the behavior of one compound under various environmental conditions. The QSPR analysis requires inputs of kH, σ, and Es [equation (3)] to calibrate the coefficients (δ, ρ, and c′). After the calibration on compounds with known kH values, the coefficients can be used to predict the kH values of other compounds. QSPR approach can predict the kH values from just a few compounds to many other structurally similar compounds, under the premise of same reaction mechanism and reaction conditions. This provides a wide scope of knowledge of a series of compounds.
where kH is the hydrolysis rate constant of the compound, Es is the steric effect constant of the halogen, σ is the polar effect constant of the halogen, δ is the steric effect coefficient of the halogen, ρ is the polar effect coefficient of the halogen, and c′ is a constant. The σ and the Es coefficients are 0.50, 0.47, 0.45, and 0.38, and −0.46, −0.97, 1.16, and −1.40, for fluorine, chlorine, bromine, and iodine, respectively (Hansch et al., 1995). The effect of multiple halogen substitution is assumed to be the sum of the effects of single halogens, as in early QSPR studies of DBPs (Zhang and Minear, 2002; Chen et al., 2010).
Based on the number of unknown coefficients, at least three species in one group are needed to calibrate the coefficients and at least one additional species is needed to validate the calibrated model. That is, each group of DBPs analyzed by QSPR should contain at least four previously studied DBP species. Good QSPR practice requires the number of species to be at least two times the number of coefficients (i.e., six in this study) (Schwarzenback et al., 2003; Carey and Sundberg, 2007). The coefficients of the Hammett equation (δ, ρ, and c′) were determined by the “LINEST” function of Microsoft Excel 2007 (Billo, 2007) and the fit was evaluated by the root mean square error (RMSE).
For normally distributed data, the 95% confidence intervals lie within a range of approximately two times the RMSE [equation (4)] (Dickenson et al., 2010):
where m is the number of values used in the model calibration.
Results and Discussion
The discussion presents the key information regarding DBP hydrolysis pathways and byproducts as well as a comparison of the literature (Table 1) and QSPR-estimated (Table 2) hydrolysis rate constants. The hydrolytic stabilities of chlorinated, brominated, and iodinated compounds are of special concern because they are regulated or emerging contaminants. Not all the compounds (e.g., fluorinated species) listed in Table 2 have been detected in water or identified as toxic contaminants, but they are included for completeness. To provide a more intuitive feeling for the relative kinetics, kH values were converted to half-lives via the equation T1/2 = ln(2)/kH in the following discussion.
The fluorinated compounds are not DBPs, and some compounds listed above were not detected or identified as contaminants so far.
DBP, disinfection byproduct.
Haloacetic acids
USEPA currently regulates five HAAs, with a maximum contaminant level of 60 μg/L in drinking water. Trichloroacetic acid undergoes C-C bond breakage during the base-catalyzed hydrolysis process, to form chloroform and chloride (Verhoek, 1934). Decomposition of other trihaloacetic acids, including bromodichloroacetic, dibromochloroacetic, and tribromoacetic acids, follow the same pathway to produce bromodichloromethane, dibromochloromethane, and tribromomethane, respectively (Zhang and Minear, 2002). These findings suggest that decarboxylation is the major pathway for HAA hydrolysis (Reaction 1), whereas another study proposed nucleophile group displacement of the halide (Reaction 2) (Urbansky, 2001).
Elevated temperature increases the hydrolysis rate constant, but other factors such as organic carbon, residual chlorine, and conductivity have little impact on HAA stability (Zhang and Minear, 2002). The effect of pH on chloroacetic acid hydrolysis varies in different pH ranges: the kH increases with increasing pH from 1 to 3, then flattens from pH 3 to 10, and increases with increasing pH again from pH 10 to 13 (Berhenke and Britton, 1946).
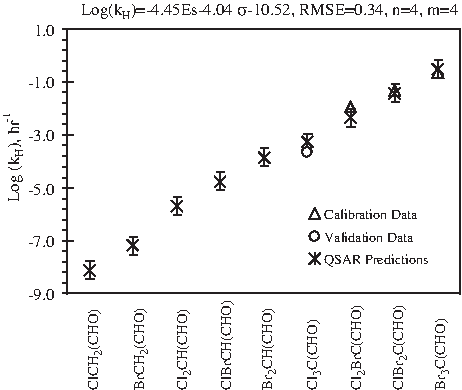
Figure 1 presents a comparison of QSPR-predicted and literature-reported kH values for nine HAAs. Of these, data for five HAAs from three literature sources (Urbansky, 2001; Zhang and Minear, 2002; Okuda et al., 2003) were used to determine the coefficients, and two additional data points from one literature (Urbansky, 2001) were employed to validate the model. Afterward, the QSPR model was extended to predict the kH values of a list of fluorinated, chlorinated, brominated, and iodinated HAAs (Table 2). The RMSE between the QSPR predictions and the literature data was 0.23, indicating that the model captured the kH of HAAs very well. Highly halogenated HAAs are more likely to undergo hydrolysis than less halogenated HAAs, and bromine-substituted HAAs are more fragile than chlorine-substituted HAAs. Monochloroacetic acid has a predicted log kH of −17.4, suggesting that it is extremely stable and resistant to hydrolysis. The log kH of triiodoacetic acid was predicted to be −0.76, corresponding to a half-life of ∼4 h. Considering the typical time scale of a distribution system (e.g., 3 days), any species with kH > 0.01 or log kH > −2.0 (equivalent to a half-life of 3 days) will likely be significantly reduced prior to consumer's tap and thus is of less toxicological concern.

Comparison of predicted (*) and literature (▵, ○) data for hydrolysis rate constant (kH) of haloacetic acids. “n” denotes the number of disinfection byproduct (DBP) species; “m” denotes the number of literature data (see Table 1 for details); error bars indicate the 95% confidence intervals of the calibrated model.
Halomethanes
USEPA currently regulates four THMs, with a maximum contaminant level of 80 μg/L. Hydrolysis of trichloromethane (TCM, better known as chloroform) has been reported to be slow in acidic or neutral solutions but rapid in alkaline conditions (Shams El Din et al., 1998). The reaction of a THM and hydroxide (OH−) ion is a base-catalyzed hydrolysis in which the C-X bond breaks, a new carbon–oxygen (C-O) bond forms, and methanol and halogen anion are generated (Reaction 3) (Shams El Din et al., 1998):
The TCM hydrolysis rate is second order with respect to [OH−] but can be treated as first order at fixed pH (Shams El Din et al., 1998). The half-lives of monochloromethane, dichloromethane, and TCM in neutral water are 0.93, 704, and 3,500 years, respectively (Mabey and Mill, 1978). The trend indicates that less halogenated methanes are more labile than highly halogenated species. The effect of bromide incorporation on the stability of THM to hydrolysis differs between studies. For example, the USEPA database SCDM (USEPA, 2000) reported the laboratory-derived half-life of tribromomethane to be 686 years, less than the half-life of TCM (3,500 years). Another experiment in water–methanol mixtures confirmed this relative hydrolysis rate (Shams El Din et al., 1998). However, the structure-based program HydroWin in EPI suite (USEPA, 1997) suggests an opposite trend, with a longer hydrolysis half-life for tribromomethane (6,019 years) than TCM (3,407 years). Regardless, once formed, these compounds will persist in a typical water supply system because their half-lives are greater than the storage time within any distribution system, which are days rather than years.
Figure 2 shows the QSPR analysis of 12 chlorinated, brominated, and iodinated HMs with a total of 23 data points from the literature. The QSPR prediction results were somewhat in agreement with experimental data (RMSE = 0.75). The log kH of triiodomethane, a highly toxic compound (Plewa et al., 2004), was predicted to be −4.3, which is equivalent to a half-life of 1.4 years. Monoiodomethane is also stable, with a predicted half-life of 42 days. The predictions thus suggest that many iodinated HMs may be persistent and risky to public health if other mechanisms do not transform them too. This analysis demonstrates the use of QSPR to avoid tests of slow-reacting compounds, especially in the presence of rapidly concurrent mechanisms. For example, when volatilization dominates the TCM transformation process, it is very difficult to measure its kH accurately.

Comparison of predicted (*) and literature (▵, ○) data for hydrolysis rate constant (kH) of halomethanes. “n” denotes the number of DBP species; “m” denotes number of literature data (see Table 1 for details); error bars indicate the 95% confidence intervals of calibrated model.
Haloacetaldehydes
Similar to HAAs, the end products of HA hydrolysis are HMs, indicating that HAs undergo decarboxylation during hydrolysis (Reaction 4) (Xie, 2004):
Figure 3 presents QSPR predictions and literature data for HAs, which agree well with an RMSE of 0.34. Brominated species exhibit lower stability (i.e., high kH) than their chlorinated analogs, and the more halogen substituted, the lower will be the compound's stability. QSPR predicted triiodoacetaldehyde to be the most labile HA, with a log kH of 3.55 (Table 2) and a half-life of <1 s. With such a short half-life, its abundance in water is unlikely to be high, which reduces the possibility of accurate detection under normal laboratory conditions. The number of data points available for QSPR analysis is less than two times the number of equation (3) coefficients; hence, the predicted data are open to experimental verification.
Comparison of predicted (*) and literature (▵, ○) data for hydrolysis rate constant (kH) of haloacetaldehydes. “n” denotes the number of DBP species for model calibration; “m” denotes number of literature data for model calibration and validation (see Table 1 for details); error bars indicate the 95% confidence intervals of calibrated model.
Haloketones
HKs are unstable in both ultrapure and raw water under alkaline conditions. TCM and dichloroacetic acid both are byproducts of 1,1,1-trichloroproponane hydrolysis, suggesting that the hydrolysis pathway involves fissions of the C-C and C-X bonds (Reaction 5) (Reckhow and Singer, 1985; Nikolaou et al., 2001).
Hypochlorite and sulfite can catalyze the hydrolysis reaction (Reckhow and Singer, 1985; Croue and Reckhow, 1989). The stability of HKs also decreases with elevated temperature as well as with halogen atomic weight but is less dependent on the number of halogen atoms (Nikolaou et al., 2001). The kH of 1,3-dichloropropanone (0.22 h−1) is 10 times faster than that of 1,1-dichloropropanone (0.022 h−1) (Nikolaou et al., 2001), indicating that the steric position of the halogen atom is also important.
Figure 4 presents the QSPR-predicted and literature rate constants of nine chlorinated and brominated HKs. Seven kH values for five HK species were available from three studies, and the halogen atoms of all compounds studied in this article are in the 1,1,1- positions. Figure 4 shows that both chlorinated and brominated HKs can undergo rapid hydrolysis (kH > 0.01 h−1, which corresponds to a half-life of <3 days). Iodinated species are the most susceptible HKs, with triiodopropanone having a log kH of 5.2 and a half-life of <1 s. The potential for its existence in water and thus human exposure is low as a result. This may also help explain why HKs are less frequently detected in water than HAAs and THMs.

Comparison of predicted (*) and literature (▵, ○) data for hydrolysis rate constant (kH) of haloketones. “n” denotes the number of DBP species for model calibration; “m” denotes number of literature data for model calibration and validation (see Table 1 for details); error bars indicate the 95% confidence intervals of calibrated model.
Haloacetonitriles
The hydrolysis of HANs can be either acid or base or hypochlorite catalyzed, involving either nucleophile hydration of OH− or rupture of the C ≡ N linkage. The process leads to the formation of haloacetamides that can undergo further hydrolysis to form HAAs (Glezer et al., 1999). Another study confirms such a reaction pathway but indicates that trichloroacetamide is the only byproduct formed under neutral pH and in the presence of goethite (Reaction 6) (Chun et al., 2005).
Both trichloroacetonitrile and tribromoacetonitrile have half-lives shorter than 3 days, and the kH of trichloroacetonitrile is higher than that of tribromoacetonitrile (Croue and Reckhow, 1989). Figure 5 depicts the HAN kH values from both QSPR modeling and the literature. Although the magnitudes of kH in different studies vary by up to two log scales, the impact of halogen number and type on hydrolytic stability is clear. That is, kH increases with increasing level of halogenation or decreasing halogen atomic weight. The log kH values of monoiodoacetonitrile and triiodoacetonitrile were predicted to be −3.95 and −2.38, which equal half-lives of 451 and 10 days, respectively.
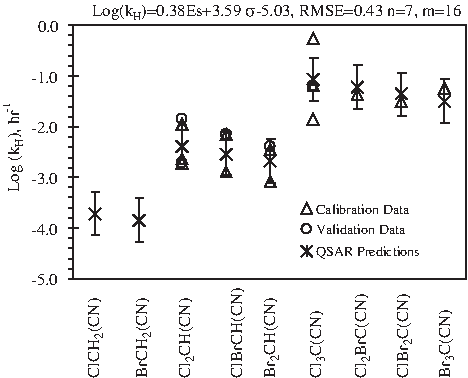
Comparison of predicted (*) and literature (▵, ○) data for hydrolysis rate constant (kH) of haloacetonitriles. “n” denotes the number of DBP species for model calibration; “m” denotes number of literature data for model calibration and validation (see Table 1 for details); error bars indicate the 95% confidence intervals of calibrated model.
Cyanogen halides are DBPs also containing a nitrile (C ≡ N) group. The kH of cyanogen halides, however, are much lower than those of HANs (Table 1), suggesting that the alkyl group can destabilize the nitrile bond. Cyanogen chloride degrades rapidly in alkaline condition (Pedersen and Marinas, 2001) and in the presence of free chlorine or sulfite but is stable in the presence of monochloramine (Xie and Reckhow, 1992; Na and Olson, 2004). QSPR could not be used because kH values are available for only two compounds, cyanogen chloride and cyanogen bromide, and QSPR analysis requires at least three species. The reaction pathway of cyanogen halides is different from that of HANs, as it involves a nucleophile hydration and dehalogenation process that leads to the formation of cyanate and halogen ions (Reaction 7) (Xie, 2004).
Comparison of different DBPs
Figure 6 presents the hydrolysis rate constants of five groups of DBPs resulting from the QSPR analyses described earlier. This work revealed the effects of chemical functional group, halogen type, and halogen number on the hydrolytic stabilities of regulated and emerging DBPs. HKs, HANs, and HAs are generally more hydrolysable than THMs and HAAs according to the order HK > HAN > HA > HAA > THM for chlorinated and brominated species. Within a single DBP group, kH increases with increasing halogen number (except within HMs) and with substitution of higher-atomic-weight halogens, according to the order F < Cl < Br < I (except within HANs).
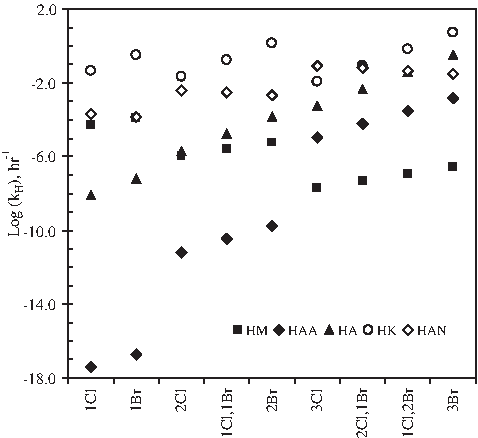
Comparison of the predicted hydrolysis rate constants (kH) of five groups of DBPs. x-axis shows numbers and types of halogens in compounds. HM, halomethane; HAA, haloacetic acid; HA, haloacetaldehyde; HK, haloketone; HAN, haloacetonitrile.
The reaction pathways are of several types: the single carbon species, including HMs and cyanogen halides, are labile to dehalogenation (C-X fission); HANs undergo nitrile bond breakage; and other carbon–carbon (C-C) species, including HAAs, HAs, and HKs, are more subject to decarboxylation (C-C breakage). The combined effects of hydrolysis kinetics and reaction pathways may explain why the regulated THMs and HAAs are detected more frequently than HANs, HAs, and HKs.
The steric coefficients (δ) of HMs, HAAs, HAs, and HKs are negative, and the products of δ and Es are positive, indicating the lower stability with this coefficient. In contrast, the products of polar coefficients (ρ) and σ of THMs, HAs, and HKs are negative; therefore, the polar effect is thus in opposition to the steric effect. The ratios of the polar coefficient to the steric coefficient (ρ:δ) for THMs (4.8) and HANs (9.5) are significantly greater than those for HAAs (−1.1) or HAs (0.9), suggesting that decarboxylation tends to occur for groups with low ρ:δ. HKs have an intermediate ratio of ρ:δ (2.2), so their hydrolysis pathways involve both dehalogenation and decarboxylation.
Conclusions
This article reviewed the hydrolysis of a series of regulated and emerging DBPs. Most halogenated DBPs appear to favor alkaline and high-temperature hydrolysis. Hydrolysis of HAAs, HAs, and HKs yields HMs, and hydrolysis of HANs leads to formation of HAAs and HAs. Iodinated species are typically more labile than their chlorinated and brominated analogs and thus of less concern. But certain iodinated species, for example, triiodomethane and triiodoacetonitrile, are predicted to be stable and thus may require special attention in the future. Chlorine and sulfite can catalyze HK, HAN, and cyanogen halide hydrolysis, whereas it hardly affects HAA and THM stability. The effect of chloramine on cyanogen chloride is negligible and unknown for other types of DBPs. The study conditions are representative of a common situation without interferences but not indicative of certain engineered systems, such as a steel pipe maintaining disinfectant residual level to control biofilm or a river downstream of wastewater treatment plant applying sulfite as disinfectant quencher. Future efforts may investigate the individual or combined effects of biofilm, pipe material, chlorine, chloramine, and disinfectant quenchers.
This article also demonstrated the use of QSPR analysis to complement the knowledge gaps of DBP properties that have occurred because of too slow or too rapid kinetics, interferences by concurrent mechanisms, or reference product unavailability issues. Good QSPR practice is determined mainly by the number of data points and species available for calibration and validation. When employing information with various origins, the experimental settings of previous research also affect QSPR. A common set of conditions needs to be selected to facilitate comparison. In addition, the differences between the hydrolysis pathways of various groups of DBPs (e.g., HANs vs. HAAs vs. HMs) emphasize that QSPR is applicable within a single group but not across different groups of compounds. Although the results of this study are not perfect substitutes for laboratory experiments, they may serve as preliminary estimates to guide future studies into more complicated conditions.
Footnotes
Acknowledgments
This work was supported by the Water Research Foundation (Project No. 2948, previously the American Water Works Association Research Foundation); the project manager was Alice Fulmer, and the principal investigator was Dr. Stuart Krasner. Special thanks go to professors David Reckhow (University of Massachusetts, Amherst) and Paul Westerhoff (Arizona State University), who inspired the idea.
Author Disclosure Statement
No competing financial interests exist.