
Abstract
Abstract
Ambient air samples were collected between September 3, 2009 and March 5, 2010 to determine total suspended particulate matter (TSP) and coarse and fine particulate and particle-bound mercury Hg(p) at the suburban/coastal sampling station of Sha-Lu at Taiwan. Results reveal that average concentrations of ambient air particles PM2.5, PM2.5–10, dry deposition, and TSP were 20.5 ± 6.3 (μg/m3), 11.2 ± 4.44 (μg/m3), 162 ± 92.7 (μg/[m2 min]), and 78.7 ± 34.4 (μg/m3), respectively. Average concentrations of PM2.5, PM2.5–10, dry deposition, and TSP of bound mercury Hg(p) were 0.007 ± 0.005 (ng/m3), 0.011 ± 0.006 (ng/m3), 0.156 ± 0.082 (ng/[m2 min]), and 0.07 ± 0.04 (ng/m3), respectively. Average calculated/measured dry deposition flux ratios with coarse (3.8 μm) and fine (0.68 μm) particle size for ambient air particle and particle-bound mercury Hg(p) by using Zhang's combined with William's were 2.49 and 3.44, respectively. Finally, results of this study also indicate that using Zhang's combined with William's model with the coarse (3.8 μm) and fine (0.68 μm) particle size exhibits better prediction results in ambient air particle and particle-bound mercury Hg(p) when compared with results of Zhang's model with average particle size (20 and 23 μm) in TSP for prediction of dry deposition.
Introduction
Mercury can be emitted to the air in various chemical forms, also known as mercury species. The impact of Hg chemical properties on an emission abatement measure is not too important for primary measures. The chemical form of emitted Hg seems to be especially important when a secondary measure is going to be applied. An illustrative example to support this idea can be had by considering the possible Hg products arising from coal combustion (Meij and Winkel, 2004; Hlawiczka and Fudala, 2008). When coal is burned in a boiler, the high combustion temperature vaporizes any Hg present in the form of gaseous elemental mercury (Hg0). Cooling the combustion gases and interaction of gaseous Hg0 with other combustion products results in a portion of the elemental mercury being converted to gaseous oxidized forms of mercury (Hg(II)) and particle-bound mercury (Hg(p)). Thus, the total Hg in flue gases is the sum of Hg(p), Hg(II), and Hg0 (Pavlish et al., 2003).
Although the overwhelming majority of airborne mercury is Hg0, Hg2+ and Hg(p) are more readily dry and wet deposited and can have more significant impacts near emission sources (Lai et al., 2007). Dry deposition is considered a main pathway for removal of contaminants from the atmosphere. However, while eliminating constituents from the atmospheric environment, these pathways transport constituents to terrestrial surfaces and receiving waters (Artina et al., 2007).
Hg0 is believed to have an atmospheric lifetime of about 1 year (Lindqvist and Rodhe, 1985; Slemr et al., 1985; Sakata and Asakura, 2007), whereas RGM and Hg(p) have a much shorter atmospheric lifetime.
Particulate mercury (Hg(p)) is associated with airborne particles, such as dust, soot, sea-salt aerosols, or ice crystal (Lu and Schroeder, 2004), or is likely produced by adsorption of RGM species (e.g., HgCl2) onto atmospheric particles (Sakata and Marumoto, 2002; Lu and Schroeder, 2004). Milford and Davidson (1985) compiled size spectra of trace metals and inferred a mass median diameter of 0.61 mm for Hg bound to particles, whereas Keeler et al. (1995) observed an overall mass median diameter of 0.80 mm, originating from a bimodal distribution centered around 0.68 and 3.8 mm.
The purpose of this study was to (1) measure the concentration of atmospheric particle-bound mercury Hg(p) dry deposition, concentration, fine and coarse particulates concentrations, and the dry deposition velocities using a projection film as a collection medium, (2) determine the mean Hg(p) contents at different particulate size, and (3) compare the monthly distributed concentrations of Hg(p) obtained in this study with those in other sampling areas, (4) compare the dry deposition fluxes with the calculated values using various models with measured dry deposition fluxes for particles and particle-bound mercury Hg(p).
Methods
Sampling location
The present geographic location of the Bei-Shi sampling station in Sha-Lu, Taichung, Taiwan, is (24°13′, 12°34′). The sampling site is located at a building that is five-story tall (16 m) and the stand was located on the top roof of this building and it can be adjusted in height between 130 cm and ∼200 cm is a suburban/coastal station and is unobstructed. The immediate vicinity is residential, and a heavy traffic expressway is located about 2 km east of the station. A Taiwan EPA air-quality monitoring station is located roughly 10 m to the northwest of the Bei-Shi sampling station (Fig. 1).
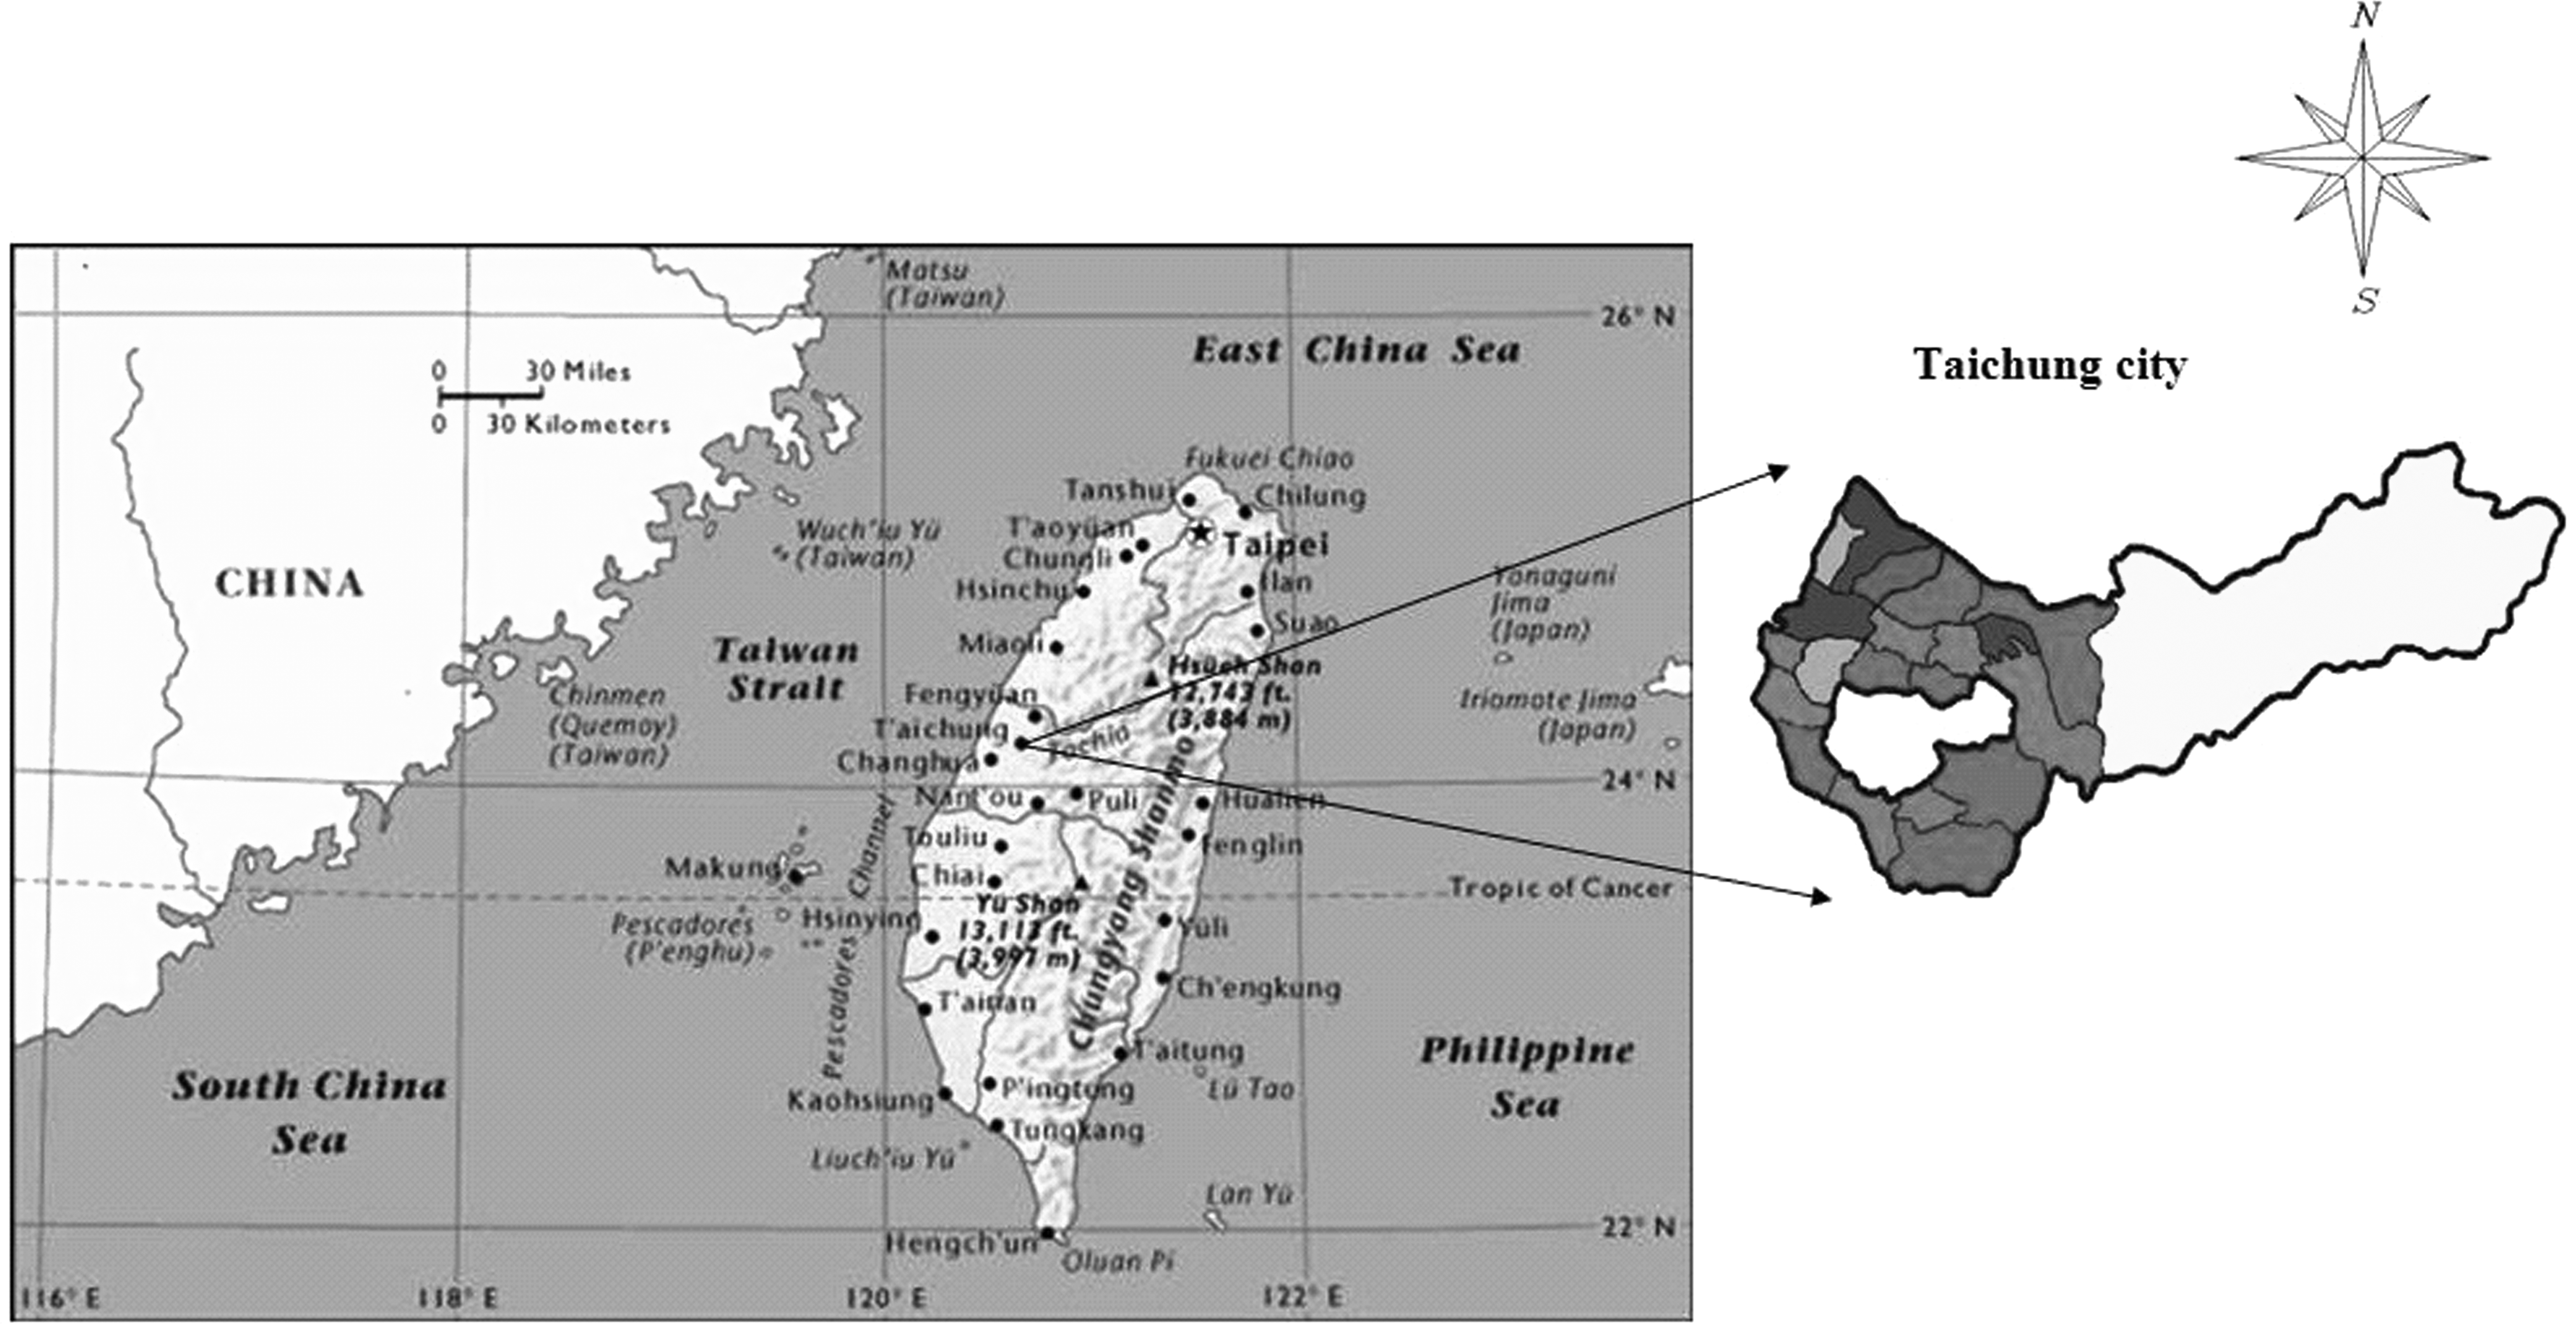
Geographic location of the sampling station.
Dry deposition model
Zhang's model
Zhang et al. (2001) have used the same method as Slinn's (1982) for modeling particle dry deposition, but used a simplified empirical parameterization for all deposition processes. The dry deposition velocity V
d is expressed as
where V g is the gravitational settling velocity, R a is the aerodynamic resistance above the canopy, and R s is the surface resistance.
The aerodynamic resistance is calculated as
where Z
R is the height at which the dry deposition velocity V
d is calculated, Z
0 is the roughness length, ΨH is the stability function, k is the Von Karman constant, u
* is the friction velocity, and R
s is parameterized as
where E B, E IM, and E IN are the collection efficiencies of collection Brownian diffusion, impaction, and interception, respectively; R 1 is the correction factor representing the fraction of particles that stick to the surface; and ɛ 0 is an empirical constant, which is taken as 3 for all land use categories.
Evidence exists that the efficiency associated with Brownian diffusion is a function of Schmidt number, Sc, given as
The Schmidt number is the ratio of the kinematic viscosity of air, ν, to the particle Brownian diffusivity, D (Sc = ν/D). γ usually lies between 1/2 and 2/3, with larger values for rougher surfaces.
The parameter that governs impaction process is the Stokes number, St, which has the form St = V
g u
*/gA for vegetated surfaces (Slinn, 1982) and St = V
g u
*
2/ν for smooth surfaces or surfaces with bluff roughness elements (Giorgi, 1988). A is the characteristic radius of the collectors. The detail of Zhang's model is described in detail in a previous study (Zhang et al., 2001).
Combining Zhang and William's models
The particle dry deposition of Hg(p) particles was calculated as follows:
where Flux Hg(p) is the of dry depositions of Hg(p) (ng/[m2 h]), and [Hg(p), i ] and V d,i are the ambient Hg(p) concentration (ng/m3) and particle dry deposition velocity (m/h) of particles of size i, respectively. The meteorological data and the Hg(p) mass median aerodynamic diameters (0.68 μm for the fine particle fraction and 3.8 μm for the coarse particles) (Keeler et al., 1995) were incorporated into Williams' (1982) model to calculate V d.
Twenty and 23 μm average particle sizes in total suspended particulate matter (TSP) were selected in this study to model the particle-bound mercury dry deposition fluxes (Ghose and Majee, 2007; Hoffmann et al., 2008). Then, calculated dry deposition velocities will be multiplied by the measured ambient air concentrations to obtain calculated dry deposition fluxes for ambient air and particle-bound mercury (Hg(p)). The calculated dry deposition fluxes will then be compared with the measured dry deposition fluxes. The results of the fluxes ratios for calculated/measured dry deposition were then used to evaluate whether the results over- or underestimate the dry deposition fluxes.
TSP included particles with mean sizes of 20 and 23 μm (Williams, 1982; Keeler et al., 1995) and Zhang's model was used to model the dry deposition fluxes of ambient air particles and particle-bound mercury. Fine (PM2.5) and coarse (PM2.5–10) particle concentrations, referring to particles of sizes of 0.68 and 3.8 μm (Keeler et al., 1995), were used in a model that combined Zhang and Williams' models. This study elucidates the combined model and the results for the dry deposition of ambient air particles and particulate-bound mercury Hg(p). Calculated dry deposition velocities were multiplied by the measured ambient air concentrations to obtain calculated dry deposition fluxes for particle in ambient air and particle-bound mercury Hg(p). The calculated dry deposition fluxes were then compared with the measured dry deposition fluxes. The resulting flux ratios for calculated/measured dry deposition flux rations were then used to determine whether the results over- or underestimated the dry deposition fluxes for ambient air particulates and particulate-bound mercury Hg(p) at suburban/coastal sampling sites.
Experimental
Sampling program
PS-1 sampler
The PS-1 sampler is a complete air sampling system that is designed to collect total suspended airborne particles (Graseby-Andersen, GMW High Volume Air Sampler). The largest particles that can be collected by PS-1 sampler are 100 μm. The sampler's flow rate was adjusted to 200 L/min and a quartz filter (diameter 10.2 cm) was used to filter suspended airborne particles. Prior to use, all filters were conditioned for 24 h in an electric chamber with humidity set to 35% ± 5% and temperature set to 25°C ± 5°C prior to both on and off weighing. Filters were placed in sealed plastic compact disk cases during transport and storage process. And the average sampling time for PS-1 was about 1,410 ± 50 min. The particles were sampled and analyzed as described elsewhere (Fang and Lee, 2008).
Versatile air pollutant sampler
A versatile air pollutant sampler (VAPS, URG-3000K; URG Corp., Chapel Hill, NC) was utilized to collect PM2.5 and PM2.5–10 samples simultaneously. Samples were taken over a 24-h period 6–10 times per month during the two sampling periods. The sampler (VAPS) has a single inlet assembly (PM10) and is designed to remove particles with aerodynamic diameters of >10. The flow was 32 L/min. Quartz filters with a diameter of 47 mm (ZeflourTM Supported PTFE, PALL) were used to collect ambient particulates. And the average sampling time for VAPS was about 1,430 ± 25 min. The sampling and analysis procedures were the same as in a previous study (Fang et al., 2006).
Dry deposition plate
A dry deposition plate (DDP) was used. It comprised a smooth, horizontal, surrogate surface that provided a lower bound estimate of the dry deposition flux. The DDP consisted of a smooth surface plate made of polyvinyl chloride and measured 21.5 cm long, 8.0 cm wide, and 0.8 cm thick. The DDP also contained a sharp, leading edge that was pointed into the prevailing wind. Each plate was covered on top with thick projection film filters coated with ∼20 mg of silicone grease to collect impacted particles. After the average was sprayed onto the overhead projection film, the overhead projection film were backed in an oven at 60°C for 2 h to remove volatile substances; all filters were maintained in a condition of 50% relative humidity and temperature of 25°C for over 48 h prior to sampling use and were weighed to 0.001. And the average sampling time for DDP was about 1,430 ± 25 min. The sampling procedure was as used previously (Fang et al., 2009).
Formula and calculation
After exposure to the atmosphere for equilibration, the following steps were followed:
Wash the cut surrogate surface (44 cm2). Coat the adsorbent (with silicone grease). Weigh the filter after moisture equilibrium is obtained (24 h) (w
0). Expose the filter in the field and record the sampling day and sampling time (t) (about 24 h). Reweigh the filter after obtaining the moisture equilibrium (w
1) and store it for subsequent Hg analysis.
The following equations were used to determine particle concentration and dry deposition flux.
Concentration = [w 1 − w 0]/[t (min) × Q (L/min)]
Flux = [w 1 − w 0] (μg)/[Area (m2) × t (min)]
V d (cm/s) = Flux (μg/[m2 min])/TSP (μg/m3)
Chemical analysis
The concentrations of Hg from each sample (overhead projection film) were analyzed using a direct Hg analyzer (DMA-80 Milestone, Shelton, CT). Approximately 30 mg of the filter sample was loaded directly into the DMA and analyzed using methods described previously (Basu et al., 2009; Lin et al., 2010). The methodology is based on the thermal decomposition of the sample and the collection of Hg vapor on a gold amalgamator. The filter samples were placed in a sampling boat and transferred to a combustion tube that contained a catalyst. The sample was first dried at 200°C prior to combustion at 615°C–650°C in an aerobic atmosphere. The Hg vapor was collected in a gold amalgamator and after a predefined time at 170°C the gold amalgamator was heated up to 900°C. The released Hg was transported to a heated cuvette at 125°C and then analyzed by atomic absorption spectrometry using a silicon UV diode detector. The operation conditions were drying for 30 s at 200°C, decomposition for 90 s at 650°C, and combustion for 90 s at 650°C. The analysis procedure was as previously described (Fang et al., 2009).
Quality control
Analytical accuracy and precision were determined using Standard Reference Materials (DOLT-3 and TORT-2 from the National Research Council of Canada) and by intermittent analysis of duplicate samples. The average recovery rates of total mercury (Hg) from DOLT-3 and TORT-2 were within the certified values (±10%). The detection limit for the direct Hg analyzer (DMA-80 Milestone) was 0.025 ng and ranged from 0.022 to 0.030 ng. The analysis procedure was as previously described (Fang et al., 2009).
Results and Discussion
Table 1 describes the atmospheric particle-bound mercury Hg(p) and particle concentrations (PM2.5, PM2.5–10, and PM10) at the Bei-Shi sampling site in Taiwan, obtained using a projection film as a collection medium. The average concentrations of fine particulates (PM2.5), coarse particulates (PM2.5–10), and PM10 particulates and the fine/coarse ratio were 20.5 ± 6.3, 11.2 ± 4.44, 31.7 ± 9.3 (μg/m3) and 2.08 ± 0.99, respectively. The fine/coarse Hg(p) particulates ratio was about 2.08. The concentration of PM2.5 particulate-bound mercury Hg(p) was 0.007 ± 0.005 ng/m3, whereas that of PM2.5–10 Hg(p) particulate-bound mercury Hg(p) was 0.011 ± 0.006 ng/m3. The fine/coarse Hg(p) particulate ratio was about 0.72. The average PM10 particle-bound mercury Hg(p) concentration was 0.018 ± 0.01 ng/m3. The results indicated that the correlation for average monthly concentration for atmospheric particulate-bound mercury Hg(p) were significantly different for each month ( p < 0.05). In addition, the correlation coefficients for ambient air particulate-bound mercury Hg(p) concentrations (PM2.5, PM2.5–10, and PM10) were also analyzed in the study.
Table 2 presents the atmospheric particle average TSP concentrations, dry deposition velocities, particle-bound mercury Hg(p) dry deposition, concentration, and Hg(p) in dry deposition velocities using projection film as a collection medium at the Bei-Shi sampling site in Taiwan. The results indicated that the concentrations of TSP ranged from 31.7 to 209.6 μg/m3. And the average TSP was 78.7 μg/m3. Moreover, the results indicated that the average particle-bound mercury Hg(p) in TSP was 0.07 ng/m3. The ranges for Hg(p) TSP concentrations were from 0.004 to 0.14 ng/m3. In general, dry deposition flux of particulates ranged from 15.8 to 347.8 μg/(m2 min). And the results indicated that the average dry deposition was 162.1 μg/(m2 min), whereas the average particle-bound mercury Hg(p) in dry deposition was 0.156 ng/(m2 min) and the Hg(p) dry deposition flux of particulates ranged from 0.003 to 0.342 ng/(m2 min). Moreover, the dry deposition velocity ranged from 0.4 to 9.92 cm/s. And the results also indicated that the average dry deposition velocity was 3.7 cm/s, whereas the results indicated that the average particle-bound mercury Hg(p) in dry deposition velocity was 4.09 cm/s and the Hg(p) in particulate dry deposition velocity ranged from 1.25 to 8.58 cm/s at the sampling site.
Figure 2 shows the average monthly concentrations of TSP, PM2.5, and PM2.5–10 at the Bei-Shi sampling station. The results indicate that the average atmospheric particle concentrations at the Bei-Shi sampling station were highest in December 2009 (115 ± 17.0 μg/m3) and lowest in February 2010 (48.1 ± 27.6 μg/m3). The average highest concentrations of PM2.5 and PM2.5–10 were 22.1 ± 3.8 and 12.9 ± 3.4 μg/m3, whereas the average lowest concentrations of PM2.5 and PM2.5–10 were 18.6 ± 7.3 and 8.68 ± 5.0 μg/m3, respectively, at the Bei-Shi sampling station. Additionally, the results show that the average monthly variations in particle concentrations in TSP, PM2.5, and PM2.5–10 were highest in December, January, and January, respectively.
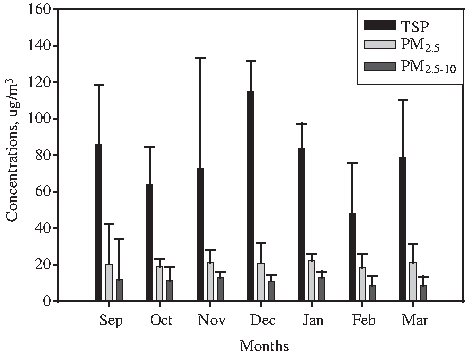
Average concentrations of total suspended particulates (TSP), PM2.5, and PM2.5–10 (ng/m3), with respect to monthly variations at the Bei-Shi sampling station.
Figure 3 displays the average monthly variations in the concentrations of TSP, PM2.5, and PM2.5–10 particulate-bound mercury Hg(p) at the Bei-Shi sampling station. The results indicate that the average atmospheric particle-bound mercury Hg(p) concentrations at the Bei-Shi sampling station were highest in September 2009 (0.14 ± 0.039 ng/m3) and lowest in October 2009 (0.004 ± 0.033 ng/m3). The average bound mercury Hg(p) particulates' concentrations (ng/m3) followed the order March (0.11 ± 0.026) > September (0.083 ± 0.04) > February (0.077 ± 0.034) > December (0.083 ± 0.031) > November (0.062 ± 0.039) > January (0.058 ± 0.018) > October (0.037 ± 0.033). The average atmospheric PM2.5 particle-bound mercury Hg(p) concentration was highest in November (0.0088 ± 0.0059 ng/m3) and lowest in March (0.0052 ± 0.003 ng/m3). The average PM2.5 bound mercury Hg(p) concentrations (ng/m3) followed the order November (0.0088 ± 0.0058) > October (0.0086 ± 0.063) > September (0.0083 ± 0.0069) > December (0.0082 ± 0.0063) > February (0.0066 ± 0.0036) > January (0.0053 ± 0.0021) > March (0.052 ± 0.0028). In addition, the average atmospheric PM2.5–10 particle-bound mercury Hg(p) concentration was highest in November (0.0134 ± 0.013 ng/m3) and lowest in March (0.0065 ± 0.0022 ng/m3). The average PM2.5–10 bound mercury Hg(p) concentrations (ng/m3) followed the order November (0.0134 ± 0.0132) > December (0.0126 ± 0.368) > September (0.0117 ± 0.345) > October (0.011 ± 0.385) > February (0.010 ± 0.0988) > January (0.010 ± 0.0041) > March (0.0064 ± 0.413) at the Bei-Shi sampling site.

Monthly variations of average concentrations of particulate-bound mercury Hg(p) in TSP, PM2.5, and PM2.5–10 (ng/m3) at the Bei-Shi sampling station.
Figure 4 displays the average calculated/measured particulates to estimate the dry deposition flux of ambient air particulates and particulate-bound mercury Hg(p) in coarse (3.8 μm) and fine (0.68 μm) particles at the Bei-Shi sampling site using the model that combines Zhang and Williams' models. The ratio of the calculated to measured dry deposition flux of the ambient air particles was in the range of 0.505–12.1. The results of the model also indicate that the average calculated/measured flux ratio for ambient air particulates, coarse (3.8 μm) and fine (0.68 μm) particulate, was 2.49. The average calculated/measured dry deposition flux for coarse (3.8 μm) and fine (0.68 μm) particulate-bound mercury Hg(p) using the model that combines Zhang and Williams' model was 3.44 at the Bei-Shi sampling site.

Average calculated/measured particulates dry deposition flux to estimate ambient air particulate and particulate-bound mercury Hg(p) with coarse (3.8 μm) and fine (0.68 μm) particle size by using Zhang's combined with Williams' model at the Bei-Shi sampling site.
Figure 5 displays the average calculated/measured dry deposition flux of particulates to estimate the particulate and particulate-bound mercury Hg(p) concentrations for average particle sizes of 20 and 30 μm in ambient air in TSP model at the Bei-Shi sampling site using the Zhang's model. The average calculated/measured ratio for the dry deposition and particle-bound mercury Hg(p) for particles of size 20 μm ranged from 1.63 to 40.7 and from 1.88 to 13.0, respectively. The calculated/measured ratios for dry deposition fluxes and dry deposition Hg(p) fluxes for particles of size 23 μm ranged from 1.65 to 41.3 and 1.91 to 13.2, respectively. The average calculated/measured flux ratio for ambient air particulates with average particle sizes of 20 and 23 μm particulate in TSP obtained using Zhang's model were 8.5 and 8.17, respectively. The average calculated/measured ratio for the dry deposition flux of particulate-bound mercury Hg(p) for 20- and 23-μm particulate in TSP obtained by Zhang's model were 5.46 and 5.54 at the Bei-Shi sampling site. Noteworthy, photochemical reaction might have also occurred on the particle surface for the particle-bound mercury (Hg(p)) and this mechanism will make Hg2+ reduce to Hg0. And Hg0 will also easily escape from the particle surface because of its high vapor pressure. The above reaction is temperature dependent and this reaction will also influence the difference between the measured and modeled fluxes results.

Average calculated/measured particulates dry deposition flux to estimate ambient air for particulate and particulate-bound mercury Hg(p) with average particle size (20 and 23 μm) in TSP by using Zhang's model at the Bei-Shi sampling site.
Conclusions
The main conclusions of this study are as follows:
At the Bei-Shi suburban/coast sampling site, the monthly average PM2.5 concentrations were 22.1 ± 3.8, 21.2 ± 6.80, 21.2 ± 10.0, 20.8 ± 10.9, 20.5 ± 21.9, 18.9 ±4.0, and 18.6 ± 7.3 μg/m3 for January, November, March, December, September, October, and February, respectively. The monthly average PM2.5 concentrations of particulate-bound mercury Hg(p) were in the order November > October > September > December > February > January > March.
At the Bei-Shi suburban/coast sampling site, the average monthly PM2.5–10 concentrations were 21.2 ± 2.7, 12.9 ± 3.4, 11.9 ± 22.3, 11.4 ± 7.5, 11.1 ± 3.5, 8.78 ± 4.8 and 8.68 ± 5.0 μg/m3 for November, January, September, October, December, March, and February, respectively. The average monthly PM2.5–10 concentrations of particulate-bound mercury Hg(p) were in the order November > September > December > October > January > February > March.
The average atmospheric particulate dry deposition and particle-bound mercury Hg(p) dry deposition fluxes were both highest in November. And the average lowest atmospheric particulate dry deposition and particle-bound mercury Hg(p) dry deposition fluxes occurred in February and October, respectively.
At the Bei-Shi suburban/coast sampling site, the average calculated/measured ratio for ambient air particle dry deposition fluxes for particles of sizes 3.8 μm and 0.68 μm obtained using Zhang's model combined with Williams' model was 2.49. The average calculated/measured ratio for particle-bound mercury Hg(p) dry deposition fluxes in ambient air for particle sizes of 3.8 μm and 0.68 μm obtained using Zhang's model combined with Williams' model was 3.44.
At the Bei-Shi suburban/coast sampling site, the calculated/measured ratio for ambient air particle dry deposition fluxes and particle-bound mercury Hg(p) dry deposition fluxes for particle of sizes 20 μm using Zhang's model ranged from 1.63 to 40.7 and 1.88 to 13.0, for the 37 sampling groups. The calculated/measured ratio for particle dry deposition fluxes and particle-bound mercury Hg(p) dry deposition fluxes in ambient air for particles of size 23 μm, obtained by using Zhang's model, ranged from 1.65 to 41.3 and 1.91 to 13.2, respectively, for the 37 sampling groups.
The predictions concerning dry deposition made by combining Zhang's model with Williams' model for the coarse (3.8 μm) and fine (0.68 μm) particles are more accurate for particles in ambient air particle and particle-bound mercury Hg(p), than those obtained using Zhang's model for average particle sizes of 20 and 23 μm in TSP.
Footnotes
Acknowledgment
The authors gratefully acknowledge the financial support of the National Science Council of the ROC (Taiwan) under project No. NSC 96-2628-E-241-001-MY3.
Author Disclosure Statement
No competing financial interests exist.