
Abstract
Abstract
Aerobic biodegradation of polyhydroxybutyrate (PHB) was investigated. Mass loss experiments were performed to determine degradation kinetics. Tributyl citrate was blended with some test samples to determine the impact of a natural plasticizer on biodegradation. Effects of biodegradation in the physical, chemical, thermal, and mechanical properties of the materials tested were determined. Plates of different thicknesses (0.24, 1.2, 3.5, and 5.0 mm) were degraded to determine the effect of initial mass:initial surface area ratio on degradation rates. The mass:initial surface area is proportional to the plate thickness. PHB biodegradation rates obtained are dependent on the mass:surface area ratio. Temperature affects the relation of degradation rate to initial mass:initial surface area. PHB in plates up to a thickness of 3.5 mm can degrade completely in compost. Plates with an initial mass:initial surface area ratio of <67 will degrade in <4 months. Maximum degradation rates were obtained in plates 3.5 mm thick (1.57 mg cm−2 d−1) and the minimum in plates 0.24 mm thick (0.16 mg cm−2 d−1). Less than 14% degradation was observed in plates 1.2 mm thick with the additive tributyl citrate, compared to 100% for the plates of the same thickness without additive. No change in relative composition of molecular bonds, molecular weight, or thermal properties were observed. Impact strength of the specimens show little change until a significant loss of structure is observed.
Introduction
In nature, the most common biodegradable bioplastics are the polyhydroxyalkanoates (PHA), an aliphatic polyester produced by bacteria as a natural energy storage mechanism. The most abundant and studied PHA (Budwill et al., 1992; Luzier, 1992; Imam et al., 1998; Reischwitz et al., 1998, Jendrossek and Handrick, 2002) is polyhydroxybutyrate (PHB) and its copolymer (PHBV) with polyhydroxyvalerate. PHB degradation has been studied in vitro by a number of authors (Tomasi et al., 1996; Yoshie et al., 2000; Freier et al., 2002; Jendrossek and Handrick, 2002) using enzymes or isolated PHA degrading organisms. Although in vivo studies produce very reproducible results, very limited information on the biodegradation by natural microbial consortia can be obtained. Other studies have been performed under natural conditions (soil, fresh water, salt water, and municipal waste) or with mixed microbial cultures (Gilmore et al., 1992; Mergaert et al., 1994; Yue et al., 1996; Imam et al., 1998; Grima et al., 2000; Manna and Paul, 2000; Ohtaki and Nakasaki, 2000). Some of these studies have shown that PHA thin films and powder undergo a biodegradation equal or higher than other biodegradable polymers (Budwill et al., 1992; Krupp and Jewell, 1992; Luzier 1992; Reischwitz et al., 1998; Abou-Zeid, 2001; Rutkowska et al., 2008; Woolnough et al., 2008), making them good substitutes for petrochemical plastics for commodity products.
Commodity products made of bioplastics can be disposed of in compost piles and biodegraded by microbes. Biodegradation of PHB is an enzymatic surface process generally starting with initial biologically mediated hydrolysis by microbial PHB depolymerases. Simple hydrolysis (by inorganic processes) is difficult in PHB due to the hydrophobicity of the material, caused by alkyl pendant chains (Doi et al., 1990), so bacterial enzymes such as PHB depolymerases should be in contact with the biopolymer to start the biodegradation. The PHB depolymerases are produced by a wide number of microorganisms in many environments (He et al., 2001; El-Hadi et al., 2002; Jendrossek and Handrick 2002). After the initial hydrolysis, the degradation products such as oligomers, dimmers, and monomers (Jendrossek and Handrick, 2002; Guerin et al., 2010) can be metabolized by microorganisms to produce biomass, carbon dioxide, and/or methane (El-Hadi et al., 2002; Jayasekara et al., 2005), depending on the biodegradation environment.
The enzymatic degradation depends on the surface area exposed to the biodegrading organisms. Commodity plastic thickness and shape and hence the mass:surface area ratio depends on the intended use. A smaller mass:surface area ratio may result in a higher proportion of the mass to be exposed to the biodegrading organisms and their enzymes, leading to a shorter degradation time. Although some studies have worked with materials thicker than a film (Manna and Paul, 2000), few if any studies have considered at the impact of the initial mass:initial surface area on the degradation rate of the bioplastic or the effect of biodegradation on the degraded material. Gutierrez-Wing et al. (2010), working with PHB of different thicknesses degraded in wastewater, reported a saturation relationship between initial mass:initial surface area ratio and the actual anaerobic degradation rate of PHB, with little change of the characteristic of the remaining bioplastic during degradation. Differences in initial mass:initial surface area, as those obtained in plastic shapes of different thicknesses, can result in different degradation times that cannot be estimated through film degradation experiments. Also, thicker plastics may be considered for postconsumer recycling if the characteristics of the remaining plastic are adequate.
In an assessment of the impact of bioplastics, it is necessary to consider the possibility of recycle and reuse of the postconsumer plastic, even when the final disposal would lead to complete biodegradation. To this end, the effects of biodegradation on the physical, chemical, and mechanical properties of the bioplastic must be considered. Complete biodegradation of bioplastics can be achieved only if additives, such as plasticizers, fillers, and others, do not modify the biodegradability of the resulting material. Few biodegradation studies have considered the effects of additives on the degradation of biopolymers (Hakkarainen, 2002). Studies on the degradation of polylactic acid and polycaprolactone indicate that the effect of the additives on the biodegradation is related to the change on surface properties and crystallinity (Renstad et al., 1998; Hakkarainen, 2002).
The overall goals of this research were to assess the mass loss through aerobic biodegradation in compost of a bioplastic obtained from a commercial producer considering the initial mass:initial surface area ratio and determine how biodegradation affects the characteristics of the material. The information obtained provides information on the influence of degradation times of commodity plastics of different thicknesses, as may be required for the production of disposable products, in compost piles. Additionally, a blend of the bioplastic with a natural additive (tributyl citrate [TBC]) was also tested for biodegradation to gain insight to the impact of such additives.
Materials and Methodology
Two mass loss experiments (ML1 and ML2) were performed to determine the impact of the initial mass:initial surface area ratio on the aerobic degradation kinetics of PHB disposed in a compost pile. The two experiments were conducted according to two different ASTM standards (ASTM D 5929–96, 2004; ASTM D 5338–98, 2003) to determine the effect of the experimental conditions on the biodegradation rates. The PHB powder (13 μm particle size) used to prepare the experimental plates was obtained from Metabolix, Inc. Wide Angle X-ray Diffraction (WAXD) analyses confirmed that in fact the material was PHB. TBC (Sigma-Aldrich 27497-100ML-F) was used as additive in the 85% PHB/15% TBC plates. TBC is a naturally derived, nontoxic citrate ester that has been approved as an additive/plasticizer for polymers (Labrecque et al., 1997). The specimens tested were PHB melt pressed plates 0.24 mm, 0.5 mm, 1.2 mm, 3.5 mm, and 5 mm thick and 85% PHB/15% TBC melt pressed plates 1.2 mm thick (Table 1). The number, height, and width of the plates 1.2 mm and 3.5 mm thick were selected to match the samples required for mechanical tests. The plates' chemical, thermal, mechanical, and physical properties were characterized before and after the biodegradation studies.
Numbers represent the size (width/length) of the plates in centimeters. The numbers in parentheses represent the number of plates per flask.
ML1, mass loss experiment 1; ML2, mass loss experiment 2; PHB, polyhydroxybutyrate; TBC, tributyl citrate.
Material preparation
To prepare the plates for the biodegradation studies, the PHB powder was pressed at 179°C until melted into plates of different thicknesses using a Carver Laboratory Press. The melting times ranged from 5 to 10 min (longer times were required for thicker plates). The plates were allowed to cool to room temperature in the molds and then retired from the mold and cured for at least 7 days to allow for complete chemical equilibrium and crystallization before use in the characterization analyses and biodegradation experiments. The 85% PHB/15% TBC blend were prepared with the same method as the PHB plates, after blending the TBC with the PHB powder in a Hakka Rheocord 90 Torque Rheometer System.
Material characterization
Chemical, physical, mechanical, and thermal characteristics of samples of the PHB and 85% PHB/15% TBC plates were characterized before, during, and after the experiments to determine the changes occurred in all the tested materials with biodegradation. Changes on material characteristics may impact the possible recovery and recycling of the remaining plastic.
Chemical properties
Molecular bonding characteristics were investigated by Fourier Transform Infrared Spectroscopy (FT-IR; Bruker Tensor 27 microspectrometer) for the raw PHB powder, the undegraded and degraded PHB plates (0.24 mm, 1.2 mm, 3.5 mm, and 5 mm thick), and the 85% PHB/15% TBC plates (1.2 mm thick). The analyses were performed in the region of 4000–600 cm−1 with a resolution of 4 cm−1 at 16 scans. The spectrograms were processed using OPUS Version 4.2 software.
Molecular weight was measured by Size Exclusion Chromatography (SEC) in the same samples described before. Plastic samples solutions at an approximate concentration of 5 mg mL−1 were prepared using chloroform (CHCl3) as a solvent. For the separation, a guard column (5 μm, 50×7.8 mm) and three Phenogel 300×7.8 mm columns (Phenomenex, Torrance, CA) were used: (1) 5 μm, 500 Å (1–15 K); (2) 5 μm, 10-4Å (5K–500 K); and (3) 10 μm, MXM (100–10,000 K). Three detectors in series were used: (1) Wyatt Heleos Multi Angle Light Scattering (MALS) detector equipped with a QUELS DLS detector; (2) Wyatt ViscoStar viscosity detector; and (3) Wyatt rEX Differential Refractive Index detector. All separations used an injection volume of 100 μL chloroform (1 mL min−1) as the eluent.
Thermal properties
Thermal analyses were performed by Differential Scanning Calorimetry (DSC; TA Instruments DSC 2920) for the PHB raw powder and all the undegraded and degraded PHB and 85% PHB/15% TBC blend plates according to ASTM D 3418–03 (2003). A heating rate of 5°C min−1 in a liquid nitrogen atmosphere was utilized. Sample sizes of ∼5–10 mg were used for all analyses. The samples were heated to 200°C (first heating) and held for 0.5 min, and then cooled to −20°C for 1 min (cooling) and reheated to 200°C (second heating). TA Universal Analysis V3.9A software was used to obtain melting temperature (Tm), melting enthalpy (ΔHm), crystallization temperature (Tc), and crystallization enthalpy (ΔHc) from the thermograms generated. Tm and Tc were taken as the onset points of melting or crystallization, respectively. The properties of different plate thickness were compared for all the degradation times. Tm and ΔHm were calculated for the first and second heating.
Mechanical properties
The mechanical tensile strength (Instron 4301) of the undegraded PHB melt-pressed plates was determined in quintuplicate in accordance with the ASTM D 638–03 (2003) standard. The specimens were cured at room temperature for at least 7 days after the plates were melt-pressed and then for three additional days at 23°C and relative humidity of 50% before testing. Specimens with a thickness of 1.2 mm were tested at a crosshead speed of 3.0 mm min−1 and sample rate of 6.667 points s−1. Impact resistance was measured by the notched Izod pendulum impact testing (Tinius Olsen Model 892 Pendulum Impact tester) in quintuplicate for undegraded and degraded specimens of the PHB melt-pressed plates (3.5 mm thick) in accordance with ASTM D 256–06a (2006).
Physical properties
Scanning electron microscopy (SEM; Stereoscan 260 scanning electron microscope) images of undegraded and degraded melt-pressed plates of the PHB and the PHB/15% TBC blend were recorded to examine surface morphology. Samples were sputter-coated with gold before the SEM analysis.
Biodegradation studies
Specimens of varying thickness and thus varying initial mass:initial surface area (Table 1) were degraded in ML1 and ML2 to determine the impact of this ratio on the degradation rate. An 85% PHB/15% TBC blend was tested to evaluate the impact of additives on the biodegradation rate of the PHB. ML1 and ML2 were performed at two different conditions as described below. The experiments were continued for 50 and 30 weeks for ML1 and ML2, respectively, or until the specimens were completely degraded.
Mass loss experiments
For ML1, a synthetic municipal solid waste (MSW) was prepared according to ASTM D 5929–96 (2004) with shredded virgin newsprint, pine bark, corn starch, corn oil, bovine casein, urea, and a buffer/nutrient solution. A mature compost mixture of sugar cane and bagasse was obtained from LSU AgCenter's Callegari Environmental Center as an inoculum. Urea was added to the mixture to adjust the C:N ratio to 35:1. Seven 2-L Erlenmeyer flasks containing PHB plates of three different thicknesses (0.5 mm, 1.2 mm, and 3.5 mm) and the ASTM-defined synthetic MSW were prepared. Each flask contained ∼19 g of bioplastic, distributed across three 0.5 mm plates one 1.2 mm plate and five 3.5 mm plates (Table 1). Each flask contained 132 g of solid ingredients for the compost mixture, 133 mL of the ASTM-defined buffer solution, and 8.6 mL of corn oil as per the ASTM standard. Before incubation, the melt press plates were well rinsed with Type I water, oven-dried at 60°C, cooled in a desiccator, and weighed. The experiment was conducted according to ASTM D 5929–96 (2004). The flasks were maintained at 40°C and aerated with humidified air for the duration of the experiment water was added as necessary to maintain moisture content of ∼55% for the duration of the experiment. Incubation was maintained after the 45 days indicated by the standard to determine the degradation effects during long-term composting. Sampling events occurred at 2, 4, 6, 12, 18, 26, and 50 weeks of exposure. At each sampling event, one of the flasks was removed from the experiment and the remaining plastic (if any) was separated from the compost mixture. The remaining mass of the plates of each thickness obtained and an average was calculated when the number of plates collected allowed it. After mass loss determination, the remaining plastic was then subjected to characterization analyses, which required destructive sampling of the remaining plastic.
For ML2, 250-mL Erlenmeyer flasks each containing PHB plates of three different thicknesses (0.24, 1.2, and 5 mm) and 1.2–mm-thick plates of the 85% PHB/15% TBC blend were exposed to a compost prepared according to ASTM D 5338–98 (2003). The 1.2-mm-thick PHB plates were tested in both experiments to compare the results of mass loss using the compost and conditions of this standard with the ASTM D 5929–96 (2004) used in ML1.
The inoculum was an aged (∼4 months) and mature compost (retained on a 9.5 mm sieve) consisting of horse bedding, tree trimmings, wood shavings, and bark obtained from LSU AgCenter's Callegari Environmental Center. Ammonium chloride (NH4Cl) was added to the compost to adjust the C:N ratio to 30:1.
Twenty-one mass loss flasks were incubated and sampled in triplicate at 3, 6, 9, 12, 16, 20, and 30 weeks of exposure for mass loss determination and to perform characterization analyses for the remaining plastic (if any). Each flask (Table 1) contained three 0.24 mm PHB plates (0.24 mm×2.55 cm×2.55 cm), two 1.2 mm plates (1.2 mm×1.6 cm×1.6 cm), two 5 mm plates (5 mm×1.15 cm×1.15 cm), and two 1.2 mm PHB/15% TBC blend plates (1.2 mm×1.4 cm×1.8 cm). The plates' sizes and number were calculated to maintain the 1:6 ration of compost to polymer. The reactors had an initial dry weight of ∼72 g of dry compost and 12 g of polymer (one-sixth of the compost dry weight) with 55% moisture. The moisture was maintained through the duration of the experiment. The reactors were maintained at a temperature of 58°C and aerated with humidified air to maintain the moisture content of approximately 55% and Type I water was added as needed [as per ASTM D 5338–98 (2003)]. Incubation was maintained after the 45 days indicated by the standard to determine the degradation effects during long-term composting. The collection procedure was similar to that followed in ML1. The weights of test pieces were determined for degraded and undegraded specimens after rinsed with distilled water, dried at 60°C, and cooled in a desiccator. Mass loss determinations were made for these test pieces before the characterization analyses.
Data analyses
Percentage mass loss of the specimens tested in ML1 and ML2 were calculated. Mass remaining with respect to the initial surface area of specimens was plotted versus time so that degradation rate coefficients could be calculated (Figs. 1 and 2). Maximum degradation rate coefficients were obtained for all plate thicknesses and materials, calculating the slope of linear fit to the exponential phase of the degradation curve (Fig. 3). Analyses of covariance were performed on the linear part of the degradation curve to compare degradation rates. All analyses were performed using SigmaPlot software (v 9.01, Systat Software, Inc.). Degradation rate coefficients for the three different plate thicknesses of PHB tested in each experiment were regressed against their initial mass:initial surface area ratios to derive a relationship between the two variables to predict the time required for degradation of PHB of different thicknesses under the conditions of each experiment.

Remaining mass/initial surface area (mg cm−2) for all the plates tested in mass loss experiment 1 (ML1).

Remaining mass/initial surface area (mg cm−2) for all plates tested in ML2.
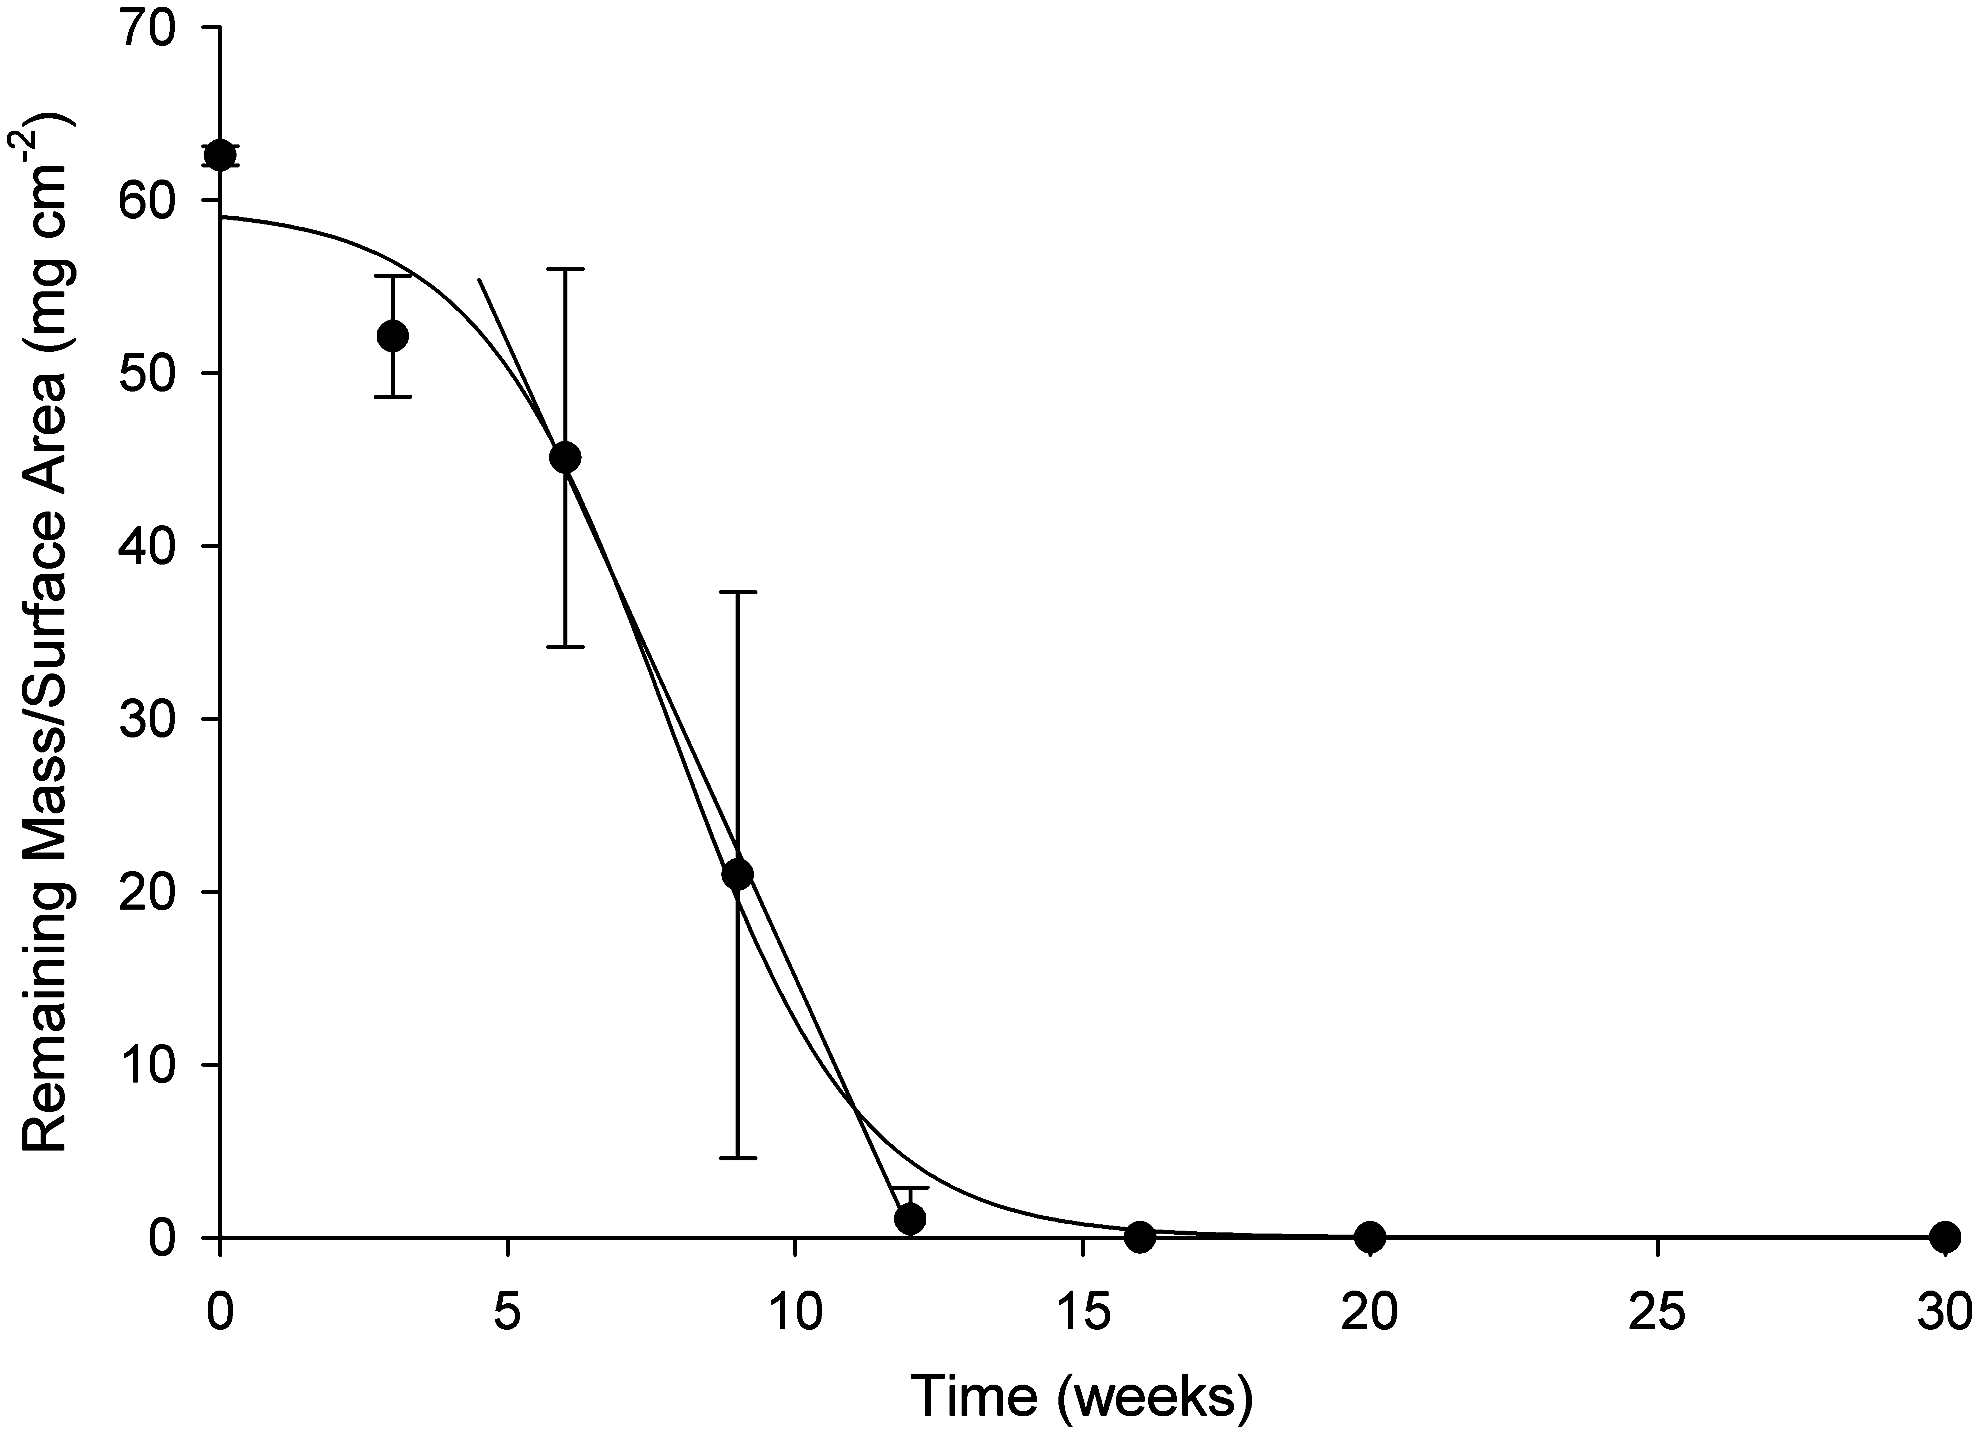
Illustrative example of a degradation curve used to perform a linear regression in determination of degradation coefficients of plastics biodegraded ML1 and ML2. Example shown is for the 1.2 mm PHB plates degraded in ML2. A linear regression was performed for the three data points in the middle of the degradation curve. Equation for that line is shown.
Results and Discussion
Biodegradation study
The mass loss associated with the plates of all three thicknesses exposed to the synthetic MSW during ML1 was initially very slow (Table 2). A lag time of ∼12 weeks (84 days) was observed before any significant degradation began (Fig. 1). At 18 weeks of exposure, a significant increase in degradation rate was observed; at 26 weeks, the degradation of the 0.5 mm and 1.2 mm plates was complete (Fig. 1). The 3.5 mm plates had achieved >50% mass loss at 26 weeks and significant deformation of the shape was observed (Fig. 4). By 18 weeks of exposure, samples showed significant colonization by fungi, which became even more apparent by 26 weeks (Fig. 5). By 50 weeks, the 3.5 mm plates had exhibited almost complete biodegradation. The degradation coefficients of all materials tested in the aerobic mass loss are presented in Table 3.

Visual comparison of the undegraded and degraded PHB plates with thicknesses of 3.5 mm from ML1. Additional images show plates of 0.5 mm and 1.2 mm thickness after 18 weeks of degradation. Plate thicknesses and times of exposure are indicated.
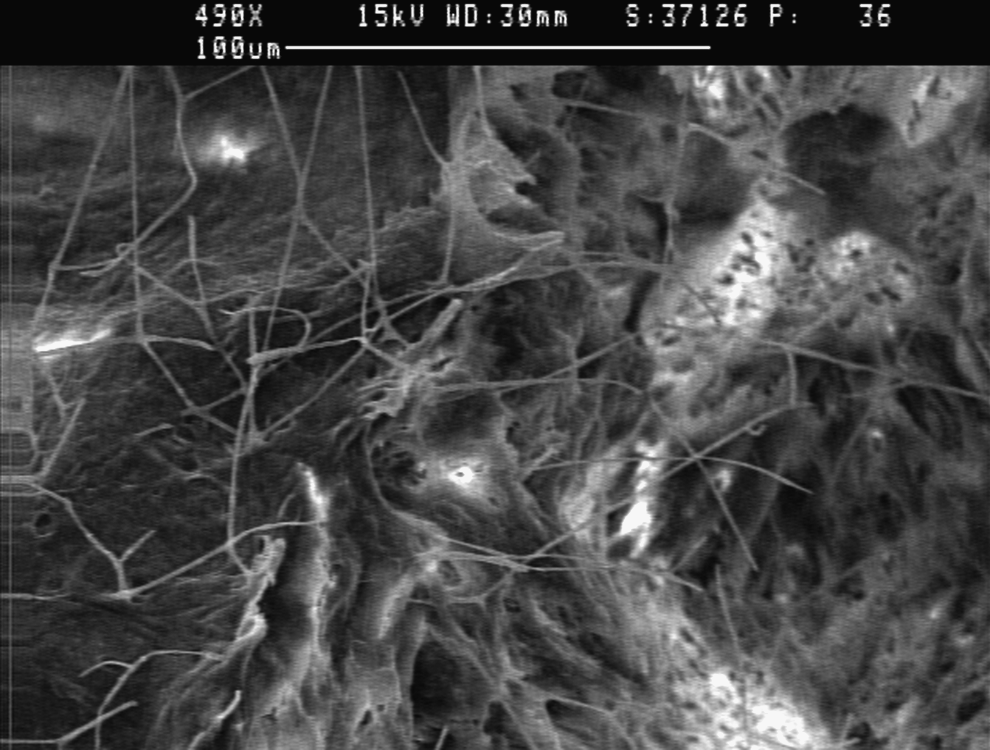
SEM micrograph of a PHB plate 3.5 mm thick degraded for 26 weeks, showing fungal growth.
N/A, no sample available.
A relationship between the degradation rate coefficient and the corresponding initial mass:initial surface area ratio was established (Fig. 6). For the three initial mass:initial surface area ratio investigated, the correlation to the degradation rate coefficient is linear. From a theoretical perspective, this relationship would be expected to plateau at a maximum degradation rate, which would be defined as the point where enzymatic activity of the microorganisms is at its maximum level. The results of this experiment show that under these conditions for plate thicknesses up to 3.5 mm and initial mass:initial surface area of 152 mg cm−2, the maximum degradation rate was not achieved. The linear correlation obtained provides a practical tool for estimating the degradation time for various products, up to an initial mass:initial surface area of 152 mg cm−2 and thickness of 3.5 mm.

Relationships between degradation rate coefficient (mg cm−2 d−1) and the initial mass:initial surface area ratio for three different plate sizes of PHB degraded in ML1 and ML2.
ML2 was performed under degradation conditions defined by a second ASTM standard, at a higher temperature. The 1.2 mm PHB plates were degraded again, thereby, serving as a control between ML1 and ML2. In ML2, polymer degradation proceeded rapidly for the 0.24 mm and 1.2 mm PHB plates (Fig. 2). Complete biodegradation was observed for the 1.2 mm plates within 16 weeks and only ∼1% of polymer remaining for the 0.24 mm plates (Fig. 7; Table 2). The degradation of the 5 mm plates appeared to be hindered by their high initial mass:initial surface area ratio. The TBC in the 85% PHB/15% TBC blend interfered with the plate degradation. This coincides with Hoglund et al. (2010) that found a slower degradation rate of polylactic acid treated with acetyl tributyl citrate. Manna and Paul (2000) obtained 23.4% mass loss after 200 days (28.6 weeks) at the incubation temperature of 40°C using PHB sheets (0.25 mm thickness) in compost. In contrast, in this study in both ML1 and ML2, complete biodegradation was observed for the 0.24 mm, 0.5 mm, and 1.2 mm plates after 182 days (26 weeks) or less. In ML2, similarly to ML1, the mass loss with respect to initial surface area was higher for thicker PHB plates than for the thinner plates. This may be due to a decrease in the mass:surface area ratio of the thicker plates as the degrading microorganisms burrowed into these plates, exposing a higher surface area to the degrading enzymes and to a higher colonization by fungi, that produce enzymes that are more effective when there are no easily digestible carbon sources (Reddy et al., 2008).

Visual comparison of the undegraded and degraded PHB plates with thicknesses of 0.24, 1.2, and 5 mm and the 85% PHB/15% TBC blend plates that were degraded in ML2. Plate thicknesses and times of exposure are indicated.
ML2 showed a maximum degradation rate between the thicknesses of 1.2 and 5 mm (Fig. 6). The degradation rates for the initial mass:initial surface area of these two plate sizes is similar. The degradation rate for 1.2 mm was higher in ML2 than in ML1. This difference may be attributed to the different compost mixture and the higher temperature used in the ML2. Several authors have found a higher degradation rate at higher temperatures, although due to the initial use of PHB only for medical applications, most studies have been done at temperatures at or below 37°C (Abe and Doi, 1996; He et al., 2001; Hakkarainen, 2002). However, ML2 showed higher variability of results among different mass loss samples in the experiment. The 85% PHB/15% TBC plates maintained a relative integrity even after an incubation of 30 weeks (Figs. 2 and 7).
In ML1 the degradation coefficient for the 3.5 mm PHB plates was statistically different than that of the 0.5 mm and 1.2 mm plates (p<0.0001 and p=0.0002 respectively). For ML2, the 1.2 and 5 mm plates showed no statistical difference (p=0.7705). The 1.2 mm PHB plates had a significant difference with the plates of the same thickness of 85% PHB/15%TBC (p<0.0001). The lower degradation coefficient for the plates with TBC indicates a negative effect on degradation of the additive.
Characterization analyses
Chemical properties
Examples of the FT-IR spectrograms for undegraded and degraded plastics are presented in Fig. 8. Degradation appeared to have no effect on the spectrograms of the PHB bioplastic and the 85% PHB/15% TBC plates. This indicates that the cleavage of the many different types of bonds occurs proportionally equal throughout the polymer during the degradation process. These findings are consistent with those of Day et al. (1994) for PHBV in an anaerobic sewage sludge medium and Hosino and Isono (2002) for PHBV and other polymers degradation in soil. Some spectrograms of the degraded samples showed additional peaks specific to peptide groups at wave numbers of ∼1,642 cm−1 and 1,535 cm−1, probably attributed to proteins from bacteria accumulated on the palte surface.
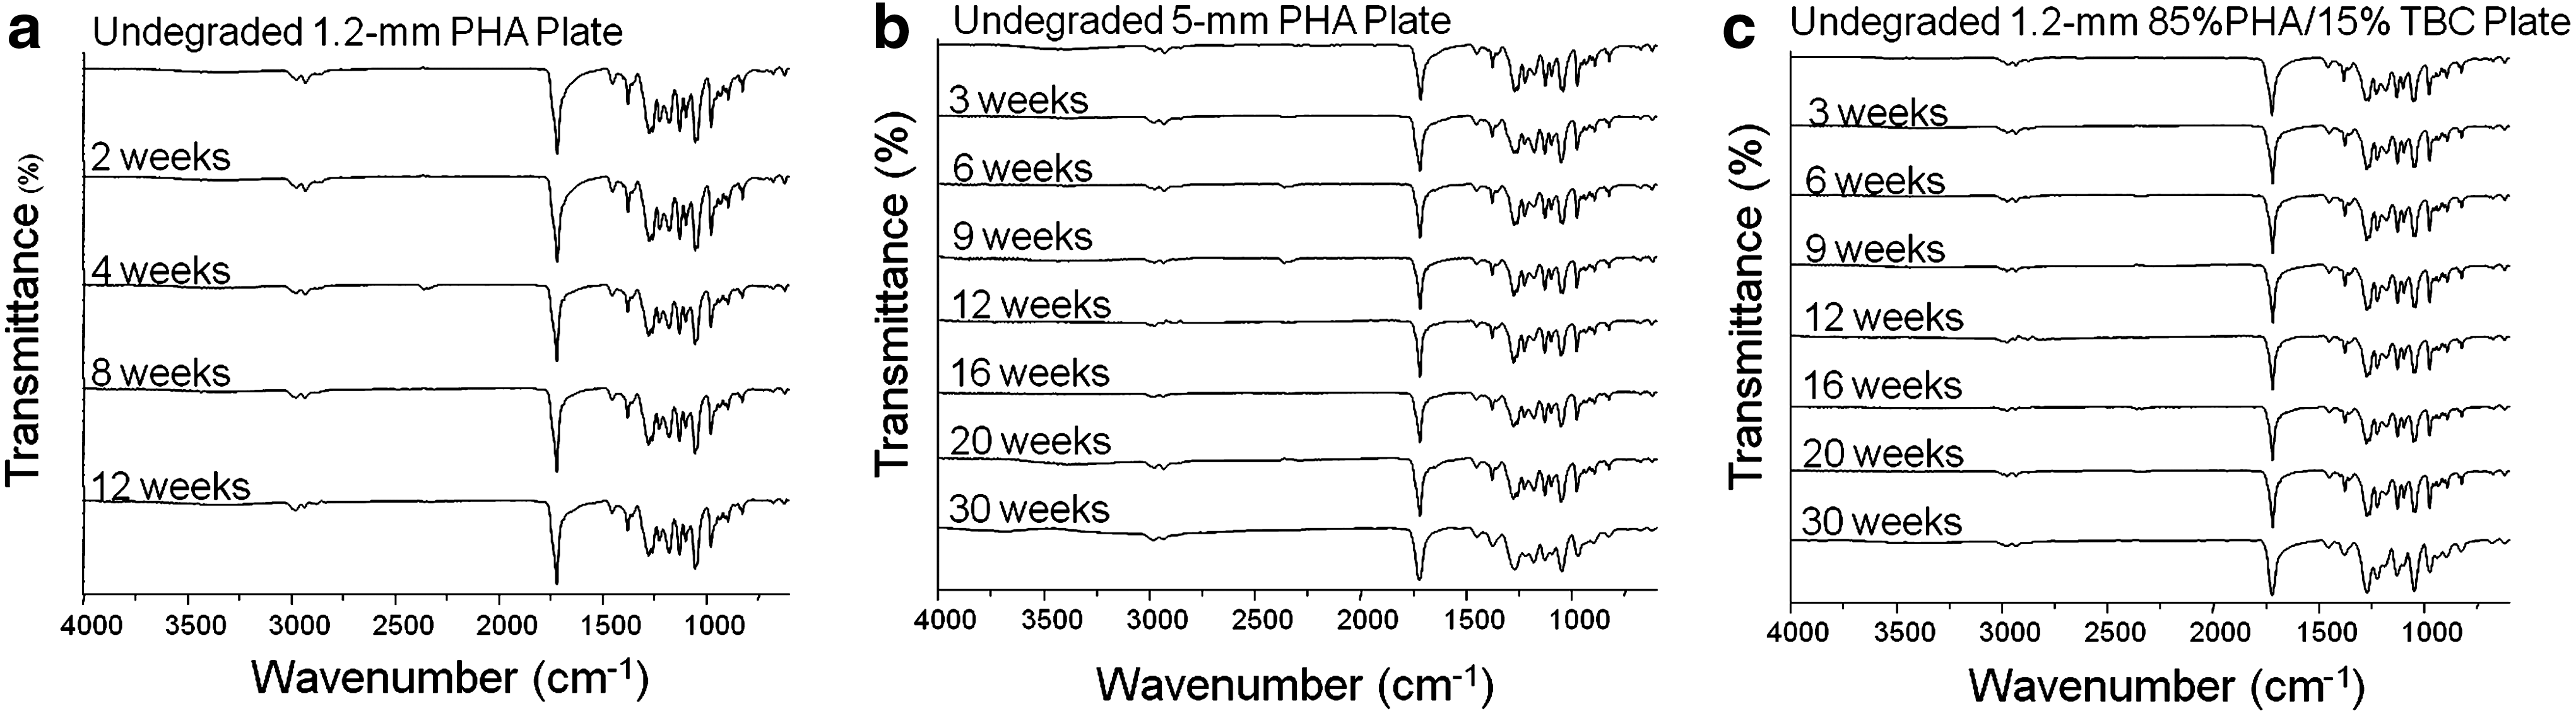
Spectrograms obtained by FT-IR of the PHB plates with 1.2 mm
Molecular weight determinations of the undegraded PHB plates and the 0.5 mm and 1.2 mm thickness degraded in ML1 (Fig. 9) show that biodegradation had little to no effect on the molecular weight of the PHB bioplastic. Other reserchers have shown little to no decrease in molecular weight as a result of degradation (Doi et al., 1990; Day et al., 1994; Mergaert et al., 1994). This indicates that the polymer is degraded enzymatically at the surface to lower-molecular-weight fragments that are rapidly metabolized by the degrading microorganisms resulting in mass loss but having no effect on the molecular weight of the remaining polymer (Doi et al., 1990; Hakkarenaine, 2002; Jendrossek and Handrick, 2002).
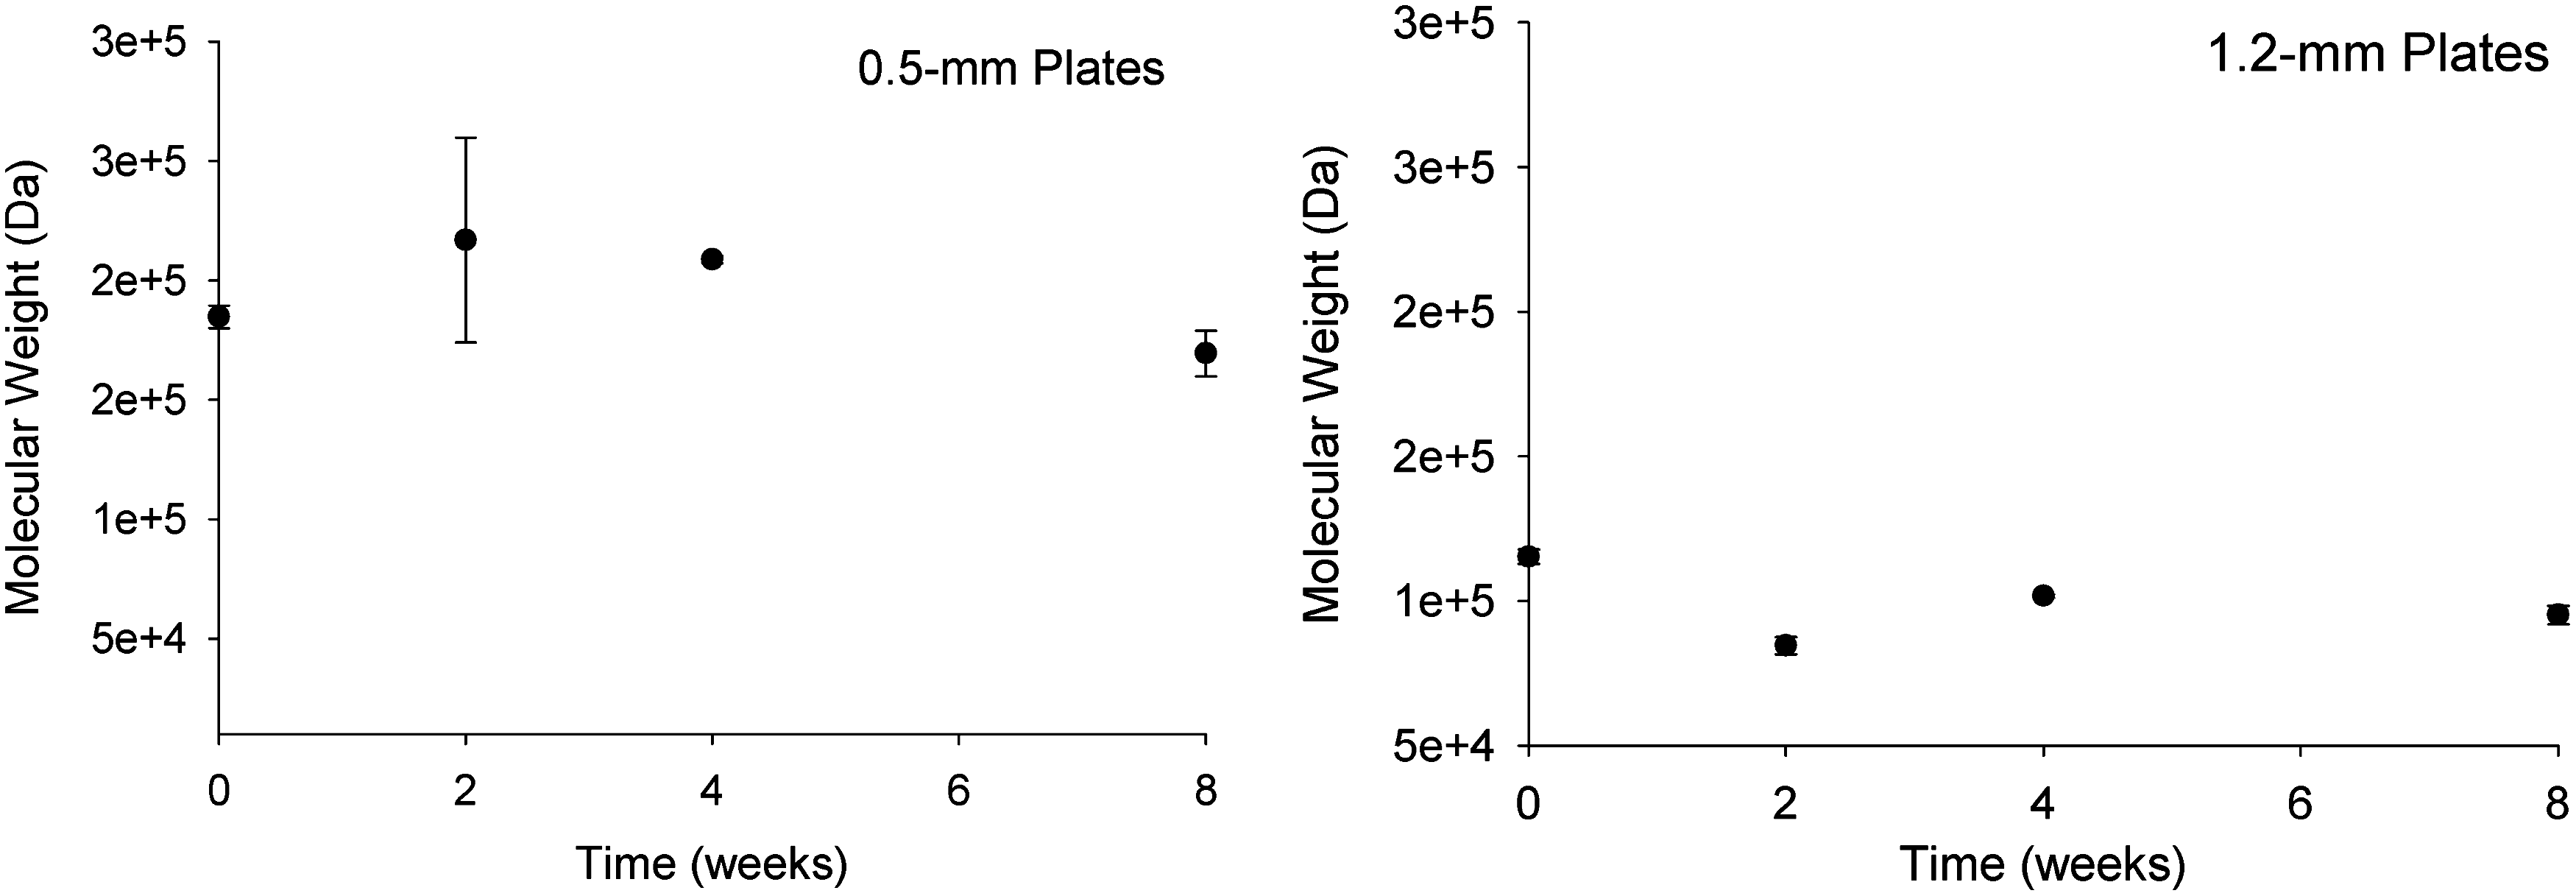
Molecular weight data obtained by size exclusion chromatography of the 0.5 mm and 1.2 mm PHB plates degraded in ML1. Error bars indicate standard deviation of duplicate measurements and x-axis refers to time of degradation.
Thermal properties
Biodegradation appeared to have only minor effects on the thermal properties of the PHB during ML1. In ML2, one interesting observation was that the ΔHm values for the plates increased with degradation. The highest increase was obtained in the 5 mm PHB plates (14%) and the PHB/15% TBC blend plates (36.6%). This may indicate preferential attack of the amorphous part of the polymer, which could cause ΔHm values to be higher due to a higher proportion of crystalline polymer remaining. The effect of biodegradation on the crystallinity of the PHB should be considered as it may affect the reprocessing particularly in thicker plastics and plastics with additives.
Mechanical properties
Tensile testing of the PHB melt-pressed plates (1.2 mm thick) showed that the mean stress at maximum load was 32.6±0.73 MPa. The 3.5 mm PHB plates that had been degraded for 2, 4, 6, 12, and 18 weeks were subjected to Izod pendulum impact testing. The impact resistance of PHB seems to vary greatly based on what has been reported in literature (Barham and Keller, 1986; Luzier, 1992; El-Hadi et al., 2002). The PHB used in this research had a crystallinity of ∼67%, so the strength value found for the undegraded material (2.45±0.70 m
Physical properties
Scanning electron micrographs were recorded for degraded melt-pressed PHB plates of all thicknesses from ML1 and ML2. A gradual decomposition and increasing porosity of the plates of each thickness degraded in ML2 was observed (Figs. 10–12).

SEM images (∼250× magnification) of 0.5 mm melt-pressed PHB plates undegraded and after 2, 4, 6, 12, and 18 weeks of exposure in the ML1. Captions indicate time of degradation.

SEM images (∼250× magnification) of 3.5 mm melt-pressed PHB plates undegraded and after 2, 4, 6, 12, 18, and 26 weeks of exposure in ML1. Captions indicate time of degradation.

SEM images (∼1,000× magnification) of 1.2 mm melt-pressed 85% PHB/15% TBC blend plates undegraded and after 3, 6, 9, 12, 16, 20, and 30 weeks of exposure in ML1. Captions indicate time of degradation.
Both the 0.5 mm PHB plates and 1.2 mm PHB plates degraded in ML1 had spherulitic structures with surrounding crevasses that appeared to smooth out in the first 2 weeks of exposure. Then, Holes that increased in size an number were apparent in the surface. By 12 weeks, crystalline formations could be seen at the surface, indicating the preference for microbial attack of the amorphous part of the polymer representative illustrations of these processes are presented in Fig. 10. The 3.5 mm PHB plates degraded in ML1 (Fig. 11) required longer for the spherulitic structures to smooth out (∼4 weeks) and showed larger holes that protrude deep into the plate, indicating microbial attack within the material. In this plate size, the preferential degradation of amorphous material is evident after week 18, when large clusters of crystalline lamella of PHB can be observed.
Samples degraded in ML2 seem to show more erosion than those degraded in ML1 due to the many different types of pits and the much rougher surfaces that can be seen. However, the pits on ML1 specimens appear larger (hence the lesser magnification used) probably due to a dominance of fungi as the degrading microorganisms as evidenced by the white fibrous material attached to the surface of some specimens visible to the naked eye. Fungi also are believed to have played a large role in the degradation process of ML2 as some samples showed whitening of the surfaces with degradation.
The 0.24 mm PHB plates degraded in ML2 showed significant erosion within 3 weeks, that increased with degradation time. The 1.2 mm PHB plates initially lost their luster and became very matte showing only small lesions after 3 weeks. After 6 weeks of degradation, the lesion increased in size and number. By 12 weeks, the remaining surface structures had changed their appearance to a network of narrow and scattered “sickles,” indicating crystalline regions of the material left behind by microbes that favored the more amorphous regions. This isconsistent with Spyros et al. (1997) who found evidence for the preferential degradation of the amorphous phase by PHB depolymerase B from Pseudomonas lemoignei. The 5 mm PHB plates degraded in ML2 showed numerous lesions at the surface of the material within 3 weeks. No noticeable change was observed from 3 to 9 weeks. Within 12 weeks, numerous “sickle” structures appeared as did for the 1.2 mm plates, with large gaping holes also appearing after 16 weeks. The 1.2 mm PHB/15% TBC blend plates degraded in ML2 showed surface morphology different from that for the pure PHB (Fig. 12). Throughout the degradation process, the lesions and other structures left on the surface had less defined edges. These structures seemed to become much smaller and more scattered between 3 and 6 weeks. The microorganisms did not seem to burrow into the inner parts of the material as they did for the pure PHB, which would indicate a preference for microbial attack at the surface. However, slight gullies that did not seem to penetrate the plate begin to appear after 20 weeks, in contrast with the observations on the pure PHB plates. The superficial degradation observed to be coupled with the lower degradation rate obtained indicates that the TBC hinders the degradation process, creating a smoother surface that will not facilitate the bacterial or fungal attachment and slowing the enzyme penetration.
Conclusions
The degradation studies in aerobic compost have shown that the PHB bioplastic is completely biodegradable. A100% break down of the bioplastic was observed in the mass loss experiments for thicknesses up to 3.5 mm. The degradation of the 5-mm-thick plates proceeded at a slower pace percentage-wise, but the degradation rate based on mass loss related to surface area was slightly higher than the rate observed for the 1.2-mm-thick plates on the same experiment. The higher initial mass:surface area of these plates did not allow the completion of the degradation during this study. The degradation rate increased linearly with the plate thickness at the temperature of 40°C used in ML1. At 58°C the rate was almost constant from 1.2- to 5-mm-thick plates. For plates 1.2 mm or less, a 100% breakdown was observed at 12–18 weeks for both conditions tested, with a higher rate observed at higher temperature. The additive TBC slowed the degradation rate of the PHB plates significantly. These observations along with the data showing the relationship between the degradation rate coefficients and the initial mass:initial surface area ratio should provide useful information for PHA waste treatment in municipal aerobic compost piles. The characterization analyses of the degraded PHB indicate a uniform degradation of the material with respect to composition of molecular bonds as measured by FT-IR and molecular weight as measured by SEC. This information along with the results that indicate that thermal history has only minor effects on thermal properties show that the PHB could potentially be recyclable without compromising material characteristics due to remelting. The results of this work indicate that an initial mass:initial surface area ratio of <67 will allow a complete degradation of the PHB in compost in <4 months. A significant impact of the additive TBC was observed, indicating that potential additives should be carefully screened to determine their effect on the biodegradability of PHB or other bioplastics. All of these data provide useful insight regarding the lifecycle design of PHAs to ease the transition from commodity plastics to their biodegradable alternatives.
Footnotes
Acknowledgments
This work was made possible by The Consortium for Plant Biotechnology Research, Inc. (CPBR; agreement no. GO12026-224) and Metabolix, Inc. The authors wish to thank Cindy Henk for her help with the SEM photographs, Dr. Rafael Cueto for the molecular weight analysis, and Wanda LeBlanc for the WAXD analysis.
Author Disclosure Statement
The authors declare that no conflicting financial interests exist with this work.