
Abstract
Abstract
Sucralose, a chlorinated carbohydrate, is used as an artificial sweetener in more than 80 countries and in excess of 4,000 products. Thus far, minimal research has been done on the degradation and fate of sucralose in municipal wastewater treatment plants (WWTPs). We collected samples from WWTPs and surface waters in Arizona, United States. The average sucralose concentration of seven WWTP effluents was 2,800 ± 1,000 ng/L. Similarly, surface waters in Arizona contained sucralose at concentrations up to 300 ± 30 ng/L, which corroborates sucralose discharge from WWTPs into the environment. Biological degradation and chemical oxidation processes were evaluated to remove or transform sucralose under potential WWTP operation scenarios. Sucralose did not degrade in aerobic or anaerobic biological reactors, either metabolically or co-metabolically (in the presence of sucrose), after 42–62 days of experiments. Prolonged exposure to ultraviolet radiation did not oxidize sucralose significantly, and chlorine and ozone addition led only to slow sucralose oxidation. Sucralose is not expected to degrade by free chlorine or ozone under typical WWTP operational conditions. Our results suggest that no significant sucralose degradation occurs in WWTPs, that it is present in their effluent waters, and that it reaches environmental water sources. We report for the first time the presence of sucralose in U.S. inland surface waters. Our measurements of sucralose concentrations in WWTP effluents and surface waters also confirm the low degradability of sucralose.
Introduction
Several studies suggest that sucralose is not degraded in the human body or those of other animals; instead, it travels through the digestive system and exits the body through urine and feces (John et al., 2000a, 2000b; Roberts et al., 2000; Rodero et al., 2009; Wood et al., 2000). Grice and Goldsmith (2000) showed that sucralose has low toxicity and is safe for human consumption, which was a key study to introduce it into the food market. However, recent studies suggest that typical doses of sucralose exert changes in the chemical and microbiological conditions of rat gut flora (Abou-Donia et al., 2008), indicating a possible effect on microbiological life. Domestic and industrial sewage are treated in wastewater treatment plants (WWTPs), where the sewage undergoes several stages of physical and microbiological processing before the treated water is discharged into a natural waterway. WWTPs use a combination of physical, chemical, and biological treatment processes to remove organic substances from water. Due to its low KOW = 0.3 (Jenner and Smithson, 1989), sucralose is very hydrophilic; hence, it is not predicted to be removed by sorption to and settling of wastewater biomass. Therefore, removal of sucralose from wastewater requires chemical (through the disinfection process) or biological (anaerobic or aerobic) treatment.
The literature contains a minimal amount of research on the degradation of sucralose. Labare and Alexander (1993, 1994) conducted studies on sucralose biodegradation in which they found that degradation did not occur abiotically at room temperature or in anaerobic microbial cultures. Instead, sucralose degradation only occurred co-metabolically with aerobic microorganisms in the presence of dissolved oxygen (Labare and Alexander, 1994). Despite this, sucralose has been reported in Swedish surface waters and WWTP effluents in concentrations of up to 5 μg/L (Brorström-Lundén et al., 2008a, 2008b). Sucralose has also been detected in water samples taken from the United Kingdom, Belgium, The Netherlands, France, Switzerland, Spain, Italy, Germany, Sweden, and Norway (Loos et al., 2009; Scheurer et al., 2009). Recently, sucralose was also measured in U.S coastal and marine waters in concentrations up to 2 μg/L, as well as in a WWTP effluent that had ∼120 μg/L, the highest recorded value of sucralose in the environment (Mead et al., 2009). These results have lead to analyses of the point sources and flow of sucralose in the environment, as well as the impact of WWTP in sucralose degradation (Neset et al., 2010).
A recent study takes a more in-depth approach to sucralose degradation in WWTPs; Scheurer et al. (2010) studied lab-scale fixed-bed bioreactors, flocculation, ozonation, chlorination, and activated carbon filters as potential treatment steps for sucralose (as well as other artificial sweeteners) removal in waterworks. Their laboratory results were compared to five waterworks that were sampled at different stages of treatment. Both lab-scale and field studies show poor sucralose removal from water for all stages, except activated carbon filtration.
Sucralose contains three chlorine atoms, two of which are present in −CH2Cl groups. Given that many chlorinated compounds are known to be toxic to humans, including chloromethane (CH3Cl), the incomplete degradation of sucralose could yield undesired byproducts. Thus, it is important to understand the biological and/or chemical transformations of sucralose in WWTPs.
The objective of this research project was to investigate the biological and chemical degradability of sucralose in WWTPs. Field-scale sampling was undertaken to investigate the occurrence of sucralose in wastewater and surface waters. Laboratory tests to evaluate aerobic and anaerobic biodegradation of sucralose were conducted. Given that many WWTPs also use chemical oxidation and that light-mediated oxidation can occur in surface waters, a set of screening experiments were conducted using free chlorine, ozone (O3), or ultraviolet (UV)/visible light to assess sucralose oxidation. Together, the biological and chemical lab-scale studies identify which steps in WWTPs could be manipulated for degrading sucralose, thus preventing its release into the environment.
Experimental Procedures
Environmental and WWTP samples
Samples were collected from seven confidential full-scale WWTPs (capacity size of 19 to >350 million L/day) in central and southern Arizona. WWTP1 was sampled three times at the influent, effluent, and various treatment points. WWTP2 was sampled (influent and effluent) and monitored several miles downstream of its discharge into the Santa Cruz River, an effluent-dominated stream (Chen et al., 2009). WWTPs 3–5 were sampled once at the effluent before the final disinfection step and WWTPs 6–7 were sampled once at the effluent after the final disinfection step.
WWTP1 includes primary sedimentation, activated sludge treatment (nitrification–denitrification), secondary sedimentation, and tertiary filtration. WWTP2 is an aerated lagoon treatment. WWTP3 includes primary sedimentation, and a submerged membrane system. WWTP4 and WWTP5 include primary sedimentation, activated sludge treatment (nitrification–denitrification), and secondary sedimentation. WWTP6 includes primary sedimentation, pure oxygen-activated sludge treatment, and secondary sedimentation. WWTP7 includes primary sedimentation, a trickling filter, and secondary sedimentation. All WWTPs use chlorine as a final disinfectant, except WWTP2, which uses either UV or chlorine depending upon discharge or reuse option practiced that day.
Samples were collected from the three main surface water supplies in Arizona below the terminal drinking water supply reservoirs (i.e., Salt River, Verde River, and Colorado River water in the Central Arizona Project Canal). Samples were collected in 1-L amber bottles and stored on ice after addition of 100 mg/L of sodium azide and 50 mg/L of ascorbic acid to prevent biodegradation. Samples were filtered using 0.7 μm filter paper (GF/F, Whatman) before solid phase extraction and liquid chromatography (LC)/mass spectrometry (MS)/MS analysis.
Anaerobic and aerobic biological batch reactors
Lab-scale anaerobic and aerobic reactors were prepared to investigate the biodegradation of sucralose. The reactors consisted of 160-mL sealed serum bottles with 50 mL working volume. The inoculum consisted of either 1-mL thickened digested sludge (anaerobic) or 1-mL thickened activated sludge (aerobic) from WWTP1, with 61 ± 5 g/L chemical oxygen demand and 47 ± 4 g/L total suspended solids. Thus, the initial chemical oxygen demand in the reactors due to the inoculum was ∼1.2 g/L. The sludge was acclimated to sucralose before its use by gradually increasing the sucralose concentration from 10 mg/L to 1 g/L, incrementing the concentration each day. The medium consisted of a 10 mM phosphate buffer (pH 7.2), 0.75 mM NH4Cl, 20 μM Fe(II)Cl2 · 2H2O, 15 μM Na2S · 9H2O, and a mineral solution with the following final concentrations (in 1 L): 5 mg EDTA, 11.6 mg MgCl2, 5.9 mg MnCl2 · 4H2O, 0.8 mg CoCl2 · 6H2O, 1.14 mg CaCl2 · 2H2O, 0.5 mg ZnCl2, 0.1 mg CuSO4 · 5H2O, 0.1 mg AlK(SO4)2, 0.1 mg H3BO3, 0.2 mg Na2MoO4 · 2H2O, 0.01 mg Na2SeO3, 0.1 mg Na2WO4 · 2H2O, and 0.2 mg NiCl2 · 6H2O. Depending on the experiment, 1 g/L sucralose, 1 g/L sucrose, or a combination (1 g/L each) was added. These concentrations are high enough to sustain microbial growth if sucralose is biologically degraded and represent good conditions to observe biodegradation. Each set of conditions was repeated in three different reactors. Anaerobic reactors were prepared inside an anaerobic chamber (COY Laboratories) and sparged with 100% N2 for at least 30 min before adding the inoculum. Aerobic reactors were sparged with air at day 1 and every 3–5 days after for the duration of the experiment. Reactors ran for at least 48 days in an incubator at 37°C with agitation at 150 rpm. Liquid samples were taken regularly and filtered with a 0.2 μm syringe filter (Acrodisc; Pall Corporation) for analysis.
Photodegradation screening experiments
We used a UV photolysis reactor as explained before (Westerhoff et al., 2009). The system includes a light source, a water bath with recirculating chiller, and a completely stirred reactor bottle. A 450 W mercury vapor lamp (Ace Glass Inc.) is used as light source and placed in an immersion well in the center of the water bath. This UV source produced monochromatic light at 254 nm. The temperature of the system was controlled at 25°C using a recirculating cooler system (Julabo, FE500). We placed a 1.8 L borosilicate bottle, specially selected for optical clarity, interior surface smoothness, and the absence of glass imperfections (Wheaton), in the water bath beside the light source. Magnetic stir bars located below the water bath controlled the mixing. The estimated light intensity irradiating the bottle is 1.1 W/L, based on previous experiments (Westerhoff et al., 2009). The bottles were filled with a 0.398 g/L (1 mM) sucralose solution in 2-mM phosphate buffer (pH 7.2). Samples were taken during a 24-h irradiation period (26.4 kW h/m3 total) to measure sucralose degradation and analyzed in triplicates for sucralose degradation.
O3 and chlorine screening experiments
We used 42-mL glass vials for O3 and free chlorine experiments. To a 0.398 g/L (1 mM) sucralose solution in 2 mM phosphate buffer (pH 7.2) varying quantities of either O3 or NaOCl stock solutions were added, for a total volume of ∼42 mL (as shown in Fig. 4). The O3 stock solution was produced by saturating 4°C nanopure water with gaseous O3; this stock was used to feed into the vials. Samples were collected after 96 h, when oxidant residuals were eliminated (purged with N2 gas for O3 experiments) or quenched (with 34 mM NH4Cl for free chlorine residual), and analyzed in triplicates for oxidant and sucralose concentrations.
Rate constants for sucralose degradation by O3 and free chlorine were calculated based on first-order kinetics with respect to both the oxidant and sucralose (Hoigné and Bader, 1983):
where ksuc,oxidant is the rate constant of sucralose degradation for a specific oxidant (M−1 s−1), [oxidant] is the concentration of the oxidant (O3 or free chlorine) (M), [sucralose] is the sucralose concentration (M), and t is time (s). When sucralose is applied in excess of the oxidant dose, we can approximate pseudo-first order responses from which ksuc,oxidant values were calculated:
Analytical methods
Liquid samples from lab-scale experiments were measured by high-performance LC (HPLC; Model LC-20AT, Shimadzu) using an Aminex HPX-87H (Bio-Rad, 1997) column with water as the eluent (0.6 mL/min). Sucralose and sucrose were the main compounds analyzed in the high concentration range (0.02–1 g/L), but our methods were also able to measure possible by-products such as formate, acetate, ethanol, butyrate, and propionate. The HPLC detected chromatographic peaks using photodiode array (210 nm) and refractive index detectors. The total elution time was 30 min, and the oven temperature was kept constant at 30°C. We developed calibration curves for every set of analyses, performed duplicate assays, and report average concentrations. Sucralose standards were prepared from Splenda Sucralose (DFF-1, 98%–102% purity) provided by Tate & Lyle Sucralose, Inc. All sucrose and sucralose concentrations are reported as average of a triplicate analysis on the HPLC.
For samples with lower sucralose concentrations, 1-L samples were extracted using a Caliper Life Sciences Auto Trace extraction manifold with Waters Oasis HLB extraction cartridges. The cartridges were eluted following procedures described elsewhere (Vanderford et al., 2003). Extracts were analyzed using LC/MS/MS using a Phenomenex Synergi C12 column on an Agilent LC instrument, the sample injection volume was 10 μL. Sucralose was monitored using an ESI Negative source (−1,500 ion spray voltage and 450°C) with quantifier ion pairs of 395.3/359.0 and 397.2/361.1 and a collision energy of −15 V for mass 395.3 and −20 V for mass 397.2. The solvents used on the LC were 100% water/25 mM ammonium acetate (Eluent A) and 100% methanol/25 mM ammonium acetate (Eluent B) at 700 μL/min. A gradient was employed to elute the sample using 95% Eluent A from 0–3.5 min, a linear gradient from 95% to 20% Eluent A from 3.5–10 min, an isocratic flow at 20% Eluent A from 10–13 min, a linear gradient from 20% to 0% Eluent A from 13–13.5 min, an isocratic flow at 0% Eluent A from 13–21 min, a linear gradient from 0% to 95% Eluent A from 21–21.5 min, and an isocratic flow at 95% Eluent A from 21.5–30 min. Samples were introduced to the Applied Biosystems API4000 mass spectrometer in negative electrospray ionization mode. Sucralose eluted at 9.47 min using this method and was detected as part of a multiple reaction monitoring method. Our detection limit for sucralose was 5 μg/L using LC/MS/MS. Since field samples were concentrated 1,000 × during the extraction, our limit of detection for these samples is 5 ng/L.
Spike recovery tests for sucralose were conducted in triplicate in distilled water and wastewater, showing a 40% recovery for effluent wastewater. Sucralose data presented here are not corrected for these recoveries, and therefore represent a minimum concentration because recoveries were consistently less than 100%.
Samples for O3 and free chlorine detection were analyzed using a spectrophotometer (Genesys 10UV; Thermo Electron Corporation). The absorbances of samples and standards were measured at 292 nm for HOCl and at 258 nm for O3 (Westerhoff et al., 1999, 2004). We developed calibration curves and performed triplicate readings to report average concentrations.
Results and Discussion
Environmental and WWTP samples
Sucralose concentrations in the effluents of seven full-scale WWTPs in Arizona ranged from ∼1,800 to 4,300 ng/L (average 2,800 ± 1,000 ng/L). These concentrations are consistent with previous studies in Swedish and German WWTPs (Brorström-Lundén et al., 2008a; Scheurer et al., 2009; Neset et al., 2010), as well as with a recent study in U.S coastal waters (Mead et al., 2009). There was no correlation between level of treatment in the WWTP and sucralose concentration. These results contrast with those from Scheurer et al. (2010) in five WWTPs in Germany, although all the WWTP analyzed by them included activated carbon treatment, which partly seems to remove sucralose from water. Samples from three major surface drinking water supplies had much lower sucralose concentrations (Table 1), but these were above detection levels in all samples. The Verde River has some small WWTP discharges upstream, which could be sources of sucralose. Samples from the Colorado River showed surprisingly, but consistently, higher levels of sucralose at our sampling point (300 ± 30 ng/L), compared to the other surface water samples analyzed. Sucralose concentrations were <2 ng/L in laboratory and field blanks, so the measured sucralose is not attributable to contamination. Additional monitoring is required to identify potential sources of sucralose in the surface waters.
Single-point samples of WWTP effluents were taken in April/May 2009. Surface water values are averages of five samples taken between October 2008 and May 2009.
Samples in these WWTPs were taken before the final disinfection step.
WWTPs, wastewater treatment plants.
Figure 1a presents sucralose concentrations across WWTP2, which achieves good nitrification using activated sludge processes, as well as samples from the Santa Cruz River into which WWTP2 discharges, contributing nearly 100% of the stream. Samples were collected up to 10.5 miles downstream of the WWTP. The WWTP effluent sucralose concentration (1,600 ng/L) was higher than the influent concentration (990 ng/L), which could represent diurnal variation in sucralose loading and/or lower recovery of sucralose from raw sewage. Surface water samples collected downstream indicate a gradual decline in sucralose concentrations; this trend may be a result of diurnal loading fluctuations from the WWTP and/or in-stream sorption/degradation processes. Water travel time from WWTP2 to point D is roughly 4 days, and no significant dilution occurs. Details about this stream are available (Chen et al., 2009). At WWTP1 (Fig. 1b), sucralose concentrations remained constant throughout the various treatment processes at 5,100 ± 590 ng/L. These results suggest that sucralose is not effectively degraded or removed by any of the processes present in this WWTP.

Biological transformation
Biological degradation and biosorption are the primary processes by which WWTPs remove micropollutants. Aerobic and anaerobic degradation were studied using wastewater sludge under three different conditions in a batch system: (a) control using 1 g/L sucrose, (b) 1 g/L sucralose, and (c) 1 g/L sucralose plus 1 g/L sucrose. Sucrose was used as a control to confirm bacterial activity in both aerobic and anaerobic conditions, whereas the mixture of sucralose and sucrose allowed for degradation of sucralose through co-metabolic pathways, as suggested elsewhere (Labare and Alexander, 1994). Figure 2 shows the results for the aerobic and anaerobic sucrose/sucralose cultures (condition c), when thickened activated sludge was used as inoculum. The aerobic control reactors with sucrose (condition a) confirm the activity of aerobic bacteria in the inoculum; the sucrose concentration decreased to below 0.05 g/L in less than 4 days. Sucralose, however, was not degraded by aerobic bacteria; its concentration remained at ∼1 g/L during the 62-day experiment (condition b). Reactors containing both sucralose and sucrose (condition c; Fig. 2a) exhibited fast degradation of sucrose, suggesting that sucralose was not inhibiting microbial activity. However, sucralose concentrations remained constant at ∼1 g/L during the 62-day experiment. Additional aerobic experiments performed using anaerobic digester sludge yielded similar results, and thus are not presented in this article.
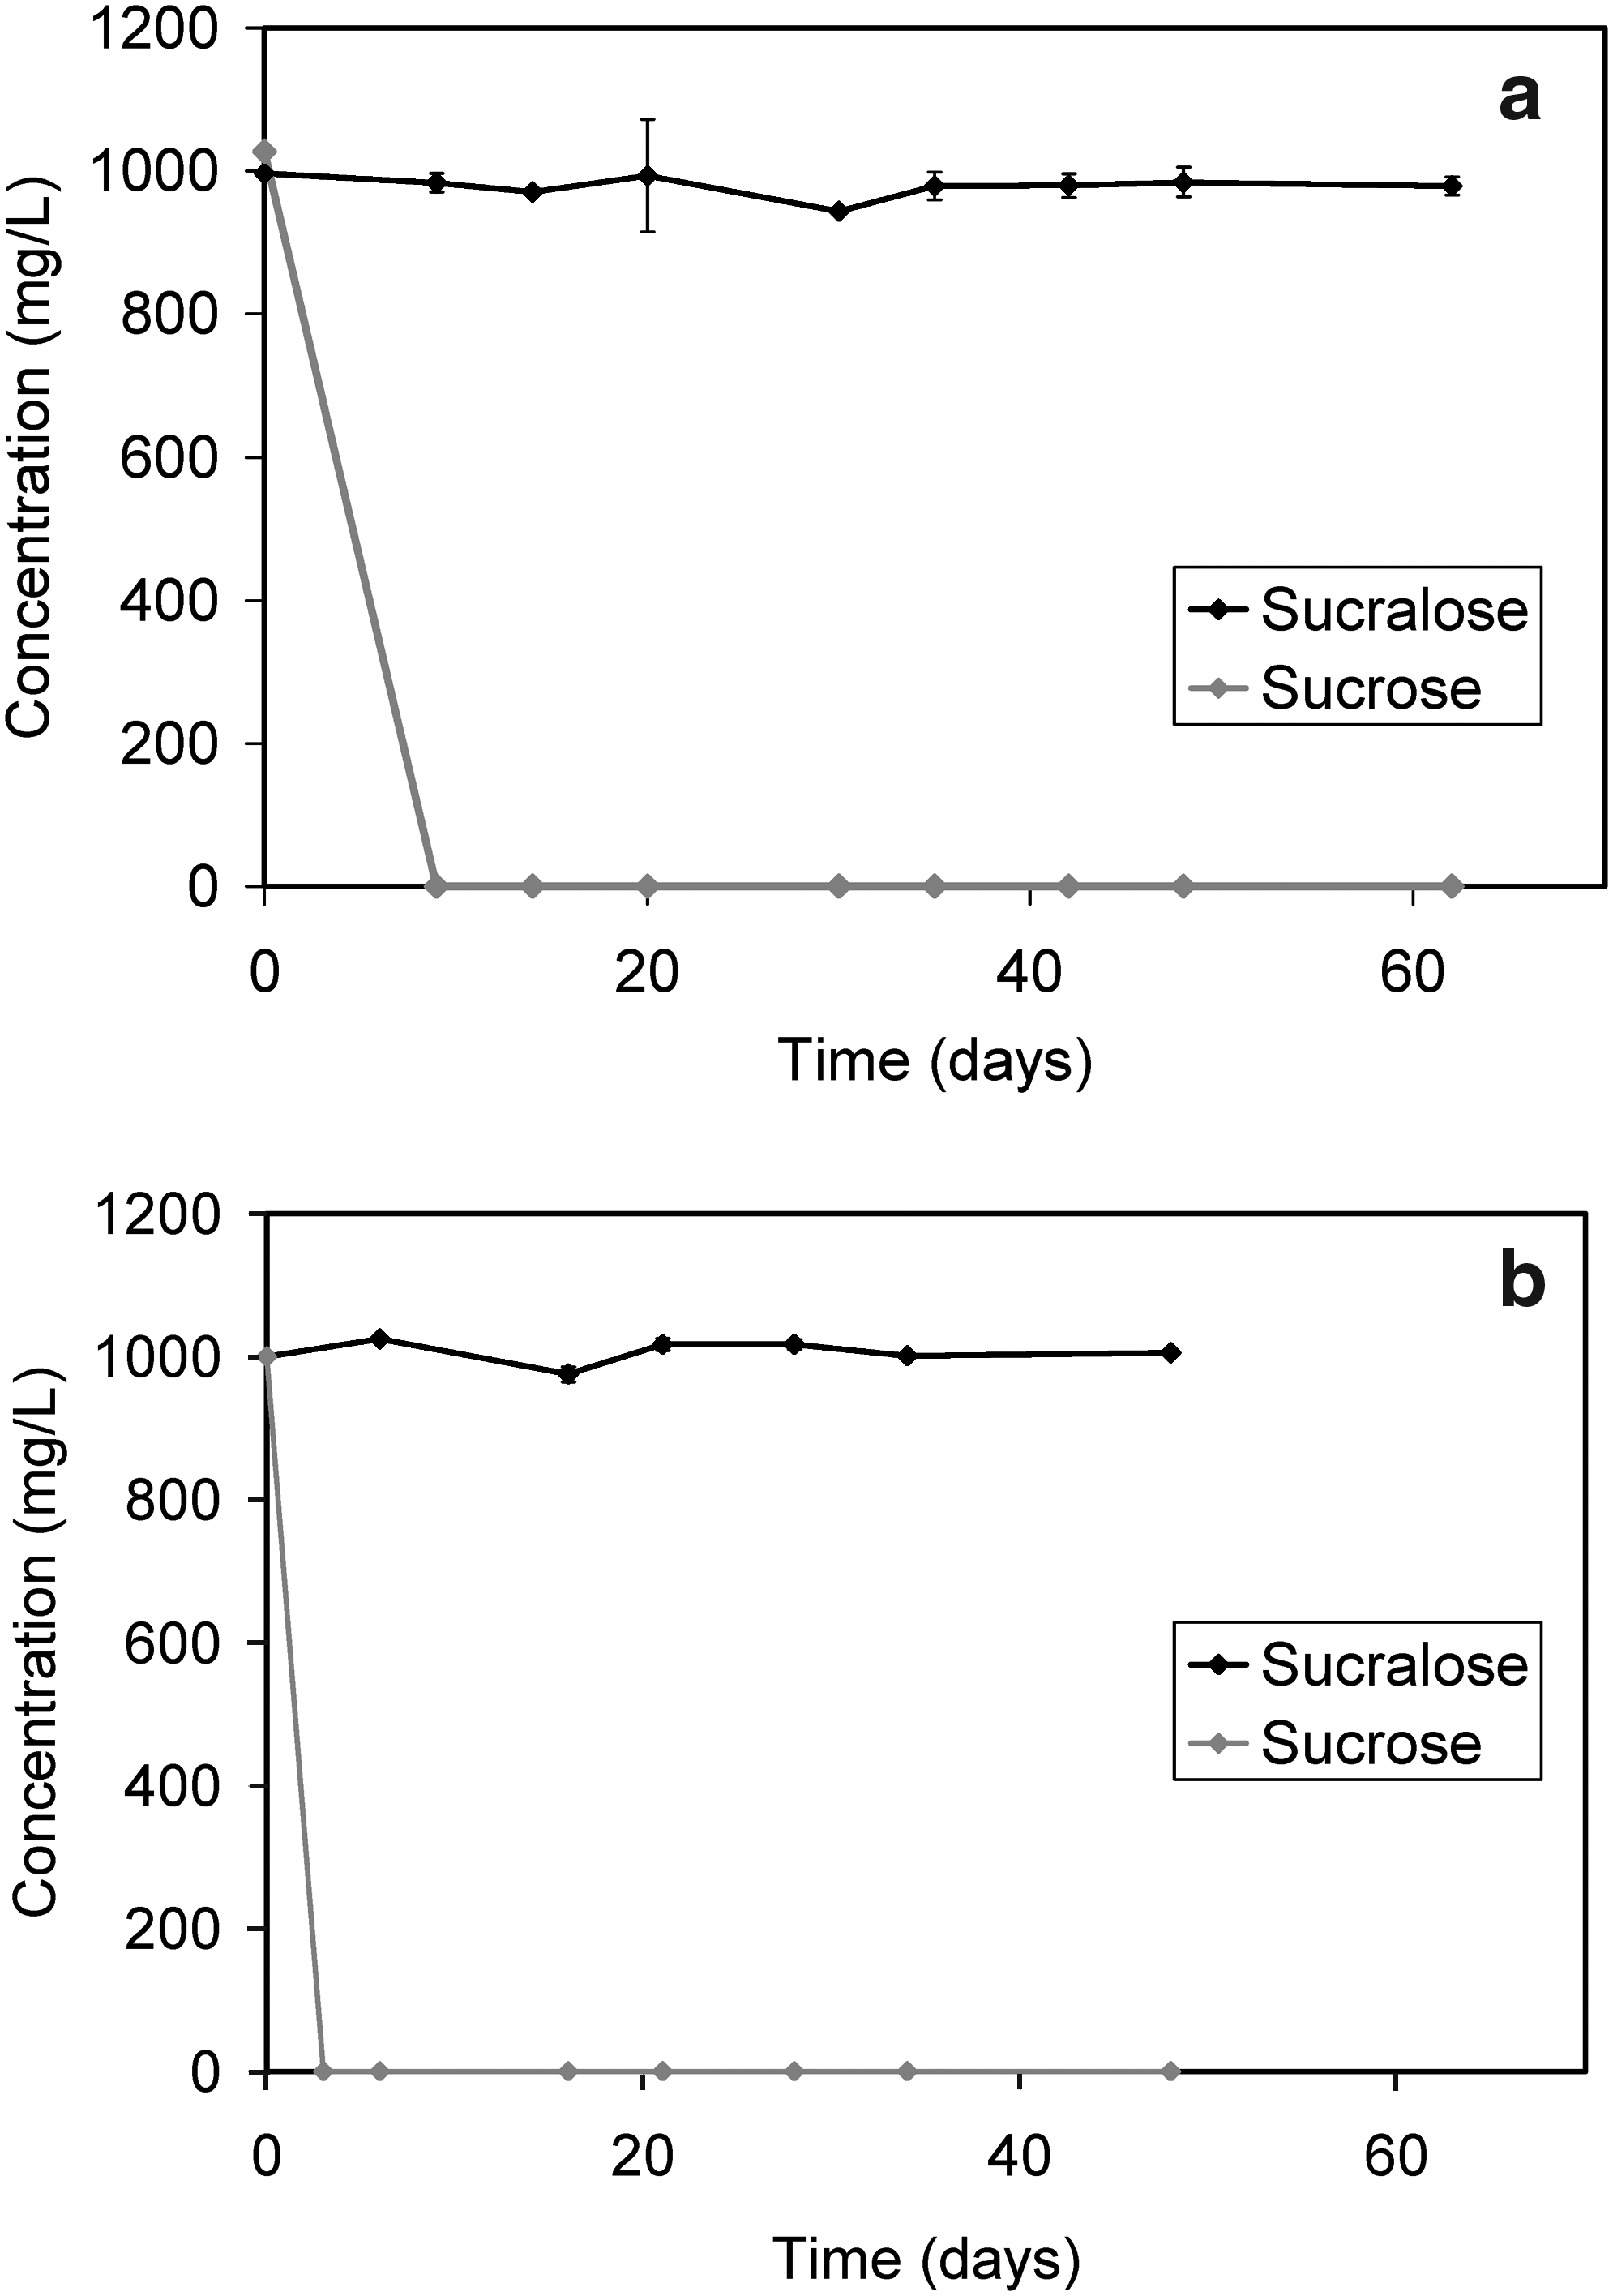
Concentrations of sucralose and sucrose over time in
Our results contrast with a previous study that documented partial sucralose degradation (1 g/L) by co-metabolism using sewage sludge (Labare and Alexander, 1994). We did not observe any degradation through co-metabolism or metabolism in our experiments.
Experiments under anaerobic conditions mirrored aerobic experiments. Sucrose was completely consumed in ∼10 days, yielding several fermentation products, including acetate, butyrate, and lactate (data not shown). In the sucralose-only reactor, average sucralose concentrations changed by <2.5% from the original concentration over 48 days (1,020 ± 50 mg/L; data not shown). No indication of consumption through co-metabolism was observed when sucrose and sucralose were both present, as shown in Fig. 2b. Sucralose does not seem to inhibit anaerobic bacteria, as sucrose degradation was observed in the presence of 1 g/L sucralose.
The aerobic co-metabolic degradation of sucralose observed by Labare and Alexander (1994) was not observed in our experiments, even though our conditions contained both sucrose and sludge as possible electron donors to carry out co-metabolism. However, our results are consistent with many other studies that have either performed lab-scale aerobic biodegradation of sucralose or field-scale measurements in WWTPs, showing minimal to no degradation by aerobic microorganisms (e.g., Buerge et al., 2009; Scheurer et al., 2009, 2010; Neset et al., 2010).
Chemical transformation
One of the final steps in WWTPs is oxidation, which involves the addition of chlorine, O3, or UV light to water for both disinfection and degradation of recalcitrant compounds (Alvares et al., 2001; Kurniawan et al., 2006; Snyder et al., 2006; Marsolek et al., 2008). Sucralose was not degraded significantly by UV light irradiation lasting up to 24 h. A linear decrease in the sucralose concentration was observed, reaching a 7.8% (78 μM) decrease after 24 h, as shown in Fig. 3. This rate would result in insignificant amounts of sucralose being oxidized due to UV treatment in WWTPs (Tchobanoglous et al., 2003).

Degradation of sucralose with UV exposure during a 24-h period.
Figure 4 shows the change in sucralose concentrations before and after various O3 additions for 96-h contact times. Part of the initial sucralose concentration decrease is due to dilution from the O3 stock, particularly at higher O3 dosages. O3 residuals were present after 96 h, indicating that sufficient oxidant was present in solution. We estimate an oxidation rate constant of k = 4.5 × 10⁻³ ± 1 × 10⁻³ M−1 s−1, based on these experiments at a single pH level and in the presence of both O3 and HO· as oxidants. Based on this, sucralose oxidation under common WWTP practices would be negligible.
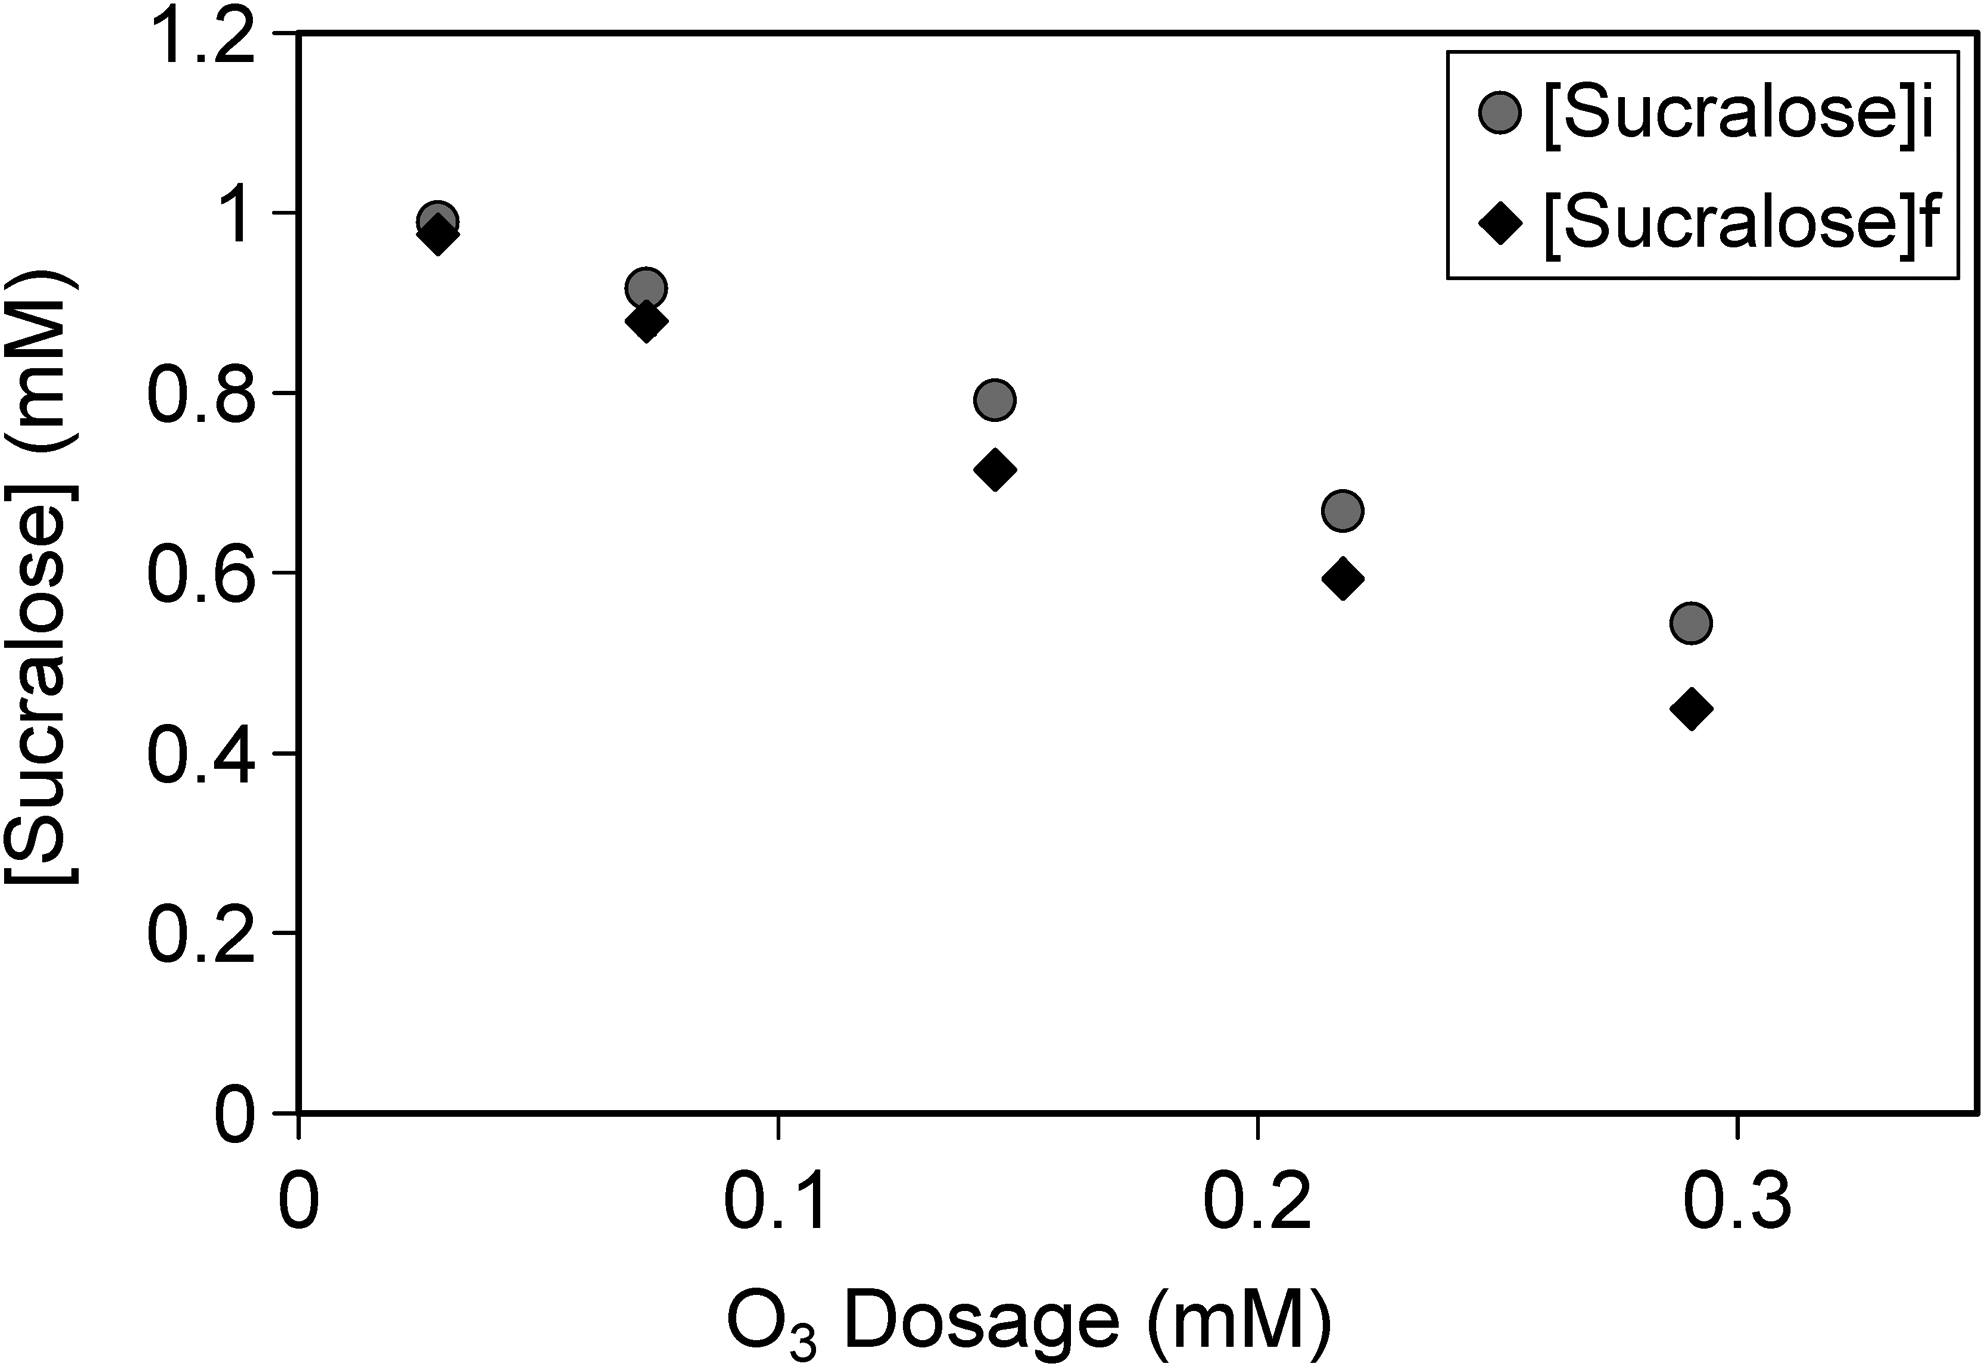
Degradation of sucralose with O3 after a 96-h contact time as a function of initial O3 concentration. Sucralose concentrations (initial and final) are presented as a function of initial O3 dosage.
Experiments with free chlorine as an oxidant were performed over a wider concentration range (0.1–100 mM free chlorine), as shown in Fig. 5. These dosages were applied to maintain almost pseudo-first-order kinetics with respect to sucralose (i.e., constant free chlorine). The lowest initial free chlorine concentration used was 0.1 mM, which is similar to the concentrations used in WWTPs (Tchobanoglous et al., 2003). At this concentration, only 1.5% (∼15 μM) of the initial sucralose was degraded after a 96-h contact time. At the highest free chlorine concentration (100 mM), we observed 79% sucralose degradation. Based on our results, we calculated k = 1.6 × 10⁻³ ± 0.9 × 10⁻³ M−1 s−1. The contact time in most WWTPs using free chlorine as disinfectant is <10 min, at up to 0.8 mM (Tchobanoglous et al., 2003). Thus, under typical WWTP chlorination conditions, sucralose would not degrade significantly.
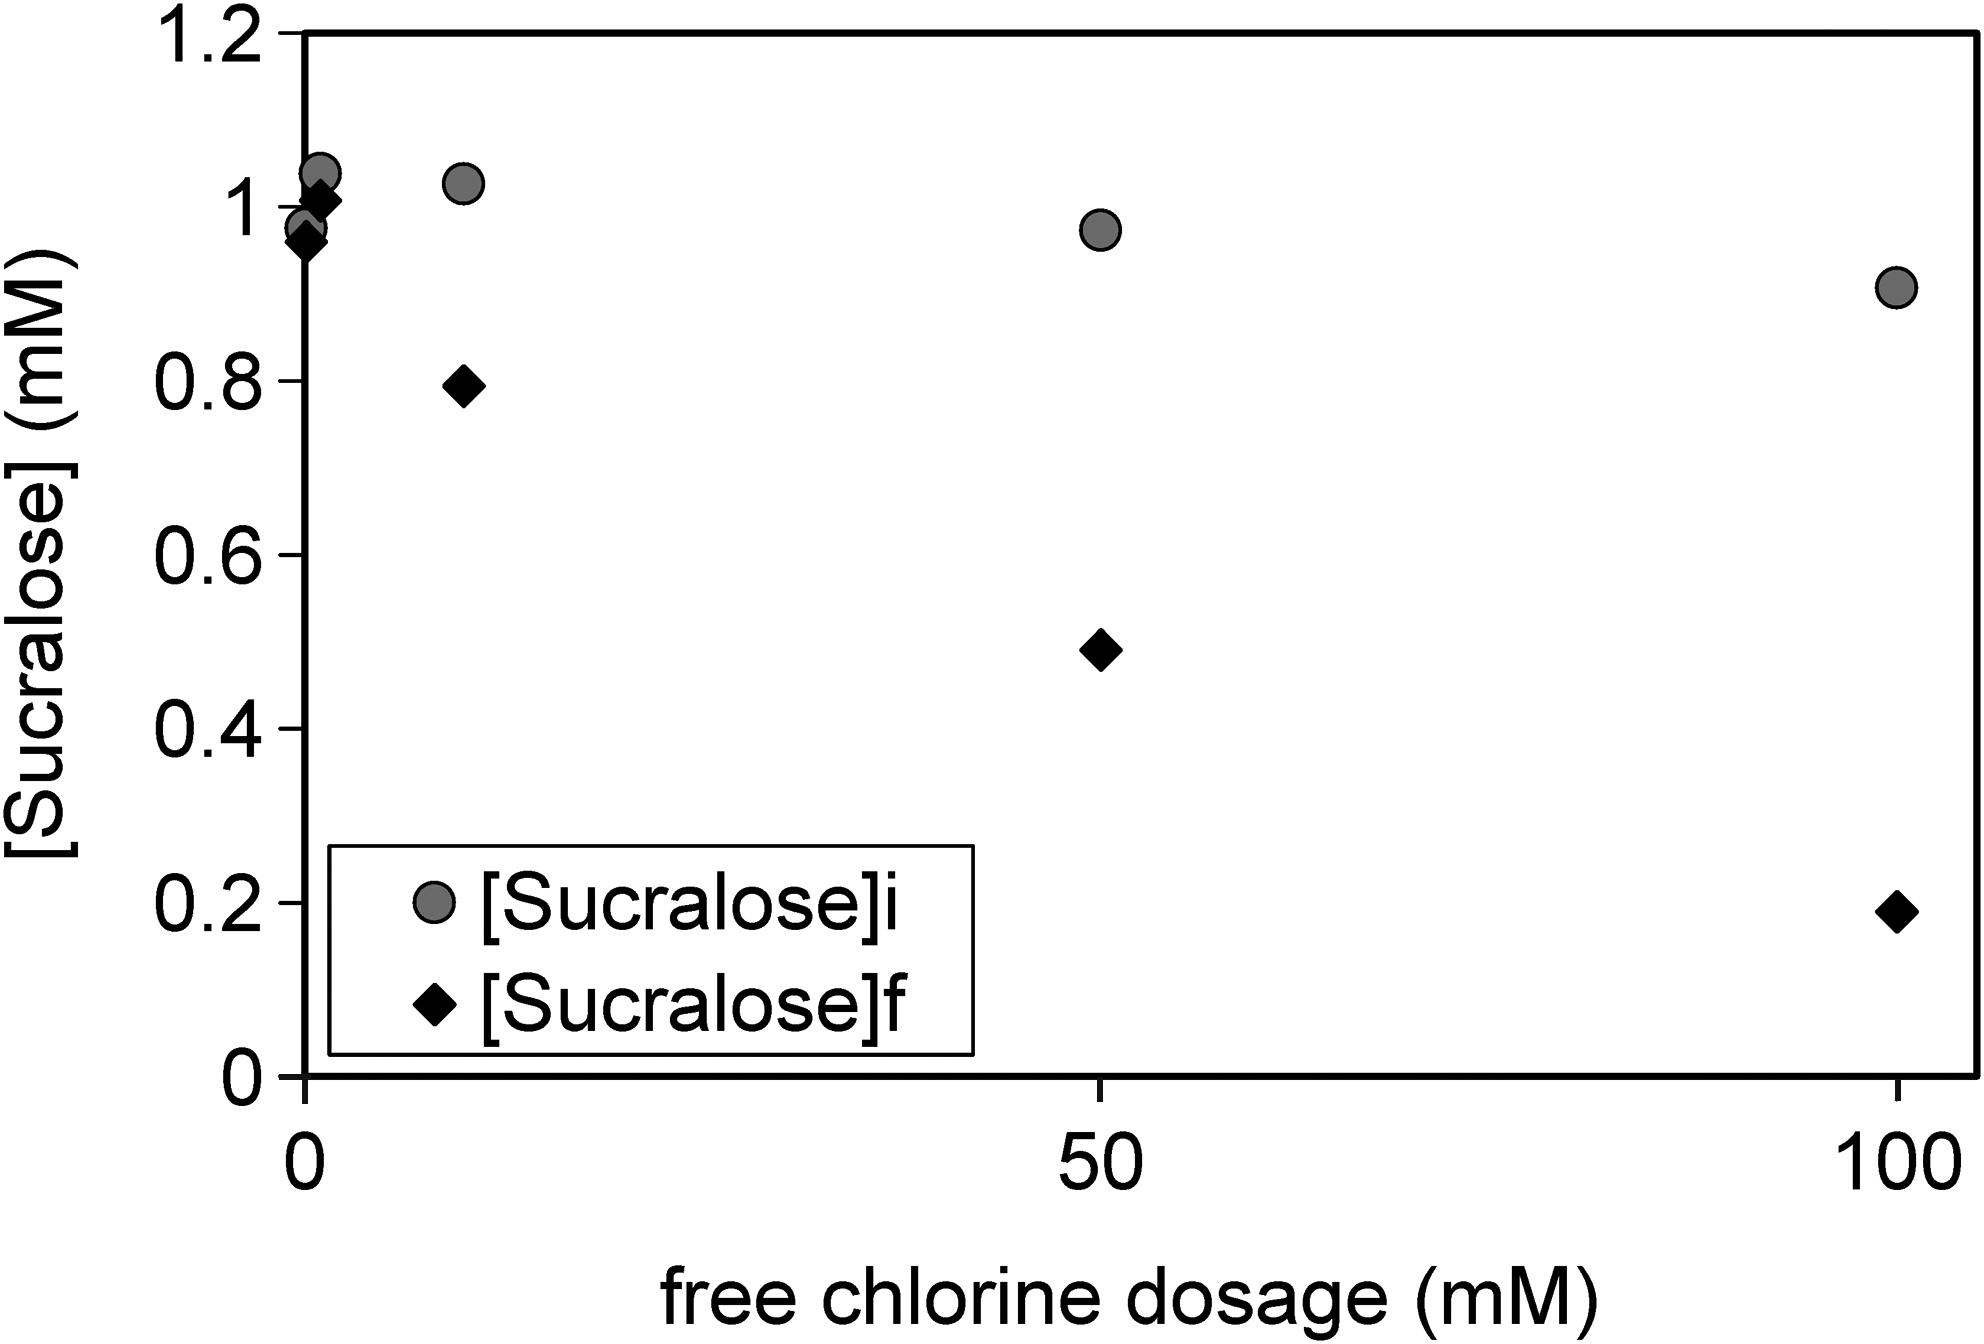
Degradation of sucralose with free chlorine after a 96-h contact time. Sucralose concentrations (initial and final) are presented as a function of initial free chlorine dosage.
Conclusions
Our results from laboratory-scale reactors suggest that sucralose is not degraded in typical WWTPs in the United States. Our experiments dealt with a best-case scenario for sucralose degradation in which sucralose is the only organic compound present in water. Thus, under typical WWTP conditions, sucralose degradation would occur at a slower rate than in our experimental results. Our biological experiments showed no sucralose biodegradation under anaerobic or aerobic conditions, and sucralose does not appear to inhibit the metabolic activity of microorganisms. Lack of biodegradation of sucralose could in fact be a positive outcome given that many chlorinated compounds are known to be toxic to humans, including CH3Cl; partial degradation of sucralose in WWTPs or in nature could yield undesired compounds.
Sucralose was not oxidized by UV light or visible light. Under strong oxidants, namely, O3 and free chlorine, sucralose was very slowly oxidized; its degradation rates were too slow to justify any significant degradation in WWTPs. Overall, none of the typical treatment processes present in WWTPs can fully degrade sucralose; the use of advanced tertiary treatments, such as activated carbon filtration, has been shown to enhance sucralose removal from water (Scheurer et al., 2010).
The results of our laboratory experiments suggest that sucralose entering WWTPs owing to human consumption is reaching environmental water sources through plant discharges. Our sampling of seven WWTP effluents in Arizona confirms this hypothesis. Due to its high solubility, it is possible for sucralose to reach water sources far away from the discharge point. This can explain results obtained by Swedish researchers regarding sucralose accumulation in their surface waters (Brorström-Lundén et al., 2008a; Lubick, 2008) and our measurements of sucralose in the Santa Cruz River up to 10.5 miles downstream the WWTP.
In the year 2009, sucralose production increased by 14% (Tate & Lyle, 2010). Because sucralose production and consumption is drastically increasing worldwide, it is imperative to study its long-term effects on the surrounding environment. Sucralose concentrations in natural waters may be increasing over time due to its increased consumption. Thus, it is important to track concentrations of sucralose, especially in drinking water sources. Also, there is a need to study the effects of sucralose on plant and animal species, especially in aquatic ecosystems.
On a different note, the stability of sucralose and its resistance to chemical and biological degradation can serve as a tool for environmental engineers to track the contribution of wastewater in the environment, as this is the main way sucralose is discharged. Buerge et al. (2009) studied four artificial sweeteners (acesulfame, cyclamate, saccharin, and sucralose) for potential use as tracers and have proposed the use of acesulfame because it is consistently present at the highest concentrations in wastewater and surface water. However, their reported concentrations of sucralose in surface waters were mostly below their limit of detection (200 ng/L), which is higher than currently used methods, including the one used in this study. Sucralose has all the characteristics of an excellent wastewater tracer: it is highly soluble, not naturally produced, slowly degradable, produced and discharged in high concentrations, and able to be detected at low concentrations (Kobayashi et al., 2001; Heinz et al., 2008; Qiu et al., 2008). Therefore, our research suggests that sucralose can be utilized as a tracer to monitor impact of wastewater in the environment.
Footnotes
Acknowledgments
This research was partially supported by the Salt River Project and Central Arizona Project. LC/MS/MS analysis was conducted by Marisa Masles. We thank Arizona Department of Health Services for allowing us to use their LC/MS/MS facilities.
Author Disclosure Statement
No competing financial interests exist.