
Abstract
Abstract
There are several methods to determine volatile fatty acids (VFAs) in anaerobic digesters, the simplest and cheapest method so far being titration. A very simple empirical model using titration for determination of VFAs in livestock manure–based digesters has been developed and validated with samples from manure-based commercial codigestion plants and pilot digesters. The method uses two endpoints and can be used by both manual and automatic titrations. The method was used to determine the total VFA concentrations in digesters from cattle manure solely and digesters codigesting livestock manure, maize, and organic waste. Total VFA concentration measured by the titration correlated well with those measured by a gas chromatograph and a new model was developed with an R2 value of 0.98 for the entire VFA range from 38 up to 30,056 mg total VFA/L and a slope close to 1. No other models have been developed for such a large span in VFA concentration. For lower VFA concentrations <5,000 mg/L, an adapted model might be used, but the correlation (R2=0.8) is lower than in the global model, indicating that the model is best over a higher range.
Introduction
Simple titration (Anderson and Yang, 1992): The sample is titrated to pH 5.1 and 3.5, respectively. Four-point titration (Kapp, 1984): The sample is titrated to pH 5.0, 4.3, and 4.0, respectively. Five-point titration (Moosbrugger et al., 1993): The sample is titrated to pH 6.7, 5.9, 5.2, and 4.4, respectively.
Titration theory builds on weak acid/base chemistry. The principal weak acid subsystems found in anaerobic digesters are bicarbonate (HCO3−), with a pKa of 6.3, and VFA, with an aggregate pKa of ∼4.8 (Moosbrugger et al., 1993). Other compounds normally found in the digester also influencing the pH balance if present at high concentration include ammonia (pKa of 9.3), hydrogen sulfide, and hydrogen phosphate. In an anaerobic digester, the optimal pH range is 6.6–7.4 (Moosbrugger et al., 1993). Most of the titration methods have been developed for digesters running on sewage and industrial wastes and in specialized digesters such as upflow anaerobic sludge blanket (UASB) (Anderson and Yang, 1992). The methods and the empirical constants used in these models have not been tried on continously stirred tank (CSTR) digesters running with livestock manure as the main feedstock, and they have in general been developed to VFA concentrations lower than 3,500 mg/L (Kapp, 1984). In the present study, a very simple model for predicting the VFA content in anaerobic CSTR digesters running on livestock manure as the main substrate has been made both during stable conditions and periods with process failure, thus covering a much broader range of VFA concentrations than the existing models. Further, the goal has been to make a simple model that uses few endpoints enabling manual titration. For this reason, a method using few endpoints that can be done with simple and cheap equipment was chosen. The model developed has been compared with a model developed by Anderson and Yang (1992). The method by Anderson and Yang (1992) and by Kapp (1984) have been developed with VFA concentrations <3,500 mg/L in acetic acid equivalents, whereas the VFA concentrations in the present study has covered a range from 38 to 30,118 mg/L. This means that the earlier methods are not comparable with the method used in the present study.
Materials and Methods
Analytical methods
VFA concentration was determined by means of a gas chromatograph (Hewlett Packard 6850A) with flame ionization detector. The column was an HP-INNOWax, 30 m×0.25 mm×0.25 μm. The carrier gas was He. The temperature of the column was gradually increased from 110°C to 220°C at a rate of 10°C min−1.
An automatic Mettler DL21 titrator equipped with a Mettler Toledo pH electrode (DG114SC) and a 40-mL burette was used for titration. Predispensing of 0.5 mL acid was performed after 30 s of mixing. The predispensing was <10% of the acid used to reach the first equivalent point and was done to fasten the titration process. After predispensing, titrant increments were not exceeding 0.01 mL. The titrant used was 0.1 N H2SO4 acid, and ∼5 g of digested manure was weighed and the exact amount with 2 decimal points was used for calculating the amount of titrant used per gram of digested manure sample, with an assumption of the density being 1 g/mL. The weighed digested manure was diluted with distilled water in a ratio of exact 1:1 before titration.
Calculations
According to Anderson and Yang (1992), the total VFA can be calculated by titration to pH 5.1 and 3.5, respectively, with a model taking into account the initial pH (pHstart), the amounts of 0.1 N H2SO4 (mL) used for titration of 1 L of sample to pH 5.1 (C1), and the amount of H2SO4 (mL) used for titration of 1 L of sample from pH 5.1 to 3.5 (C2). Further, two constants, K1 and K2, were determined empirically to 6.6×10⁻⁷ and 2.4×10⁻⁵, respectively, from effluent samples from an UASB digester treating synthetic sugar waste (Anderson and Yang, 1992). The model (Mod 1) used by Anderson and Yang (1992) is shown as equation 1:
where H1=10−pHstart, H2=10−5,1, H3=10−3,5,
As the former model was based on constants calculated from UASB digesters and low levels of VFA, the model is not perfectly suited for other types of digesters and biomasses as studied in the present work.
In this study, a new purely empirical linear model (Mod 1) has been developed, which takes into account the same parameters that were used by Anderson and Yang (1992) but uses a simple linear regression model to estimate three empirical parameters. The model used is shown in equation 2.
where C2 is the amounts of 0.1 N H2SO4 (mL) used for titration of 1 mL of sample to pH 5.1 and C2 is the amount of 0.1 N H2SO4 (mL) used for titration of 1 mL of sample from pH 5.1 to pH 3.5.
Anaerobic digesters
Samples from three Danish commercial biogas plants were collected. The characteristics of the biogas plants are given in Table 1. As the VFA concentration in well-controlled anaerobic treatment systems is relatively low, the experimental approach was to include periods where the plants faced serious problems with process imbalance. Snertinge (SN) biogas plant has a reactor capacity of 2,400 m3 and consists of three equally sized reactors that are operated at 53°C. The plant treats a mixture of biomass consisting of waste products and cattle and pig manure. The samples from this plant were taken during an inhibition and recovering phase. Hashoej biogas plant has a reactor capacity of 7,000 m3 and consists of two reactors that are serially connected and operated at 38°C. The plant treats a mixture of biomass consisting of waste products and cattle and pig manure. Over Loejstrup (OL) biogas plant has three fermenters with a capacity of 1,700 m3 and operated at 51°C and one postfermenter with 2,500 m3 capacity and operated at 30°C. The plant treats a mixture of biomass consisting of liquid pig manure, solid manure, and waste products.
VFA, volatile fatty acid; GC, gas chromatograph.
Pilot digesters
Two pilot digesters (R3 and R4) with a size of 10 m3 each and two pilot digesters (R1 and R2) with a size of 30 m3 each were used. The digesters were fed directly from a feeding vessel of 0.800 ton maximum capacity. The feeding vessel functioned as a preheating unit in addition to the dosing and mixing of feedstock. The digesters were constructed of stainless steel and heated by an external water jacket. Experiments were conducted with cattle manure (C), pig manure with 20% maize addition (PM), or solely pig manure (P). One of the pilot digesters (R3) served as a prehydrolysis tank (53°C–68°C) for R2 (52°C), with a retention time in the hydrolysis tank varying between 1.6 and 4.6 days, while digester 1 was fed untreated manure (R1). The other 10-m3 digester (R4) was used as a postdigestion tank for R1, with a hydraulic retention time of 5 days. The retention time in the hydrolysis tank varied between 1.6 and 4.6 days.
Results and Discussion
VFA levels in manure-based pilot digesters
In Table 1, the biogas plants and the characteristics are listed together with the observed levels of total VFA measured on a gas chromatograph (GC). In the three experiments using pilot digesters, the process ran for a long period with stable feeding and no change in biomass. In the two experiments wherein a hydrolysis phase is included, the VFA level is very high, reaching a maximum level higher than >30,000 mg/L in the digester with PM (Fig. 1b). In the hydrolysis digester with C, the level is lower, reaching a maximum of 14,573 mg/L. In general, the level of VFA in R4 is low in both cattle and pig manures and less than the preceding reactor R2. The level of VFA in the digesters with PM is in general higher than that in the corresponding digesters with C and P (Fig. 1a). The VFA in the two digesters with PM (13 and 15 days hydraulic retention time) is increasing for the first 40 days after starting up, then declining, and finally reaching the same low level as found in P and C. This indicates that a long adaptation period is needed when a new biomass such as maize is added to a digester. The distribution of the individual VFA is illustrated in Fig. 2. In general, acetic acid is the most abundant, accounting for >60% on a weight base, except in the hydrolysis tanks with PM where the amount of acetic acid is <50%. In C and P digesters, propionic acid is the second most abundant VFA accounting for ∼20% of the VFA. In the hydrolysis tank with C, butanoic acid is also important, accounting for ∼10%. In the PM digesters, propionic acid is in general higher than that in C and P digesters, as is the case with butanoic acid and isovaleric acid, which account for 5%–10% and 3%–12%, respectively. In the hydrolysis tank with PM, butanoic acid is the second most abundant VFA accounting for around 30% of the total VFA. In the hydrolysis tank with PM, valeric acid also plays a role, accounting for 10% of the VFAs in the middle of the experimental period.
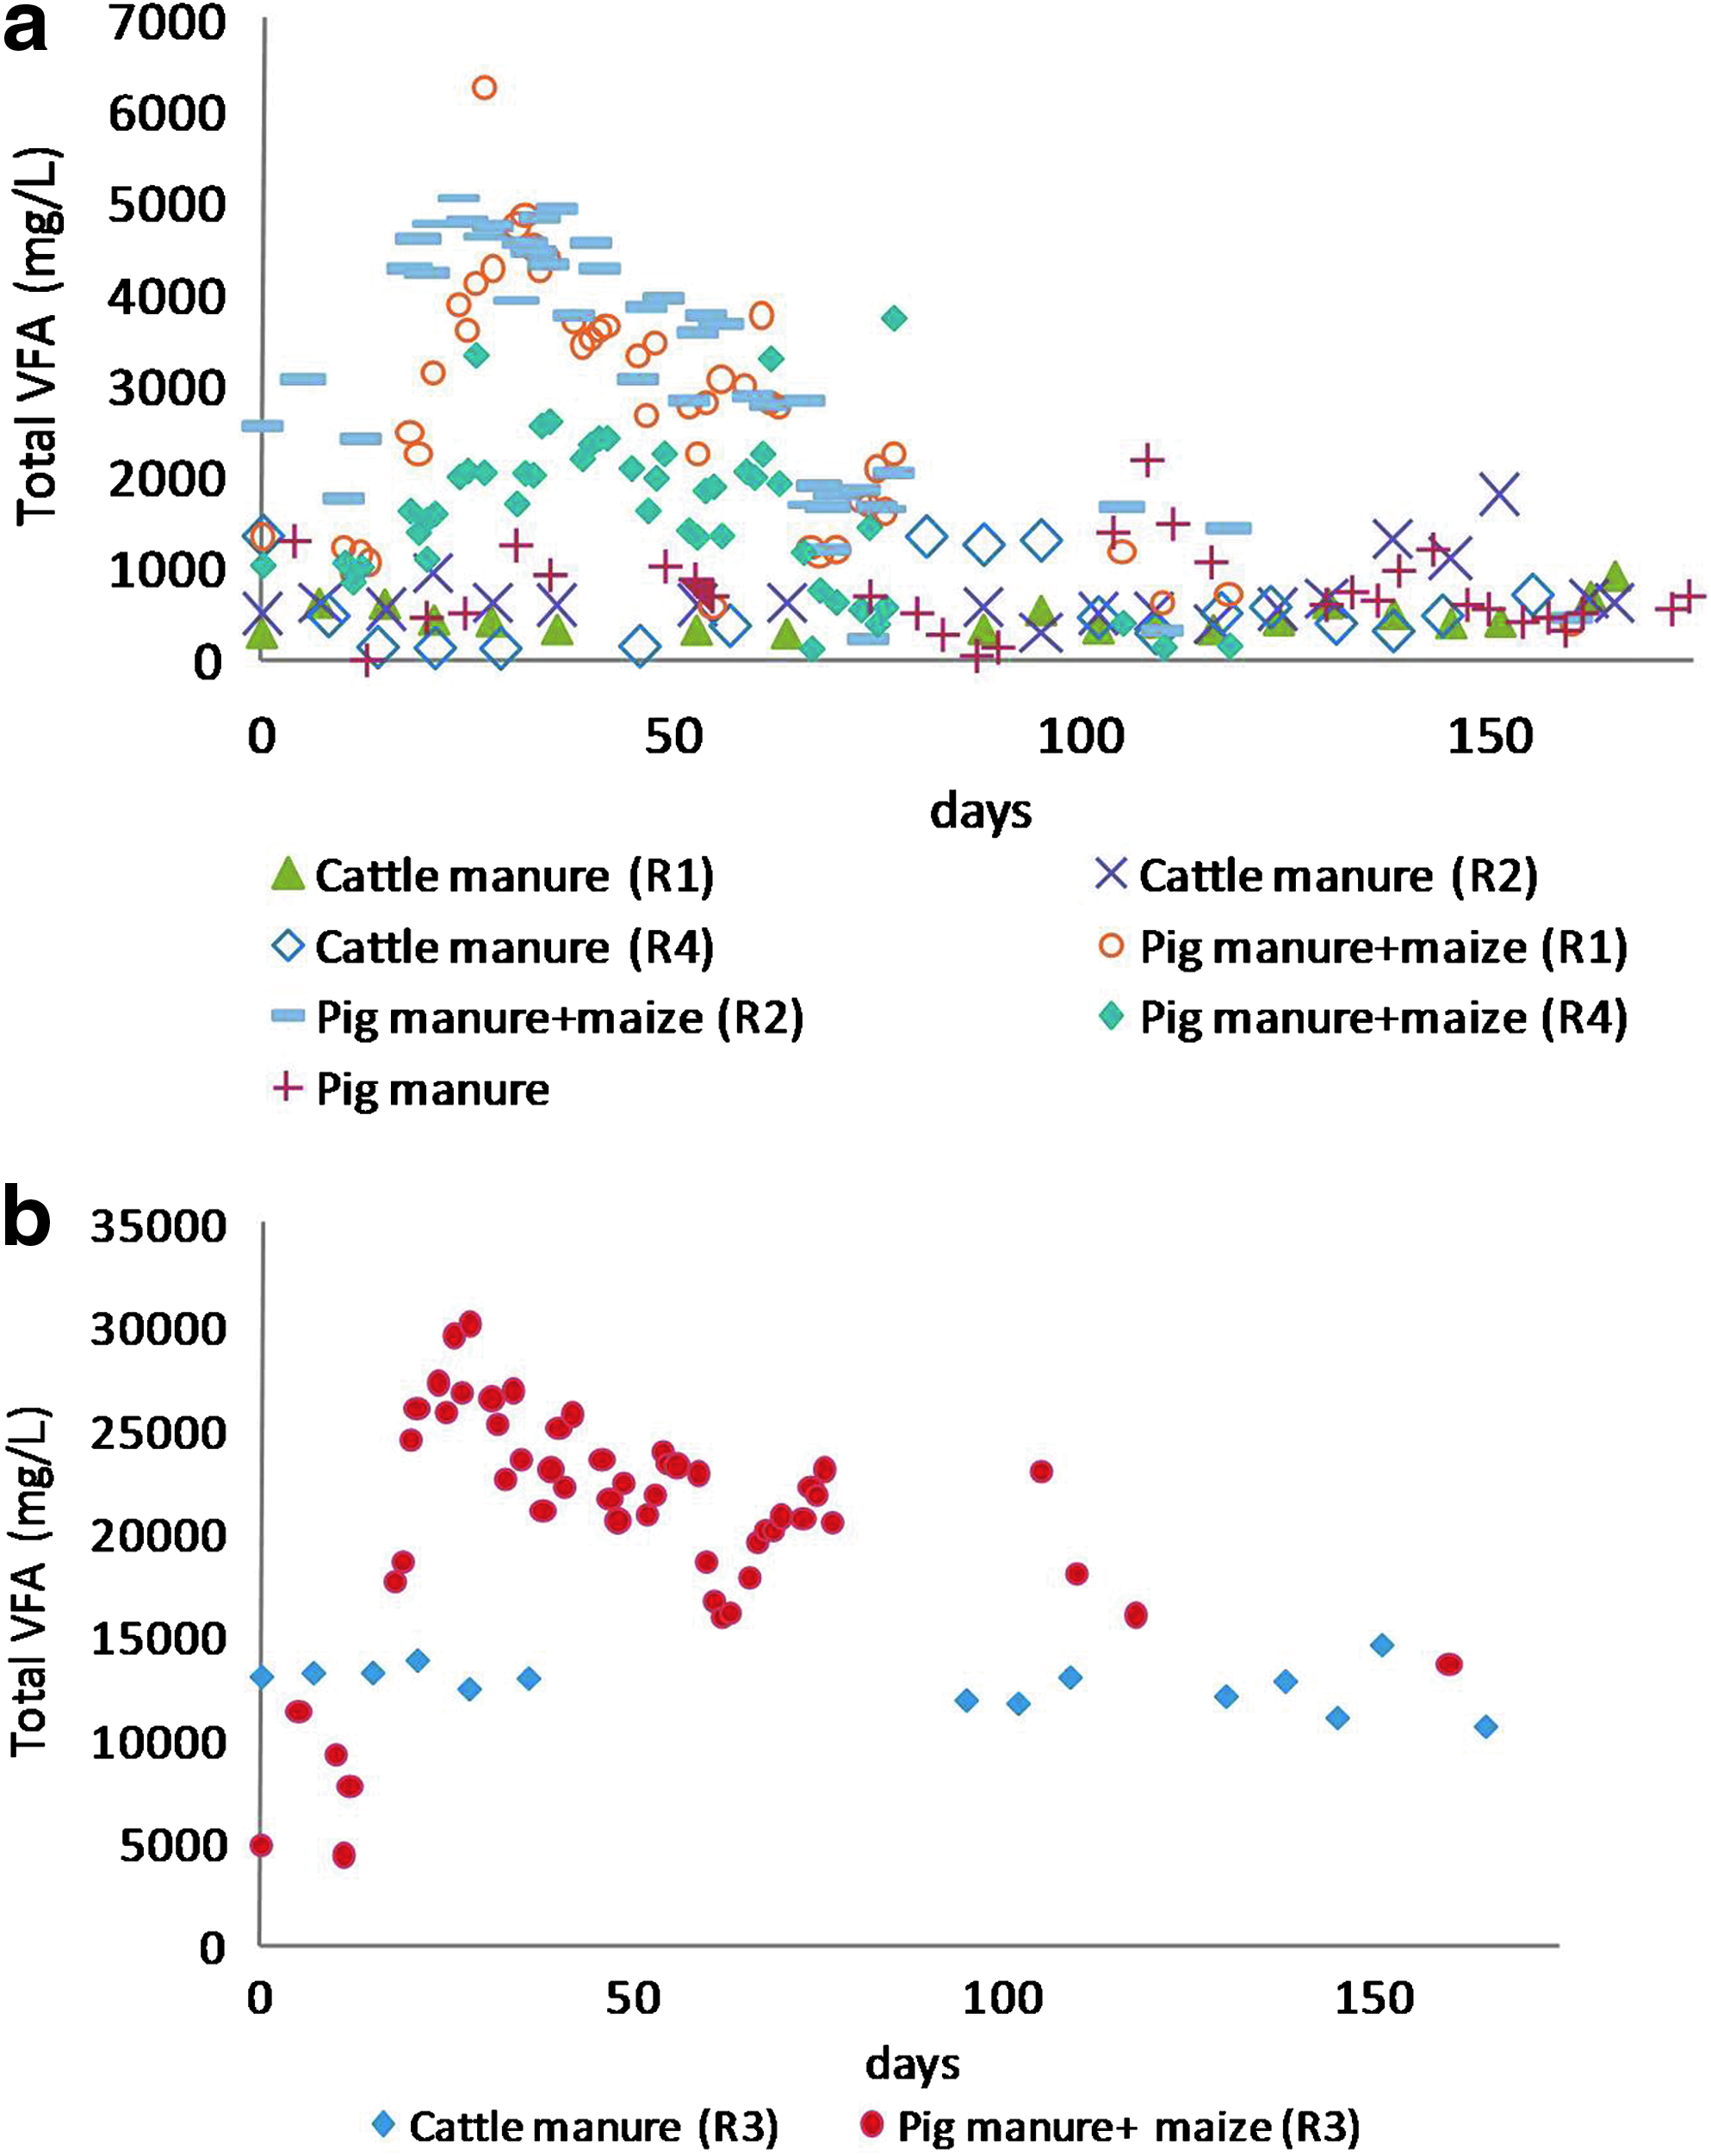
Total concentration of volatile fatty acid (VFA) during digestion of cattle manure, pig manure, and pig manure codigested with maize silage.
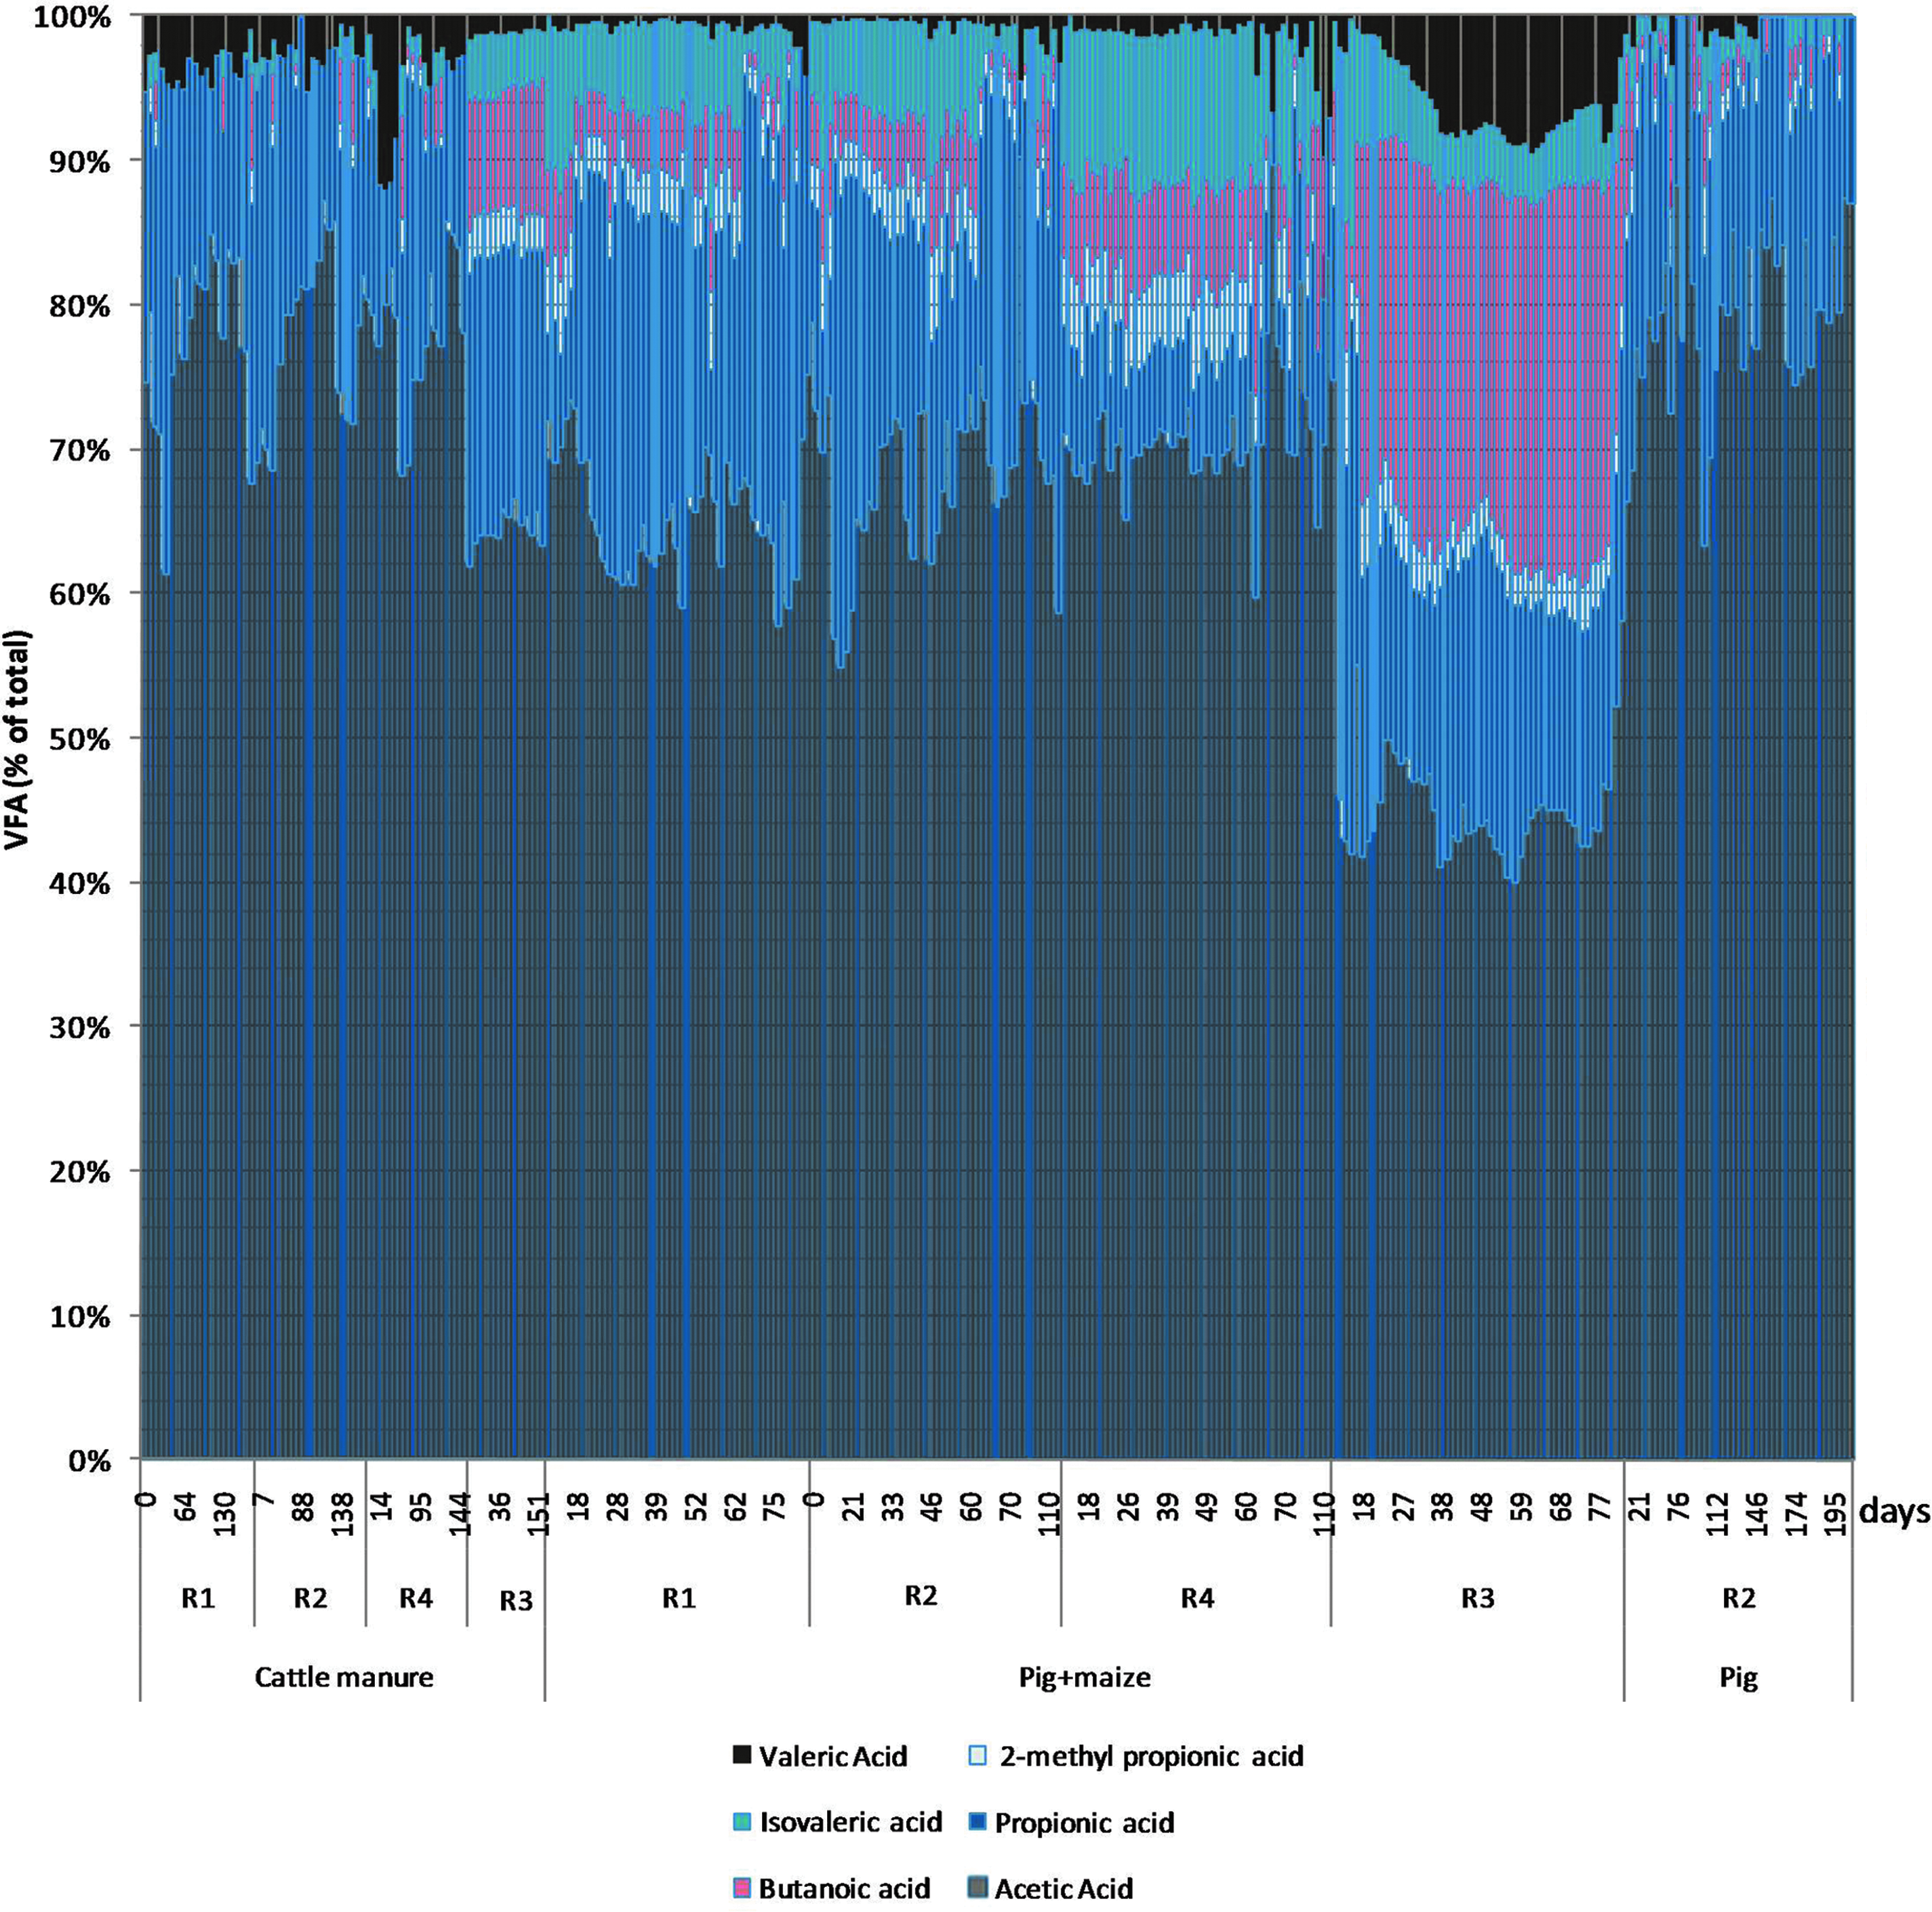
Distribution of VFA contents in digesters treating pig manure with and without maize and cattle manure. Figures refer to day of operation after start of sampling.
VFA levels in manure-based commercial biogas plants
Samples from three commercial plants in Denmark were also analyzed. Samples from OL and SN biogas plants were taken during a period of serious inhibition. In the OL plant, the process had completely failed when starting up sampling with a VFA level of 24,000–30,000 mg/L, and at that time, the digesters were emptied and reinoculated with digestate from another biogas plant. The reason for the process breakdown was the combination of a thermophilic process and a very high total ammonia level at 6.5 g NH4-N/L, which is much higher than the acceptable level (Nielsen et al., 2008, Nakakubo et al., 2008). After reinoculation, the VFA level has been steadily increasing, meaning that the process is not performing optimally owing to a level of total ammonia much higher than the inhibitory level (Fig. 3). The distribution of the individual VFA is illustrated in Fig. 4, showing that propionic acid is the most abundant VFA in the OL plant and, in some periods, accounting for 80% of the VFA.
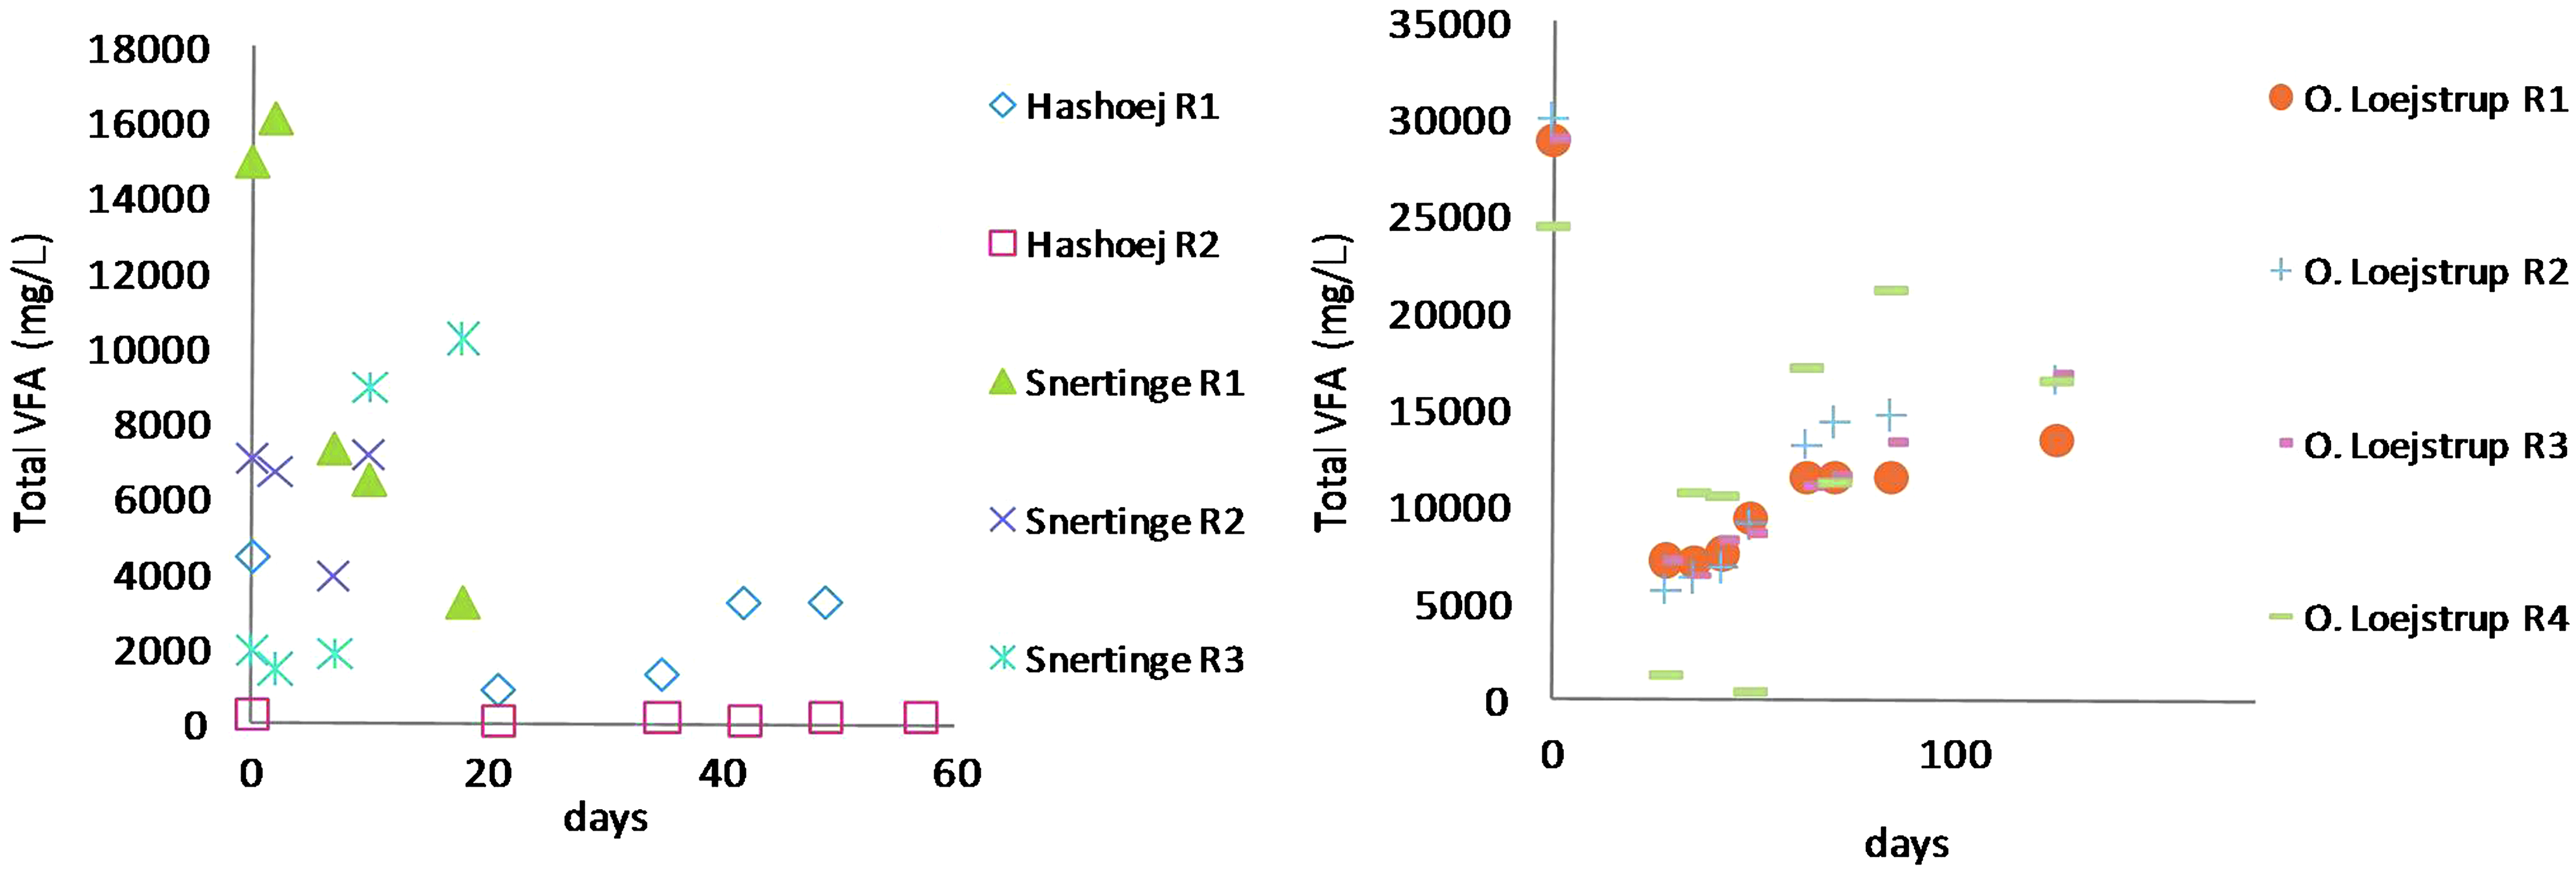
Total concentration of VFA during digestion in the three commercial biogas plants.
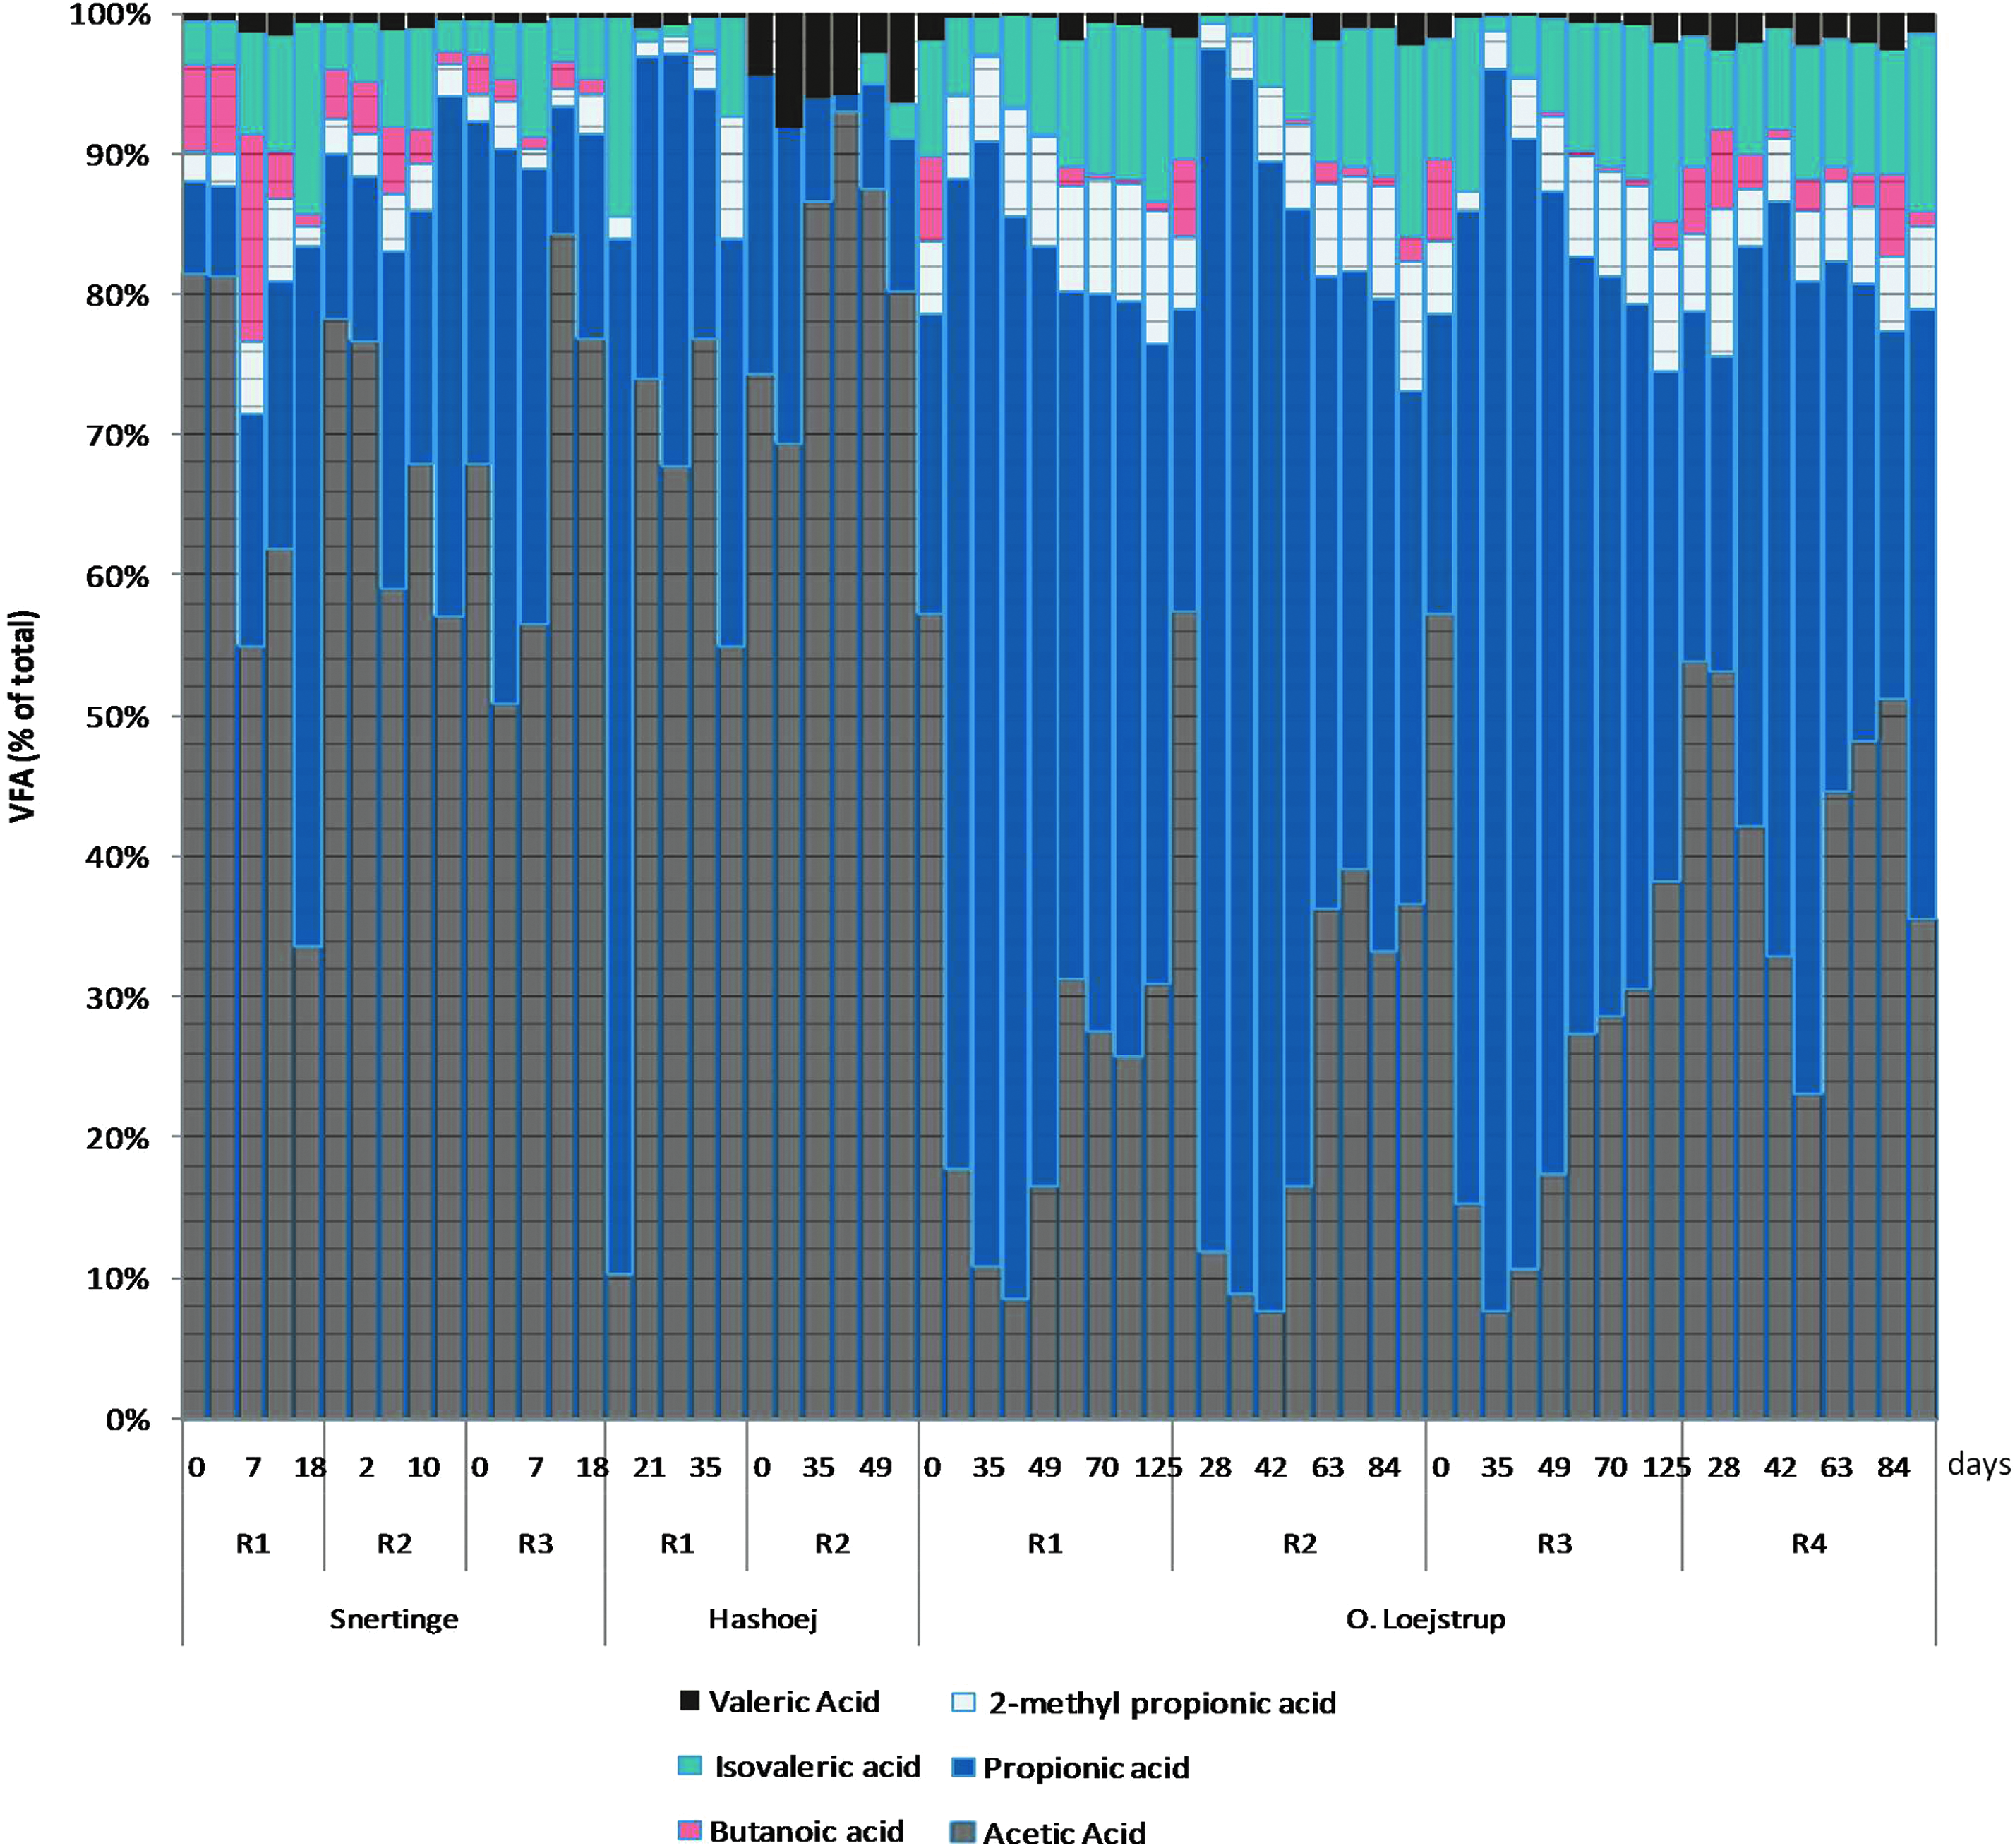
Distribution of VFA contents in commercial digesters.
In the SN plant, the sampling started after the plant faced serious process inhibition and three different recovery strategies were tested: In digester 1, the digester was not fed for 19 days; in digester 2, the digester tank was emptied completely and reinoculated with old digested material to 50% of full digester capacity; and in digester 3, the digester tank was completely emptied and reinoculated with mesophilic inoculum from another biogas plant to 50% of full digester capacity and temperature was increased by 1°C every day until thermophilic process temperature was reached. In digester 1, only cattle manure was added for the first 2 weeks, with a daily load of 1% of the digester content. In Fig. 2, it can be seen that the strategy in digester 1 was successful because the total VFA is decreasing rapidly. The strategy in digester 3 was less successful because the VFA is increasing in the period, which might be explained by very slow adaptation of the bacteria from mesophilic to thermophilic conditions. In general, acetic acid is the most abundant in all digesters, but in digesters 1 and 2 the fraction of propionic acid is gradually increasing, indicating that during the recovery the acetic acid is used up first. This is not the case for digester 3 because the total VFA is increasing during the adaption period and the acetic acid is produced faster than the consumption.
The Hashoej plant is running as a two-step mesophilic plant. The sampling was taken in a period without inhibition and a stable gas production. The VFA level is highest in the first step, with a level varying from 909 to 4,443 mg/L. In the second step, the VFA level is reduced 75–202 mg/L, indicating a very efficient digestion and removal of VFA. The distribution of the individual VFA is illustrated in Fig. 4. In general, acetic acid is the most abundant in both the first and second steps, accounting for >50% in the first step in all samples except the first sample. In the second step, on average >80% of VFA is acetic acid.
Development of models and comparison of titration values to GC values
Anderson and Yang (1992) developed a model for calculating the total VFA; however, this model was based on constants calculated from UASB digesters and the model is not perfectly suited to other types of digesters and biomasses. Further, this model has been developed with VFA concentrations <3,500 mg/L, which were lower than the high levels measured in some of the samples in the present study.
In the present study, a linear regression model (2a) was used and the parameter estimation of the four parameters used was made by analysis of variance (ANOVA) test using the R language environment for statistical computing and graphics (Institute for Statistics and Mathematics, 2010). In addition to the global model covering the whole VFA range, a submodel (2b) for precise estimation of VFA in the range <5,000 mg/L was made. Table 2 shows coefficients of regression, standard error, and level of significance of the regression model for the estimation VFA concentrations. The coefficients of regression are highly significant. The amount of titrant (C2) from pH 5.1 to 3.5 is the parameter contributing most to estimation of the VFA concentration. From the linear regression, the following model can be derived (Mod 2a):
Significance codes: ***0.001, **0.01, *0.05.
Source: Institute for Statistics and Mathematics, 2010.
A model in the lower VFA range was also derived (Mod 2b):
It can be seen in Fig. 5 that the results for VFA determination obtained using Mod 2a agree well with the corresponding reference data of concentrations of VFA, even at the highest and lowest concentrations with a correlation coefficient (R2) of 0.98 and slope close to 1. However, in the low VFA range (VFA <5,000 mg/L), the Mod 2a predicts some negative values (Fig. 5), which is undesirable if the model is used for process monitoring in practice, because a plant manager might have problems interpreting a negative value. For this reason, the Mod 2b might be a better choice in the lower VFA range, although the correlation (R2=0.8) is lower than in the global model. Thus, it is recommended to use the global model as a general model, but in cases with low VFA concentration Mod 2b should be used. In Fig. 6, the results for VFA determination with the same datasets using the model by Anderson and Yang (1992) are illustrated. It can be seen that the correlation coefficient (R2) is 0.97, with a slope at 1.4. It is clear that although the correlation coefficient is in the same magnitude as in the model developed in the present study, the prediction of the exact VFA value is quite poor. This is probably due to the fact that the calibration of the empirical constants was based on effluent from an UASB digester with low VFA concentrations (<3.5 g/L) and thus not fitted for CSTR processes with manure as the basic substrate, wherein the level of VFA especially during inhibition phases can be much higher. Further, the distribution of individual VFA in the study by Anderson and Yang (1992) is constant.

Comparison of VFA values measured by GC analysis and titration using Mod 2a (y=1.00x and R2=0.98) and Mod 2b (y=1.00x and R2=0.80).

Comparison of VFA values measured by GC analysis and titration using Mod 1 (y=1.4108x+2614 and R2=0.97).
The model used in the present study estimates the total VFA on a weight basis, and as the amount of acid used to titrate is correlated with the amount of VFA on molar basis and not on a basis of weight, this might affect the reliability of the model when the distribution of VFA differs. As the pKa is almost similar for the most abundant acids, acetic acid (pKa=4.76), propionic acid (pKa=4.87), and butyric acid (pKa=4.82), the molar determination of the amount of VFA will not be affected by a different distribution of VFA in the digested sample, but because the molar weight is different for acetic acid (60.05 g), propionic acid (74.08 g), and buturic acid (88.11 g), this might affect the reliability of the model. This will especially be the case in the high or low VFA range, wherein the ratio of acetic acid is different from the average distribution, resulting in an estimation of VFA that is too low compared with the GC analysis in the high VFA range and an estimation that is too high in the low VFA range.
Other chemical components in the samples, such as NH4-N and total phosphorus, might affect the model. The concentrations of total NH4-N vary between 2.5 and 4.8 g/L and of total phosphorus vary between 0.6 and 1.4 g/L in the collected samples. The concentration of NH4-N and total phosphorus covers the range that is found in manure-based digesters, meaning that the model is robust to different levels.
Summary and Conclusions
A new method determining VFAs in anaerobic digesters based on titration has been developed, covering a very broad range of VFA level from 38 up to 30,056 mg total VFA/L, whereas other models only covers a very low range (<3,500 mg/L). Thus, the present model is the first model being developed for the entire VFA range that can be found in digesters and hydrolysis tanks fed with manure as the main substrate. The method was used to determine the total VFA concentrations by simple titration with two endpoints in digesters with cattle manure solely and digesters codigesting livestock manure, maize, and organic waste. The total VFA concentrations measured by titration correlated well with those measured by a gas chromatograph and a new model was developed with an R2 value of 0.98 for the entire VFA range up to 30,056 mg total VFA/L and a slope close to 1. For lower VFA content of <5,000 mg/L, a modified model might be used to avoid negative values, but the correlation (R2=0.8) is lower than that in the global model, indicating that the precision for estimation of low VFA is not as precise as the estimation of VFA higher than 5,000 mg/L with the global model. However, the model will be very useful in detecting process disturbance, because this will result in high VFA concentrations. The model has been developed with samples from digesters covering a broad range of concentrations of other chemical components affecting the model and it is thus expected that the model can be used for all digesters wherein manure is the basic substrate.
Footnotes
Author Disclosure Statement
No competing financial interests exist.