
Abstract
Abstract
In this study, microemulsion and hydrothermal methods were used together to obtain controlled particle size and uniform distribution of zinc oxide/activated carbon nano-composite materials. Precursors of zinc oxide/activated carbon were prepared using a microemulsion of an oleic acid/n-Butanol/sodium hydroxide solution. Precursors were dispersed in water or ethanol and then treated, using a hydrothermal method to obtain zinc oxide/activated carbon. Samples were characterized using thermogravimetric/differential thermal analysis, scanning electron microscopy, energy dispersive spectroscopy, infrared spectroscopy, and X-ray diffraction. Scanning electron microscopy results indicated that zinc-oxide particles with a narrow size distribution were distributed evenly on the surface of the activated carbon. Infrared spectroscopy showed that peak zinc-oxide vibration bands shifted to lower wave numbers with a reduction in the concentration of zinc sulphate, an increase in the concentration of sodium hydroxide in the microemulsion, and a prolonging of the hydrothermal reaction time. Photodegradation rate of rhodamine B in aqueous solutions containing zinc oxide/activated carbon composites at a pH of 5 was remarkably faster than the rate in aqueous solutions containing nano-zinc oxide.
Introduction
In this study, a new process that combines microemulsion and hydrothermal methods was employed to synthesize ZnO/AC composites. The process has a number of advantages over other processes: It requires only simple equipment; it can control ZnO particle size; and it can distribute nano-ZnO uniformly on the surface of AC and difficult to reunite. The composites were synthesized in two steps. In the first step, monodisperse zinc hydroxide [Zn(OH)2] microspheres were synthesized by microemulsion and coated on the surface of the AC. This restricted the reaction environment to the aqueous cores, which acted as both nonreactors and particle agglomeration barriers. The samples were then filtered and washed with acetone to obtain precursors of ZnO/AC. In the second step, the ZnO/AC precursors were dispersed in water or ethanol and treated using the hydrothermal method at low temperature. The preparation and characterization of ZnO/AC catalysts and the photocatalytic efficiency of the catalysts on the degradation of rhodamine B are reported in this work.
Materials and Methods
Preparation of ZnO/AC precursors
Oleic acid, n-Butanol, and sodium hydroxide (NaOH, 4 mol/L) were mixed together in the volume ratio of 1:1:1.2 and stirred at room temperature to obtain a clear (transparent) microemulsion. For this microemulsion system, oleate and sodium oleate were used as surfactants, and n-Butanol was used as a cosurfactant and oil phase.
Two grams AC (782.3 m2/L surface area, 3.0% ash content, 300 mesh particle size, and an impurities content 2.5% acid soluble, 1.5% water soluble), provided by TianJin Fine Chemicals, were added into 50 mL of the microemulsion and stirred until the microemulsion and AC mixed equally. At that point, 4 mL zinc sulphate (ZnSO4) (2 mol/L) was slowly dropped into the microemulsion. The amount of the ZnSO4 was controlled by the pH and coating ratio we set (ZnO%). The appropriate range of the pH was ∼8–11. To avoid deposits, the reaction system was continuously stirred for 1 h, then the microemulsion was demulsified by acetone and rinsed by centrifuging, whereupon the precursors of ZnO/AC were obtained. The oleic acid and n-Butanol in the filtrate were recycled by addition of hydrochloric acid (HCl) (6 mol/L) and then separated.
A series of precursors were prepared in order to understand the impact of different NaOH or ZnSO4 concentrations in the microemulsion system with the nano-ZnO particle size.
Preparation of ZnO/AC composites
After preparation, the precursors were dispersed in either water or ethanol. A 40 mL sample was sealed in a Teflon-lined stainless steel autoclave with a volume of 50 mL and was heated at 160°C for 24 h. After the autoclave had cooled, the precipitates were separated from the solution by filtration or centrifuge. The products were washed with distilled water until the pH was ∼7, then dried at 100°C. A series of samples were obtained by changing the hydrothermal reaction time.
Preparation of bare ZnO
The process described for the preparation of ZnO/AC precursors and composites was used to prepare bare ZnO, omitting the addition of AC to the system.
Phase characterization
Phase characterization of the synthesized powders was identified, using an X-ray diffractometer (D/Max 2500 V PC) with Cu Ka radiation. The morphology and particle size of the samples were examined, using a scanning electron microscope (SEM) (XL30 ESEM- FEG). The surface hydroxyl (−OH) groups of the composites were determined by Fourier transformed infrared spectroscopy (FTIR), using solid potassium bromide (KBr) in pellet form (JASCO FT/IR-460 Plus). The thermal behavior of the ZnO/AC precursors were investigated at a heating rate of 10°/min in N2 on a thermogravimetric/differential thermal analyzer (TG/DTA) (STA 449C TG/DTA). The weight ratio of the AC to ZnO was measured by an energy-dispersive x-ray spectrometer (EDS) (OXFORD INCA300). Visible spectral measurements were done, using a 723N spectrophotometer.
Degradation of rhodamine B
The photocatalytic activity of the catalyst was determined by the degradation of rhodamine B in water under ultraviolet (UV) irradiation. To determine the degradation, 200 mg of catalyst was added into 100 mL of aqueous solution of rhodamine B (10 mg/L). The pH values of reactant solutions were adjusted with hydrochloric acid (HCl) to pH 5. The solution was irradiated with UV light, using a multilamp photoreactor (Heber HML-MP 88) that consisted of eight medium pressure mercury vapor lamps (8 W) set in parallel and emitting a 365 nm wavelength. To provide oxygen and ensure complete mixing, the solution was aerated continuously by a pump. To monitor the concentration of rhodamine B, 2 mL of the sample were withdrawn at specific intervals and centrifuged to remove the catalyst. One mL of the centrifugate was diluted to 10 mL, and its absorbance at 554 nm was measured by a 723N visible spectrophotometer (Chen et al., 2009).
Results and Discussion
XRD
Figure 1 shows XRD patterns for bare ZnO and ZnO/AC composites produced by the hydrothermal method or the solvothermal method. All the samples exhibit only the patterns assigned to the well crystalline hexagonal phase of ZnO. The strong and narrow diffraction peaks indicate that the material has a good crystallite. No characteristic peaks from impurities such as zinc hydroxide [Zn (OH) 2] can be detected. The peak at 2θ=21.8°corresponds to AC in Fig. 1b and Fig. 1c. The crystal size of ZnO was determined from the broadening diffraction peak, using the Scherrer equation (Fang et al., 2010),

XRD patterns of ZnO photocatalysts.
where D is the crystal size of the catalyst, λ is the X-ray wavelength (λ=0.15405 nm), β is the full width at half the maximum X-ray peak of the ZnO, K (0.89) is a coefficient, and θ is the diffraction angle. The results are shown in Table 1.
With the addition of AC, the average size of the ZnO particles decreased from 27.4 nm to 12.9 nm and 11.8 nm. Nano-ZnO is easy to aggregate for huge specific surface areas and high surface energy, and the aggregation tendency can be weaken by addition of AC (Liu et al., 2005). There is no significant difference in the particle size of ZnO produced by the hydrothermal and solvothermal methods.
The morphology of the composites and the EDS analysis
The texture and morphology of ZnO/AC composites are very important parameters and may influence photocatalytic activity. The SEM patterns are shown in Fig. 2. As can be seen, the AC surface in an irregular, porous, sheet structure, homogeneously covered by ZnO particles with a narrow size distribution. In the presence of microemulsion, precursors are restricted to the aqueous cores by the surrounding surfactant and can be coated on the surface of AC by the force of absorbability and hydracids.
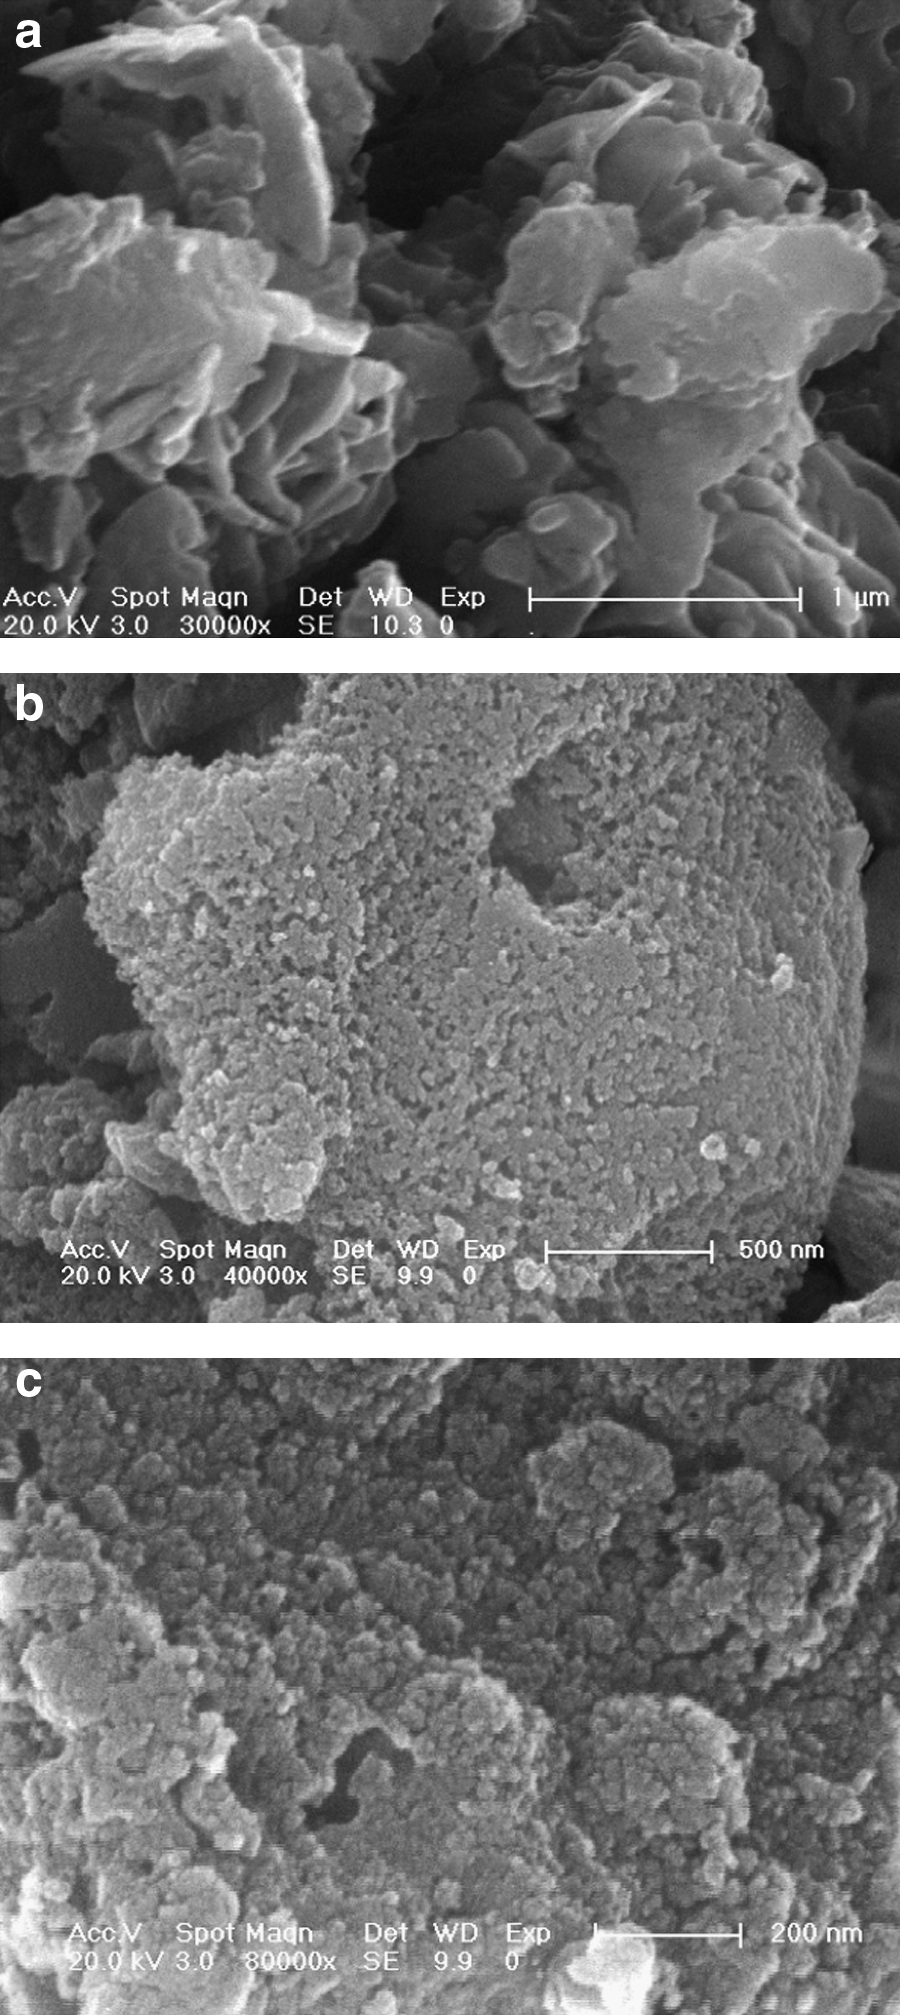
SEM images of sample by hydrothermal (same sample at different magnifications).
Figure 3 shows the EDS spectrum of the representative parts of Fig. 2. The results suggest that the synthesized ZnO/AC is composed of only zinc, oxygen, and carbon. The weight ratio of three elements is shown in Table 2.

EDS spectrum of samples.
The coating ratio is also the weight ratio of ZnO to total weight of ZnO/AC composites. In this work, 2.0 g AC and 4 mL 2 mol/L ZnSO4 were employed to prepare ZnO/AC composites. If the Zn2+ coated on AC in the form of ZnO, the theoretical weight ratio of Zn in the composites should be:
Based on Table 2, the weight ratio of Zn is 19.57% in the ZnO/AC composites, and the amount we added into the system is 19.7%, so using this process, Zn2+ can transfer, almost entirely, to ZnO/AC composites as ZnO crystal.
TGA/DTA
The TGA/DTA curves of the ZnO/AC precursors are shown in Fig. 4. Figure 4b exhibits two exothermic peaks. The deep valley around 170°C represents a small endothermic effect corresponding to water or n-Butanol on the ZnO/AC precursors (Liu et al., 2005; Sheng et al., 2006). The exothermic peaks appearing around 330°C and 400°C can be attributed to the removal of the surfactant and the crystallization of ZnO, respectively. The TGA curve shows two weight losses. The first, around 150°C, corresponds to the removal of adsorbed water from the precursors (see Fig. 4b). The second weight loss of 17%, around 200°C to 450°C, and the corresponding peaks in the differential thermal analysis (DTA) indicate the removal of the surfactant (see Fig. 4b). Weight loss in the TGA curve stabilizes after 500°C, which corresponds to the DTA patterns.

TGA/DTA curves of ZnO/AC precursors by microemulsion.
FT-IR study
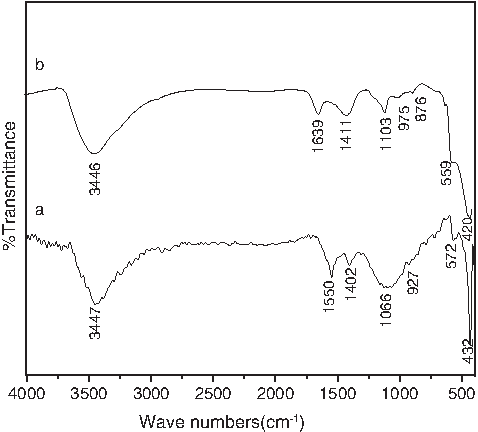
In order to understand the surface nature, FT-IR spectra were recorded for the ZnO, AC, and ZnO/AC composites. As shown in Fig. 5, two peaks appear at around 3400 cm−1 and 1650 cm−1 that correspond to the physically adsorbed water molecules and surface hydroxyl groups. The strong absorption band around 420 cm−1 in Fig. 5b, c, and d is assigned to the stretching vibrations of the Zn-O.
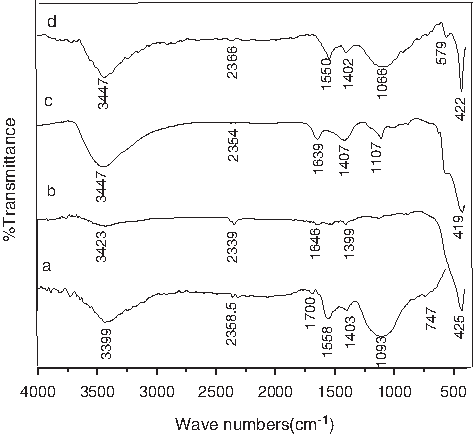
FT-IR spectra.
In the spectrum of the AC hydroxyl group (Fig. 5a), vibration bands are centered at 3399 cm−1. In the bare ZnO and ZnO/AC composite groups, there is a progressive O-H vibration shift to higher wave numbers (from 3399 cm−1 to 3423 cm−1 and 3447 cm−1). These vibration shifts have been attributed to an increment of the positive charge on the OH groups (Connor et al., 1999) adsorbed on the surface of ZnO and ZnO/AC, which confirms the changes in the acid-base character of the hydroxyl groups in these catalysts. As Fig. 5 reveals, there is no obvious different between ZnO/AC produced by the hydrothermal method and that produced by the solvothermal method. Furthermore, in the 800 cm−1to 1600 cm−1 region, two new bands were obtained. One band at the wavelength of 870 cm−1 to 950 cm−1 corresponding to a C–O–C structure can be observed on the surface of the ZnO/Ac composites. The existence of a C–O–C structure was confirmed in investigations of basic AC and also in pyrones, which are found to have strong basic sites. Although AC has two broad bands in this region, these bands are structured in ZnO/AC composites because of the interaction of ZnO. Apart from these peaks, no other peaks related to the surfactant or other C–C bonds were obtained. This clearly indicates that all the surfactant molecules are completely removed.
The effect of the concentration of NaOH in the microemulsion on particle size is shown in Fig. 6. Fig. 6a is the spectrum of the sample produced by the hydrothermal method just discussed. Fig. 6b shows the spectrum of a sample prepared under the same conditions except for the concentration of NaOH in the microemulsion. The results show that the peak of Zn–O vibrations shifts to lower wave numbers with an increase in the concentration of NaOH in microemusion, indicating that the size of the ZnO particles increases with the increase in concentration of NaOH. When the grain size decreases, the crystal lattice dilates anistropically, inducing the red shift of stretching vibrational mode. When the concentration of NaOH in microemulsion increases, it causes an increase in concentration of surfactant, sodium oleate, which, in turn, causes an increase in the diameter of aqueous cores in the microemulsion.
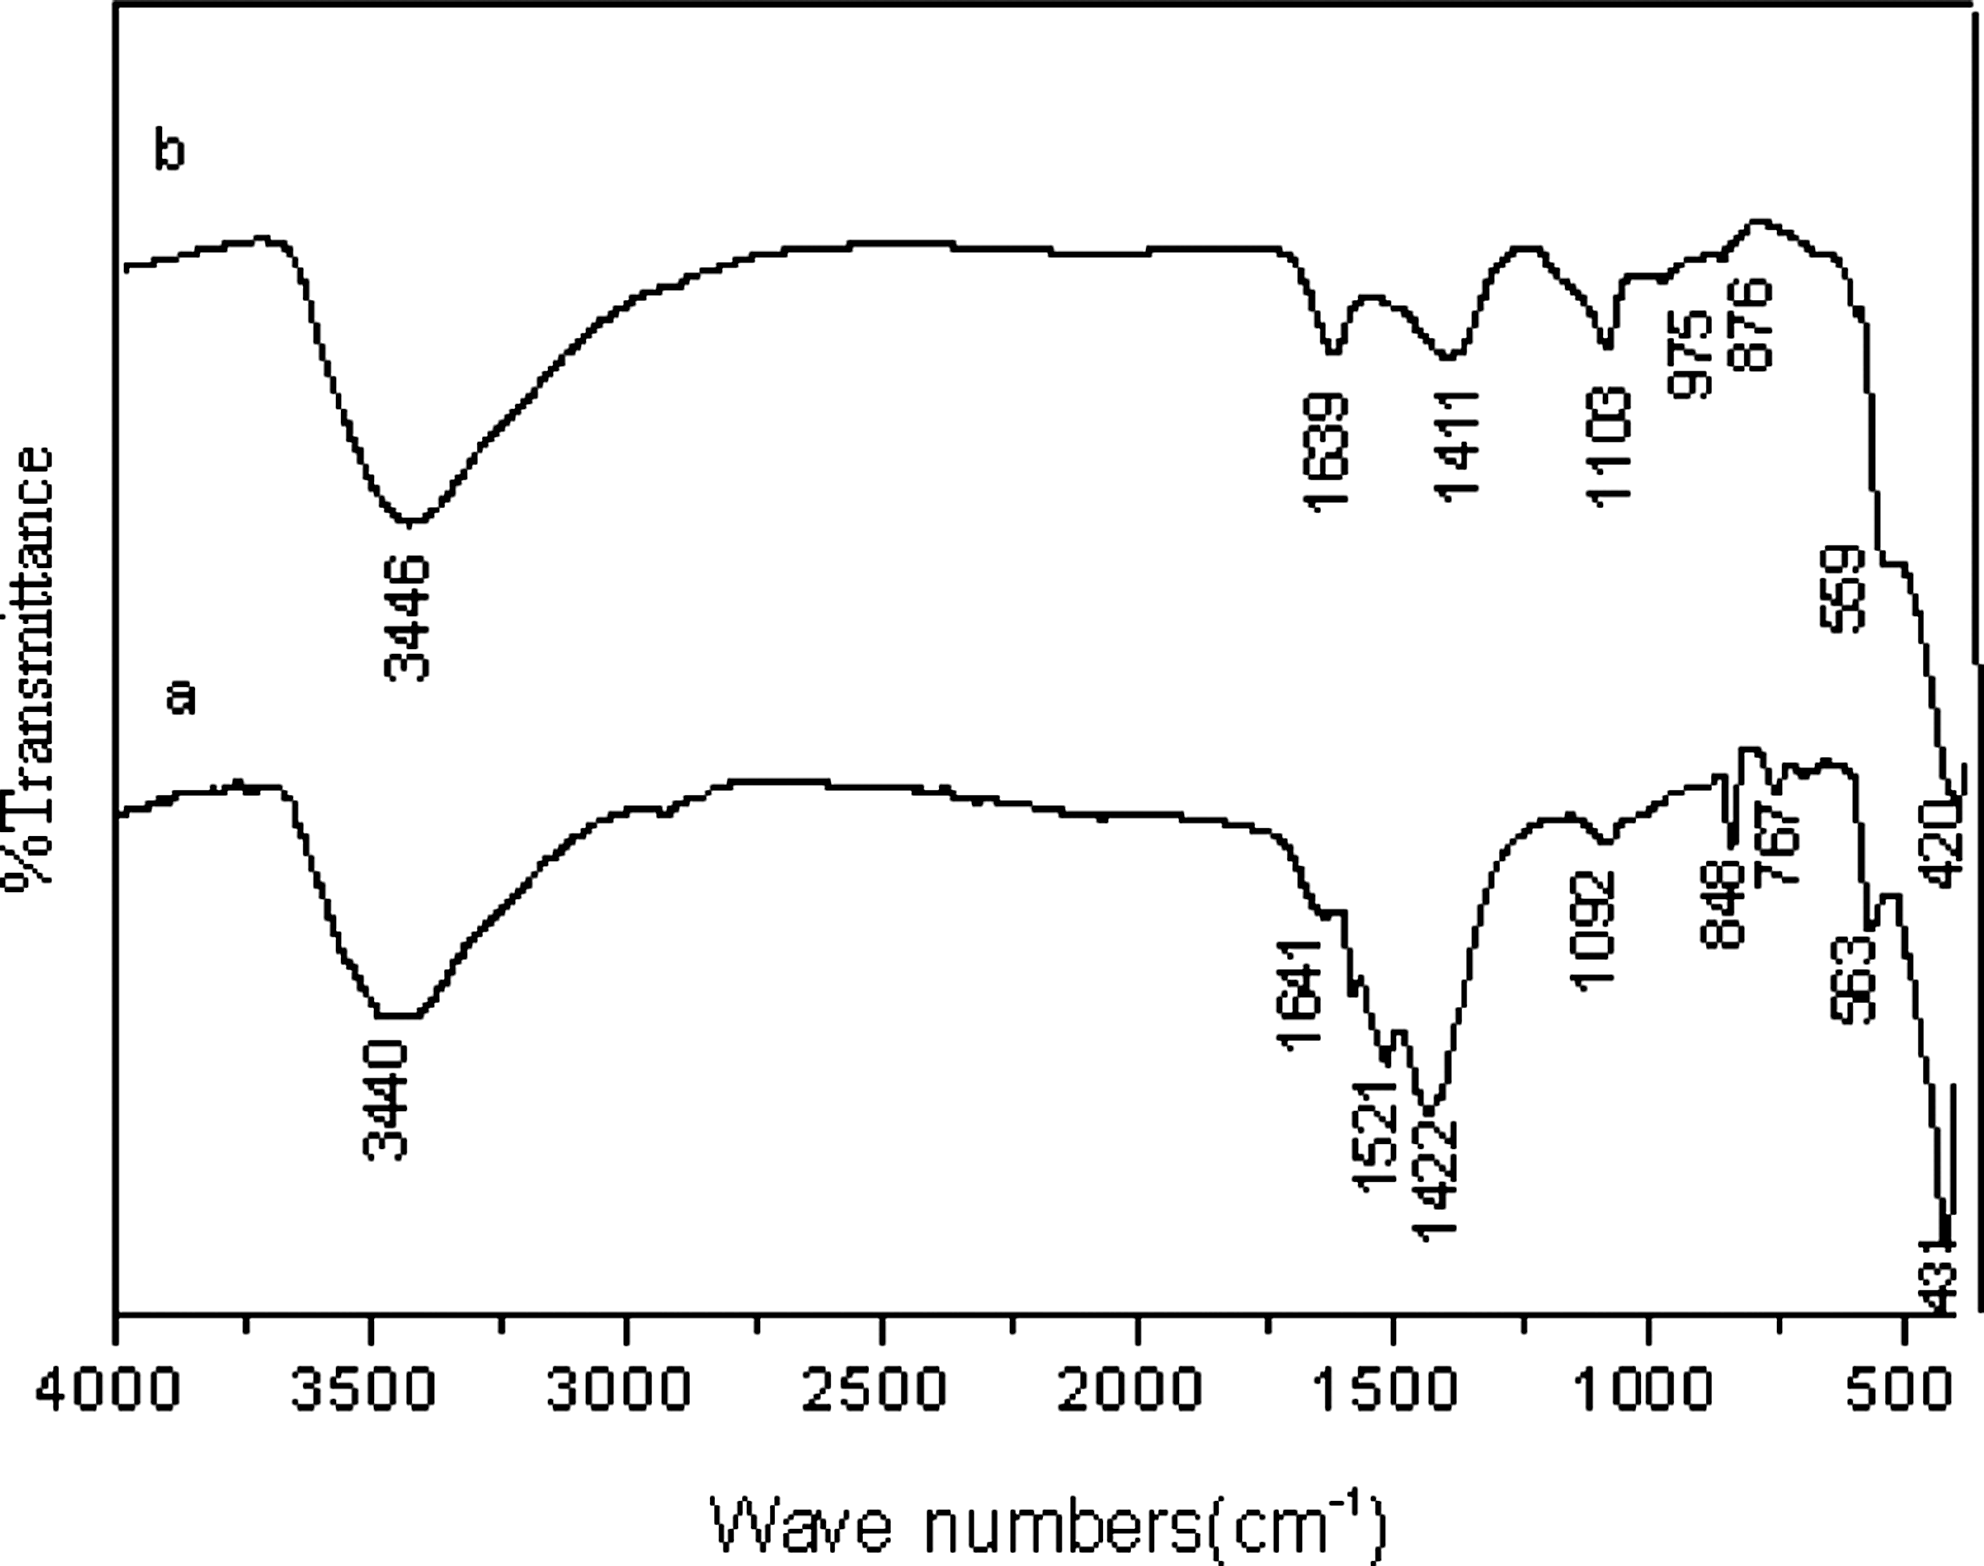
FT-IR spectra. Sample prepared using the previously described method with the exception of the concentration of NaOH in the microemulsion.
The effect of the concentration of ZnSO4 is shown in Fig. 7. Once again, samples were prepared using the method previously described except for the concentration of ZnSO4. The peak of Zn-O stretching vibration shifts to higher wave numbers with an increasing concentration of ZnSO4, which indicates that the particle size of ZnO decreases with the increasing concentration of ZnSO4. When the concentration of ZnSO4 decreases, less crystal nucleus formed and growing in high velocity, which induces the greater size of ZnO particles.
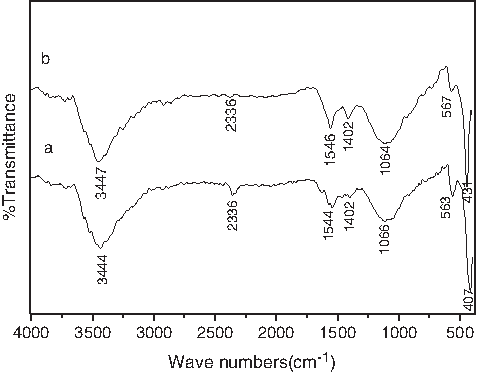
FTIR spectra. Sample prepared using the previously described method with the exception of the concentration of ZnSO4 (solvothermal).
Figure 8 shows the effect of heating time on ZnO particle size. The peak of Zn-O stretching vibrations shifts to lower wave numbers with an increase in the heating time. The size of ZnO particles increases with the prolonging of heating time.
FTIR spectra. Sample prepared using the previously described method with the exception of the hydroheating time.
Photocatalytic degradation of rhodamine B
The results of photocatalytic degradation of rhodamine B are shown in Fig. 9. The curves were fitted with a kinetic model (Wang et al., 2006):
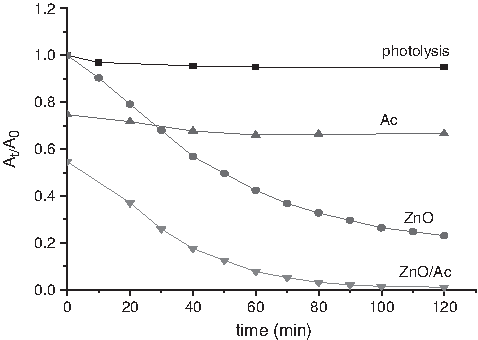
Kinetic curves of Rhodamine B in the presence of various illuminated solids during UV-irradiation (pH=5).
where A0 is the absorbance at the beginning of degradation, and k is the pseudo-first-order rate constant. The results are shown in Fig. 10. The regression analysis shows that the value of k is 0.0376 (coefficient of correlation R=0.99225) under AC/ZnO, while the value of k is 0.0129 (R=0.99423) under bare ZnO. As there is only 4% degradation within 120 min of UV-irradiation, direct photolysis without solids can be ignored. A 30-min period of adsorption in the dark was chosen for the attainment of adsorption equilibrium. The degradation of rhodamine B in the presence of UV-irradiated AC is negligible (less than 5%) after 120 min of UV-irradiation. Removal of rhodamine B is due only to adsorption, because there is no photoactivity. Bare ZnO gives 80% removal of rhodamine B in ∼120 min of UV-irradiation. By contrast, ZnO/AC nearly totally eliminates rhodamine B from the solution within 120 min.

Kinetic fitting results (pH=5).
Conclusions
In this work, we have successfully prepared ZnO/AC composites by a microemulsion-hydrothermal method. The preparation of ZnO/AC nano-composites was carried out using a microemulsion of Oleic acid, n-N-Butanol, and sodium hydroxide solution and mild hydrothermal/solvothermal conditions (T=160°C).
The advantages of this method can be summarized as follows:
1. ZnO is uniform and is adsorbed on the AC particle surface. The distribution of ZnO is found to be homogeneous. 2. The microemulsion can be recycled, which reduces the cost of synthesis. 3. The size of ZnO particles can be adjusted by changing the concentration of NaOH and/or ZnSO4 in the microemulsion and the heating time. 4. With the addition of AC, the average size of particles decreases. Whether the hydrothermal method or the solvothermal method is used, there is no significant difference in ZnO particle size. 5. The photodegradation rate of rhodamine B in aqueous solutions containing ZnO/AC composites at pH5 is faster than the rate in aqueous solutions containing nano-ZnO.
Footnotes
Acknowledgment
The authors gratefully acknowledge financial support by Zhanjiang Normal University Foundation (L0708).
Author Disclosure Statement
No competing financial interests exist.