
Abstract
Abstract
Existence of inert biomass and its impact on biomass accumulation patterns and biofilter performance were investigated. Four biofilters were set up in parallel to treat gaseous toluene. Each biofilter operated under different inlet toluene loadings for 100 days. Two microbial growth models, one with an inert biomass assumption and the other without, were established and compared. Results from the model with the inert biomass assumption showed better agreement with the experimental data than those based on the model without the inert biomass assumption thus verifying that inert biomass accumulation cannot be ignored in the long-term operation of biofilters. According to the model with an inert biomass assumption, the ratio of active biomass to total biomass will decrease and the inert biomass will become dominant in total biomass after a period of time. Filter bed structure simulation results showed that the void fraction is more sensitive to biomass accumulation than the specific surface area. The final void fraction of the biofilters with the highest inlet toluene loading is only 67% of its initial level while the final specific surface area is 82%. Identification and quantification of inert biomass will give a better understanding of biomass accumulation in biofilters and will result in a more exact simulation of biomass change during long-term operations. Results also indicate that an ideal biomass control technique should be able to remove most inert biomass while simultaneously preserving as much active biomass as possible.
Introduction
The biomass accumulation pattern in the filter bed is affected by some operating conditions, such as inlet VOC loading, nutrient feeding, and type of nitrogen source. (Smith et al., 1996; Deshusses and Cox, 1999; Kennes and Veiga, 2002). Many microbial growth models have been developed to describe biomass accumulation patterns under different operating conditions (Schwarz et al., 2001; Song and Kinney, 2002; Iliuta and Larachi, 2004; Nukunyaa et al., 2005; Silva et al., 2010). Among these models, however, only a few have considered inert biomass, that part of a biomass composed of cells without biological activity. Although all the models seem to successfully predict the biofilter performance, the microbial growth patterns are quite different with and without an inert biomass assumption (Okkerse et al., 1999). According to a model without an inert biomass assumption, total biomass will reach a constant value after a long period of operation. However, a model with an inert biomass assumption shows that the total biomass will increase continuously no matter how long the biofilter is operated.
One reason inert biomass is sometimes ignored is because measurements of active or inert biomass are rather difficult (Shim and Lewandowski, 2002; Mitchell et al., 2004). Another possible reason is that a consideration of inert biomass would make model resolution and calculation more complicated. Although some researchers have noted that inert biomass affects the biomass accumulation patterns as well as the reactor performance (Liu, 2002; Song and Kinney, 2005), there are few specific studies on the existence of inert biomass and its impact on biofilter performance. The aim of this study is to investigate the existence of inert biomass and its effect on biomass accumulation patterns and structure change in filter beds. Four biofilters were operated for more than 100 days, and the total biomass during the period of operation was monitored. Two microbial growth models, one with an inert biomass assumption and the other without, were established and compared. The change in the filter bed structure due to biomass accumulation was analyzed based on simulation results.
Materials and Methods
Experimental setup
Four parallel biofilters, identified as #1, #2, #3 and #4, were built for this experiment. Each biofilter column had an inner diameter of 120 mm and the height of each filter bed was 200 mm. Wood chips (10–40 mm in length; 1–3 mm in width) and propylene spheres (25 mm in diameter) were mixed (volume ratio 3:2) and packed into the filter beds. The void fraction of the filter beds was 0.60 at the beginning of the operation period. The detailed structure of the experimental system was similar to the experimental system in our previous study (Xi et al., 2006).
Operating conditions
After being inoculated with activated sludge taken from a wastewater treatment plant, the four biofilters were fed with toluene gas and operated continuously for more than 100 days. The operating conditions during this period are shown in Table 1.
The experimental period was divided into two phases. In Phase I (Days 1–50), the inlet toluene concentrations of the four biofilters were similar and maintained at ∼1000 mg/m3. In Phase II (Days 51–100), the inlet toluene concentrations of the four biofilters were set to different levels (see Table 1). During the operation period, a solution containing nitrate and other nutrients was sprayed onto the filter beds to ensure that no nutrient limitation existed. The composition of the solution was same as that used in our previous study (Xi et al., 2006).
Analytical methods
During the experimental period, the inlet and outlet gaseous toluene concentrations were analyzed by a gas chromatograph, and the pressure drops of the filter beds were monitored intermittently by a water manometer. The detailed procedure and conditions were the same as those in our previous study (Xi et al., 2006). To estimate the variation in the total biomass concentration (Okkerse et al., 1999), the total weight of wet biofilm in the filter bed was determined by removing the weight of the empty column and wet packing media from the weight of total biofilter column. The moisture content of the biofilm was measured during the period of operation and the total biomass concentration in dry weight was then estimated.
Model Development
Microbial growth model with inert biomass assumption
Assuming that the total biomass in the filter bed consisted of active biomass and inert biomass, the total biomass concentration Xt can be expressed by the following equation:
where Xt is the total biomass concentration in the filter bed (g/m3), Xa is the active biomass concentration (g/m3), and Xi is the inert biomass concentration (g/m3). The variation of Xa and Xi can be expressed as
where Y is the yield coefficient of the active biomass (g cell/g toluene), r is the toluene removal rate (g/m3/h), b is the shear/decay coefficient (h−1), β is the ratio of produced inert biomass to lost active biomass (dimensionless), and t is time (h). Based on Equations (1), (2), and (3), the following equations can be drawn:
where Xa0 is the initial active biomass concentration when t=0 (g/m3) and Xi0 is the initial inert biomass concentration when t=0 (g/m3).
Microbial growth model without inert biomass assumption
Assuming that there was no inert biomass in the filter bed, the parameter Xi0 and β would be equal to zero, and Equation (6) could be simplified as
where all the items are defined as they were for Equation (6).
Filter bed structure model
The filter bed structure model is similar to the model using parallel pipes created by Alonso and Suidan (1998). Assuming that biofilm density is constant during the period of operation, the relationship between the total biomass concentration (Xt) and the filter bed structure parameters can be expressed as
where ɛ is the void fraction of the filter bed with biomass (dimensionless), ɛ0 is the initial void fraction of the filter bed with no biomass (dimensionless), a is the specific surface area of the filter bed with biomass (m2/m3), a0 is the initial specific surface area of the filter bed with no biomass (m2/m3), and Xf is biomass density (g/m3).
Results and Discussion
Parameters estimation and sensitivity analysis
The parameters and initial conditions in this study are either measured directly or calculated based on experimental data. The results are given in Table 2.
The toluene removal rates varied by time for different biofilters. The average toluene removal rate between two sampling days can be used to calculate the biomass concentration during the period.
The toluene removal rates (r) of the four biofilters for each sampling day are listed in Fig. 1. The average toluene removal rate between two sequential sampling days was determined and used to calculate the biomass concentration during the relative period. The biomass density (Xf) was measured using the weighing method previously described and was assumed to be constant during the whole period of operation.
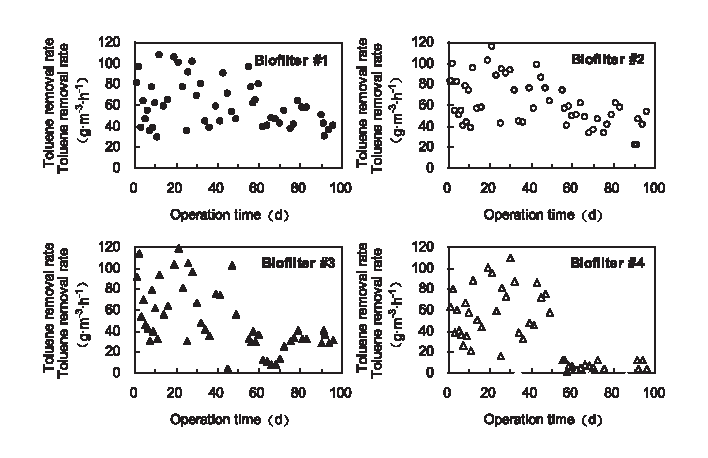
Variation of toluene removal rate for four biofilters.
The value of β was estimated using the regression method, based on the removal rate and biomass data after Day 75. According to Equation (6), when t is greater than 75 d, most of the increment of total biomass is inert because the value of e−bt is very small. Thus, the biomass accumulation rate is proportionate to the toluene removal rate, and the slope is determined by β. The regression results show that β equals 0.2, which is similar to what has been reported by other researchers (Rittmann and McCarty, 2001). The values of Y and b are calculated based on the biomass concentration data of Biofilter #1. By changing, within reasonable ranges, the values of Y and b, Equations (6) and (7) will give different calculated total biomass concentrations. The values of Y and b are determined when the sum of the squared difference between the calculated total biomass concentration and the experimental total biomass concentration is minimized.
The initial active biomass concentration and inert biomass concentration are very small and have no significant impact on total biomass calculation result (see the sensitivity analysis in the next paragraph). Thus, the values of Xa0 and Xi0 are assumed to be 0.05 g/L. The initial void fraction of the filter bed is measured by filling the filter bed with a certain volume of water.
In order to estimate the impact of each parameter on the simulation results, a sensitivity analysis was performed on all the parameters by increasing each parameter by 10% while the other parameters remained unchanged. A relative sensitivity index (RSI) was defined as
where Xti is the calculated total biomass concentration after one parameter is changed, Xti0 is the calculated total biomass concentration when all the parameters have the original values in Table 2, and i and n represent the serial number and total number of divisions between two sequential sampling days. According to the RSI results shown in Table 2, the toluene removal rate (r) and yield coefficient (Y) have the greatest impact on total biomass predictions when compared to other parameters, but that impact is not particularly significant because their RSI results are lower than 1.
Biomass accumulation simulation
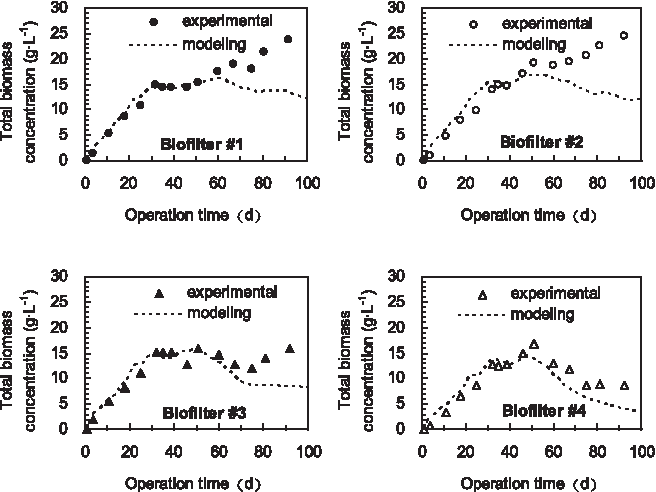
Using the parameter estimation results, the biomass concentrations of the four biofilters during Phases I and II were calculated and compared with the experimental data. In the microbial model, when inert biomass is considered, the calculated biomass accumulation pattern shows agreement with the experimental data for all four biofilters in Phase I and Phase II (Fig. 2). This result verifies that the microbial growth model with an inert biomass assumption successfully describes the real biomass accumulation process.

Calculated total biomass concentrations under inert biomass assumption compared with experimental results.
Figure 3 shows the biomass simulation results when inert biomass is ignored. For all four biofilters, the calculated total biomass concentrations without an inert biomass assumption agree fairly well with the experimental data up to Day 60 but fail to simulate the biomass variation trend after Day 60. This result indicates that microbial growth models without an inert biomass assumption may be accurate if the operating period is not very long. However, for long-term operations, inert biomass cannot be ignored in biomass accumulation simulations.
Calculated total biomass concentrations without inert biomass assumption compared with experimental results.
According to the microbial growth model based on the assumption of inert biomass, total biomass concentration will increase continuously after long-term operation, even if the inlet VOC loading or VOC removal rate is very small. This means that all biofilters will eventually clog without a biomass control, although the point at which they clog will vary. Thus, it is important to recognize the impact of inert biomass on the long-term performance of a biofilter.
Variation of active biomass and inert biomass concentrations
The active and inert biomass concentrations in the four biofilters were calculated according to Equations (4) and (5) and the results are shown in Fig. 4.
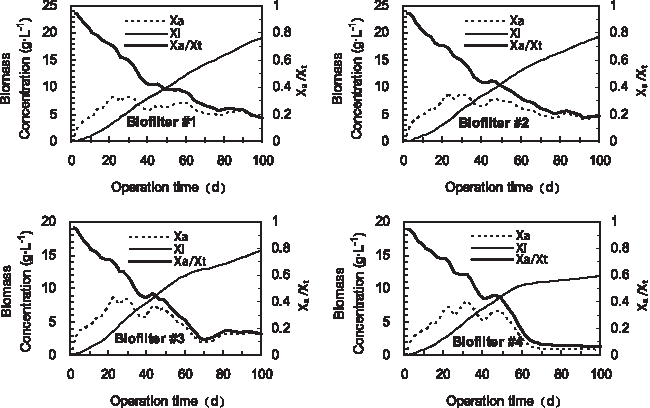
Variation of calculated active and inert biomass concentrations under inert biomass assumption for the four biofilters.
The active biomass concentrations of the four biofilters increased quickly at the beginning of the operating period and then, in response to variations in the inlet toluene concentration, changed to different levels in Phase II. The inert biomass increased throughout the operating period, and most of the increased biomass was inert biomass in Phase II. The ratios of active biomass to total biomass for the four biofilters decreased continuously during the operating period, and inert biomass was dominant in the total biomass by the end of the operating period. Some similar results were reported by Song and Kinney (2000, 2005), who found that carbon accumulation in a biofilter continued throughout the period of operation while the cell count remained relatively constant.
In addition to investigations into the ratios of active to inert biomass, there is a need for investigations of the distribution and function of active and inert biomasses on biofilms and their impact on biofilter performance (Morgenroth and Milferstedt, 2009). According to some experimental and computational results, inert biomasses accumulate primarily near the attachment surface, while active bacteria predominate near the outer surface, because of higher concentrations of substrates and oxygen on the biofilm surface (Laspidou and Rittmann, 2004). Given this, current biomass control techniques, for example, backwashing or chemical washing, will remove much of the active biomass on the biofilm surface and result in a decline in VOC removal capacity. The ideal biomass control technique should remove most of the inert biomass and preserve as much active biomass as possible. A recent study found that a continuous injection of a certain concentration of ozone into the filter bed can lower the biomass growth rate and preserve the VOC removal capacity simultaneously (Wang et al., 2009). This finding may lead to the creation of an ideal biomass control method.
Filter bed structure change and its impact on biofilter performance
Using Equations (8) and (9), for each biofilter, the fractions of void fraction and specific surface area to the original values were calculated, and the results are shown in Fig. 5. Both the void fractions and specific surface areas of the four biofilters decrease during the period of operation. The void fraction reduced more quickly than did the specific surface area. The final void fraction of Biofilter #1 is only 67% of its initial level, while the final specific surface area is 82%. This result indicates that the void fraction is more sensitive to biomass accumulation than specific surface area.

Variation of calculated a/a0 and ɛ/ɛ0 under inert biomass assumption.
The filter bed structure change will affect the VOC removal rate and pressure drop of the biofilter (Song and Kinney, 2000; Morgan-Sagastume et al., 2001). Figures 1 and 6 show the variation of toluene removal rate and pressure drops in the four biofilters during the operating period. The toluene removal rates of Biofilter #1 and #2 are found to have decrease in Phase II (see Fig. 1), and the pressure drops of all four biofilters are found to rise in Phase II. Furthermore, the variations in toluene removal rate and pressure drop between the four biofilters can be explained by the variation trend of specific surface areas and void fractions.

Variation of filter bed pressure drop.
Conclusions
The following conclusions can be drawn from the results presented in this study:
1. Inert biomass accumulation cannot be ignored in microbial growth models of biofiltration process, especially in long-term performance simulations. 2. During long-term operation, the active biomass concentration reaches a constant value while the inert biomass concentration continues to increase and becomes dominant in the accumulated biomass. The final active biomass concentration and inert biomass accumulation rate both have a positive correlation with the VOC removal rate and inlet VOC loading. 3. The results of the filter bed structure simulation show that the void fraction is more sensitive to biomass accumulation than is the specific surface area. 4. An ideal biomass control technique should remove most of the inert biomass and preserve as much as possible of the active biomass.
Footnotes
Acknowledgment
This work was supported by the National Environmental Commonweal Foundation of China (Grant Number 200809015).
Author Disclosure Statement
No competing financial interests exist.