
Abstract
Abstract
Many studies have demonstrated that plants have the ability to affect flow velocity, and plant materials have been investigated for their potential to be used as a buffer zone to prevent riverbank erosion. However, relatively few studies have investigated the effects of plant characteristics on flow conditions. In this study, an artificial channel was constructed to (1) investigate the nature of the morphological changes undergone by aquatic Oenanthe javanica DC (water celery) macrophytes in response to different channel flow velocities and (2) identify the tolerance limit of aquatic macrophytes under different flow velocity conditions. Results show that the morphology of Oenanthe javanica DC exhibits the following variations under different flow velocities: as flow velocities increase, growth rate slows and plant shoots become shorter and softer, thereby increasing plant flexibility. These variations were accompanied by a decrease in root length and root anchorage capacity. In response to different flow velocities, a nonlinear relationship in growth rate between total new green leaves and yellow leaves was also observed. The number of vascular bundles in new shoots was found to decrease in a flowing water environment, compared with the number of vascular bundles in terrestrial environments. The average density of vascular bundles, however, was found to increase as flow velocity increased, most likely to provide a compensatory structural support mechanism. Results of this research identified a suitable range of flow velocity for water celery as 0.05–0.30 m s−1, which is approximately equal to the average flow velocity of dredged rivers in Taiwan. Because of its abundant growth in Taiwan and its ability to adapt to the range of velocity conditions found in Taiwan's dredged rivers, water celery was found to be an appropriate planting material for intertidal zones and reservoir bank protection.
Introduction
Submerged plants have also been found to affect flow velocities. Plants can be utilized as buffers to reduce erosion, trap sediment, and remove contaminants by slowing runoff, increasing infiltration, and facilitating contaminant uptake and subsequent transformation (Dabney et al., 2006; Wynn and Mostaghimi, 2006). Riparian vegetation has both mechanical and hydrological effects on streambank stability; some of its effects improve bank stability and others reduce bank stability; the latter results in an increase in the flood stage (Simon and Collison, 2002; Rhee et al., 2008). In open-channel hydraulics, aquatic plants typically cause changes in flow resistance as well as changes in the retardance coefficient (Rhee et al., 2008; Chen et al., 2009) by anchoring their roots into channel soil to support the aboveground portion of a plant (Greenway, 1987). Variation in root type (root depth and density) can also affect channel erosion (Anderson et al., 2004).
Relatively few field-monitoring studies have verified the effects of vegetation on channel and flow velocities or investigated the morphological adaptation of plants to flow conditions (Watson, 1987; Asaeda et al., 2005; Green, 2005). Moreover, few studies have tested the tolerance limit of aquatic macrophytes under different flow velocities, examined aquatic macrophytes' modification of their physical characteristics to adapt to flow velocities, or investigated the effects of those changes on channel flows.
The present study utilizes an artificial channel to assess the ability of aquatic macrophytes to resist various flow velocities. The primary aim of this study was to determine whether local aquatic macrophytes are suitable for riverbank protection projects by examining how they respond to different channel flow velocities, which is measured by observed changes in their form and structure. Additional goals were to determine the growth rate and biomass of the macrophytes, morphological variations in their stems and roots, their tolerance limits, and their erosion resistance response under various flow velocities. The final purpose of this study was to determine aquatic macrophytes' range of application in ecological engineering and design.
Materials and Methods
Simulated plant environment selection
Natural riverbanks can be classified by environment, topography, and slope, all of which affect flow rate. Taiwan has three different flow environments for aquatic macrophytes: rapid flow, moderate flow, and slow flow.
Rapid flow: Slope exceeds 4%; only a few emerging plants can survive in this flow, which is always found in upstream sections.
Moderate flow: Slope is 2%–4%; this environment, which is suitable for emerging plants, can be seen in all midstream sections and some upstream sections of Taiwan's western rivers.
Slow flow: Slope is <2%; this environment, which is suitable for most aquatic macrophytes, can be found in all downstream sections of Taiwan's western rivers (EPA, 1995; WRA, 2008).
Tatun Creek was chosen as the channel for this experiment, because it was dredged using ecological engineering methods and was well populated with plants at 2 years after its construction. The average slope of Tatun Creek is <2%; thus, it represents a typical slow flow environment suitable for most aquatic macrophytes. Culture media used in this experiment were also extracted from Tatun Creek. The site chosen for soil collection was covered with native plants such as Miscanthus floridulus (Labill.) Warb. ex Schum (Japanese silvergrass) and invasive species such as Bidens pilosa. Dragonfly nymphs were also found under gravel in the river.
The results of grain size analysis indicate that 90% of particles were >0.15 mm in diameter and their silt content was less than 15%. According to the soil texture classification method of the United States Department of Agriculture, the texture of culture media from Tatun Creek was of the “sandy type,” which has an exceptionally low water-holding capacity and also the same texture as the soil typically found in Taiwan's rivers.
Artificial channel construction
Factors affecting flow resistance include the size and structural characteristics of plants, their location in a channel, and local flow conditions (Green, 2005). Channel structure and hydrology also contribute to setting flow velocity. For the purpose of this study, an artificial channel was designed to incorporate all of the factors listed above. Artificial double channels (200 cm long, 30 cm wide, and 40 cm deep) were constructed of 1-cm-thick transparent acrylic panels. The channels' other components consisted of two adjustable water pumps, four planters, and two 200-L water tanks. The planters were made of 1-cm-thick wooden panels (90 cm long, 29 cm wide, and 5 cm deep). Lighting was supplied by four 40-watt plant lights, each 100 cm long, which were illuminated from 06:30 to 17:30, with an average luminance of 843 Lux. A control group and experimental group were subjected to the same environmental conditions with variation in flow rates (Fig. 1). All experiments were conducted at room temperature.
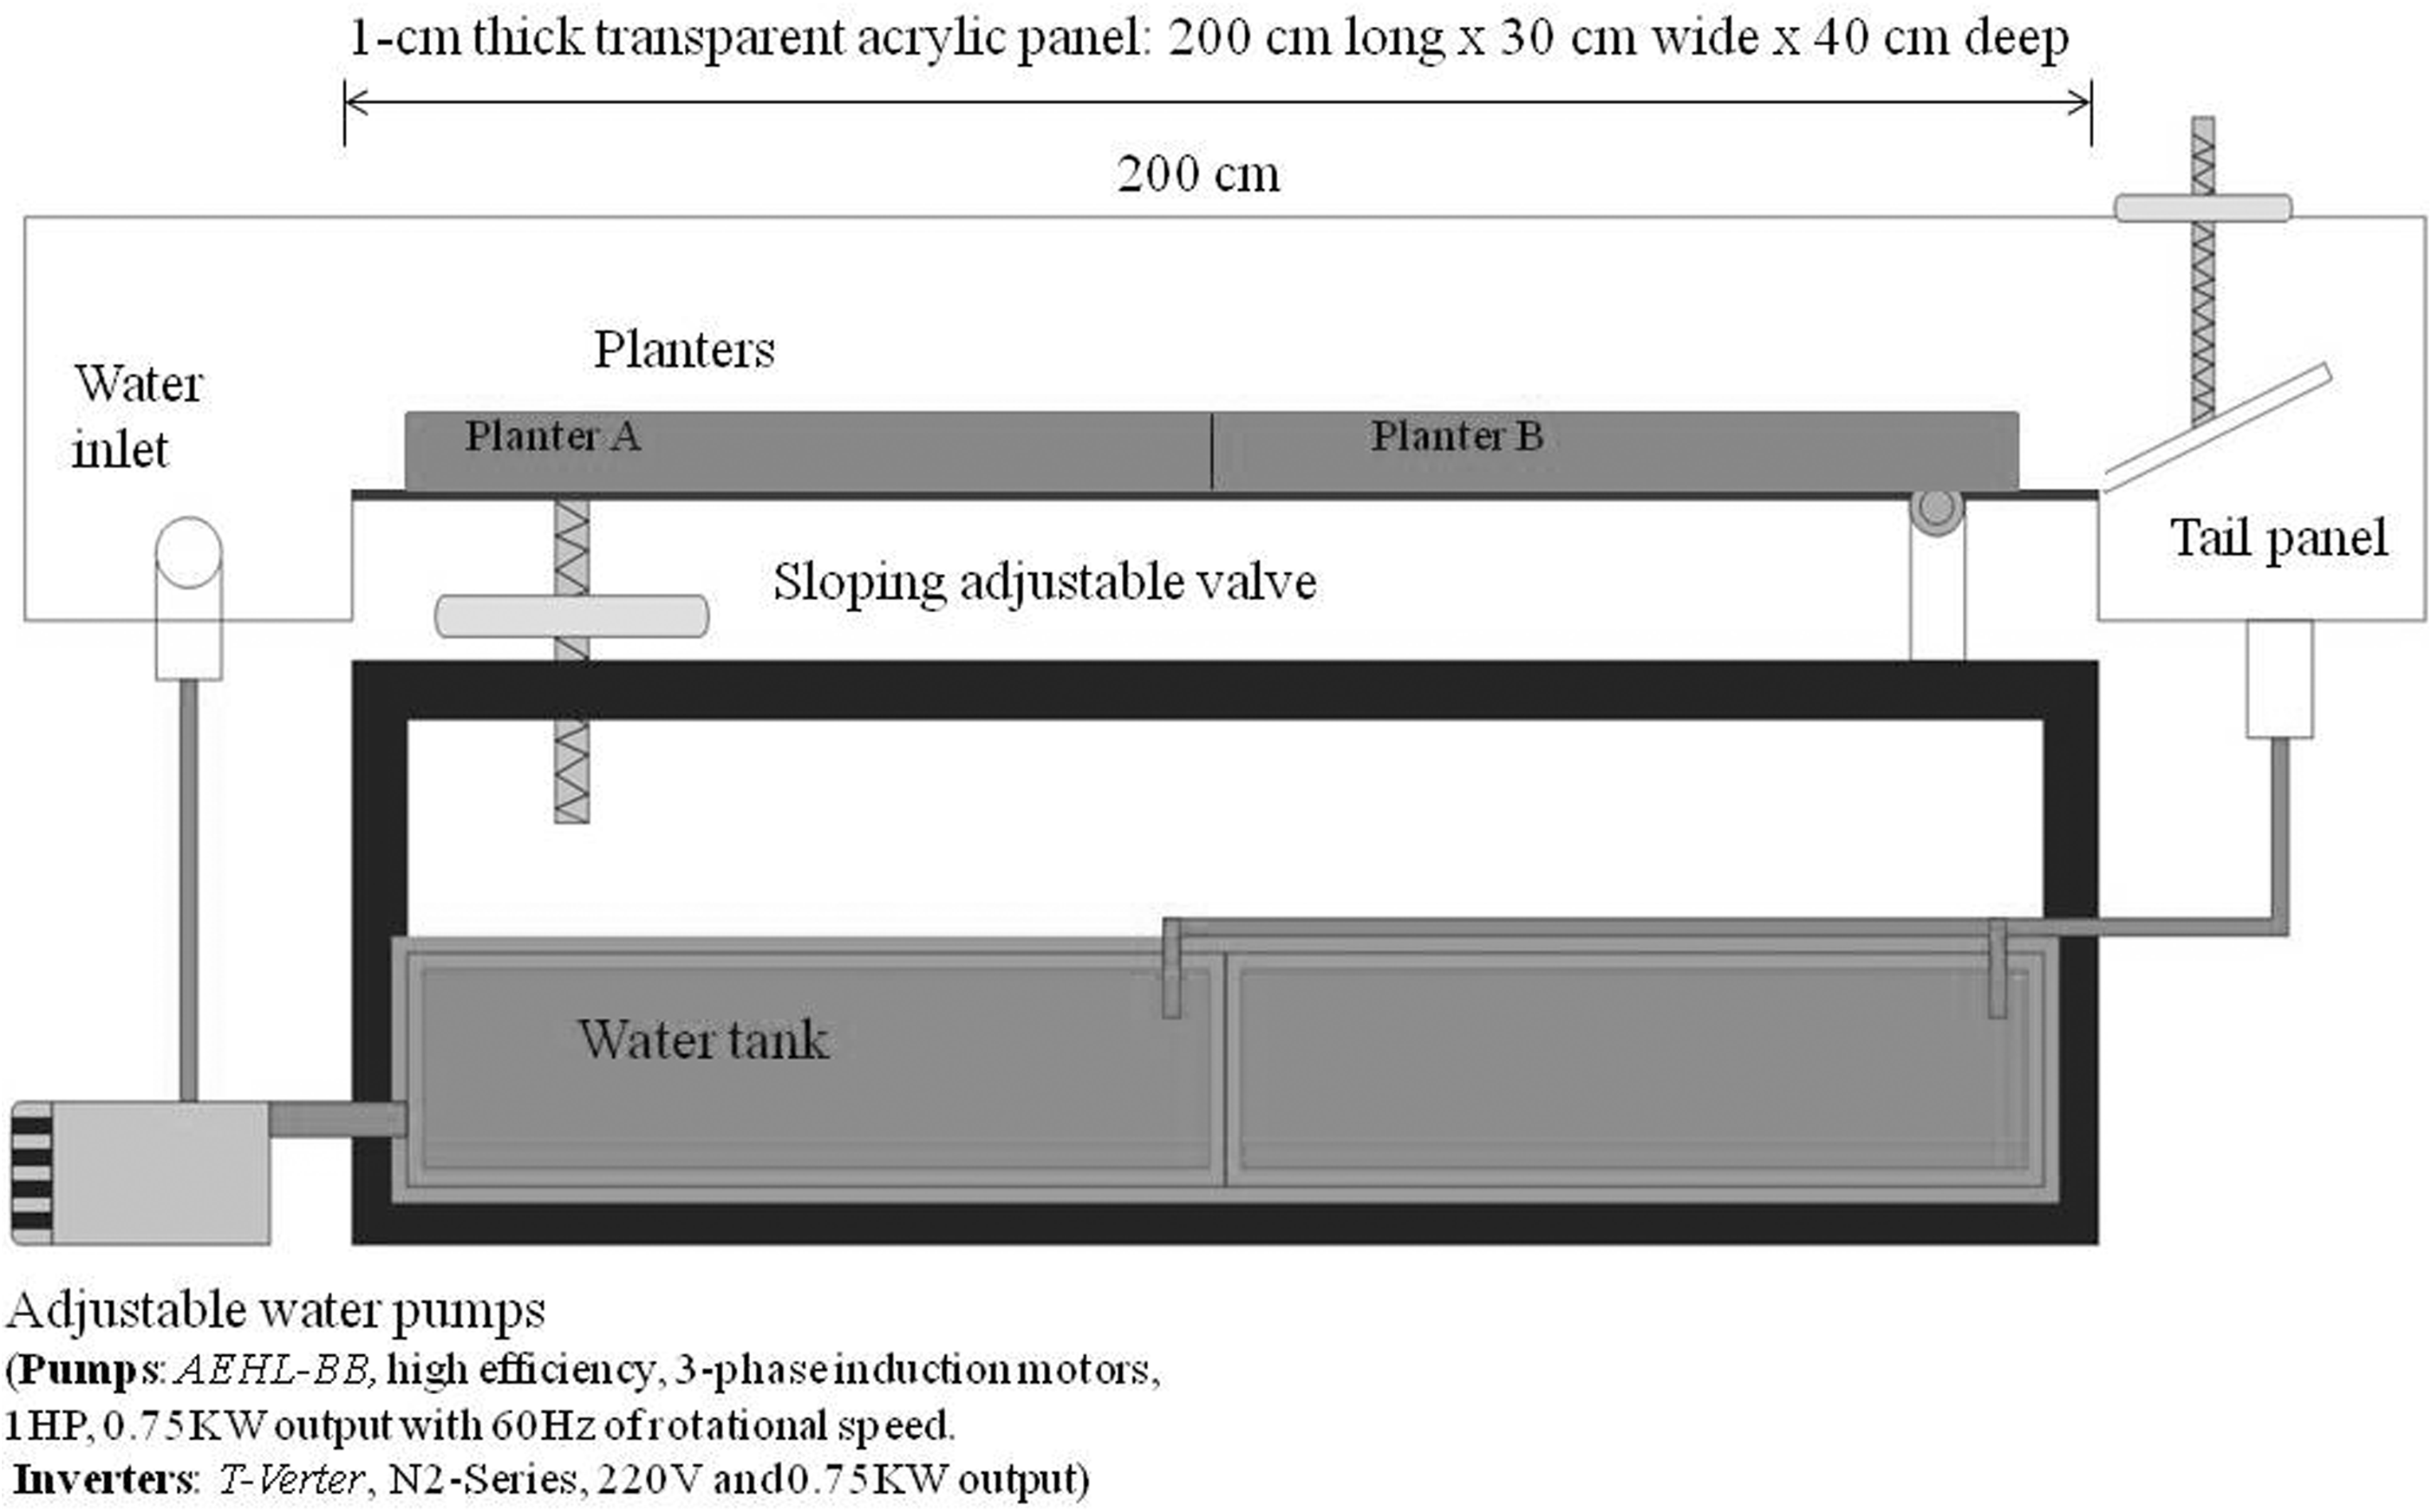
Layout of an artificial channel.
The main factors contributing to total channel resistance, according to the Cowan equation, are channel materials, surface irregularities, variations in the channel cross-section, obstructions, vegetation, and channel meandering (Green, 2005). The Manning's roughness coefficient in this experiment is between 0.025 and 0.054.
Choice of plant species
Differences in plant structure, such as stem and leaf morphology, have been demonstrated to affect flow rate (Sculthorpe, 1967; Sand-Jensen, 2003). Plant materials chosen for this study were required to meet the following criteria:
Plant species must be native aquatic macrophytes or domestic species that pose no threat to native species.
Plants must be shorter than 30 cm in height (the acrylic channel was 30 cm in height).
Plants must be easy to cultivate.
Plants must be perennial herbs with thread-like rootlets, whose growth rate is easy to compare and whose soil stability is easy to assess.
Plants must exhibit widespread growth in Taiwan.
Plants must have a short lifecycle.
Oenanthe javanica (Blume) DC (water celery) was selected because it grows in ditches, ponds, paddy fields, and other wet locations at low-to-medium altitudes all over Taiwan. It also fulfills all of the other conditions for species choice (Huang et al., 1998).
Experimental procedure
Three experimental trials were completed between November 2006 and August 2008. A total of 48 water celery plants were planted 6 cm apart in each of the four planters. All flow rates were controlled via the rotational speed of adjustable water pumps. At the beginning of the experimental trial period, the flow rates of both groups were nearly the same. Subsequently, the rotational speed of the water pump in the control group was kept constant, but the rotational speed of the water pump in the experimental group was increased by increments of 0.2–2.0 Hz once every 4 weeks (Table 1). Variation of rotational speeds was introduced to investigate the flow resistance adaptation of water celery over a range of flow rates. All three experiments were conducted over an 18-week period and were terminated when the difference in survival rate between the two groups exceeded 10%.
An initial experiment was conducted to identify the flow velocity tolerance limit of water celery to assess its compatibility with average flow velocities of dredged rivers in Taiwan, which are 0.02–0.60 m s−1 (Dago Stream, 0.05–0.13 ms−1; Fungaue River, 0.02–0.52 m s−1) (Lin, 2003; Lin et al., 2005),
Step I
For the control group and the experimental group, the following measurements were obtained: culture media properties, plant weights, root lengths, channel slope, water depths, flow velocities, water qualities, pH values, and lighting duration. Water celery plants took 3–4 weeks to establish stability in the planters, so channel flow velocities were kept constant during the first 4 weeks for both the control and experimental groups and increased thereafter for the experimental group once every 4 weeks.
Step II
The number of green leaves, yellow leaves, horizontal leaves, epicormic shoots, and stolon shoots was recorded every week. Additionally, height, root length, diameter, fresh weight, and total dry weight measurements were recorded for each plant after harvesting.
Step III
Original stems and green leaves were harvested from the plants in Experiment III-1, and only new shoots were left uncut at week 13. The purpose of Step III was to observe the difference in morphology between new shoots and original terrestrial shoots.
Plant tissue sectioning
Paraffin method
After harvesting, the plant material was analyzed for vascular bundles using the paraffin method, a slicing technique for preserving fresh plant tissue. Plant sections were obtained to compare physical anatomical changes in the structure of water celery plants under different flow velocity conditions. The paraffin method procedure is outlined below:
Fixation → dehydration → infiltration of paraffin → embedding → slicing with rotary microtome → adhesion on slide → drying out → staining → mounting with Entellen (Tsai, 2000).
Freehand sectioning
Freehand sectioning, the simplest slicing technique for observing fresh plant tissue, was employed as the second analytical method. The thickest stem was chosen for each water celery plant and then fresh stems were sectioned and temporarily fixed with 5 mL formalin, 5 mL glacial acetic acid, and 90 mL of 50%–70% alcohol (FAA) (Tsai, 2000). The resulting sections were analyzed, and the number of vascular bundles in each section was recorded.
Results and Discussion
Each experiment was conducted over a period of 18–40 weeks. In Experiment I, 20 weeks after planting, the survival rate of the experimental group declined to 75%, whereas the survival rate of the control group was 95%. Suitable flow velocities were estimated to be 0.05–0.30 m s−1.
By the second week of Experiment II, >80% of shoots had been eaten by Spodoptera litura Fabicius. After application of a pesticide, new shoots sprouted during week 5.
Growth rate variation under different flow velocity conditions
At the start of Experiment I, the total number of green leaves in the control group (planters A and B) was only 2.8% less than the number of green leaves in the experimental group (planters C and D). When flow velocity was increased to 0.30 m s−1, the total number of leaves in the experimental group increased continuously, and the plant growth rate was higher than that of the control group. However, when flow velocity was increased to 0.35 m s−1 in the experimental group, the total number of new green leaves that sprouted after planting began to decline, whereas the number of yellow leaves increased and remained higher than the number of yellow leaves in the control group. After harvesting, the total number of yellow leaves in the experimental group was 35.1% higher than in the control group (Table 2). When flow velocity was fixed for the control group, the difference between the total number of green and yellow leaves in planters A and B continued to increase (Fig. 2). When flow velocity was increased once every 4 weeks in the experimental group, the difference between the total number of green and yellow leaves in planters C and D began to decrease at velocities exceeding 0.30 m s−1 (Fig. 3). These results indicate that suitable flow velocities for water celery are in the range of 0.05–0.30 m s−1.
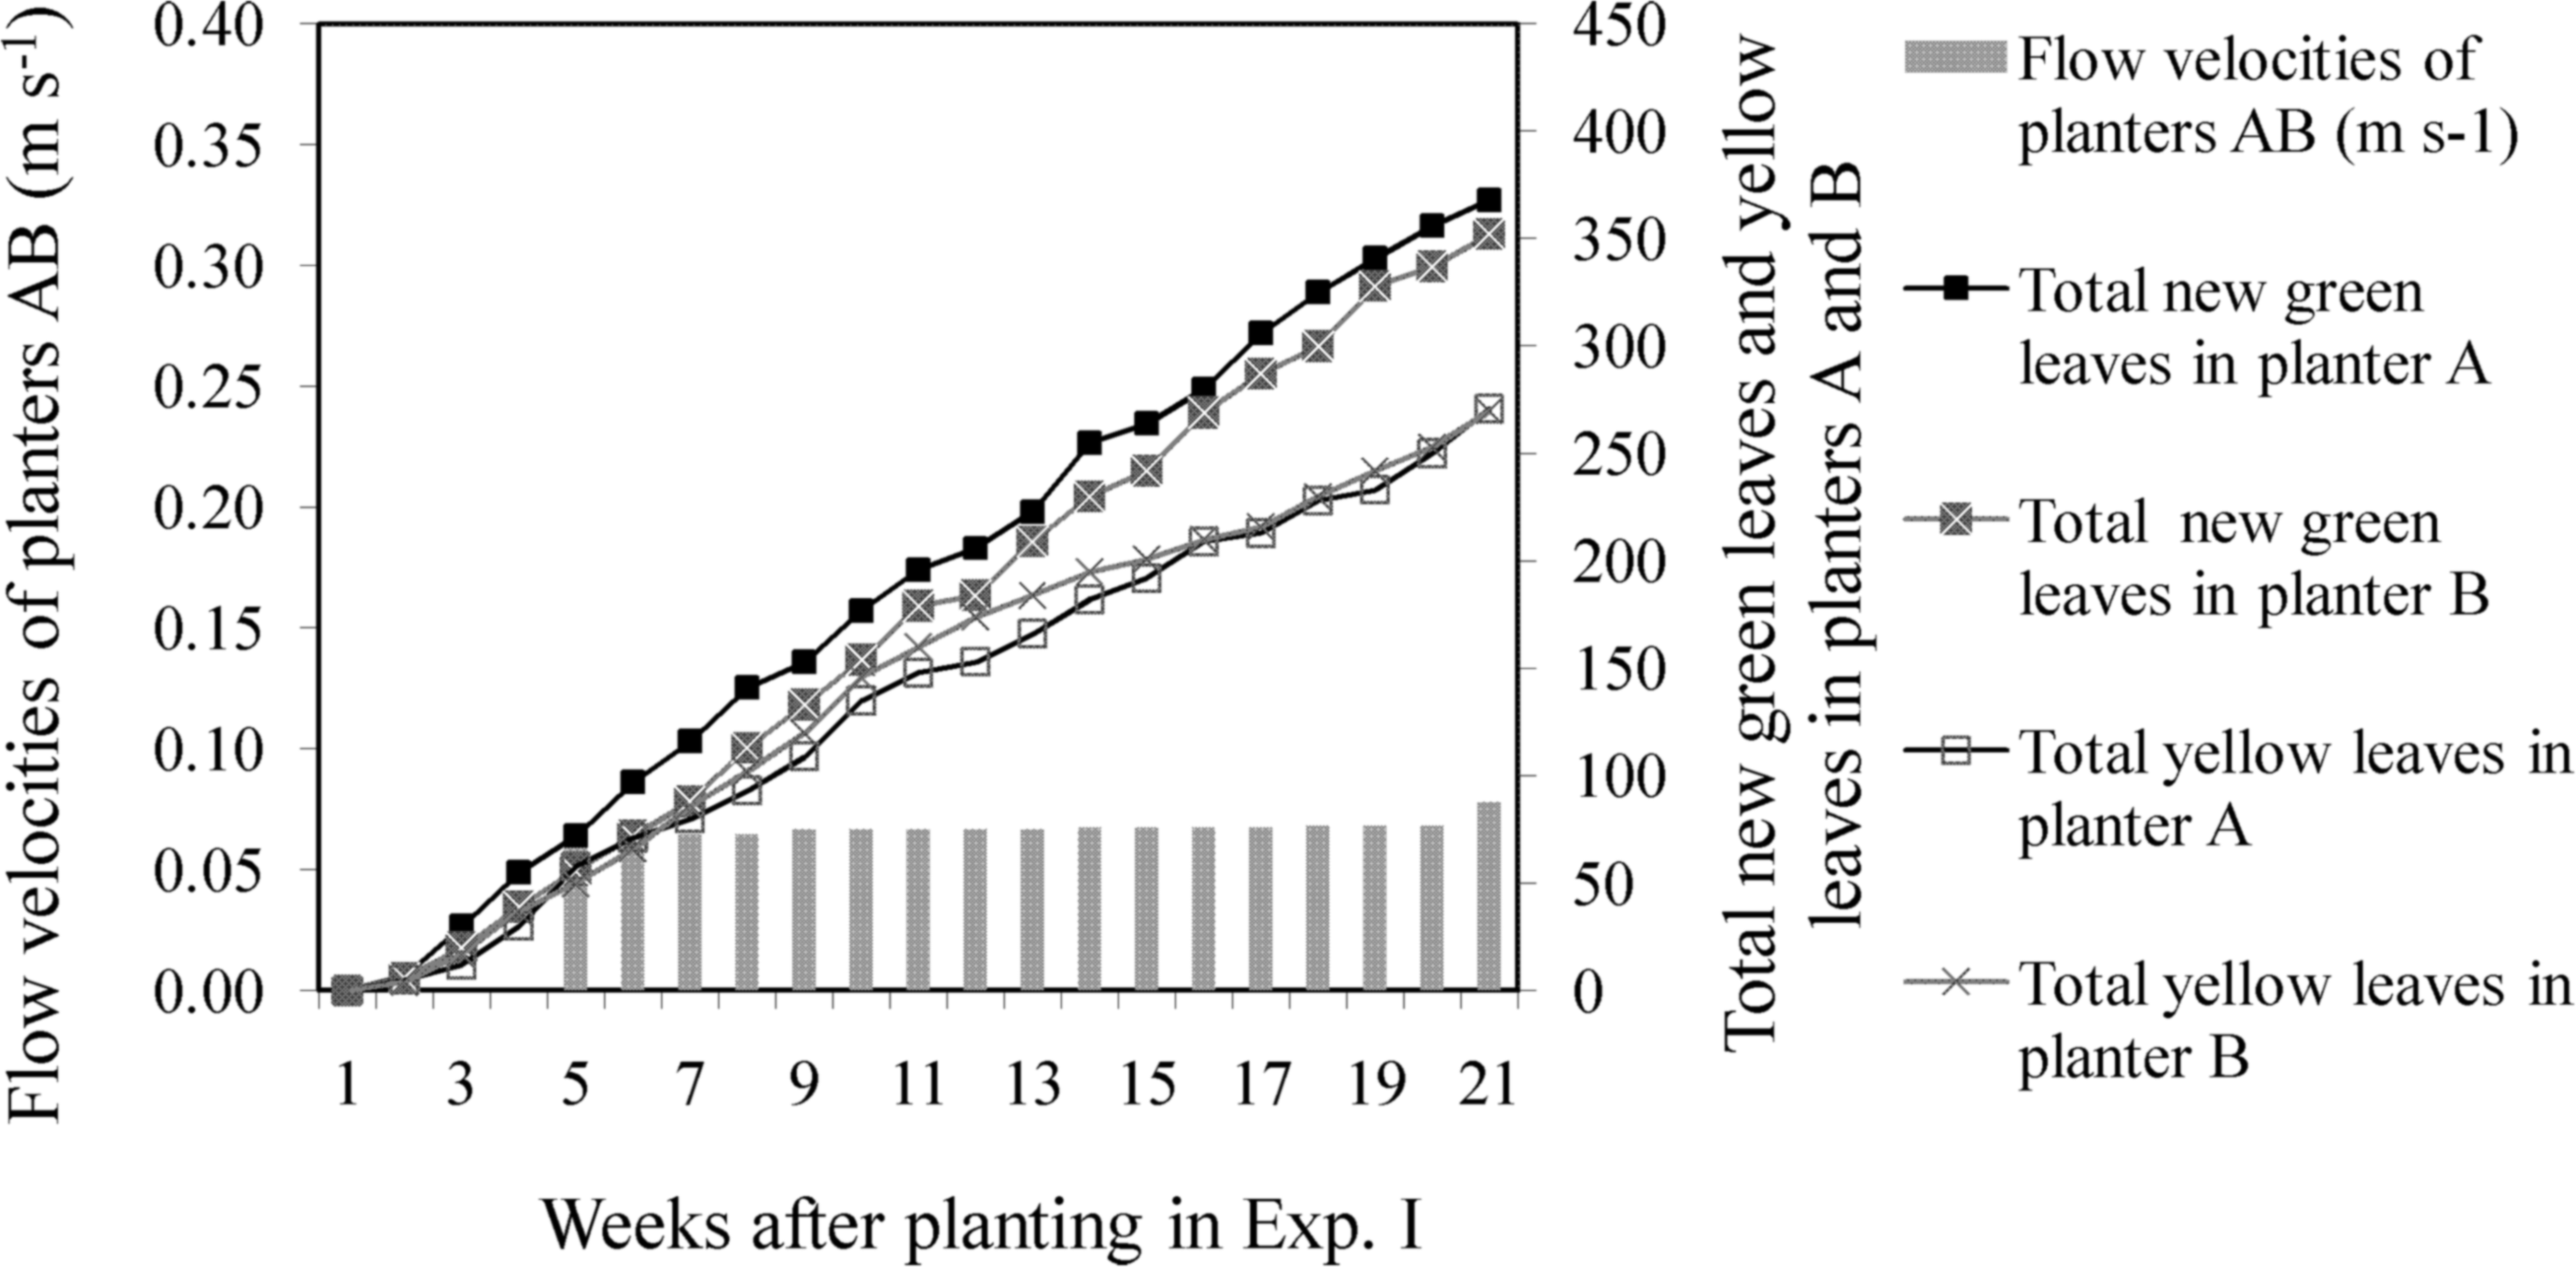
Difference between total new green leaves and yellow leaves in the control group of planters A and B for Experiment I: When flow velocity was controlled under 0.08 m s−1, difference between total green/yellow leaves of planters A and B continued increasing. Total number of new green leaves was the total new leaves that sprouted after planting.
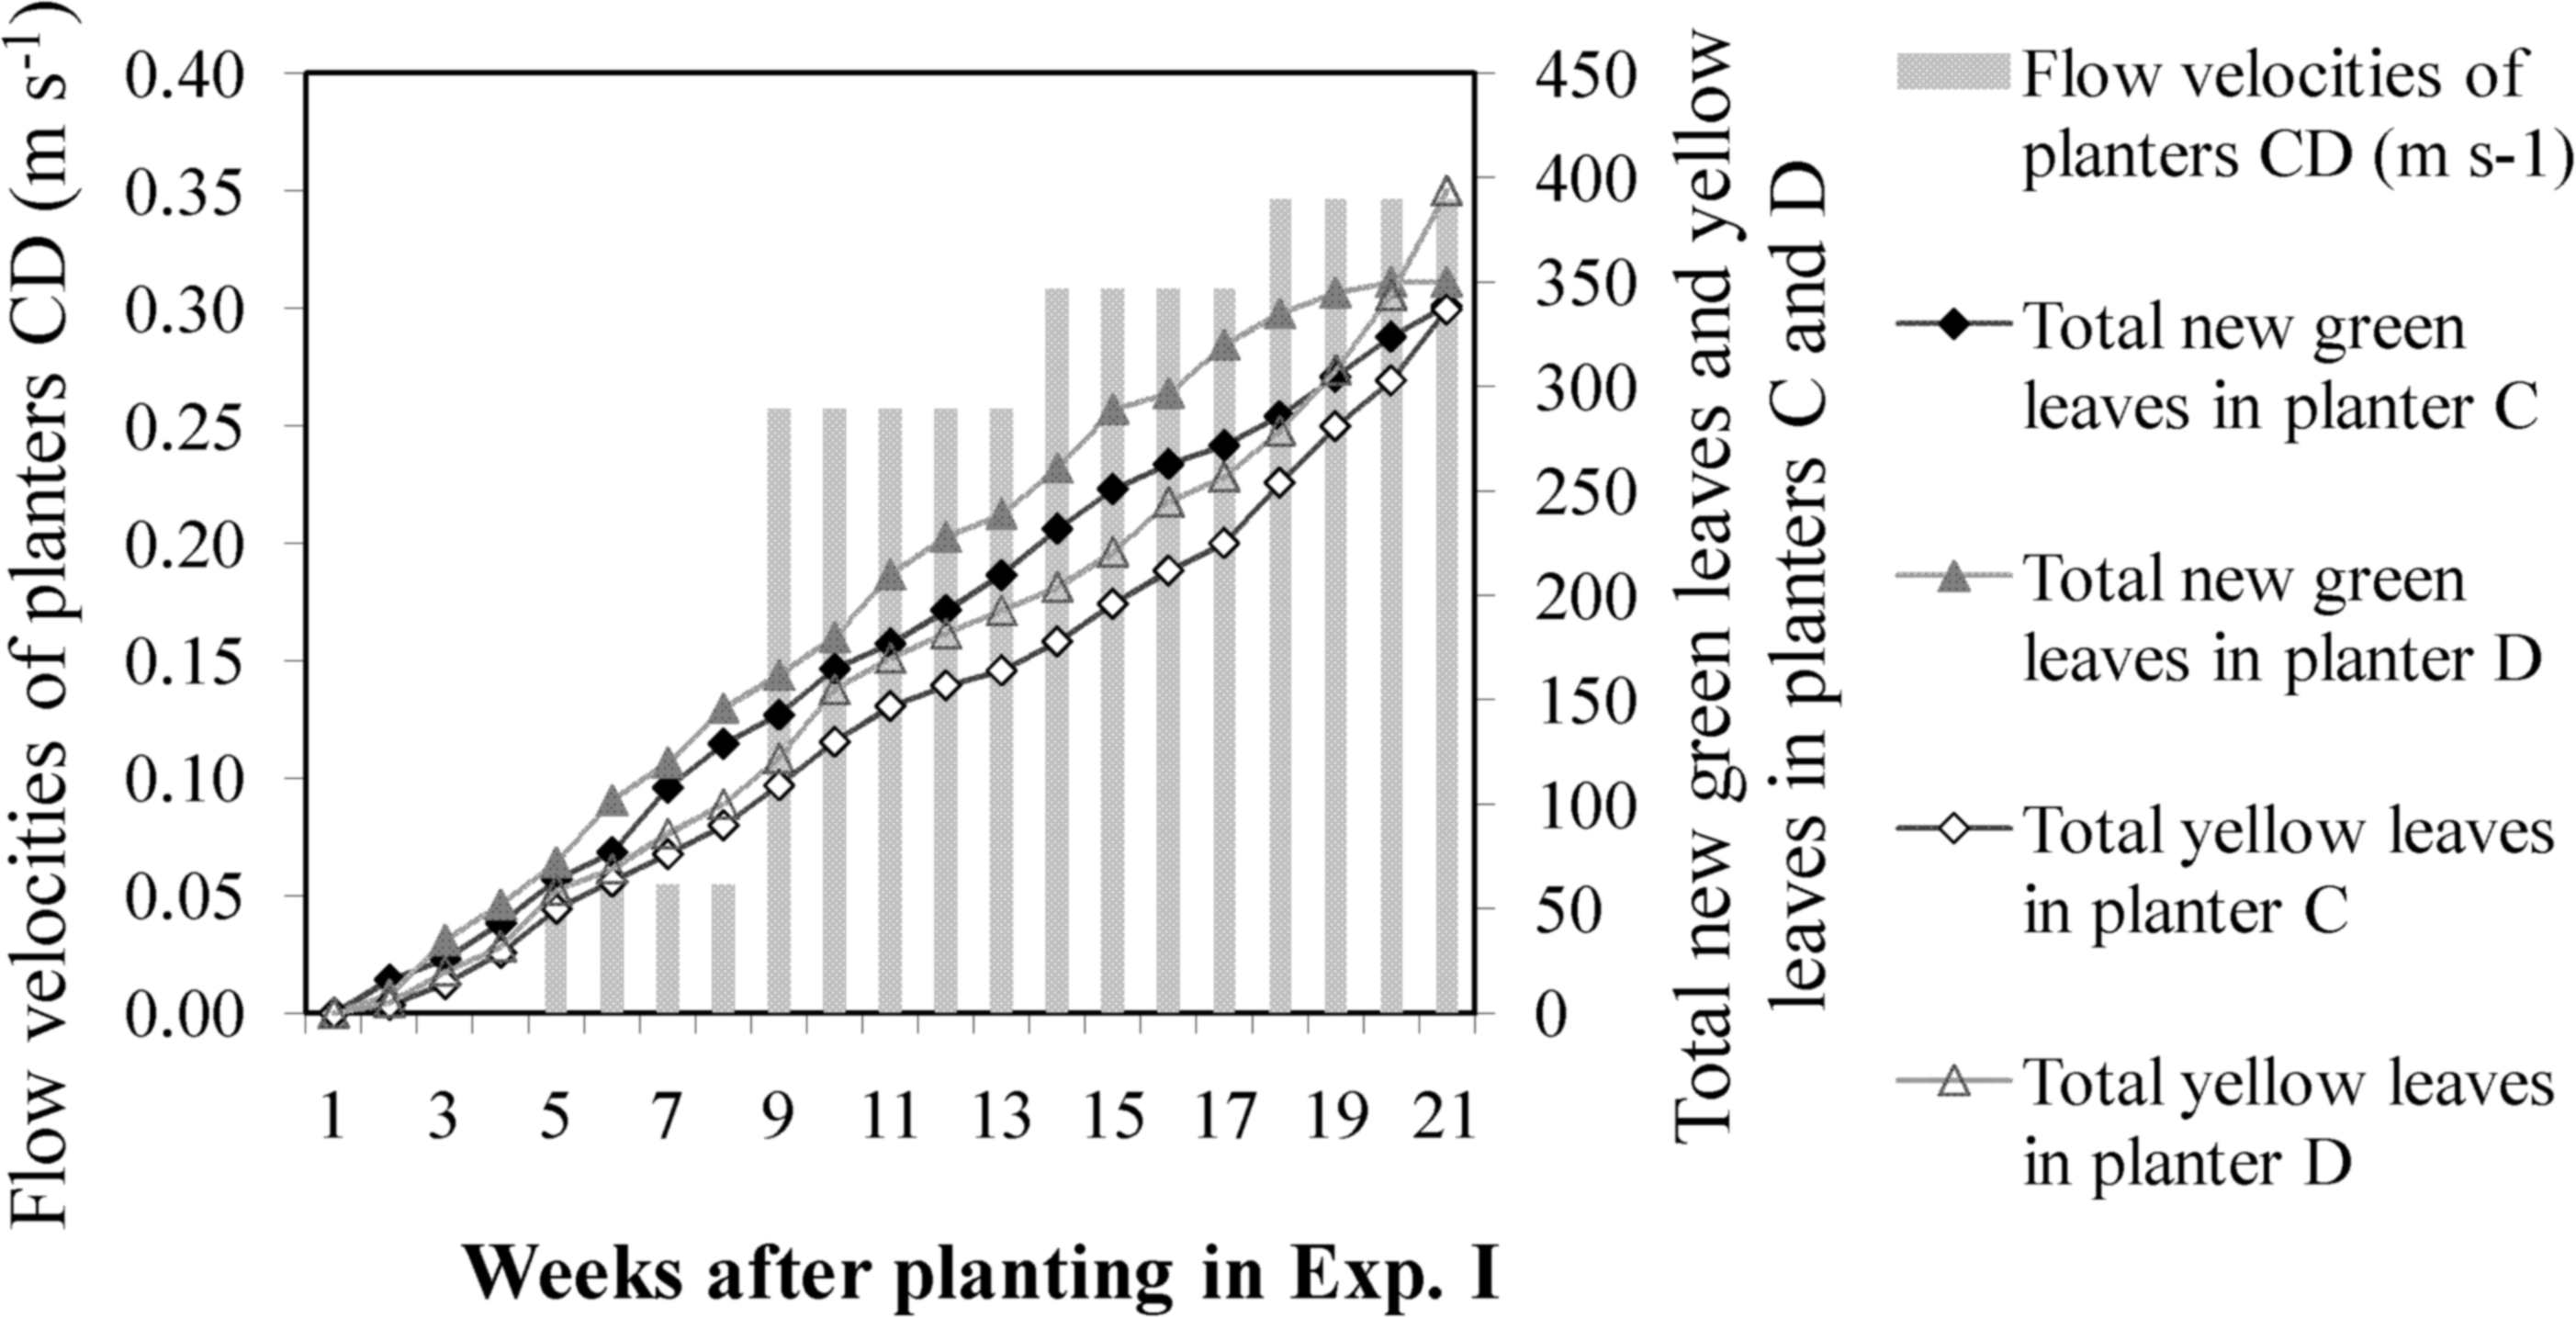
Difference between total new green leaves and yellow leaves in experimental group of planters C and D for Experiment I: When flow velocity was adjusted higher every 4 weeks in experimental group, difference between the total green/yellow leaves of planters C and D decreased when the velocity exceeded 0.30 m s−1.
Experiment I: Flow velocities were 0.06–0.08 m s−1 in planter AB and 0.05–0.35 m s−1 in planter CD. Experiment II: Flow velocities were 0.05–0.06 m s−1 in planter AB and 0.08–0.10 m s−1 in planter CD. Experiment III-1: Flow velocities were 0.10–0.11 m s−1 in planter AB and 0.10–0.17 m s−1 in planter CD. Experiment III-2: Flow velocities were 0.10–0.13 m s−1 in planter AB and 0.17–0.24 m s−1 in planter CD.
In Experiments II and III, the difference between the total number of new green leaves and yellow leaves not only in planters C and D but also in A and B continued to increase, because flow velocities in the experimental groups were kept under the endurable limit. Growth rates in planters C and D remained lower than those in the control groups, and the total number of new green leaves in the control groups was higher than in the experimental groups. All three results indicate that flow velocities affect the growth rate of water celery.
Biomass variation under different flow velocity conditions
At the start of Experiment I, the total fresh weight of plants in the control and experimental groups was 120.26 and 131.36 g, respectively. At week 20, the total fresh weight of plants in the control group was 148.70 and 80.03 g in the experimental group; thus, the total fresh weight of plants in the experimental group comprised only 53.8% of the control group weight. After harvesting and drying for 26 h at 100°C, the dry weight of plants in the control group was 13.42 and 5.82 g in the experimental group (Table 3).
In Experiments II and III, no distinct differences were found in biomass between the two groups at flow velocities of <0.17 m s−1. After harvesting, both the fresh and dry weights of plants in the experimental group were lower than those in the control group (Table 3). All three experiments demonstrate variation of biomass under different flow velocities.
Growth rate and biomass reduction results are consistent with the results obtained in previous studies of plants exposed to increasing flow or waves; the plants generally present growth modifications and morphological changes such as height and density reduction as well as a decrease in biomass production (Idestam-Almquist and Kautsky, 1995; Coops and Van der Velde, 1996; Puijalon and Bornette, 2004; Puijalon et al., 2005).
Morphological variation under different flow velocity conditions
Mechanical constraints limit plant survival and growth in environments with flowing water, because hydraulic force generally dislodges or breaks plants (Schutten and Davy, 2000). A flowing water environment can also trigger morphological adaptations; for example, some species, such as Eichhornia crassipes and Pistia stratiotes, develop a rosette of small, stiff leaves from a short stem, which can resist strong drag and accelerational forces on wave-exposed lakeshores. Other species, such as Vallisneria natans and Sparganium, develop a streamlined morphology of long linear leaves or stems in response to higher flow velocities (Sculthorpe, 1967; Sand-Jensen, 2003). Most species develop very flexible shoots, which allows them to bend and twist in flowing water, and reduces the surface area directly exposed to current flow (Koehl, 1984; Sand-Jensen, 2003).
In Experiments I and II, average plant height after harvesting in the experimental groups was less than in the control groups. For the fast flow velocity condition in Experiment I, average plant height in the experimental group was 54.3% of the control group plant height. The average diameter of stems in the experimental group was 84% of the control group diameter (Table 3).
Experiment II results show the plant height to be inversely related to flow velocity. The difference between the two groups was only 11% in Experiment II (not as large as in Experiment I), and the average length of roots in the experimental group was 73.8% of the average control group length (Table 3).
The results of Experiment III were similar to those of Experiment I: as flow velocities for the experimental group had been increased gradually to just under 0.24 m s−1, a rate that does not exceed the endurable limit, no distinct differences were found between the two groups with respect to epicormic shoots or dwarfish shoots. However, the average plant height in the control group was 6.5% lower than in the experimental group, a finding that is not consistent with the results of Experiments I and II (Table 3). Comparison of the final average plant height with the average plant height at the start of the experiments shows that average heights were lower after the experiment for both groups. However, average root lengths in the experimental groups were shorter than root lengths in the control groups, which is consistent with the results of Experiment II (Table 3).
All three experiments show that water celery plants decrease their height and root length under high flow velocity conditions. After harvesting, the ratio of plant height to root length in the experimental group was higher than in the control group (Table 4). Flow velocity hindered the overall growth rate of the water celery plants, which affected the plant root length considerably more than the plant height. It was also found that a decrease in the plant root length reduces the use of root anchorage as a mechanism for creating a more favorable propagation environment. Similar results were obtained by Puijalon et al. (2005); aquatic plant species were found to undergo morphological changes, which decreased their anchorage strength, thereby increasing their spreading ability in high flow velocity conditions (Puijalon et al., 2005).
The results presented above demonstrate variation in the morphological characteristics of aquatic macrophytes, such as plant height and root length, under different flow velocity conditions. Water celery avoids mechanical stresses under drag forces at high flow velocities by reducing height and diameter, thereby forming relatively softer and more flexible shoots. This is consistent with the results of previous studies of macrophytic freshwater plants, in which they were found to morphologically adapt to prevent mechanical damage and uprooting when exposed to substantial drag forces in flowing water (Coops and Van der Velde, 1996; Sand-Jensen, 2003). In contrast, differences in the number of epicormic and dwarfish shoots between the control and experimental groups were not as obvious, because flow velocities had been increased incrementally.
Change in plant tissue sections under different flow velocity conditions
Section analyses show that the average height of new shoots in experimental specimens was lower than that of terrestrial plants and that experimental specimens contained fewer vascular bundles than terrestrial water celery. Terrestrial water celery also presented larger stem diameters and more vascular bundles than water celery that had been planted in water (terrestrial specimens, >5 vascular bundles; water specimens, <5 vascular bundles) (Fig. 4).

Comparison of plant tissue sections from terrestrial and water-planted water celery: Terrestrial water celery had larger diameter and more vascular bundles than that of water-planted water celery.
Greater stem thickness in the control groups than in the experimental groups was also observed (Fig. 5). However, data analysis shows that, although average diameter and stem thickness decreased as flow velocity increased, the average ratio of vascular bundles to square millimeter of stem sectional area increased as flow velocity increased (Fig. 6), most likely as a compensatory structural support mechanism. The water celery plants adapted to changing conditions in the flowing water environments via alterations in stem thickness and vascular bundle density.
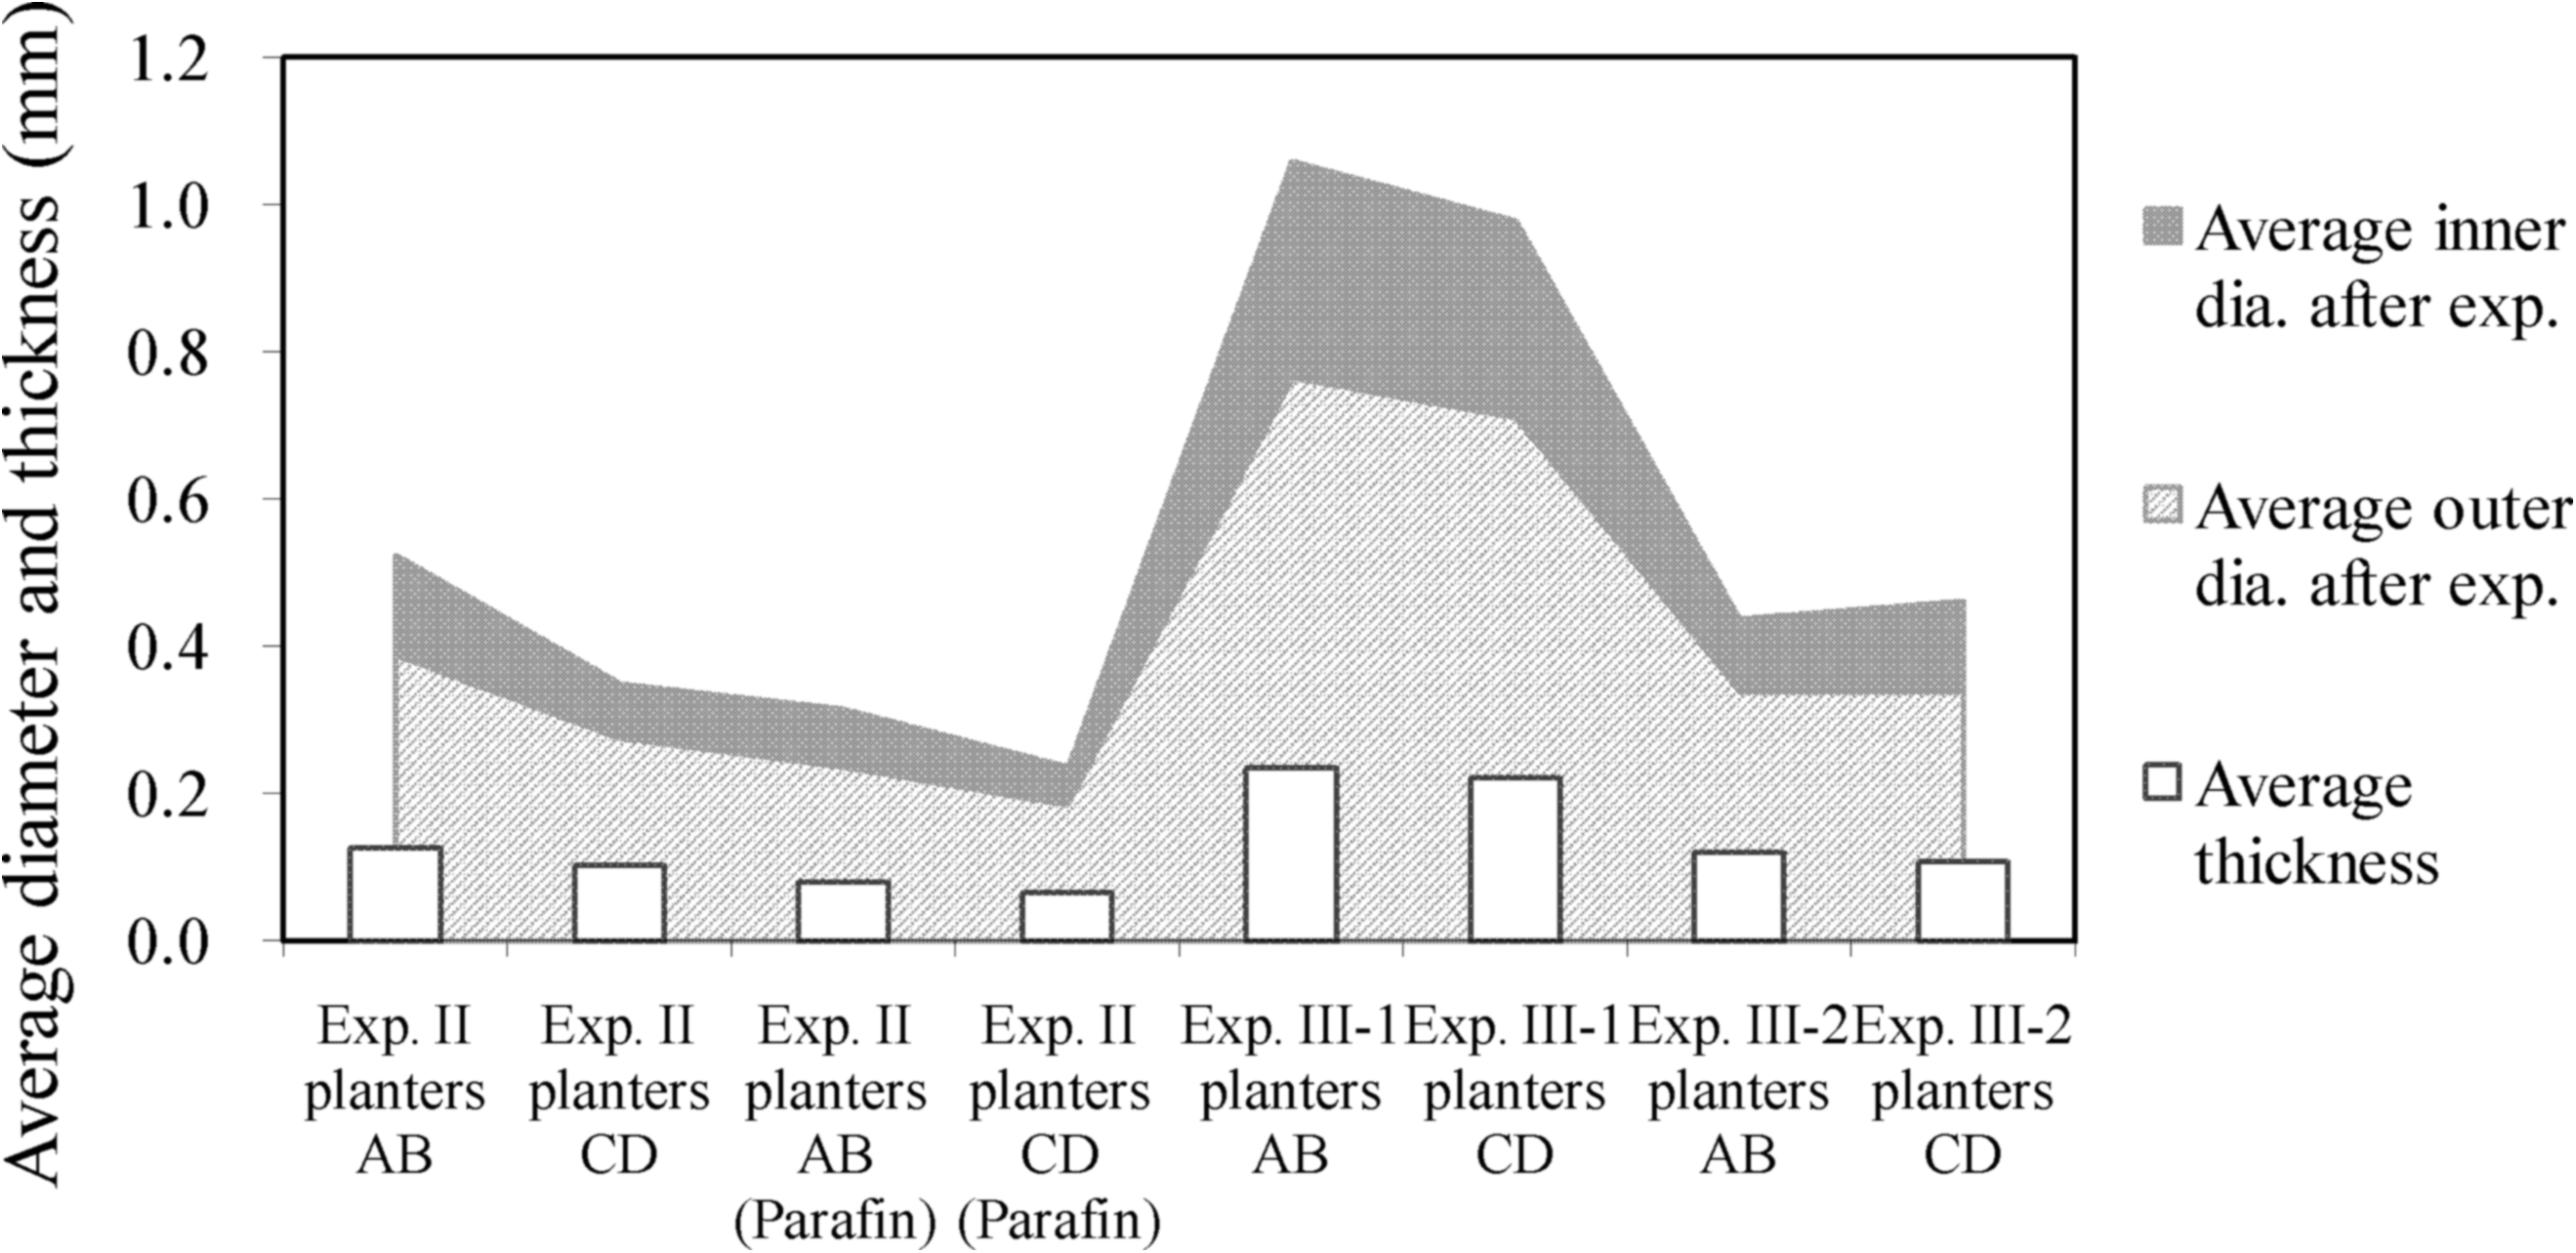
Plant section variations in the three experiments: Stem thickness was thicker for the control groups than for the experimental groups.
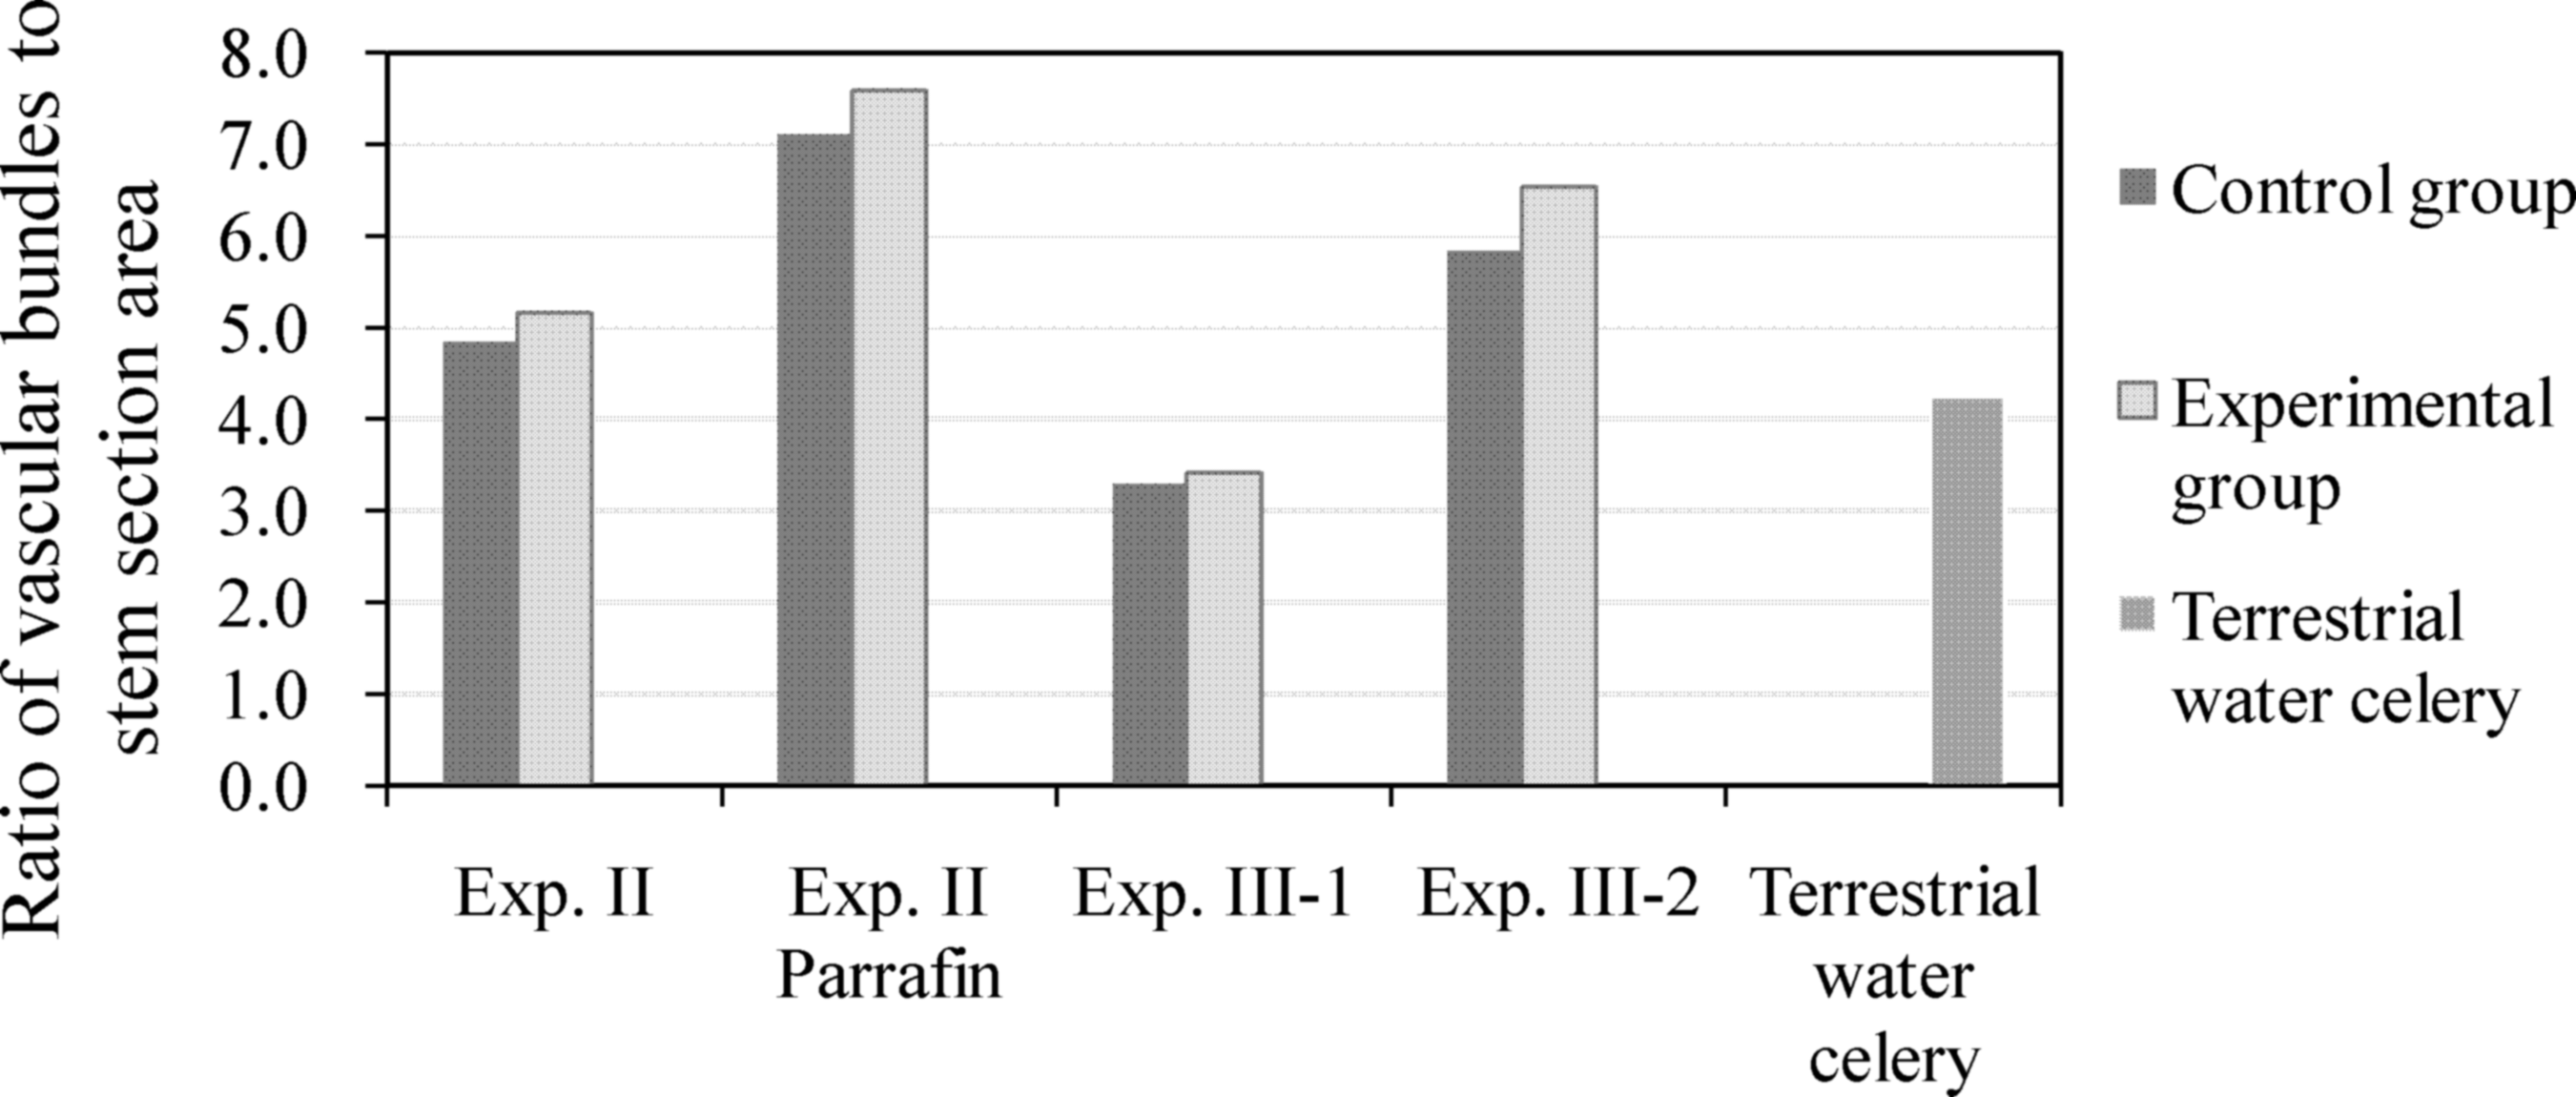
Ratio of vascular bundles to stem section area: Average ratio of vascular bundles to square millimeter of stem section area increased as flow velocity increased.
Formation of algal mats to protect topsoil
During the three experiments, algal mats, including Anabaena azollae, Oscillatoria Formosa Bory, and Navicula sp., began to form at week 6 after planting. In Experiment III, Chroococcus sp. grew in the control group planters A and B at week 24 after planting, in which the flow rate had been controlled at 0.10–0.13 m s−1. This kind of algal mat forms in high-temperature environments with low oxygen levels. All of the algal mats mentioned protect topsoil, especially from silt erosion. The water celery in planters provided algal mats with an opportunity to attach without being flushed away by flowing water. In this study, algal mats formed more slowly in the experimental group than in the control group. When plants died or were exposed to high flow velocities, the attached algal mats broke away, reducing topsoil protection.
Tolerance limit of water celery to flow velocities
The three experimental trials also served to determine the flow velocity tolerance limit of water celery. In Experiment I, the number of green leaves in the experimental group increased at flow velocities of <0.30 m s−1, and growth rate declined after flow rate had been increased to >0.30 m s−1. Survival rate decreased to <75% at a flow velocity of 0.35 m s−1. Calculation of the total number of green and yellow leaves in planters C and D at various flow velocities showed that the difference between the number of green and yellow leaves decreased when velocity exceeded 0.30 m s−1. The total number of new green leaves and yellow leaves in the experimental group also displayed a nonlinear relationship over a range of flow velocities (Fig. 7).
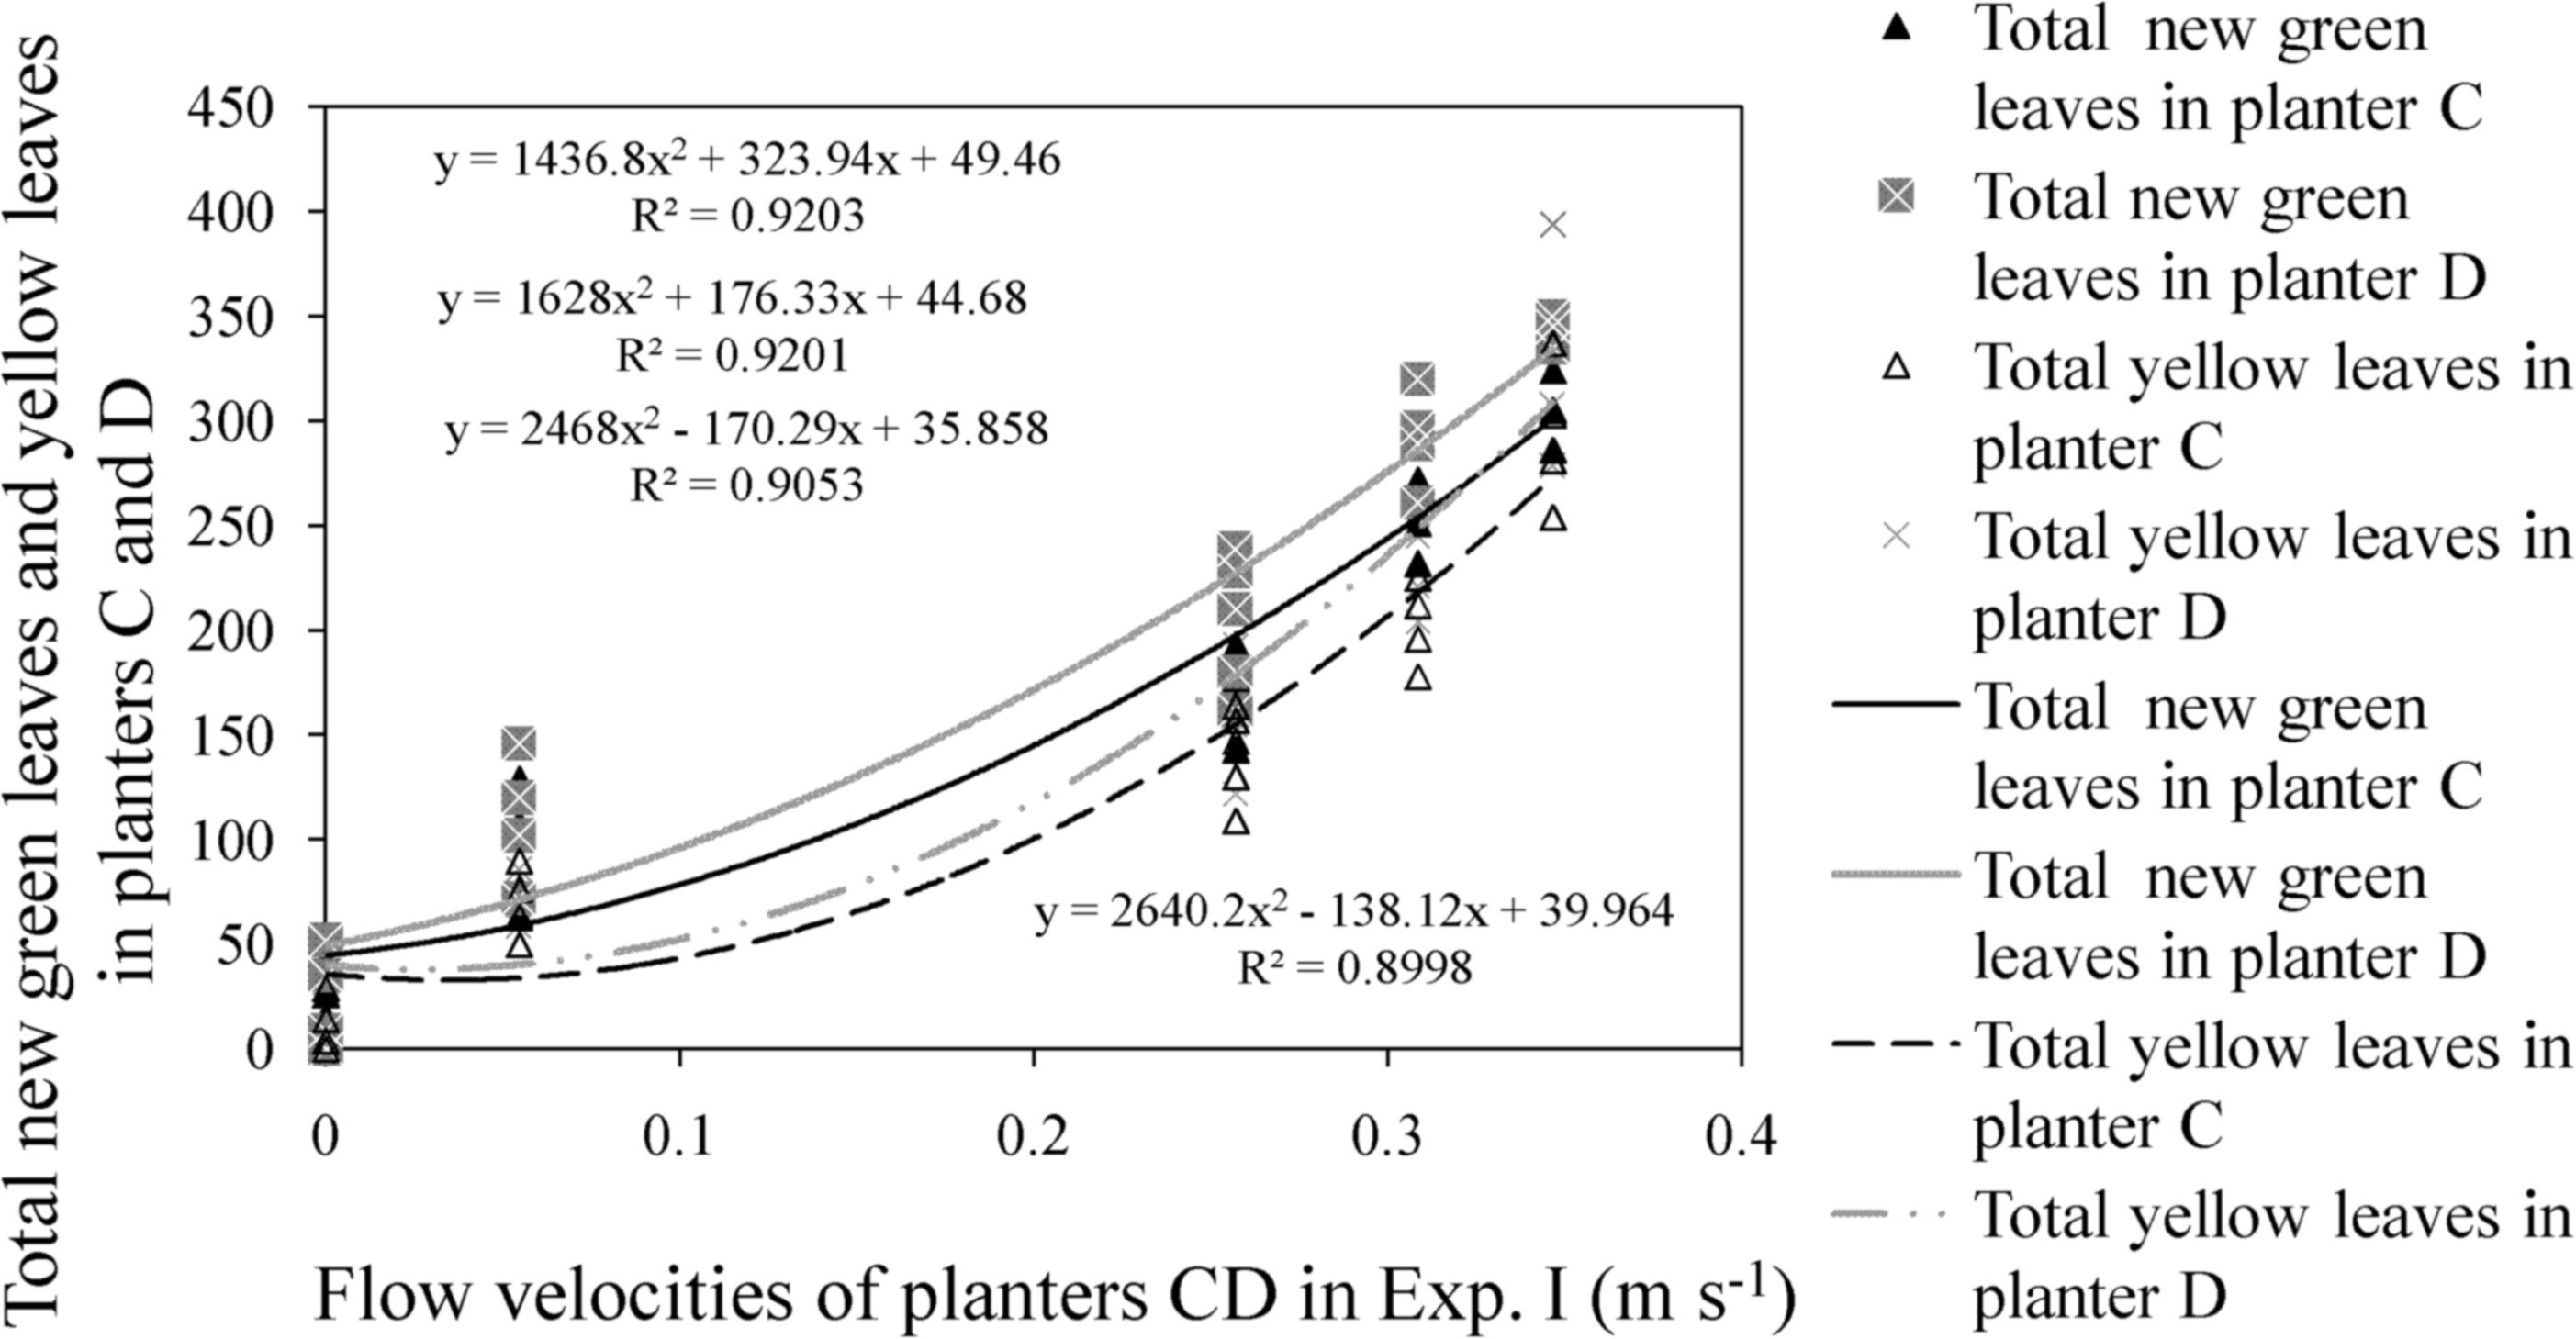
Relationship between total new green leaves and yellow leaves and flow velocities in experimental groups of Experiment I: Difference between total new green leaves and yellow leaves in planters C and D decreased as velocity exceeded 0.30 m s−1.
In Experiment II, <80% of green shoots had been eaten by Spodoptera litura Fabicius, so the total number of yellow leaves initially exceeded the number of new green leaves (Fig. 8). However, the number of green leaves in the experimental group continued to increase until harvesting at week 18 after planting, because flow velocities had been consistently maintained at a level below the tolerance limit of water celery.
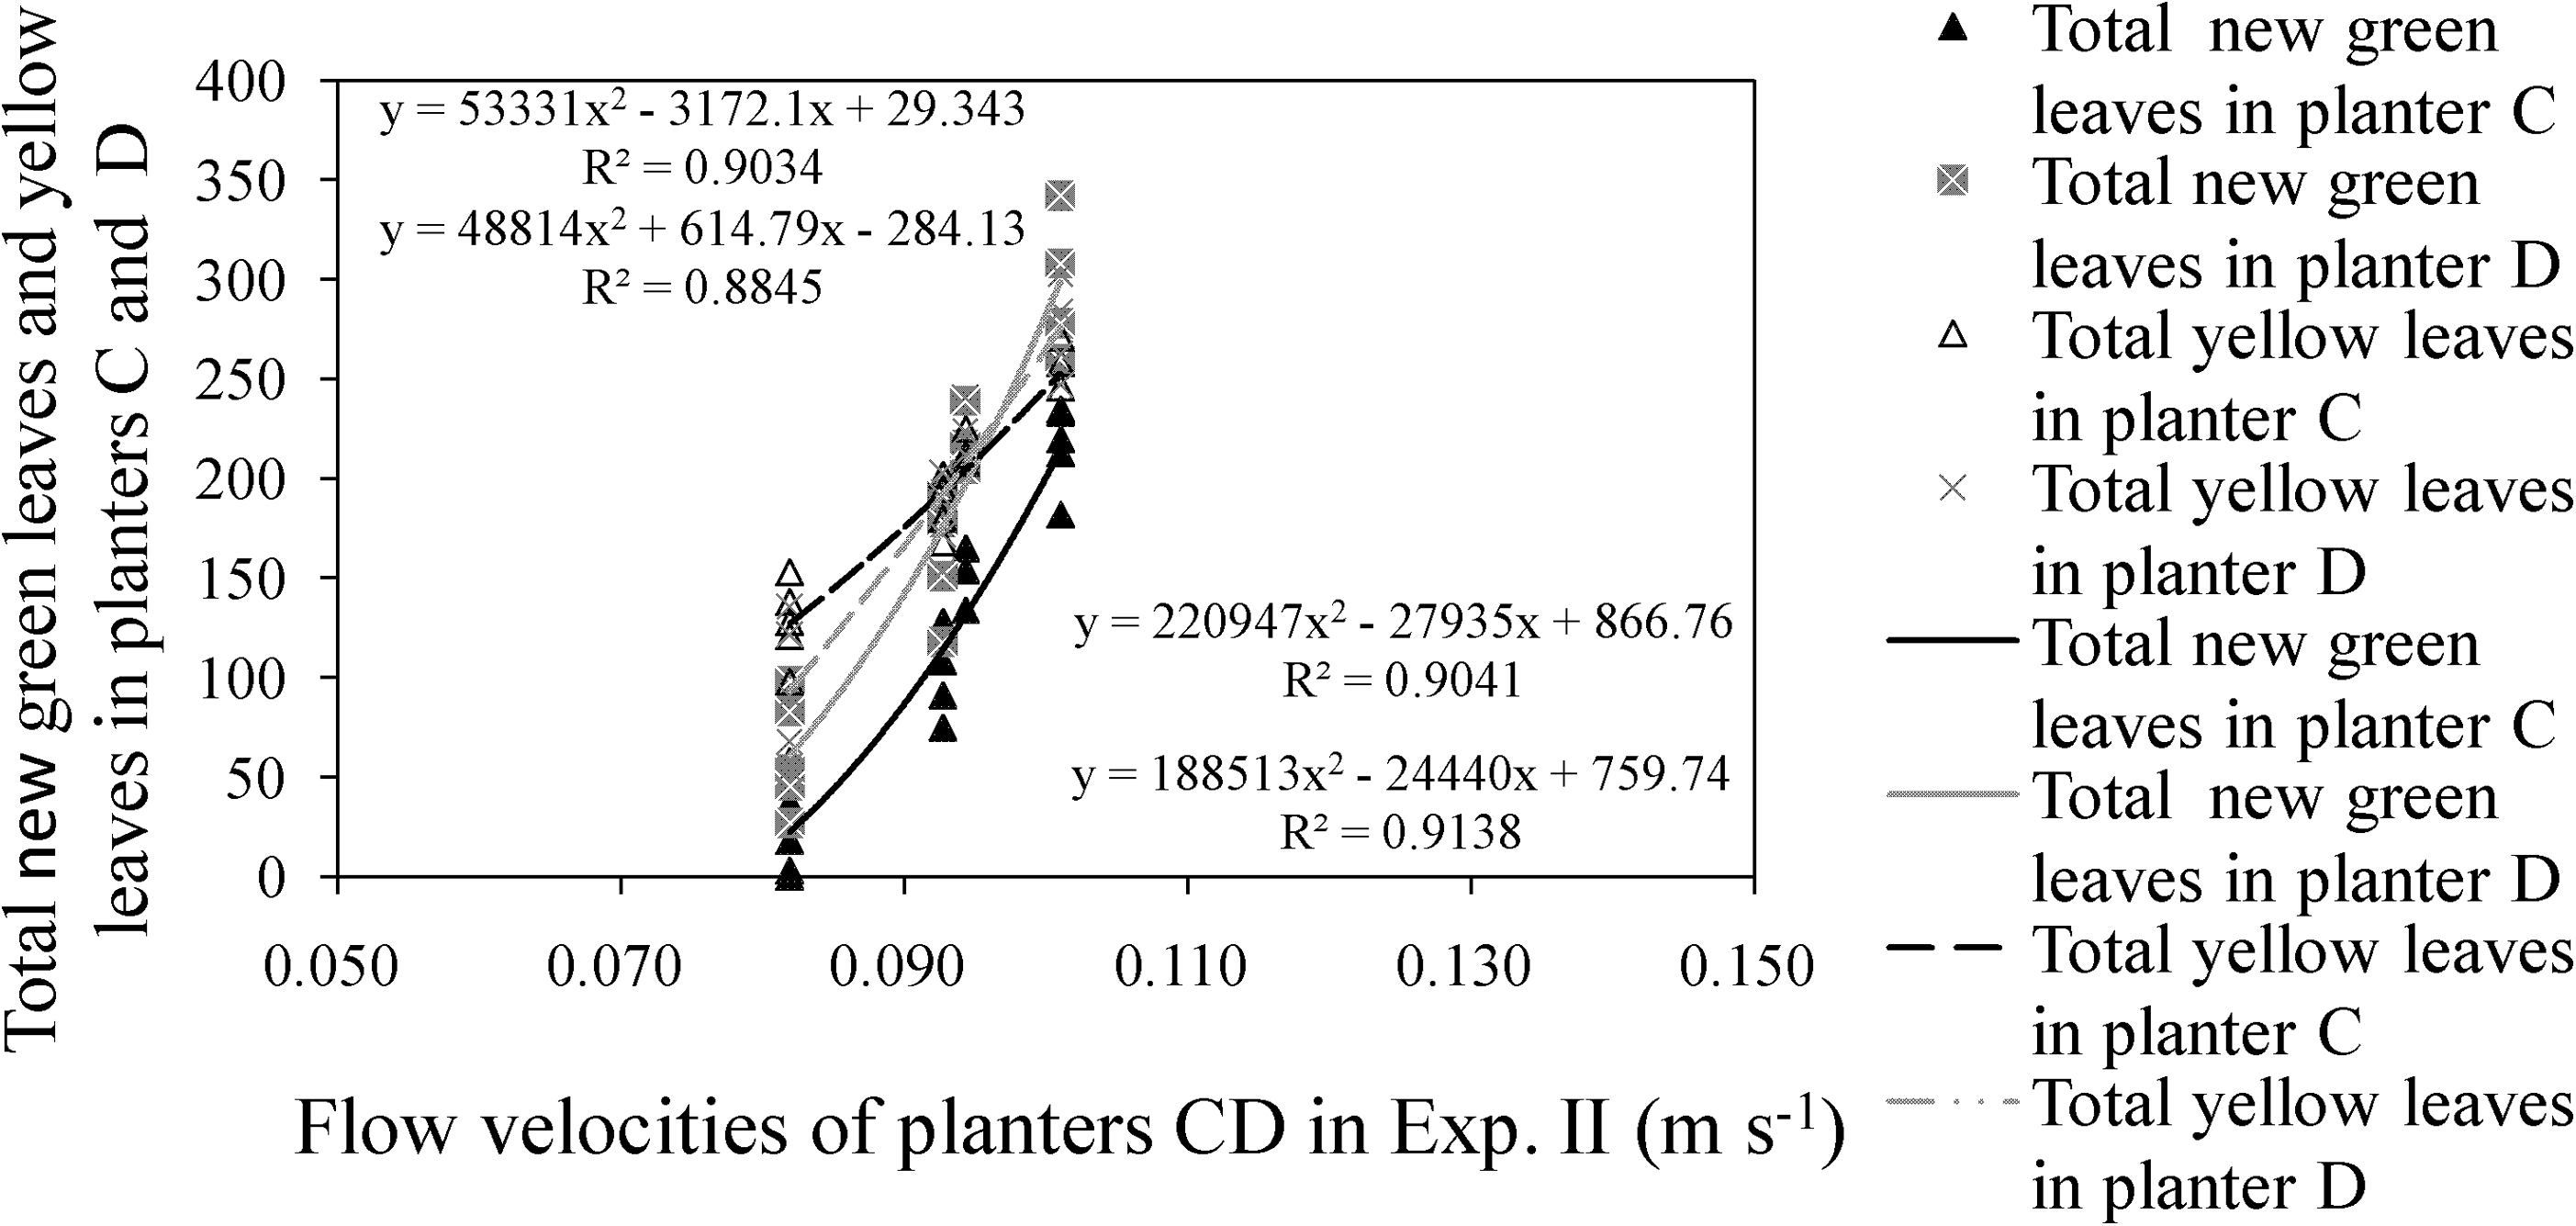
Relationship between total new green leaves/yellow leaves and flow velocities in experimental groups of Experiment II (first 2 weeks were not included): Flow velocities were under tolerance limit of water celery in this trial. Green leaves in the experimental group kept increasing until harvested at 18 weeks after planting.
In Experiment III, the number of green leaves in the experimental group continuously increased during the two stages. The difference between the total number of new green leaves and yellow leaves in planters C and D increased at velocities of <0.30 m s−1. Nonlinear regression relationships were found between flow velocities and the number of new green leaves and yellow leaves, which is consistent with the results of Experiments I and II (Figs. 9 and 10).
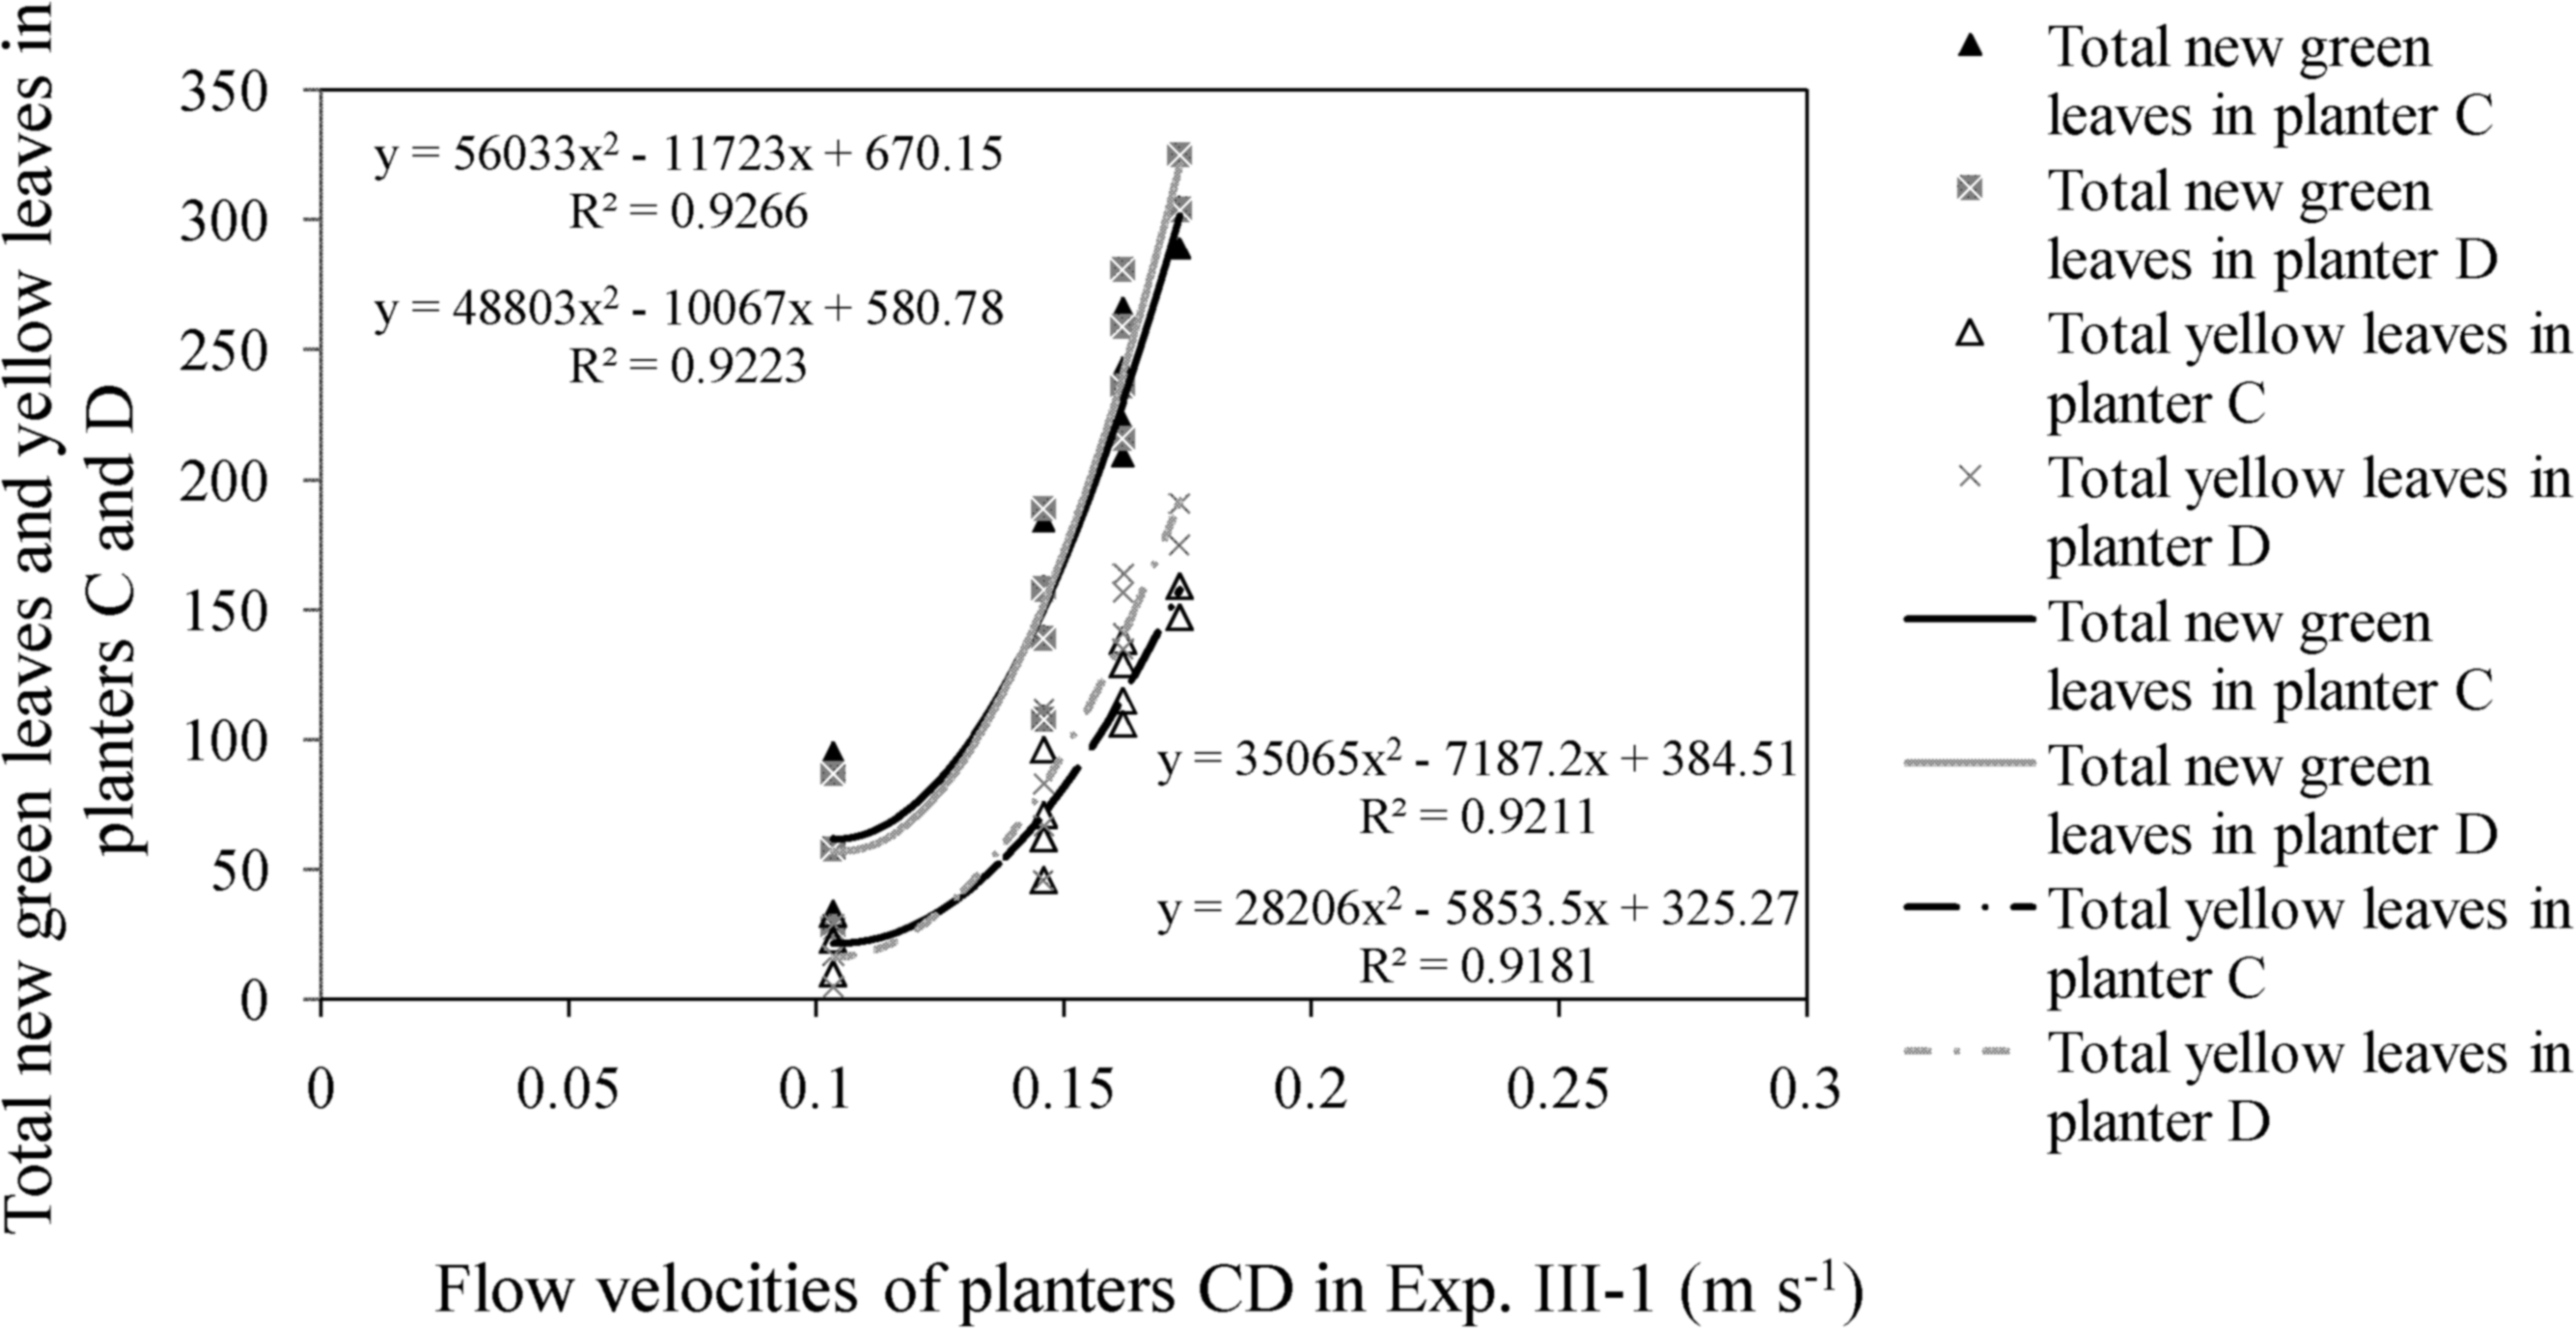
Relationship between total new green leaves/yellow leaves and flow velocities in experimental groups of Experiment III-1: In Experiment III-1, the green leaves in experimental group increased during the first stage with flow velocities below than 0.20 m s−1.
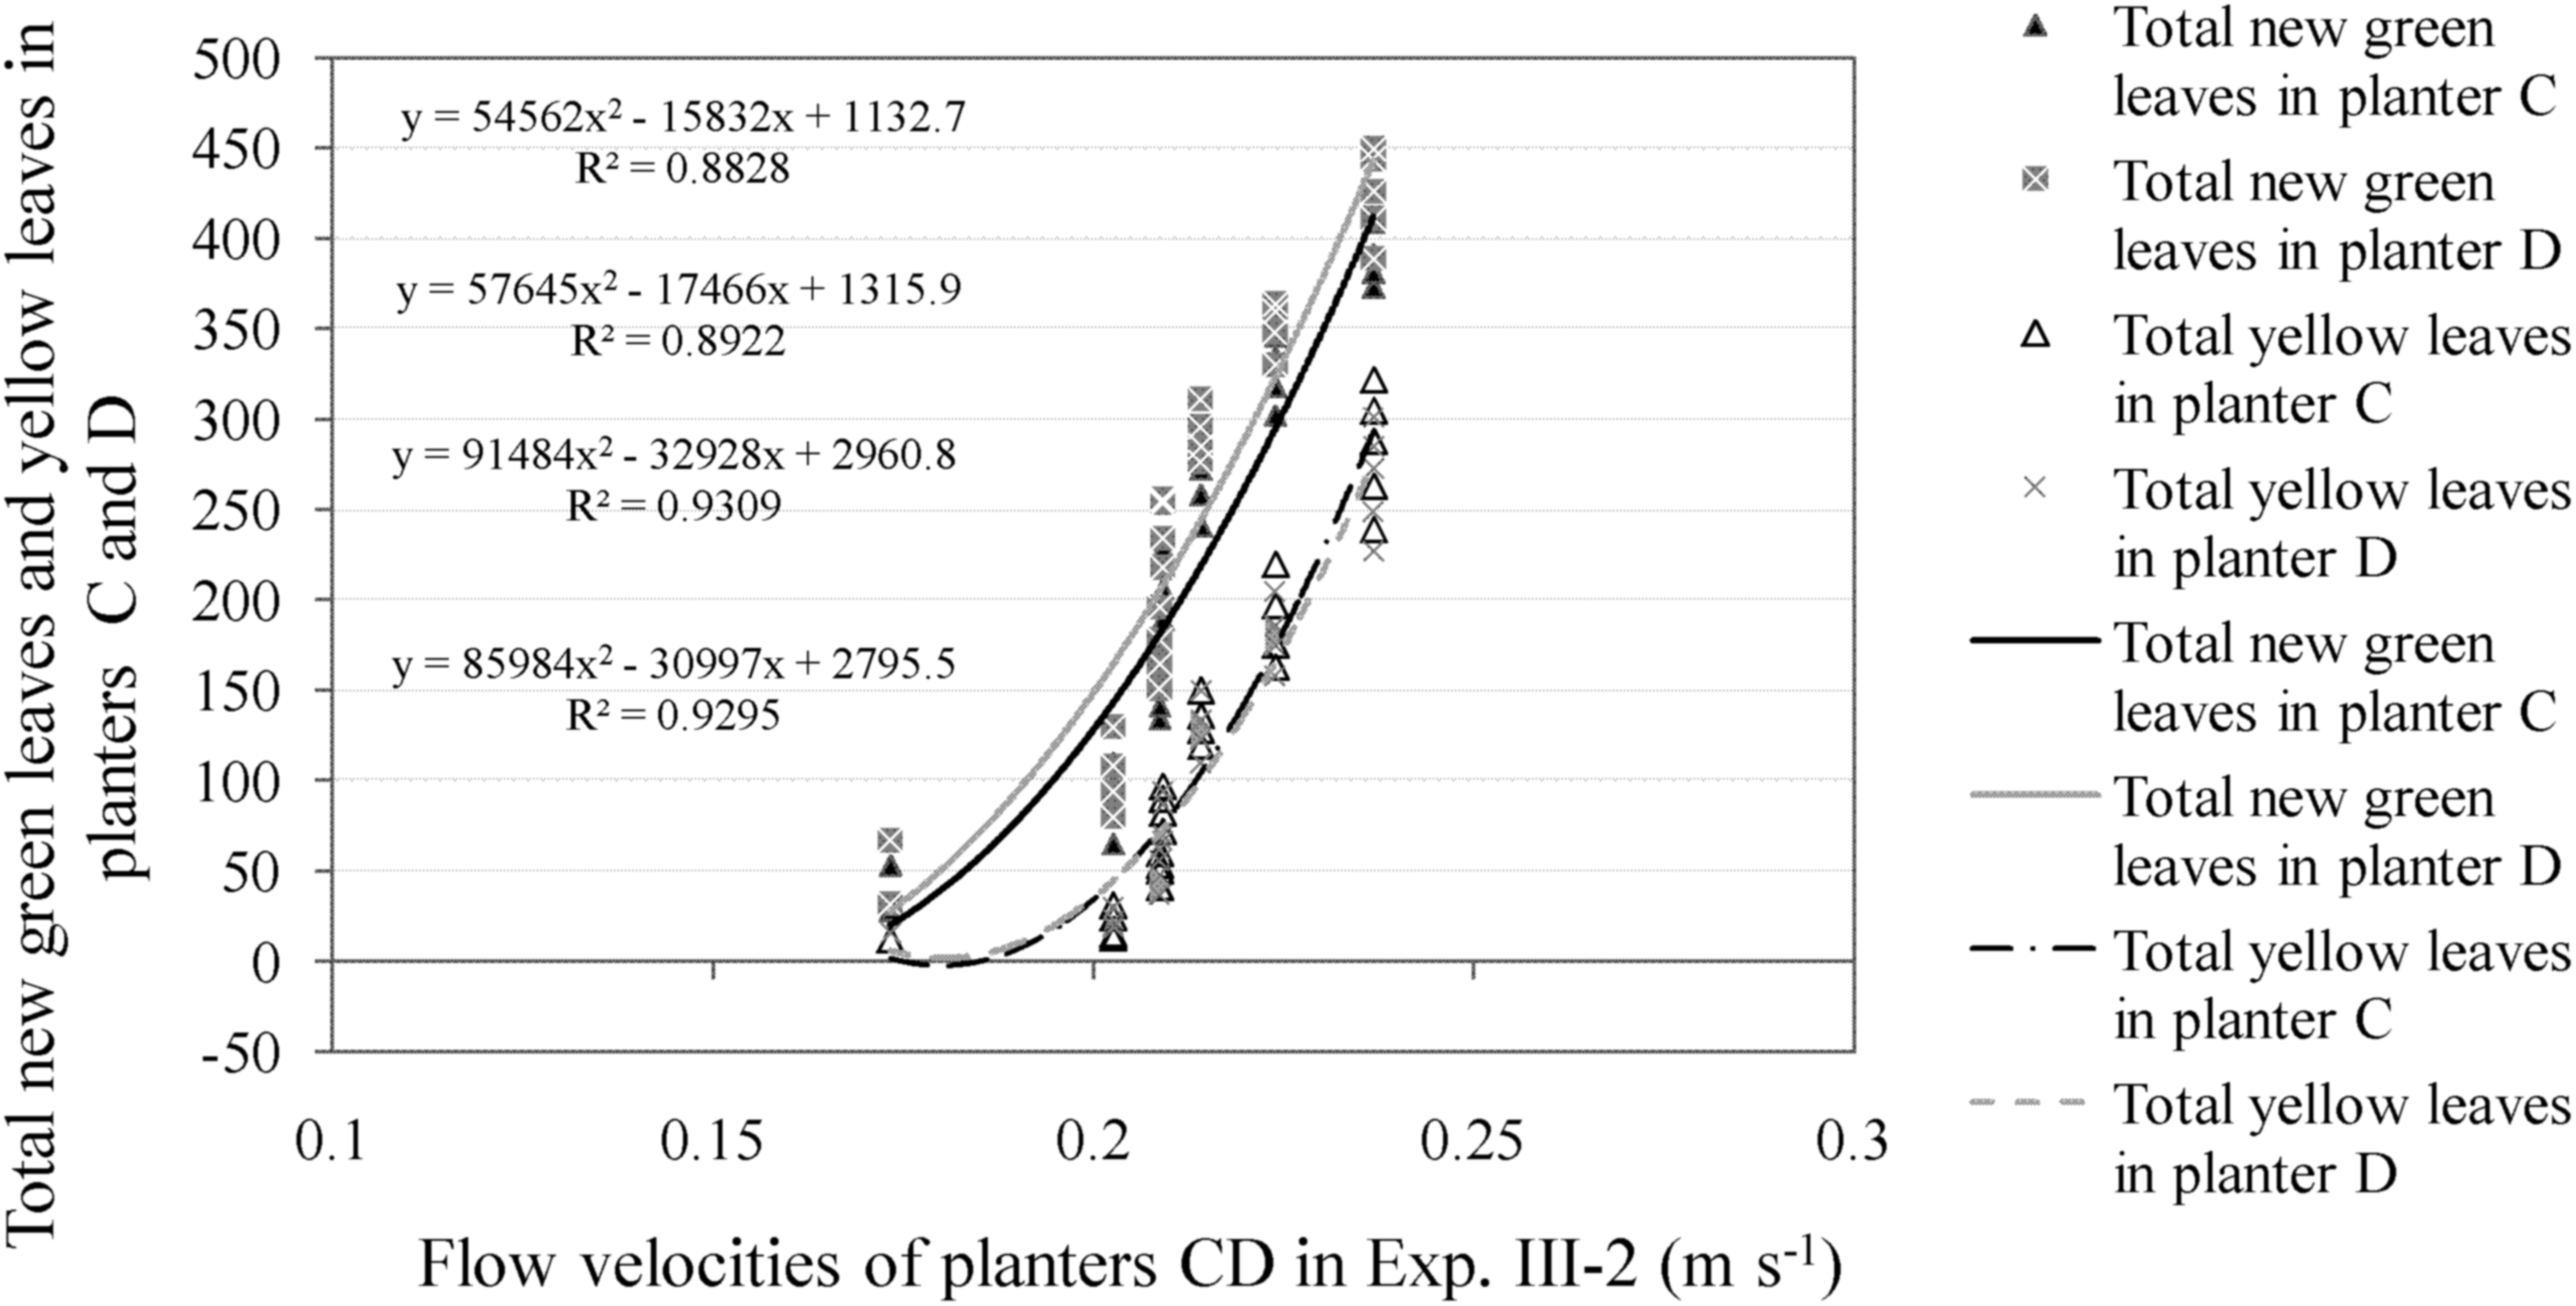
Relationship between the total new green leaves/yellow leaves and flow velocities in the experimental groups of Experiment III-2: In the second stage, as the flow rates were under tolerant flow rate of 0.30 m s−1, the green leaves in both planters C and D continued to increase.
Conclusion
This research demonstrates that the way in which water celery avoids mechanical stresses when encountering drag forces at higher flow velocities is to reduce both plant height and stem diameter, thereby forming softer and more flexible shoots. Such morphological adaptations to reduce root length also serve to reduce root anchorage strength, which increases plants' spreading ability at high flow velocities.
The plant section data from Experiments II and III show that the number of vascular bundles in new shoots was lower in flowing water environments than in terrestrial environments. However, subsequent data analysis of Experiments I–III revealed that although the total number of vascular bundles per stem decreased under high flow velocity conditions, the density of vessels per unit area increased. Plants undergo this kind of adaptation to avoid breakage or mechanical injury. At high flow velocities, aquatic macrophytes, such as Oenanthe javanica (Blume) DC, adapt to produce fewer vascular bundles per stem and a higher vascular bundle density per unit area to compensate for the structure lost in reduction of stem diameter, thereby reducing the likelihood of damage due to breakage. It must be noted here that morphological adaptation triggers may include factors other than flow velocity. To investigate this possibility, future experiments will vary other environmental conditions or planting methods, such as hydrology and cluster patterns.
The suitable flow rate range for water celery was determined to be 0.05–0.30 m s−1, which is approximately equal to most average flow velocities of dredged rivers in Taiwan. Water celery, a wet land plant with the advantages of easy cultivation and the ability to protect topsoil, has been found to be an appropriate planting material for intertidal zones and reservoir bank protection. As suitable streambank vegetation may include a variety of plants, future studies can examine the flow resistance mechanisms of clustered water celery and other plants, to further investigate the feasibility of applying aquatic macrophytes to ecological engineering.
Footnotes
Acknowledgments
This work was funded in part by the Taiwan National Science Council (Research Grant No. 96-2221-E-216-022; 98-2410-H-216-019) and Chung Hua University (Research Grant No. CHU-97-A-003). The authors thank Dr. Su-Hwa Chen and her staff members for the use of their laboratory in the Department of Life Science, National Taiwan University, and for the valuable comments provided by them.
Author Disclosure Statement
No competing financial interests exist.