
Abstract
Abstract
Soil erosion data in El Salvador Republic are scarce and there is no rainfall erosivity map for this region. Considering that rainfall erosivity is an important guide for planning soil erosion control practices, a spatial assessment of indices for characterizing the erosive force of rainfall in El Salvador Republic was carried out. Using pluviometric records from 25 weather stations, we applied two methods: erosivity index equation and the Fournier index. In all study area, the rainiest period is from May to November. Annual values of erosivity index ranged from 7,196 to 17,856 MJ mm ha−1 h−1 year−1 and the Fournier index ranged from 52.9 to 110.0 mm. The erosivity map showed that the study area can be broadly divided into three major erosion risk zones, and the Fournier index map was divided into four zones. Both methods revealed that the erosive force is severe in all study area and presented significant spatial correlation with each other. The erosive force in the country is concentrated mainly from May to November.
Introduction
where A denotes the annual soil loss (t ha−1 year−1), R the rainfall erosivity (MJ mm ha−1 h−1 year−1), K the soil erodibility (t ha h ha−1 MJ−1 mm−1), L the length factor, S the slope factor, C the land cover management factor, and P the support practices factor.
Mathematically, erosivity can be represented by the USLE's R factor. The concept of rainfall erosivity presented by Hudson (1971) and Wischmeier and Smith (1978) describes the erosivity as an interaction between the kinetic energy of raindrops and the soil surface. This may result in a greater or lower degree of detachment and down-slope transportation of soil particles according to the amount of energy and intensity of rain by considering the same soil type, topographic conditions, soil cover, and management (Silva, 2004).
Among all regular climatic parameters, rainfall is the most changeable in time and space. There are some basic measures of rainfall that can be used to supply information on the changeability and hence on the state of the climate. These mainly include monthly rainfall data and annual rainfall totals and averages, which can be used to evaluate the rainfall seasonality and variability, and the frequency of extreme events (Apaydin et al., 2006).
On the other hand, Fournier (1960 in Bertoni and Lombardi Neto, 1990), studying a method of evaluating the relationship between climate and soil erosion, established a climatic rainfall distribution index, the Fournier index (Oduro-Afriyie, 1996), which has been largely used in its original functional form or modified. This index shows how aggressive is the rainfall, and the original form of Fournier index is presented in equation (2).
where c represents Fournier index (mm), p the rainfall amount in the wettest month (mm), and P the annual rainfall amount (mm).
Some authors have found correlations between values for R factor of the USLE obtained from pluviographic records and the Fournier index (Oliveira and Medina, 1990; Morais et al., 1991). The investigation of the relationship between these two methods is mainly because the erosivity index obtained from pluviographic records is generally time consuming and expensive. Also, long-term pluviographic records are usually difficult to get. On the other hand, Fournier index requires monthly and annual rainfall amount, which are easily obtained (Bertoni and Lombardi Neto, 1990).
Maps showing the spatial distribution of natural and management-related erosion factors are of great value in the early stages of land management plans, allowing to identify preferential areas where action against soil erosion is more needed or where the remediation efforts will have highest incomes. This kind of studies becomes more and more frequent with the advent of geographic information system (GIS) (Angulo-Martínez et al., 2009).
GIS technologies have facilitated the interpolation of data to create an isoerodent map. Such map depicts the spatial variation of rainfall values for a given region, such as a watershed, states, and countries (Silva et al., 2007; Kim et al., 2005). Rainfall erosivity maps have been created for many countries: Brazil (Silva, 2004), Cape Verde (Mannaerts and Gabriels, 2000), Ghana (Oduro-Afriyie, 1996), Honduras (Mikhailova et al., 1997), Korea (Qi et al., 2000), the United States (Wichmeier and Smith, 1978).
However, for tropical regions in Central America, where rainfall is generally strong, there are few rainfall erosivity studies or maps. El Salvador Republic has neither rainfall erosivity map nor Fournier index map, and there are only few soil erosion studies in the whole or part of the country (Sain and Barreto, 1996; Kim et al., 2005). Hence, it is crucial that this map be generated to be used in strategic soil erosion control activities in the country.
Based on these considerations, the main objective of this study was to create a rainfall erosivity map for El Salvador Republic and evaluate spatial and temporal characteristics of rainfall erosivity within the study area through two different methods.
Study area
El Salvador Republic is one of the smaller countries of Central America, located on the Pacific Coast of Central America with an area of about 21,000 km2 (Fig. 1), and has a population of 6,800,000 inhabitants in 2005. It is faced with a variety of environmental problems ranging from water shortage and pollution to deforestation and soil erosion. As a result of its geographic condition, the country has been historically subjected to different natural hazards such as earthquakes, tropical storms, droughts, volcanic activity, floods, and landslides. In addition to man-made processes that cause some environmental impacts, they make possible high-risk conditions and natural disasters. In turn, hydrometeorological phenomena recurrently affect much of the country during the rainy season; the worst affected areas are the lower river basins, the areas surrounding the runways, and major urban areas. Another degradation process is deforestation. In El Salvador Republic, the deforestation contributes to the acceleration of erosion process and loss of the soil productive capacity. Also, it contributes to impaired storage of groundwater in watersheds, harmful climate change, landscape degradation, and loss of natural resources (IDB, 2009).
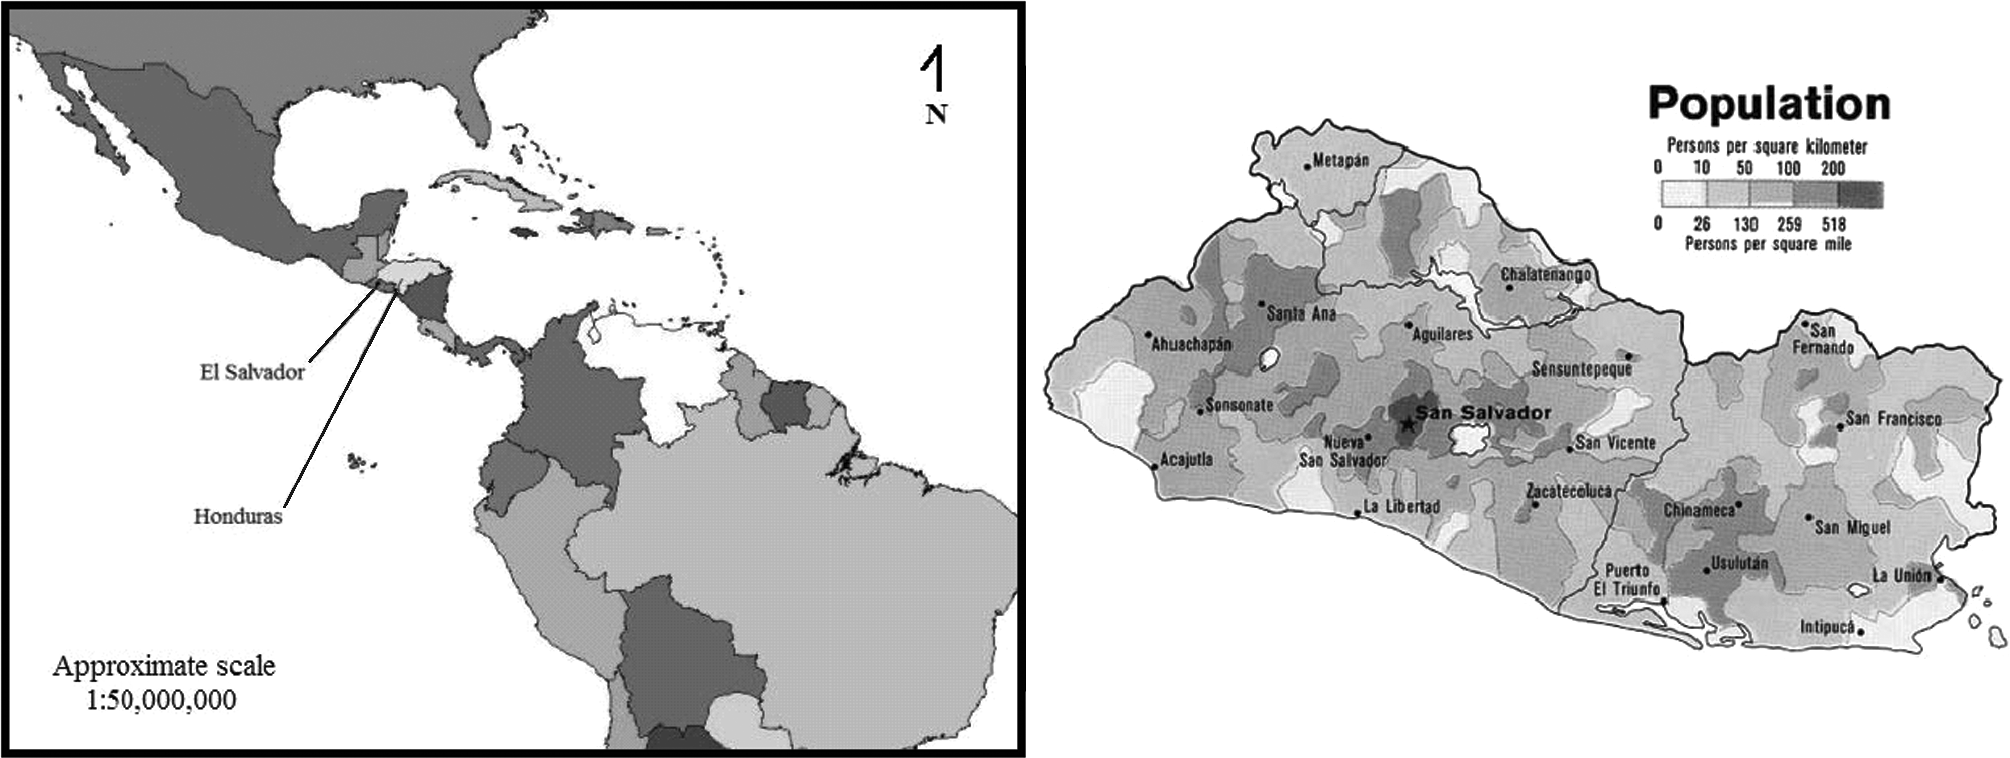
Location of El Salvador Republic in Central America (left), main cities, and population density (right). Source of right map: Theodora Enterprise (2000).
The altimetry of the study area ranges from 0 to 2,365 m above the sea level. In the western side the relief is hilly, whereas that of the eastern side has smoother relief. The main climatic features of the country are annual average temperature of 21°C and rainfall amount of 1,850 mm year−1 (Fig. 2). The wet season begins in May and ends in October, followed by the dry season. The study area is divided into three main climatic regions and the type of vegetation reflects each of these three situations (Rodriguez, 2007).

El Salvador pluviometric map (values in mm year−1). Source: Rodriguez (2007).
El Salvador Republic is a typically rural country with agriculture as the main economical activity (Sain and Barreto, 1996). Approximately 57% of the country's population live in rural areas and about 75% of the basic grains (corn and beans) are produced by poor campesinos who operate very small holdings (Bravo-Ureta et al., 2006).
Less than 5% of the country is covered by natural remnant forests (Bravo-Ureta et al. (2006), 9.4% is exposed to some environmental impacts caused by floods, and 19.2% is exposed to several kinds of landslides (Rodriguez, 2007). According to the Ministry of Environment, through the National Service of Territorial Studies (SNET), around 1,970 km2 (9%) of the country are exposed to severe impact and moderate floods, more than 4,040 km2 are exposed to different types of landslide (19%), and over 10,000 km2 (48%) are likely to be affected by drought.
Materials and Methods
The study was carried out using a continuous record database of 25 climatologic stations scattered across the El Salvador Republic territory (Fig. 3 and Table 1). Most stations spanned continuous data record for a period of over 15 years.

Spatial distribution of pluviometric stations in El Salvador.
For computation rainfall erosivity values, the database consisted of annual data (sum of monthly values) with rainfall erosivity calculation computed with equation (3) (Mikhailova et al., 1997).
where i denotes location (i = 1, 2, 3, … , n) at which Ri is the point estimate of R-factor value (MJ mm ha−1 h−1 year−1), Pi the average annual precipitation (mm), and Ei the elevation (m).
Because of small study area, the same equation was applied in the database for all pluviometric stations of El Salvador Republic. After the equation was applied to the entire dataset, annual erosivity data were interpolated to generate the El Salvador Republic erosivity map. To make an easier visual distinction between the classes in the maps, the range of the values was reclassified into interpretative classes.
For computation of the Fournier index, equation (2) was applied for the same database that was used for computation of the erosivity index. As above, after the equation was applied to the entire dataset, data were interpolated to generate the El Salvador Republic Fournier index map. To make an easier visual distinction between the Fournier index values in the maps, the range of the values was reclassified into interpretative classes.
As the prediction model for erosivity computation used in this study considered altimetry and rainfall amount, a correlation analysis was performed between (a) rainfall amount and rainfall erosivity and (b) altimetry and rainfall erosivity.
Results and Discussion
Annual erosivity values ranged from 7,196 to 17,856 MJ mm ha−1 h−1 year−1 in El Salvador Republic (Table 1). Comparatively, Mikhailova et al. (1997) found values ranging from 2,980 to 7,297 MJ mm ha−1 h−1 year−1 for Honduras. For El Salvador Republic, the rainfall amount varies from 1,371 to 2,780 mm year−1, and for Honduras, the rainfall amount varies from 360 to 1,080 mm year−1. For Fournier index, the values ranged from 52.9 to 110.0 mm. The database confirms that rainfalls are usually strong in all study area and climate has an expressive erosive force (Rodriguez, 1997).
For 80% of the study area, the erosivity is classified as “very strong” (Fig. 4). The first two interpretative classes (as exposed in Table 2: low erosivity and medium erosivity) did not appear in the map. Comparatively, for Fournier index map, the class “low erosivity” did not appear (Table 3), and the predominance was the class “severe” (66.3%; Fig. 5).
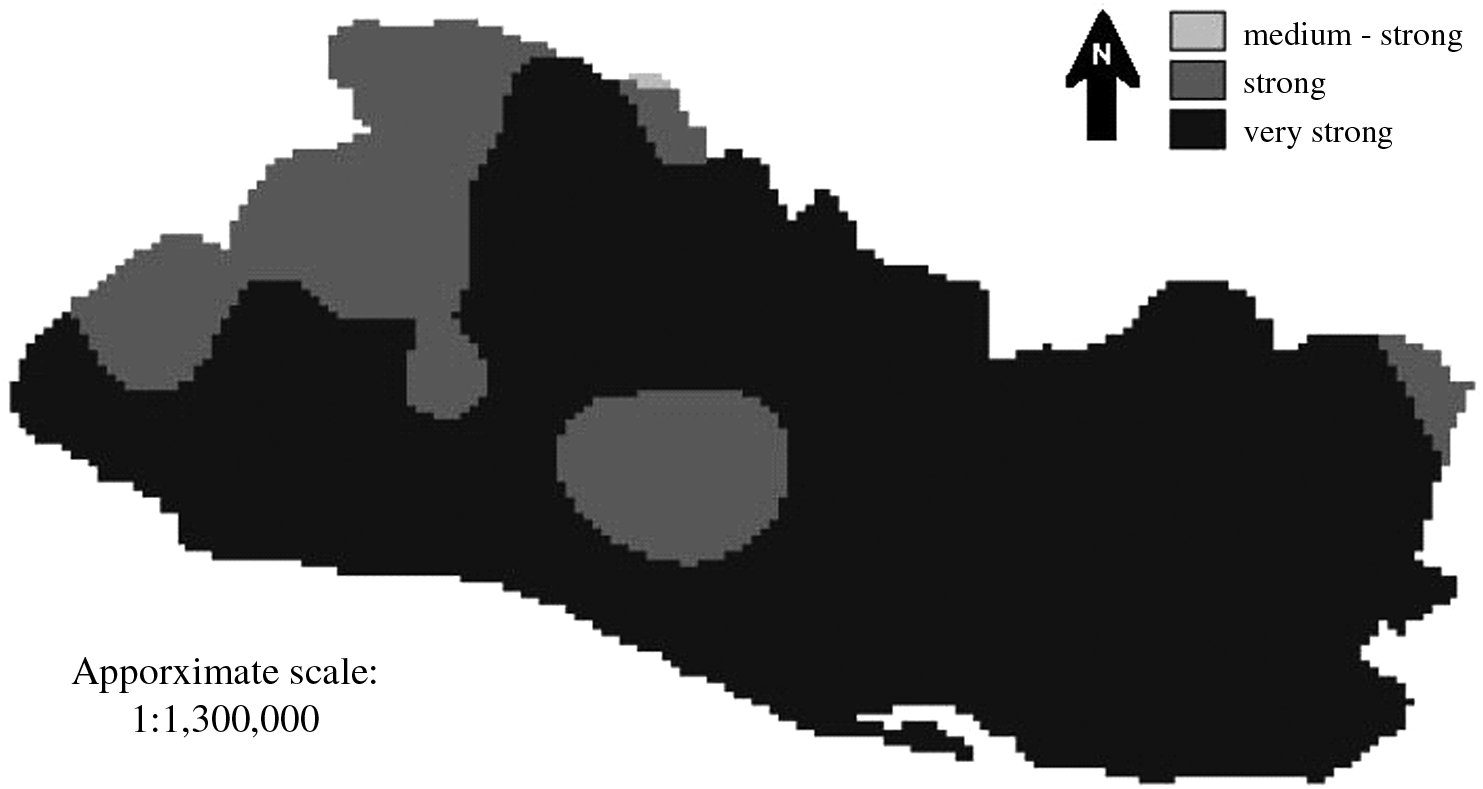
Rainfall erosivity map with interpretative classes.
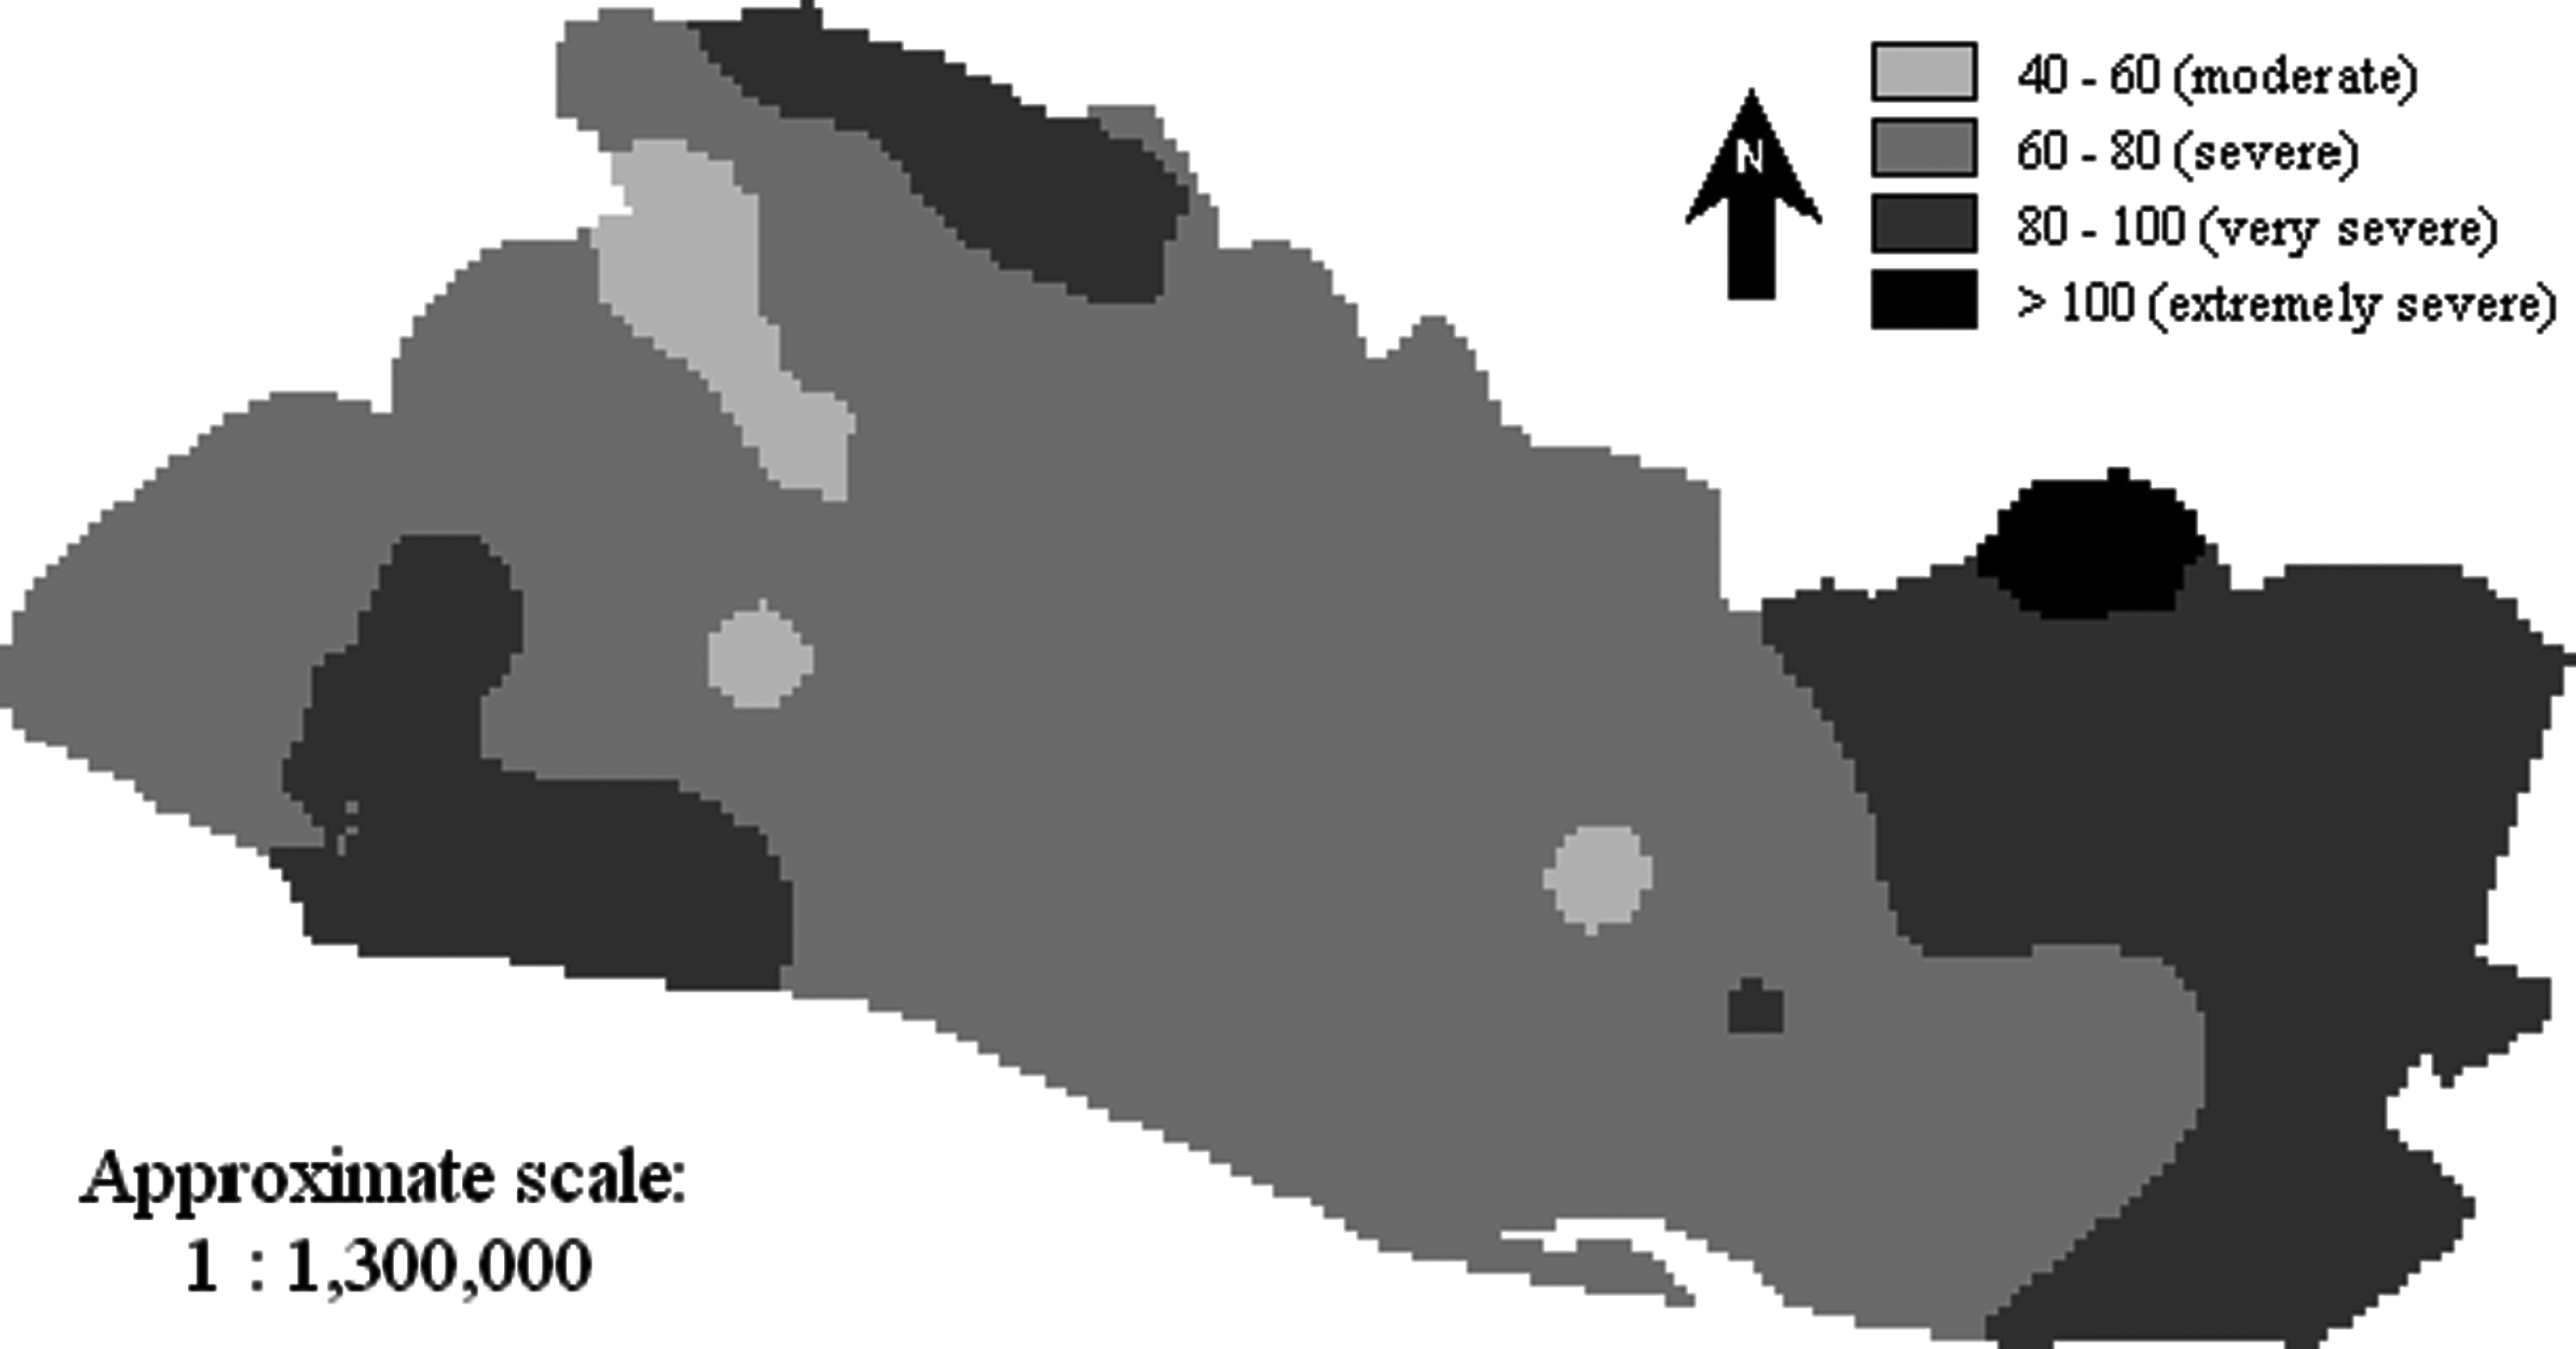
Fournier index map (values in mm) with interpretative classes.
Source: Oduro-Afriyie (1996).
Castaneda (2009) mentions that the pattern of precipitation of El Salvador, which is typical of the Pacific Coast of Central America, is mainly the result of humidity drawn from the Pacific Ocean, is also affected by the El Niño southern oscillation, and has topography as the main factor that influences the spatial distribution. However, for this study, we observed that rainfall amount presented closer relation to rainfall erosivity (r2 = 0.5; Fig. 6) than altimetry (r2 = 0.1; Fig. 7). The data surveyed by Mikhailova et al. (1997) for Honduras also showed poor correlation value between altimetry and rainfall erosivity (r2 = 0.2).
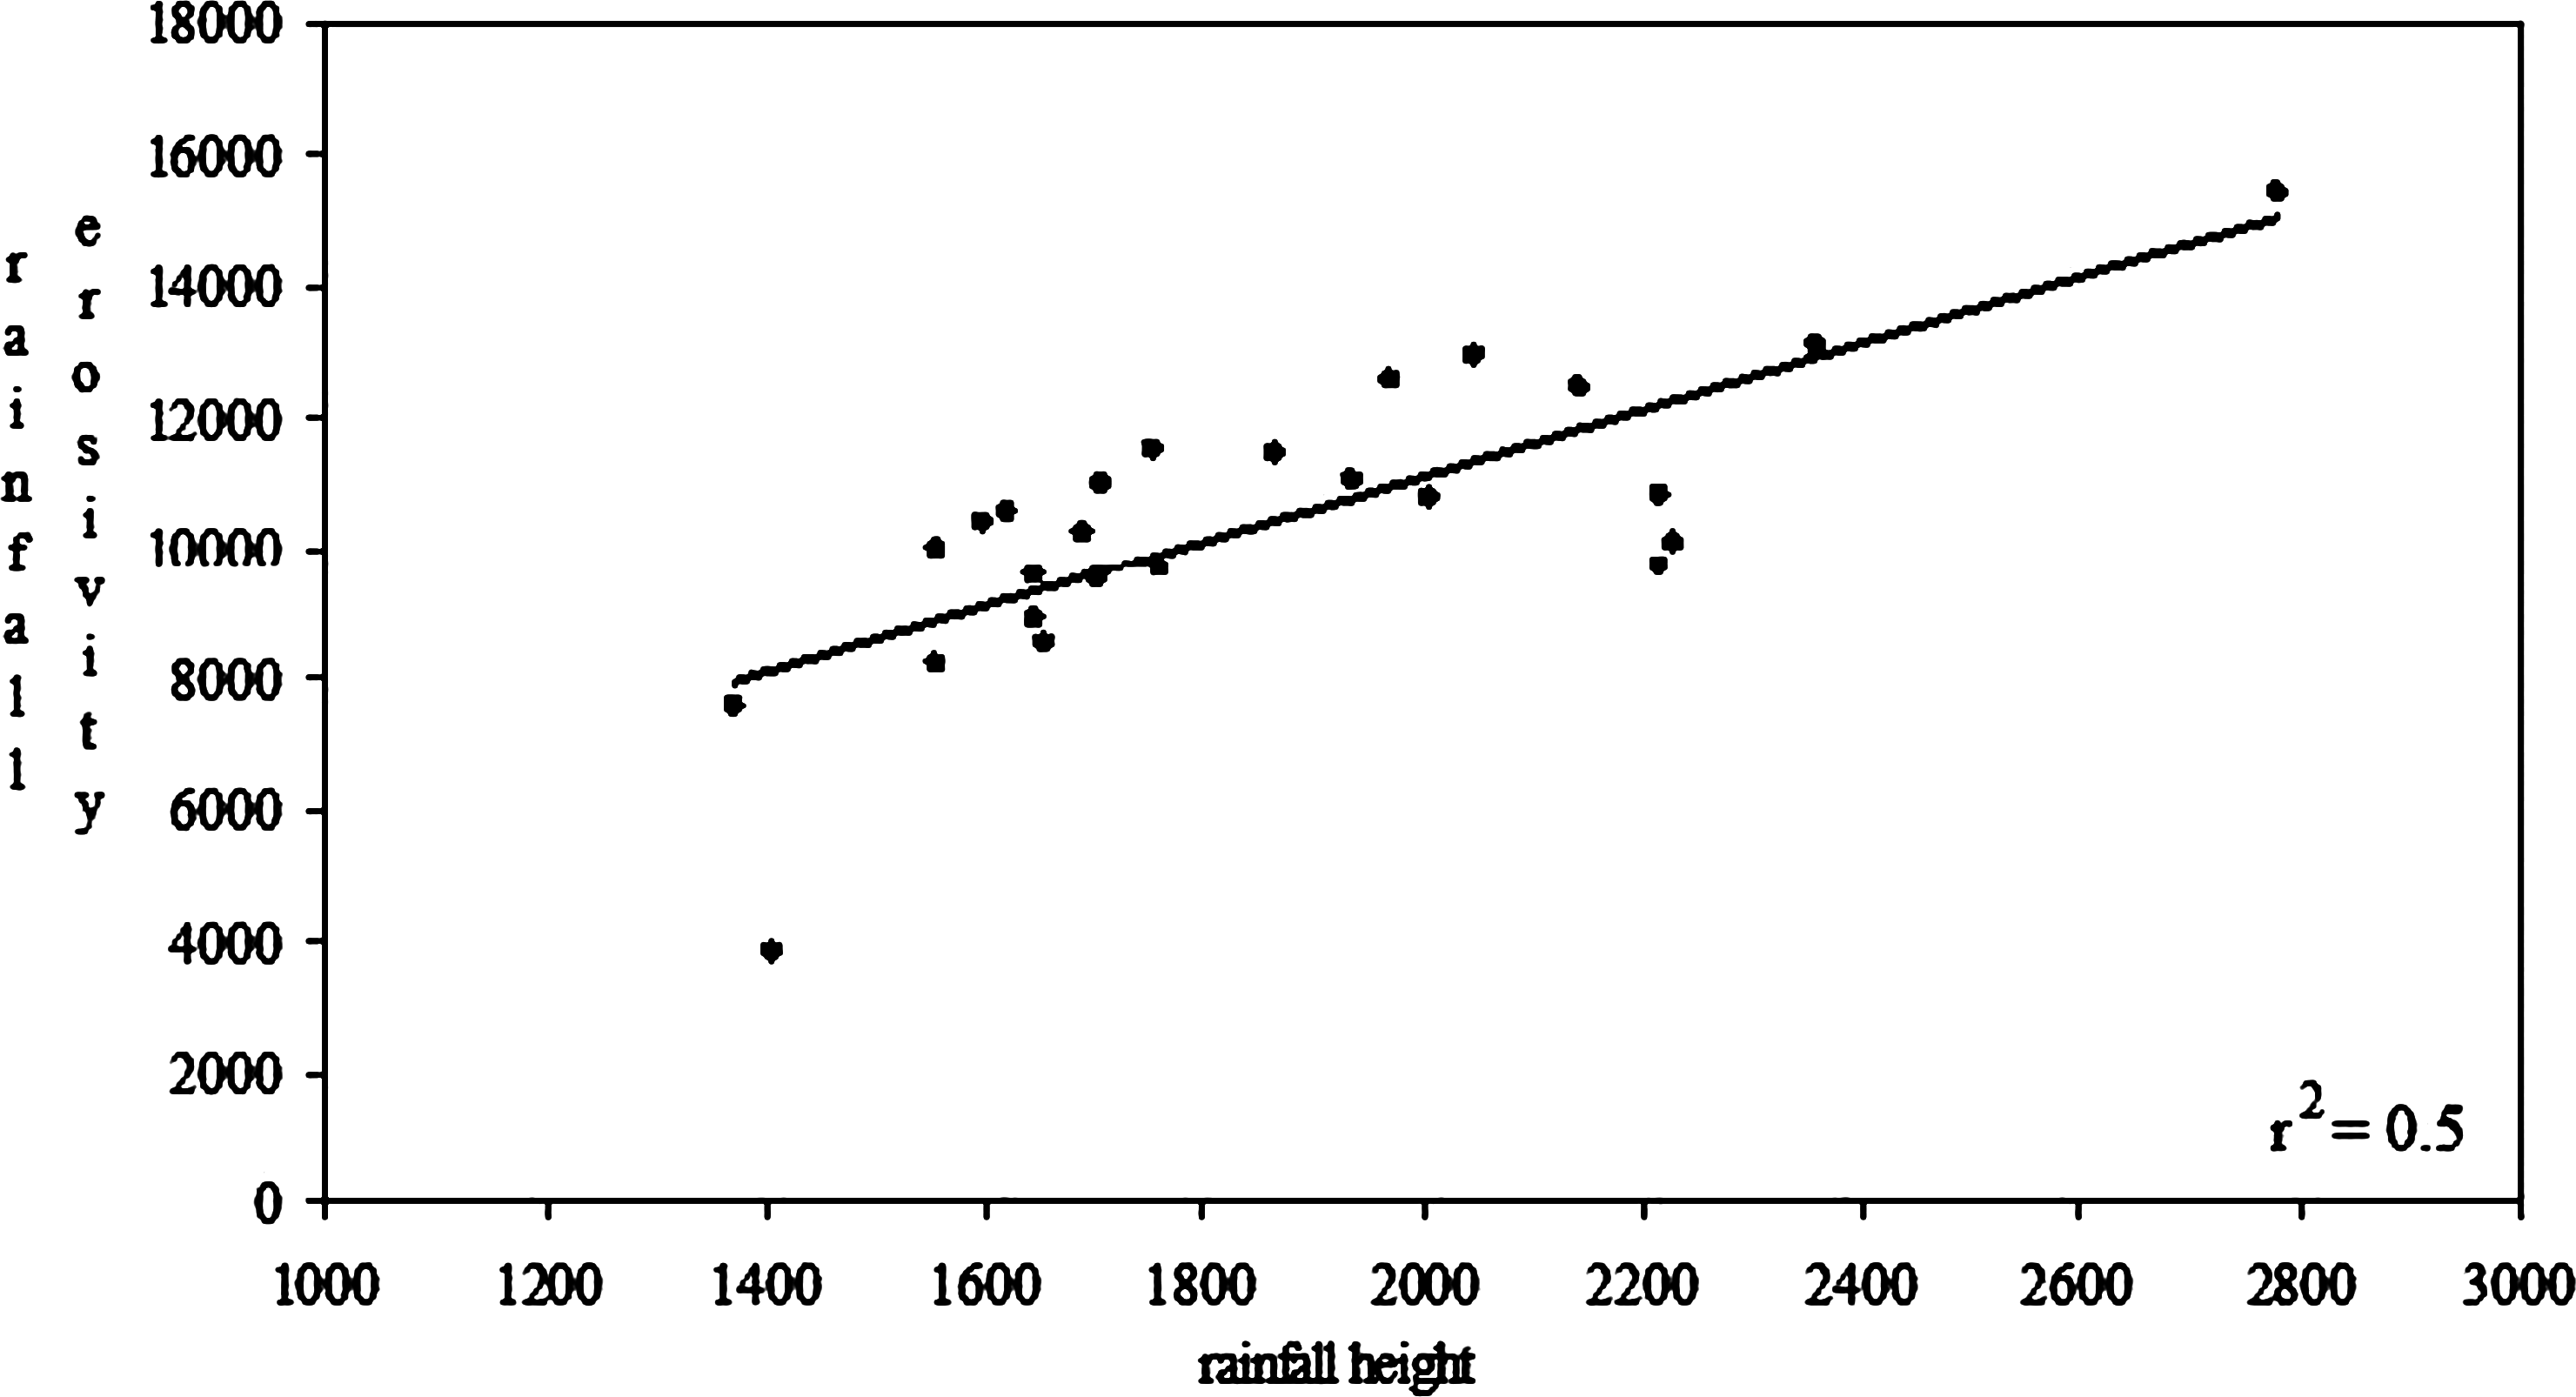
Relationship between annual rainfall amount (mm year−1) and annual rainfall erosivity (MJ mm ha−1 h−1 year−1).
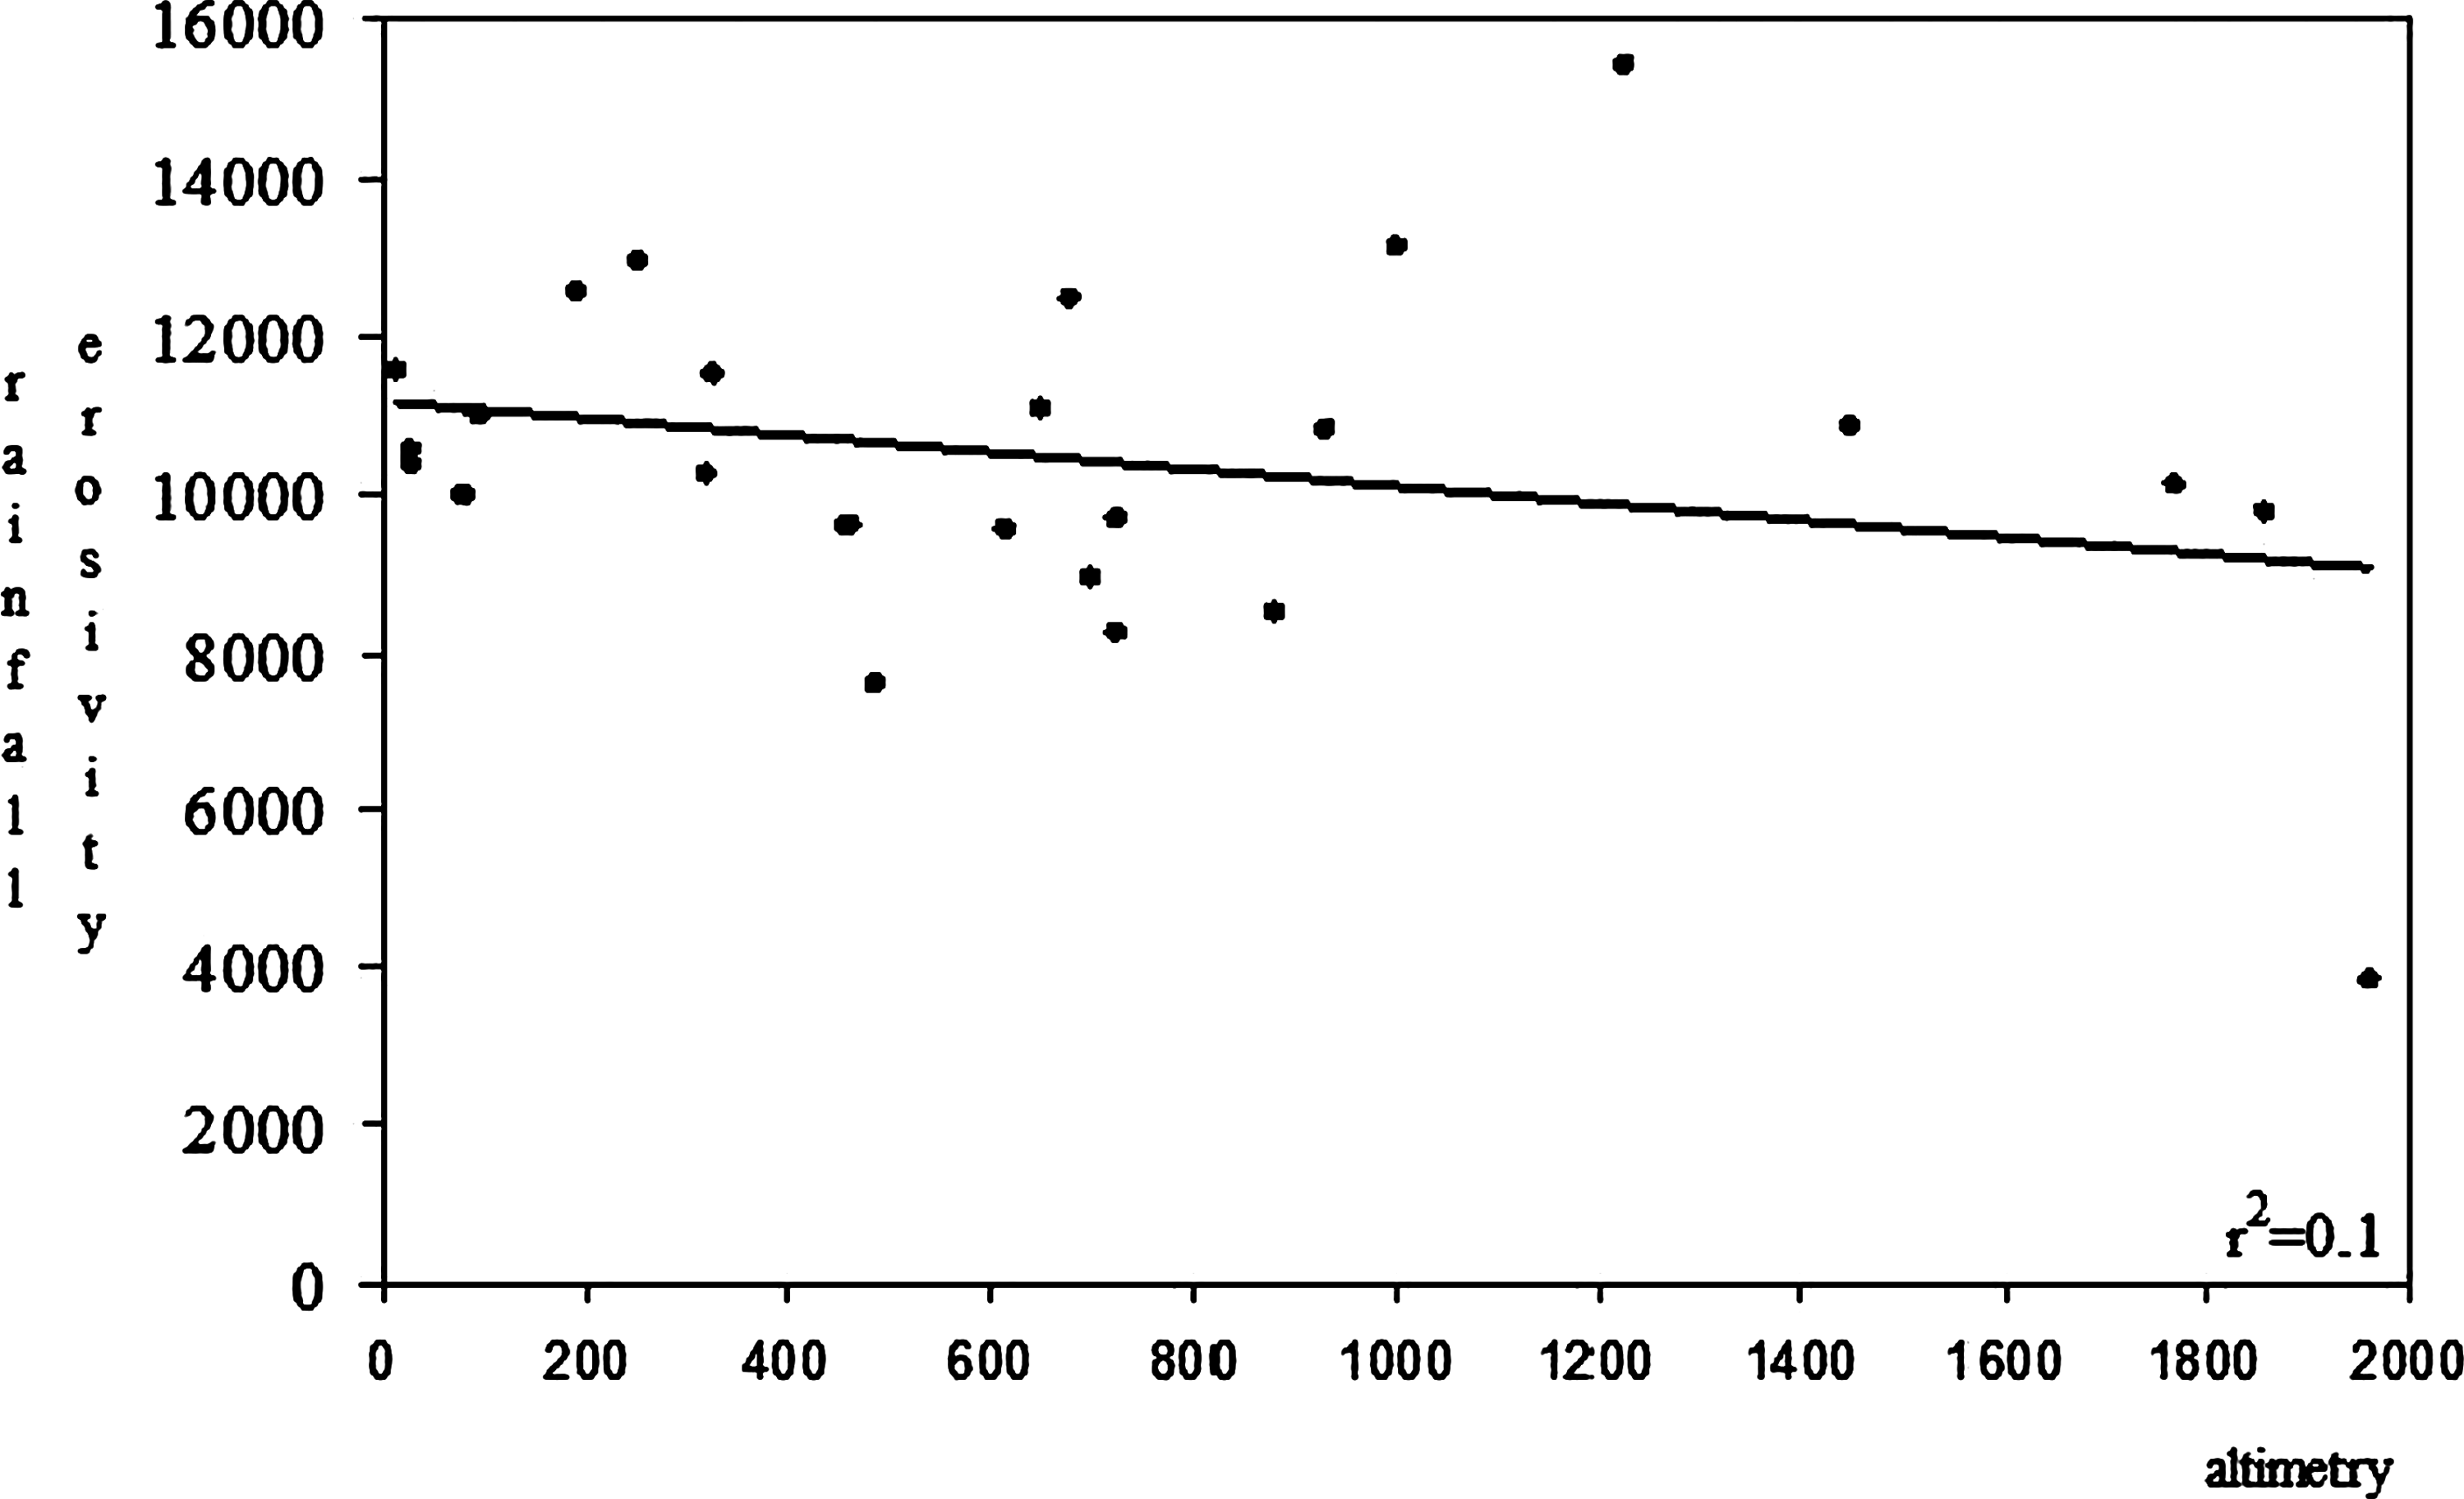
Relationship between altimetry (meters above the sea level) and annual rainfall erosivity (MJ mm ha−1 h−1 year−1).
In this study, rainfall erosivity for El Salvador Republic values are far higher than those presented by Kim et al. (2005) for Rio Lempa basin (a river basin encompassing large areas of El Salvador Republic, Guatemala, and Honduras). These authors estimated values up to 1,500 MJ mm ha−1 h−1 year−1 (considered low, according to Table 3).
The difference is likely due to the mathematical model employed for prediction. Kim et al. (2005) used a mathematical model constructed for a temperate region (generated for use in a region of United States). On the other hand, this study employed a model that was generated with the database from a neighbor country (Honduras), hence, with climatic conditions similar to El Salvador Republic. Thus, the map of soil loss expectation generated by Kim et al. (2005) possibly underestimated the amount of soil loss due to underestimation of rainfall erosivity.
Kim et al. (2005) divided the basin of their study in two main categories: (a) potentially suitable areas have characteristics such that if agricultural land use USLE factor C = 0.63 is assumed, the estimated erosion rate derived from the USLE is <300 t ha−1 year−1, and (b) areas that are probably unsuitable with characteristics such that USLE calculations would give erosion rates ≥300 t ha−1 year−1. If considered the new values of erosivity estimated in this study, such value of C factor should be reviewed and certainly diminished to define new suitable or unsuitable areas for agricultural use.
The metropolitan area of the capital San Salvador, most populated region of El Salvador Republic, is located in a region of strong erosivity (central patch in the map of Fig. 4) and in a region classified as “severe” through Fournier index (Fig. 5).
December, January, February, March, and April are particularly dry months (Bravo-Ureta et al., 2006). The period from May to November concentrates 92% of the total rainfall and is known as “time of cyclones” by the El Salvador Republic Government (Rodriguez, 2007). The quarter of June, July, August, and September is the rainiest with 52% of annual rainfall amount (Fig. 8). The same situation was reported by Mikhailova et al. (1997) for Honduras. For the computation of Fournier index, September was considered the wettest month, with 41% of the rainfall.

Percentage of total rainfall amount per month (average values among the gauging stations) for El Salvador Republic.
However, at the same time the rainfall erosivity increases in June, the vegetation or the land cover also improves, and as a consequence, there is an increase in water infiltration during such period. Forests give the country a steady supply of drinking water, fuel hydroelectric plants, and reduce sedimentation due to erosion in dams, which account for 33% of the country's power and 66% of the country's drinking water. Tree cover is also essential for the production of shade coffee, which is one of the most important crops in the Salvadorian economy (Castaneda, 2009).
Similar spatial distribution of the rainfall erosive force was verified between the values of erosivity index and Fournier index (r
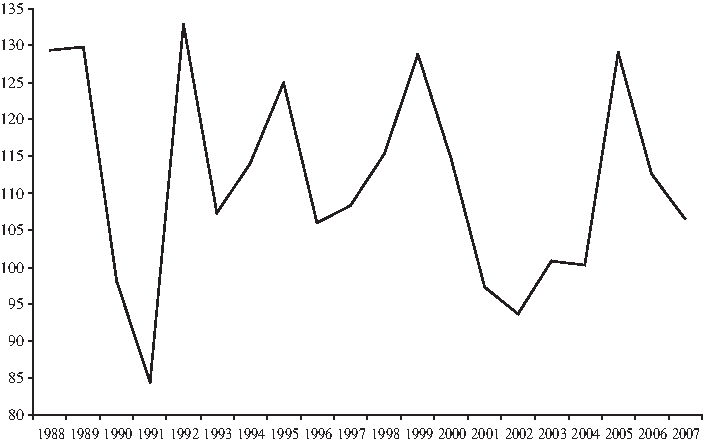
Temporal variation of the Fournier index (values in mm).
The erosivity content of rainfall, as represented by the R/P ratio or R-factor to annual rainfall (Mannaerts and Gabriels, 2000), was estimated using the erosivity index. The values ranged from 5.25 to 6.42 MJ ha−1 h−1. For Honduras, values ranged from 3.67 to 5.72 MJ ha−1 h−1. For a semiarid region, where the rainfall erosive force is usually inexpressive (Cape Verde region), Mannaerts and Gabriels (2000) found values ranging from 0.11 to 1.16 MJ ha−1 h−1. Silva (in preparation) found values ranging from 4.56 to 7.34 MJ ha−1 h−1 for the Amazon River Basin. This confirms once more the severe force to cause erosion contained in rainfall for the study area in El Salvador Republic.
The rainfall in El Salvador Republic has an expressive force and risk to cause erosion. Hence, in areas at high risk, the main strategies to control erosion seem to be providing incentives for farmers to use soil conservation practices by managers. Among such practices, planting leguminous trees and erecting stone walls (Campaña et al., 2004) and encouraging farmers use steeper slopes for coffee, as well as use intermediate slopes for corn and beans, and flatter areas for vegetables seems be some of the best options (Kim et al., 2005).
The maps presented in this study are useful to illustrate how rainfall erosivity influences soil erosion and to deliver an important source of information for predicting erosion in El Salvador Republic. The database utilized in this study helped the prediction of soil loss along the territory of El Salvador Republic and allowed some numerical simulations of soil loss according to scenarios of land cover and soil tillage. These simulations can be adopted in governmental programs of natural resources conservation, especially the soil programs, to better predict soil detachment, indicating the watersheds with major potential for soil loss and sediment delivery (Hardy, 2004).
Conclusions
Erosivity presented higher correlation value with rainfall amount values than with altimetry. Similarity was observed between the spatial correlations of the values estimated through erosivity index and Fournier index. The erosive force in the country is concentrated mainly from May to November. By applying a mathematical model more suitable for Central America region, this study also contributed to provide a better estimate of rainfall erosivity for El Salvador Republic, compared with previous studies for the country.