
Abstract
Abstract
In this study, the phenolic resin and viscose rayon precursor-based activated carbon fibers (ACFs) were prepared by carbonization and steam-activation. Prepared ACFs were surface-functionalized by hydrogen peroxide and applied as adsorbents in environmental remediation applications. Carbonization and activation conditions (temperature, time, and heating rate) were varied to prepare ACFs of different specific surface area and pore size distribution. At the activation temperature of 900°C, the specific surface area was found to be maximum (∼1,700 m2/g for the phenolic resin precursor- and ∼2,300 m2/g for the viscose rayon precursor-based ACFs). However, former precursor-based ACFs contained mostly micropores, whereas the latter contained both micropores and mesopores. Adsorption of methylene blue, the reagent used as a test adsorbate molecule, was found to be dependent on the surface area, pore volume, and pore size distribution of the prepared ACFs, and also on the surface oxygen functional groups incorporated therein. These surface characteristics were found to be controlled by carbonization and activation conditions. Rayon precursor-based ACFs were found to be superior to the phenolic resin-based ACFs for adsorbing methylene blue from aqueous solution, with ∼646 mg/g of the equilibrium ions loading observed in the former, in comparison to ∼540 mg/g in the latter.
Introduction
Activated carbon fibers (ACFs) have attracted a lot of attention in recent years because of their micro-porous texture, large specific surface area (1,500–2,000 m2/g) and pore volume (0.5–1 cc/g), and ability to form a variety of surface functional groups (Shim et al., 2001; Li and Hu, 2009). Compared with GAC (670 m2/g–1,600 m2/g, 0.3 cc/g) and PAC (580–1,200 m2/g, 0.27 cc/g), ACFs have relatively large specific surface area and pore volume and are claimed as better candidates for contaminant sorption (Bandosz, 2006; Yang et al., 2006). In addition to its high Brunauer-Emmett-Teller (BET) area and uniform pore size, ACF has internal pores directly connected to the external surface. As a consequence, the diffusion length from the surface to the internal pores is small, which results in small or negligible intrapore diffusion resistance. The implication has significance in adsorption and separation processes. The process is adsorption rate controlled, and adsorption breakthrough is suppressed for relatively longer time. The maldistribution of flow and hydrodynamic resistance are also smaller in packed beds of ACF than those of its counterparts GAC and PAC. Moreover, ACFs are relatively easier to handle, because they can be used in various forms such as cloth, felt, and fibers. This renders them appropriate for several applications (Yoon and Ryu, 2010).
Currently, ACFs are widely used as adsorbents and catalyst supports in environmental remediation applications. In particular, ACFs are shown to be capable of effectively removing common air pollutants, such as volatile organic compound (Inagaki, 2000; Cheng et al., 2004; Gaur et al., 2006b), SO2 (Gaur et al., 2006a), and NOx (Das et al., 2004; Dwivedi et al., 2004; Gaur et al., 2005; Adapa et al., 2006; Singhal et al., 2008; Rathore et al., 2010). The ACFs impregnated with transition metals such as Ni, Fe, Cu, and Cr have also been found to be capable of adsorbing several air (Hung, 2008) and water pollutants (Gupta et al., 2009, 2010; Shi et al., 2010).
The specific surface area, pore size distribution (PSD), and surface chemical functional groups of ACF determine its applications. The specific surface area of ACF determines its adsorption capacity. The PSD determines the types of the adsorbate molecules that may be adsorbed by the material, depending on the size of the molecule. The adsorbents containing mostly micropores (pore size <2 nm) may be used to adsorb toxic gaseous molecules. The adsorbents containing mesopores (pore size=2–50 nm) are mainly responsible for the adsorption of large-size molecules. Such materials may be used to remove dyes or humic acids present in wastewater. Functional groups on the surface of ACF determine the acidic or basic characteristics of the material. Therefore, ACFs functionalized with acids will enhance the adsorption of dyes that are basic (Hattori et al., 2002; Stein et al., 2009).
In general, the pore structure of carbon is controlled by activation conditions (activation agent, temperature, and time) and precursors (Gaur et al., 2006a)
In the present study, ACF was prepared by the carbonization of the raw fibers, followed by activation using steam as an activation agent. The experimental conditions (temperature and time of carbonization/activation) were optimized to obtain the required BET surface area and PSD of the prepared ACF. The surface functionalization (modification) of ACF was carried out by hydrogen peroxide (H2O2) to incorporate functional groups.
Materials and Methods
The reagent grade H2O2 (30% w/w) and MB were purchased from Merck, Germany. Nitrogen (>99.9999%) was obtained from Sigma Gases, India. The raw carbonaceous fibers based on two types of precursors, viscose rayon and phenolic resin, were procured indigenously and overseas (Nippon Kynol Inc.), respectively.
Preparation of ACF
The two types of ACF derived from phenolic resin and rayon precursors developed in this study are labeled as ACF1-TAR and ACF2-TAR, respectively, where T denotes the activation temperature in °C, A denotes activation, and R denotes holding time in min.
ACFs were prepared by first carbonizing the fresh raw fibers in an inert atmosphere and then by activation in the presence of an oxidizing agent (steam). Figure 1 is the schematic of the experimental set up used for carbonization and activation of the fibers. The set-up may be assumed to mainly consist of an Inconel tube (L=38 cm, I.D=4.0 cm) placed horizontally in a ceramic furnace suitable for high temperatures (T ∼1,100°C). A thermocouple was placed at the center of the furnace equipped with a temperature controller and programmer (Model: PPC 3077; Nutronics Co.) for varying the furnace temperature in steps at a specified rate. Another Inconel tube (L=32 cm, I.D=0.8 cm) having circumferential perforated holes (0.05 mm diameter and 1 cm apart) was installed co-axially in the outer tube. One end of the inner tube was connected to the gas inlet, whereas the other end was sealed. The fiber was wrapped over the inner perforated tube so that the incoming gas to the tube flowed radially outward through the perforations, the wrapped fiber, and then into the outer tube, before exiting to the vent. The steam required for activation was generated in a pressure-controlled stainless steel boiler equipped with electric heating coils. The flow rate of the steam was precalibrated by weighing the condensed water. The steam lines and the boiler were insulated with glass wools to prevent condensation within the lines and reduce heat losses.
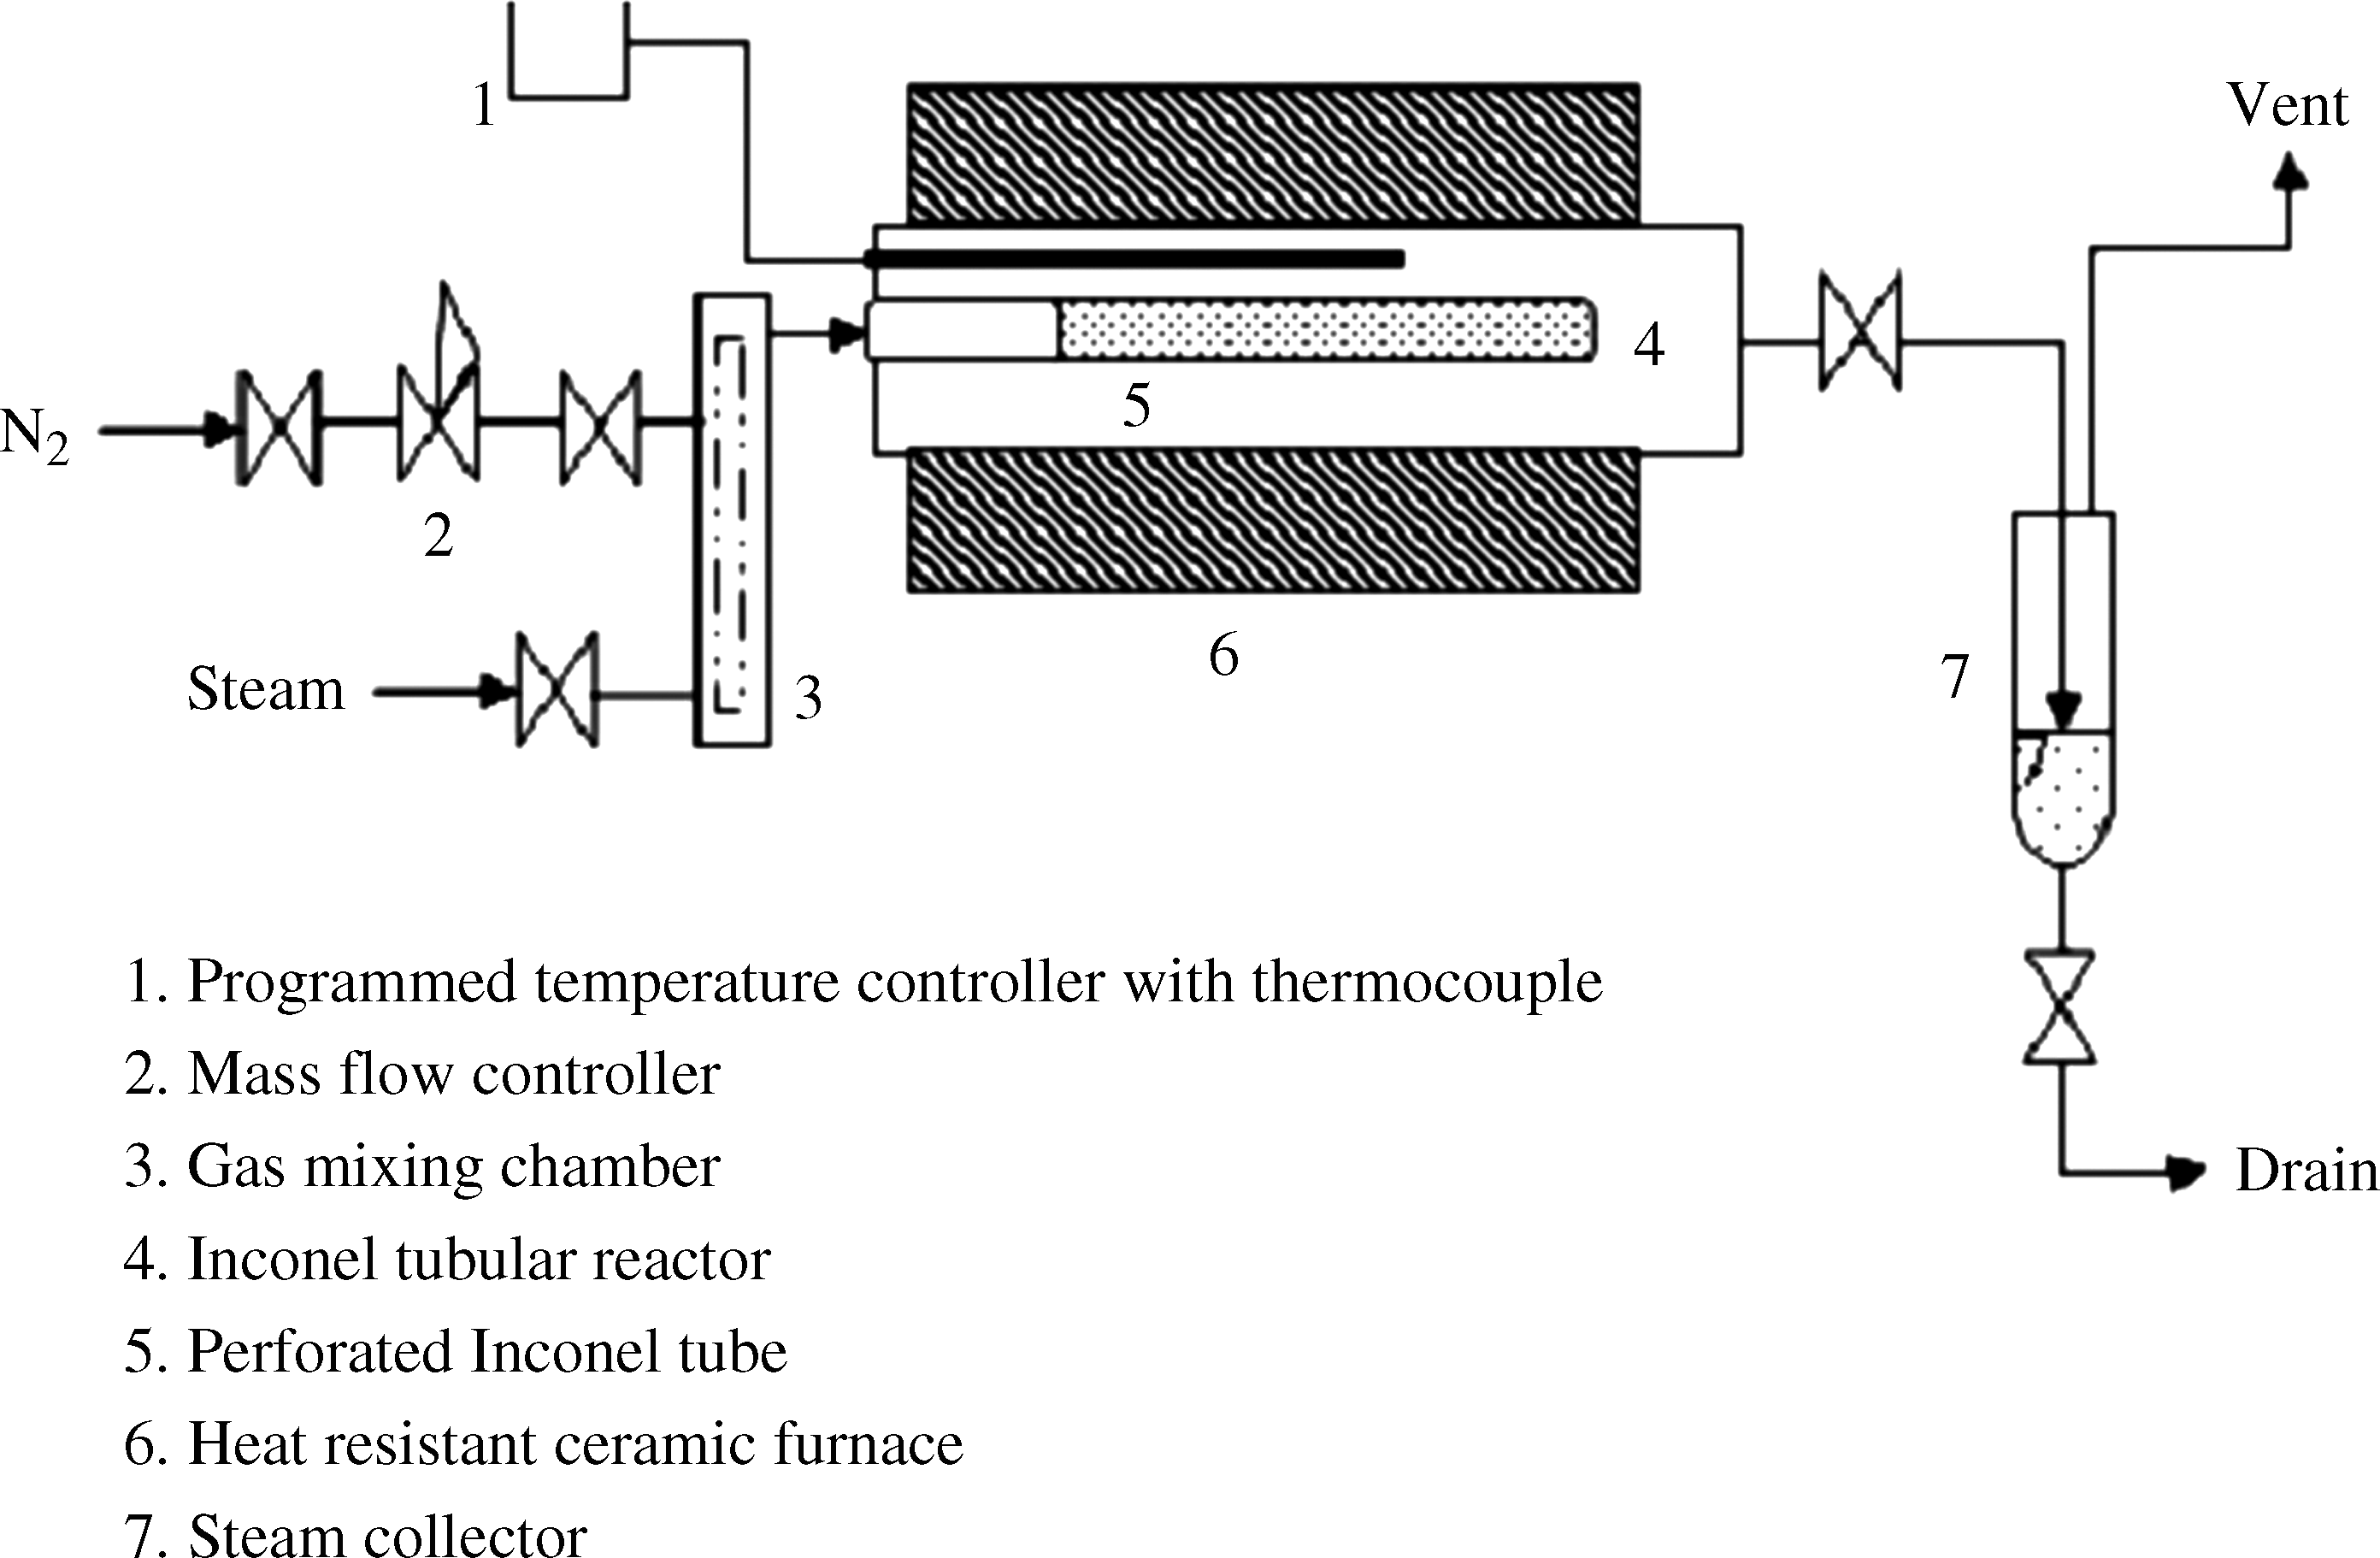
Experimental set-up for carbonization and activation of carbon fibers.
For carbonization, the raw samples were pyrolyzed at three different temperatures, 800°C, 900°C, and 1,000°C. The samples were heated up to the desired carbonization temperature at a constant rate of ∼5°C/min under a small N2 gas flow rate (0.4 slpm). Once the required temperature was achieved, the samples were further heated for 30–120 min. After carbonization, activation was carried out by steam, used as an oxidizing agent, at three different temperatures, 750°C, 850°C, and 900°C, for 30–120 min. After activation, the samples were cooled slowly up to the room temperature (25°C±5°C) at a rate of 5°C/min under N2 (0.4 slpm). Several heating rates varying between 1 and 15°C/min were employed during carbonization. We observed only a marginal enhancement in the BET area (maximum ∼10%) and an insignificant decrease (∼2%) in burn-off, with increase in the heating rate up to 10°C/min. Rapid heating (10°C/min) was also found to result in the loss of fiber integrity. In this study, a constant heating rate of 5°C/min was employed during carbonization for all samples.
Functionalization of ACFs
ACFs were washed with deionized water (DI) and dried in the still air. Figure 2 contains the schematic diagram of the experimental set up used for the functionalization of ACFs. The set-up consists of a round bottom flask with condenser mounted on it and a provision to place the fiber and functionalization agents in it. Water was used as the cooling fluid in the condenser. The flask was placed in the oil bath containing silicon oil, with heating coil.
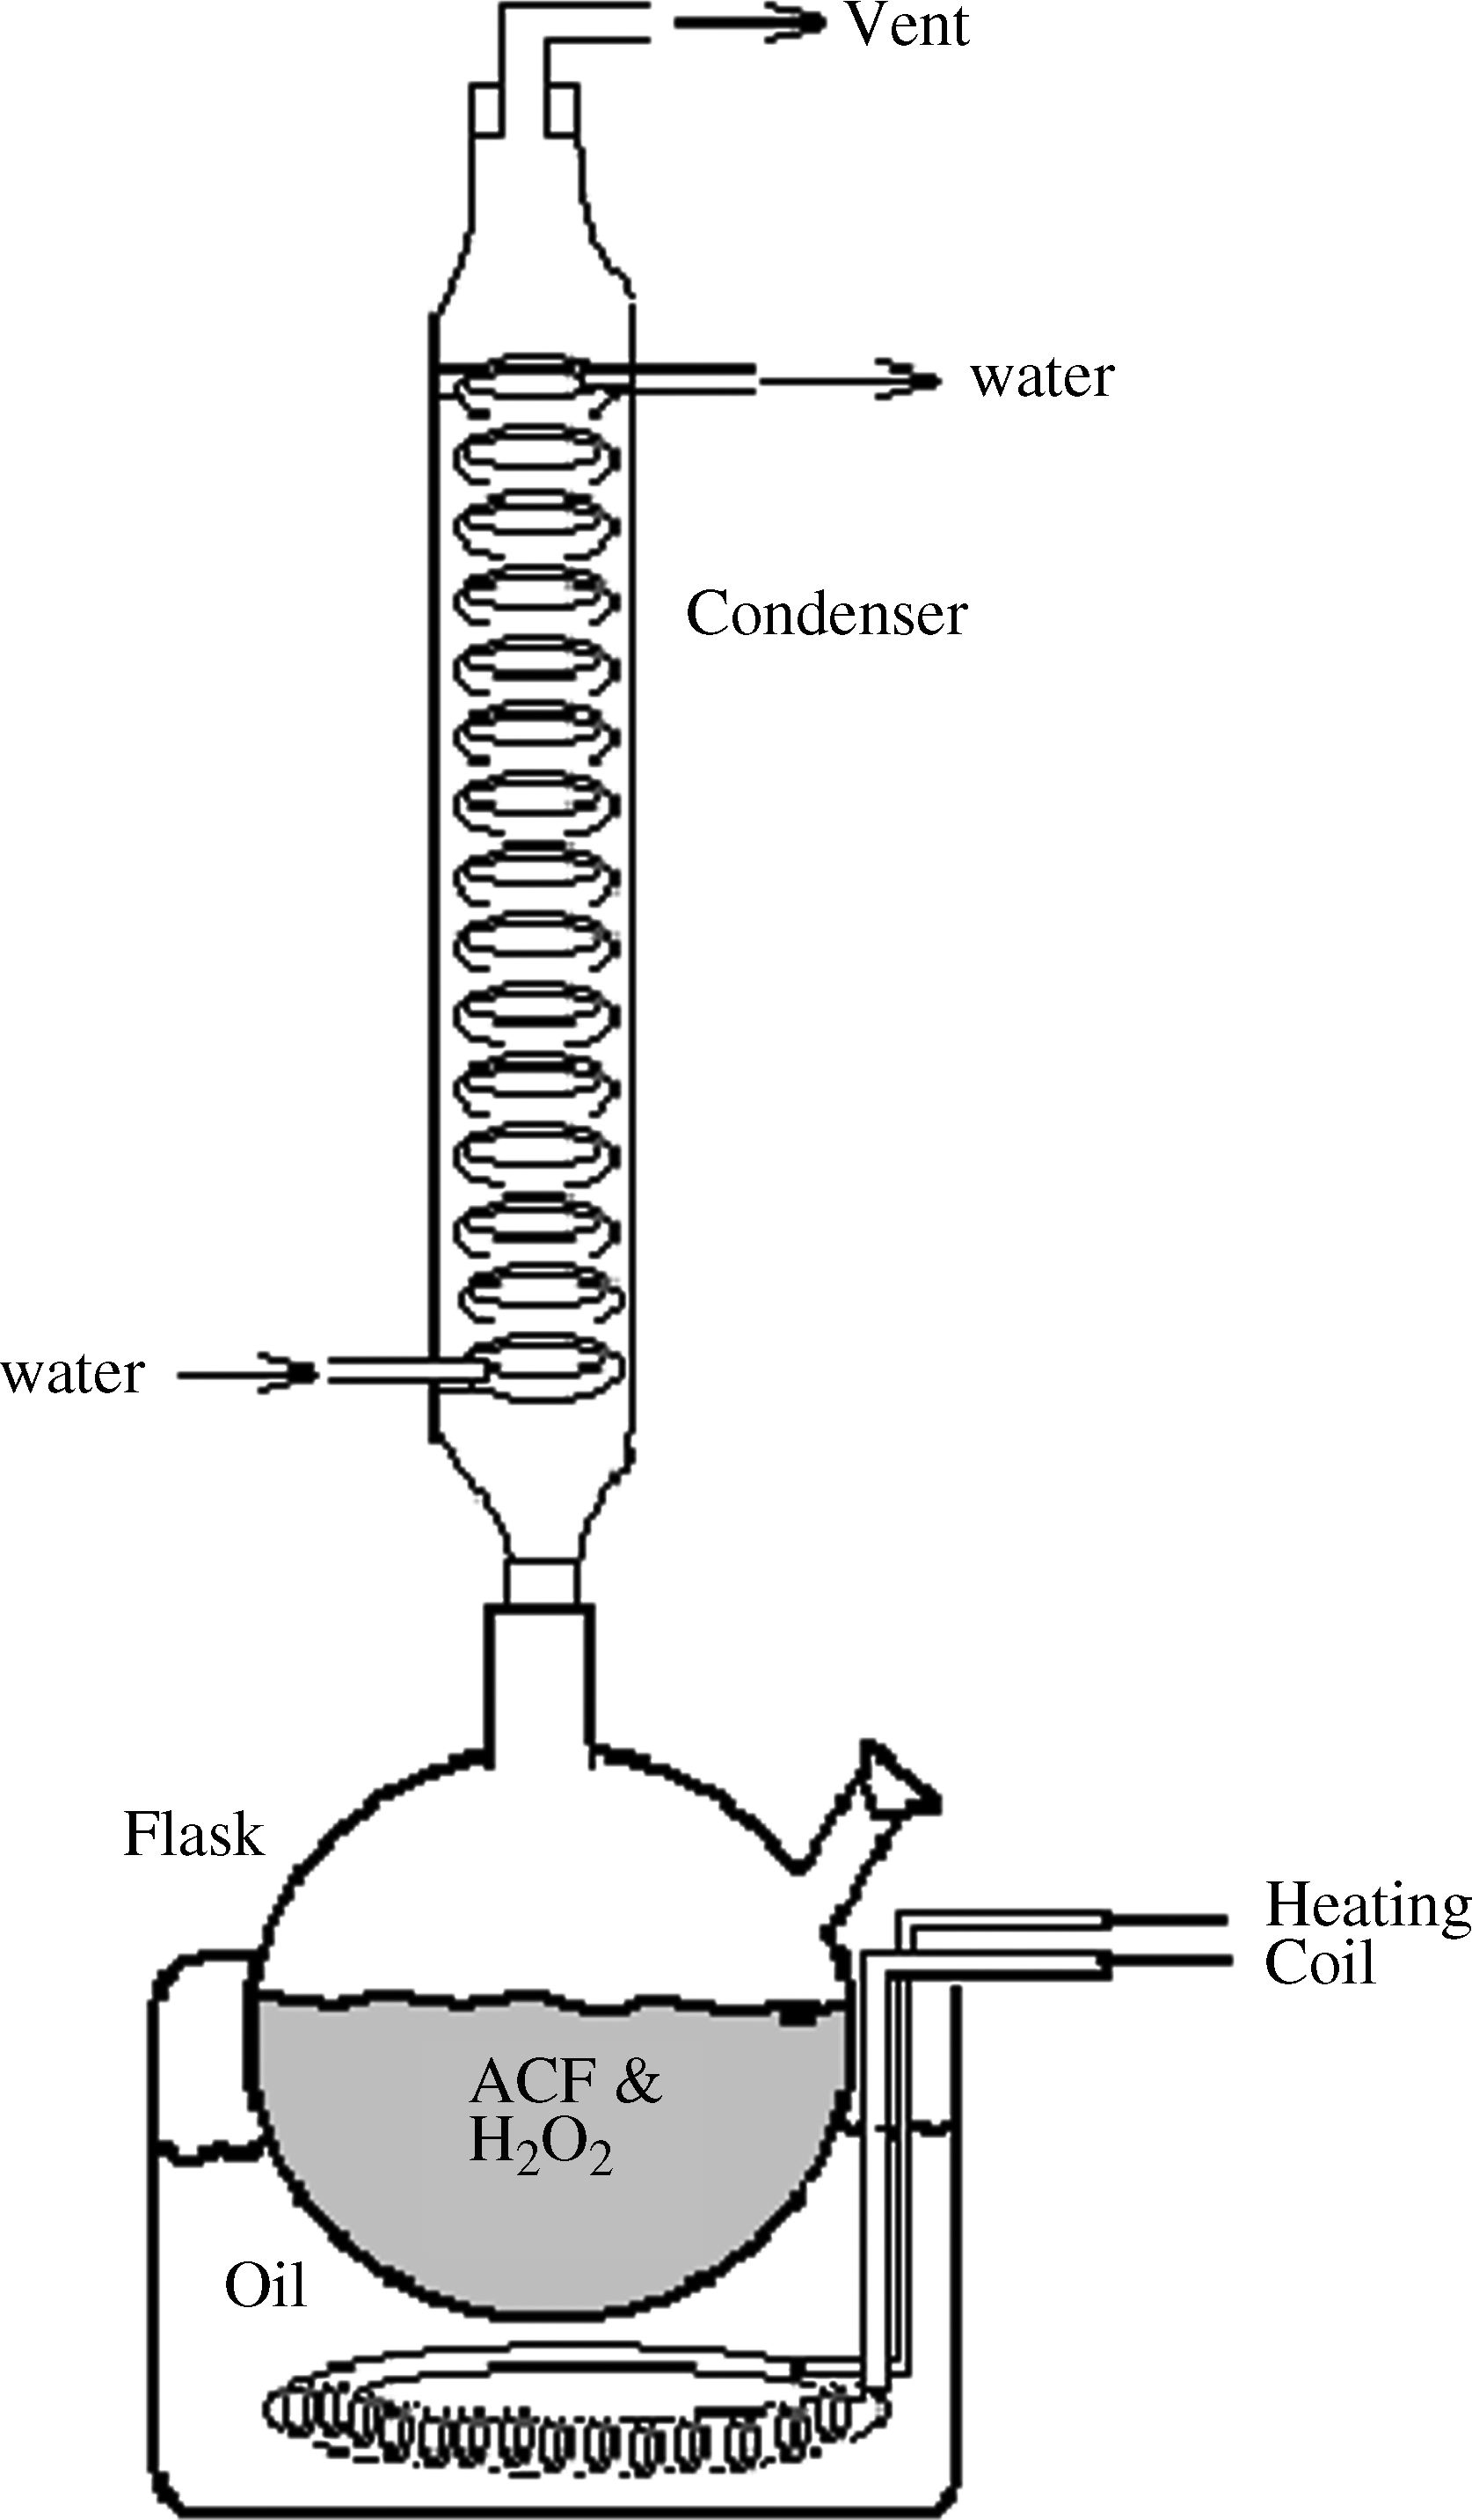
Experimental set-up for functionalization of ACF. ACF, activated carbon fiber.
To introduce oxygen-containing functional groups on the carbon-surface, ACFs were oxidized by H2O2 under different oxidation conditions, such as peroxide concentration, oxidation temperature, and functionalization time. Approximately 2 g of dried ACF was treated with 50 mL of H2O2 (30%) solution for 30 min to 3 h over the temperature range of 100°C–140°C at boiling condition. After oxidation, samples were removed and washed thoroughly with DI water until the pH was close to 7. Thereafter, the samples were dried at 90°C–120°C for 24 h in an electric oven having the PID temperature controller and digital display. The samples were stored in polythene bags and then in desiccators under vacuum to avoid adsorption of atmospheric moisture.
Surface characterization
The various surface characteristics of the prepared adsorbent samples were analyzed using several state-of-the-art analytical techniques including BET area and PSD analyzer, elemental analyzer (CHNSO), scanning electron microscopy (SEM), Fourier transform infra-red (FTIR), and UV-Vis spectrophotometer. The BET area, PSD, carbon-to-oxygen ratio, and oxygen functional groups of adsorbents were -correlated to the adsorption isotherms of MB on ACF.
Adsorption study
Stock solution was prepared by dissolving 1.0 g of MB in 1 L volume of DI water. The test solutions were prepared by diluting the stock solution to the different concentration levels. Several test samples each containing 100 mL volume of MB solution at different initial concentrations (100–1,000 mg/L) and different amounts (0.02–0.14 g) of ACF were taken in 150 mL glass flasks placed in a thermostat water-bath shaker. The temperature of the shaker was maintained constant at 30°C. Agitation was carried out at 100 rpm for 12 h. Then, the dye solutions were analyzed using a UV–Vis spectrophotometer (Model: Carry 100 Bio; Varian) at a wavelength of the maximum absorbance (668 nm). The lower limit of detection was 0.1 mg/L. Each sample was analyzed in triplicate, and the mean value was reported. Calibration was carried out daily with freshly prepared MB standards, before the sample analysis. The data obtained were in the deviation of±2% absolute accuracy.
The effect of pH on the adsorption of MB was also carried out over the pH range 4–11. The pH was adjusted using 0.01M NaOH and 0.01M HCl solutions. The amount of MB adsorbed at equilibrium was calculated by
Results and Discussions
Burn-off
Table 1 summarizes the weight losses (burn-off) of various ACF samples prepared at different activation temperatures and holding times. Activation temperature and time greatly affected the yield of ACFs. The temperatures below 750°C were found to be insufficient for the development of porosity in both ACF1 and ACF2 samples. The burn-off values for ACF1 and ACF2 samples increased with increasing activation temperature and holding time because of the large amount of volatile matter that was easily released at high temperatures (Carrott et al., 2001). As shown in Table 1, ACF1, the phenolic resin-based carbon fibers had higher (∼25%) burn-off values compared with those of ACF2, the viscose rayon-based fibers, at the same temperature and holding time. This might be because of the difference in the base material, the molecular structure, and chemical reactivity of the two precursors used in the study.
ACF, activated carbon fiber.
Surface area and PSD
The adsorption/desorption isotherms and pore volumes of the adsorbents were determined by the amounts of nitrogen adsorption-desorption measured at 77 K, using Autosorb-1C instrument (Model: AS1-C; Quantachrome). The samples were kept at 200°C under vacuum for degassing. Total surface area and pore volume were determined using the BET equation over a relative pressure range of 0.05–0.30. The PSD analysis was carried out using the data reduction software of the instrument. The PSD was calculated from desorption isotherms by the method of Barrett, Joyner, and Halenda for mesopores (2–40 nm). The Barrett, Joyner, and Halenda method is based on the modified Kelvin equation for the prediction of pressure at which solute will spontaneously adsorb/condense (and desorb/evaporate) on the pore walls. Such a method is acceptable for the broad size distributions of medium to large mesopores. The micropores (<2 nm) were calculated from the density functional theory, in particular nonlocal density functional theory, assuming slit type pores in ACF. Macropores consisted of pores with size >40 nm, as per the IUPAC norms (Zdravkov et al., 2007; Shiratori et al., 2009). All prepared adsorbent samples were analyzed in duplicate. The data obtained were within the deviation of±5% absolute accuracy.
Figure 3 describes the typical N2-adsorption isotherms obtained for the ACF samples. The plots are presented for ACF1 activated at different activation temperatures and at constant activation time (30 min). Table 2 presents the data for the specific surface area, total and micropore volume, PSD, and the average pore size as a function of activation temperature, holding time, and precursor types. From the table, one can observe that specific surface area, total pore volume, micropore, and mesopore volumes of the carbon fibers prepared at different temperatures increased significantly on activation. However, decrease in the average pore diameter was observed. At 900°C and the activation time greater than 30 min, decrease in surface area and pore volume were observed in ACF1. This was attributed to the fact that at high levels of the burn-off, pore walls either broke or were blocked, thus resulting in a decrease of the BET area and pore volume. From the data presented in Table 2, one can also observe that the average pore diameter of ACF1 samples decreased with activation temperature and time. However, an increase in the average pore diameter of ACF2 samples was observed. Increase in micropore volume was observed with increasing activation temperature and time. The proportional development of micropore volume of ACF1 was larger compared with that of ACF2 under identical conditions. Mesopore volume of ACF2 samples was found to predominately increase. The same trend was not observed in ACF1 with increasing temperature and time. Based on the burn-off values, specific surface area, and PSD, the optimum activation conditions were set at 900°C and 30 min for ACF1, and 900°C and 60 min for ACF2. As shown later for the isotherm data, the adsorption of MB was found to increase with increasing BET area and micropore volume.

N2-Adsorption isotherms of ACF1 activated at different temperatures and 60 min.
SBET, surface area; Vt, total pore volume; Vm, micro pore volume; Davg, average pore diameter; PSD, pore size distribution.
Table 3 summarizes the specific surface area and total pore volume of ACF1, ACF1-H2O2, ACF2, and ACF2-H2O2 samples. The surface area and total pore volume of ACF1 were obtained as 1,740 m2/g and 0.937 cc/g, respectively, and those of ACF2 were 2,280 m2/g and 1.40 cc/g, respectively. The surface area and pore volume decreased after surface functionalization with H2O2. It has been reported that specific surface area considerably decreases due to the blocking of narrow pores by the surface complexes incorporated by nitric acid treatment (Kutics and Suzuki, 1990). It is also reported that the stability of the graphite basal planes is large (Chen et al., 2003). Therefore, it is expected that oxygen surface groups are located at the edges of the basal planes which are relatively weaker sites of carbon structure, and oxidation progresses slowly into the basal planes. In a related study, carbon fibers were oxidized by concentrated nitric acid at 115°C to enhance their adhesion to the polymeric resin matrices (Pittman et al., 1997). It was observed that the BET surface areas were smaller than those obtained by the uptake of MB and NaOH. The difference was caused by pores, voids, and cracks that can partially open or swell in the presence of aqueous base. These pores are closed and not evaluated during BET measurements, in spite of the small molecular size of nitrogen gas (Lozano-Castello et al., 2004).
FTIR spectroscopy analysis
The transmission infrared analysis of prepared adsorbents was performed by using the FTIR spectrometer (Model: Tensor 27; Bruker), which consisted of DLaTGS detector with KBr window and attenuated total reflectance accessory. Samples and KBr powder were first dried at a temperature of 100°C for 6 h to remove moisture. The dried samples were powdered and mixed with KBr in the ratio of 1:100. FTIR spectra were recorded at a resolution of 4 cm−1 with 16 scans per sample and an aperture setting of 15. A previously recorded background spectrum of pure KBr was subtracted from the spectrum of each sample. FTIR absorption spectra were also recorded using attenuated total reflectance and then converted into transmittance form. These spectra were used to ascertain the presence of various chemical functional groups on the adsorbent surface. The samples were analyzed in duplicate. The (wave-length) position of the observed peaks on the spectrum was within the±0.1% deviation (or shift).
Figure 4 describes the spectra of ACF1 activated for 30 min at three different temperatures. The intensity of the peak at 1,020 cm−1 assigned to C-N stretching vibration decreases. The peaks at 3,750 cm−1 attributed to free hydroxyl groups, those at 3,450 cm−1 assigned to OH stretch from carboxylic groups (COOH), and those at 1,710 cm−1 assigned to C=O stretching vibrations increase with increasing activation temperature and time. The peak at 1,560 cm−1, assigned to N-H bending, also increases with increasing activation temperature. The weak bands near 2,300 cm−1 are assigned to carbon–oxygen groups due to ketone. The peak at 2,370 cm−1 can be assigned to the OH stretch from strongly H-bond-COOH. The peak at 850 cm−1 is assigned to N-H wagging vibrations. A similar trend was observed for the samples activated for 60 and 120 min. With the aid of these FTIR spectra, we concluded that acidic and basic functional groups were developed during activation with steam.
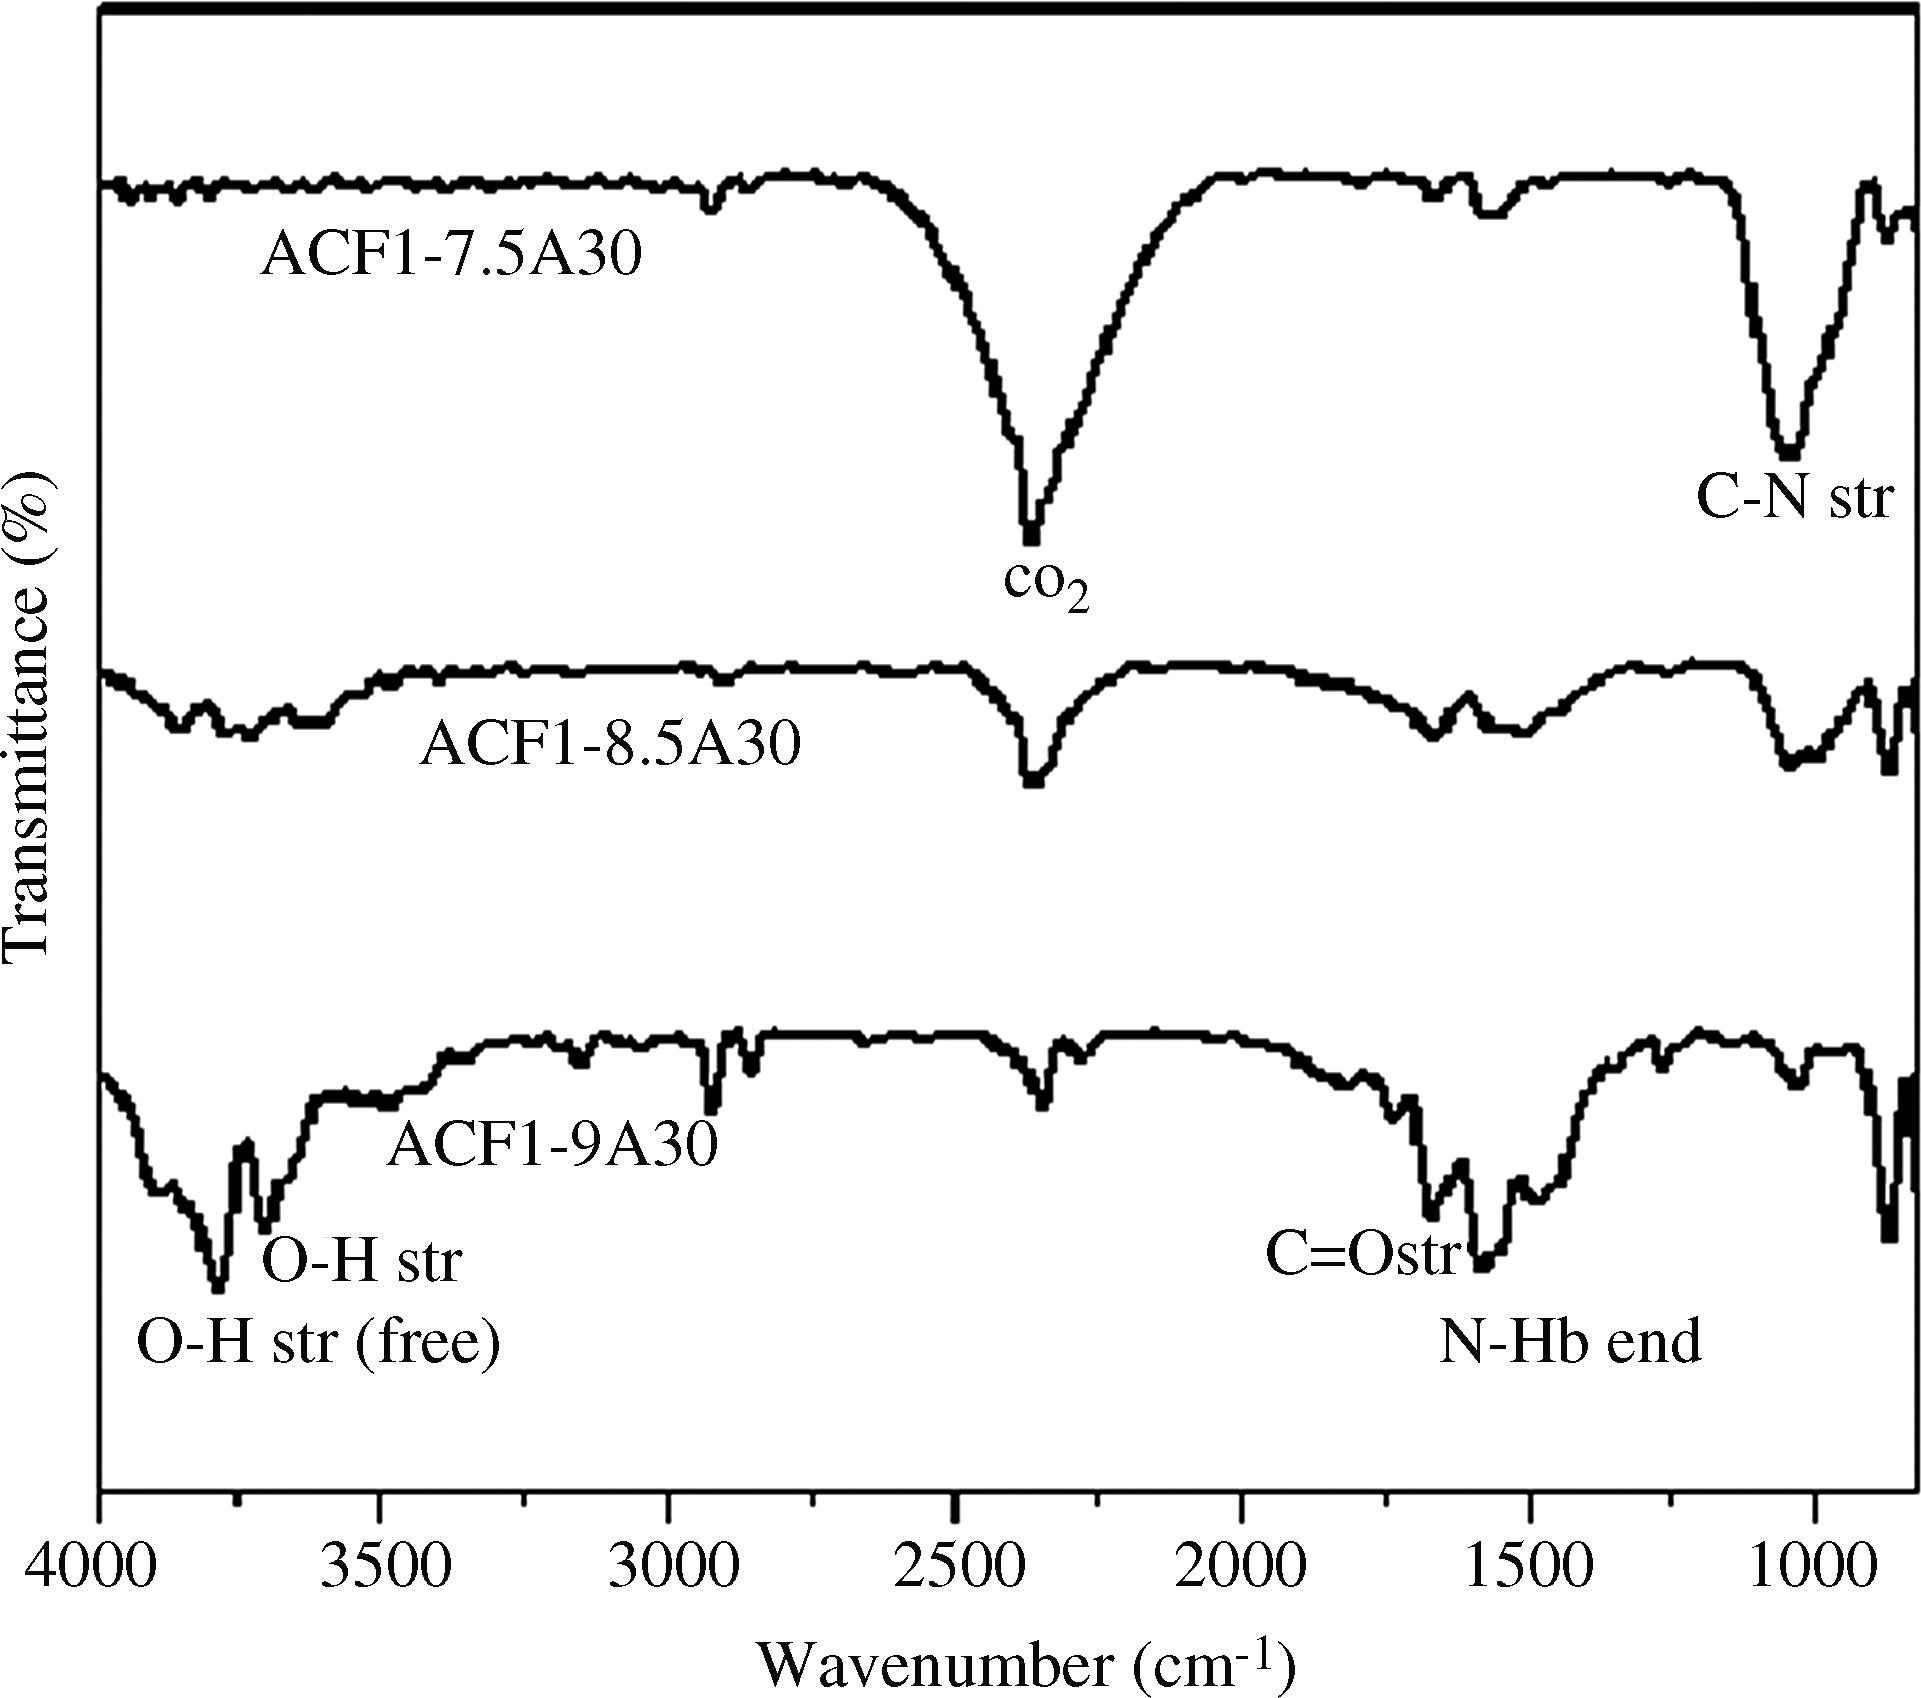
FTIR spectra of ACF1 activated for 30 min at different temperatures.
Figure 5 describes the FTIR spectra of ACF2 samples prepared at different temperatures and the identical activation time. As observed, the intensity of the peaks at 3,700–3,400 and 1,560 cm−1 decreased with increasing temperature, contrary to the trend observed for the ACF1 samples. We attribute the contradictory behavior to the presence of different surface groups in the base material (Fu et al., 2003; Shen et al., 2008a, 2008b; Xie et al., 2010).
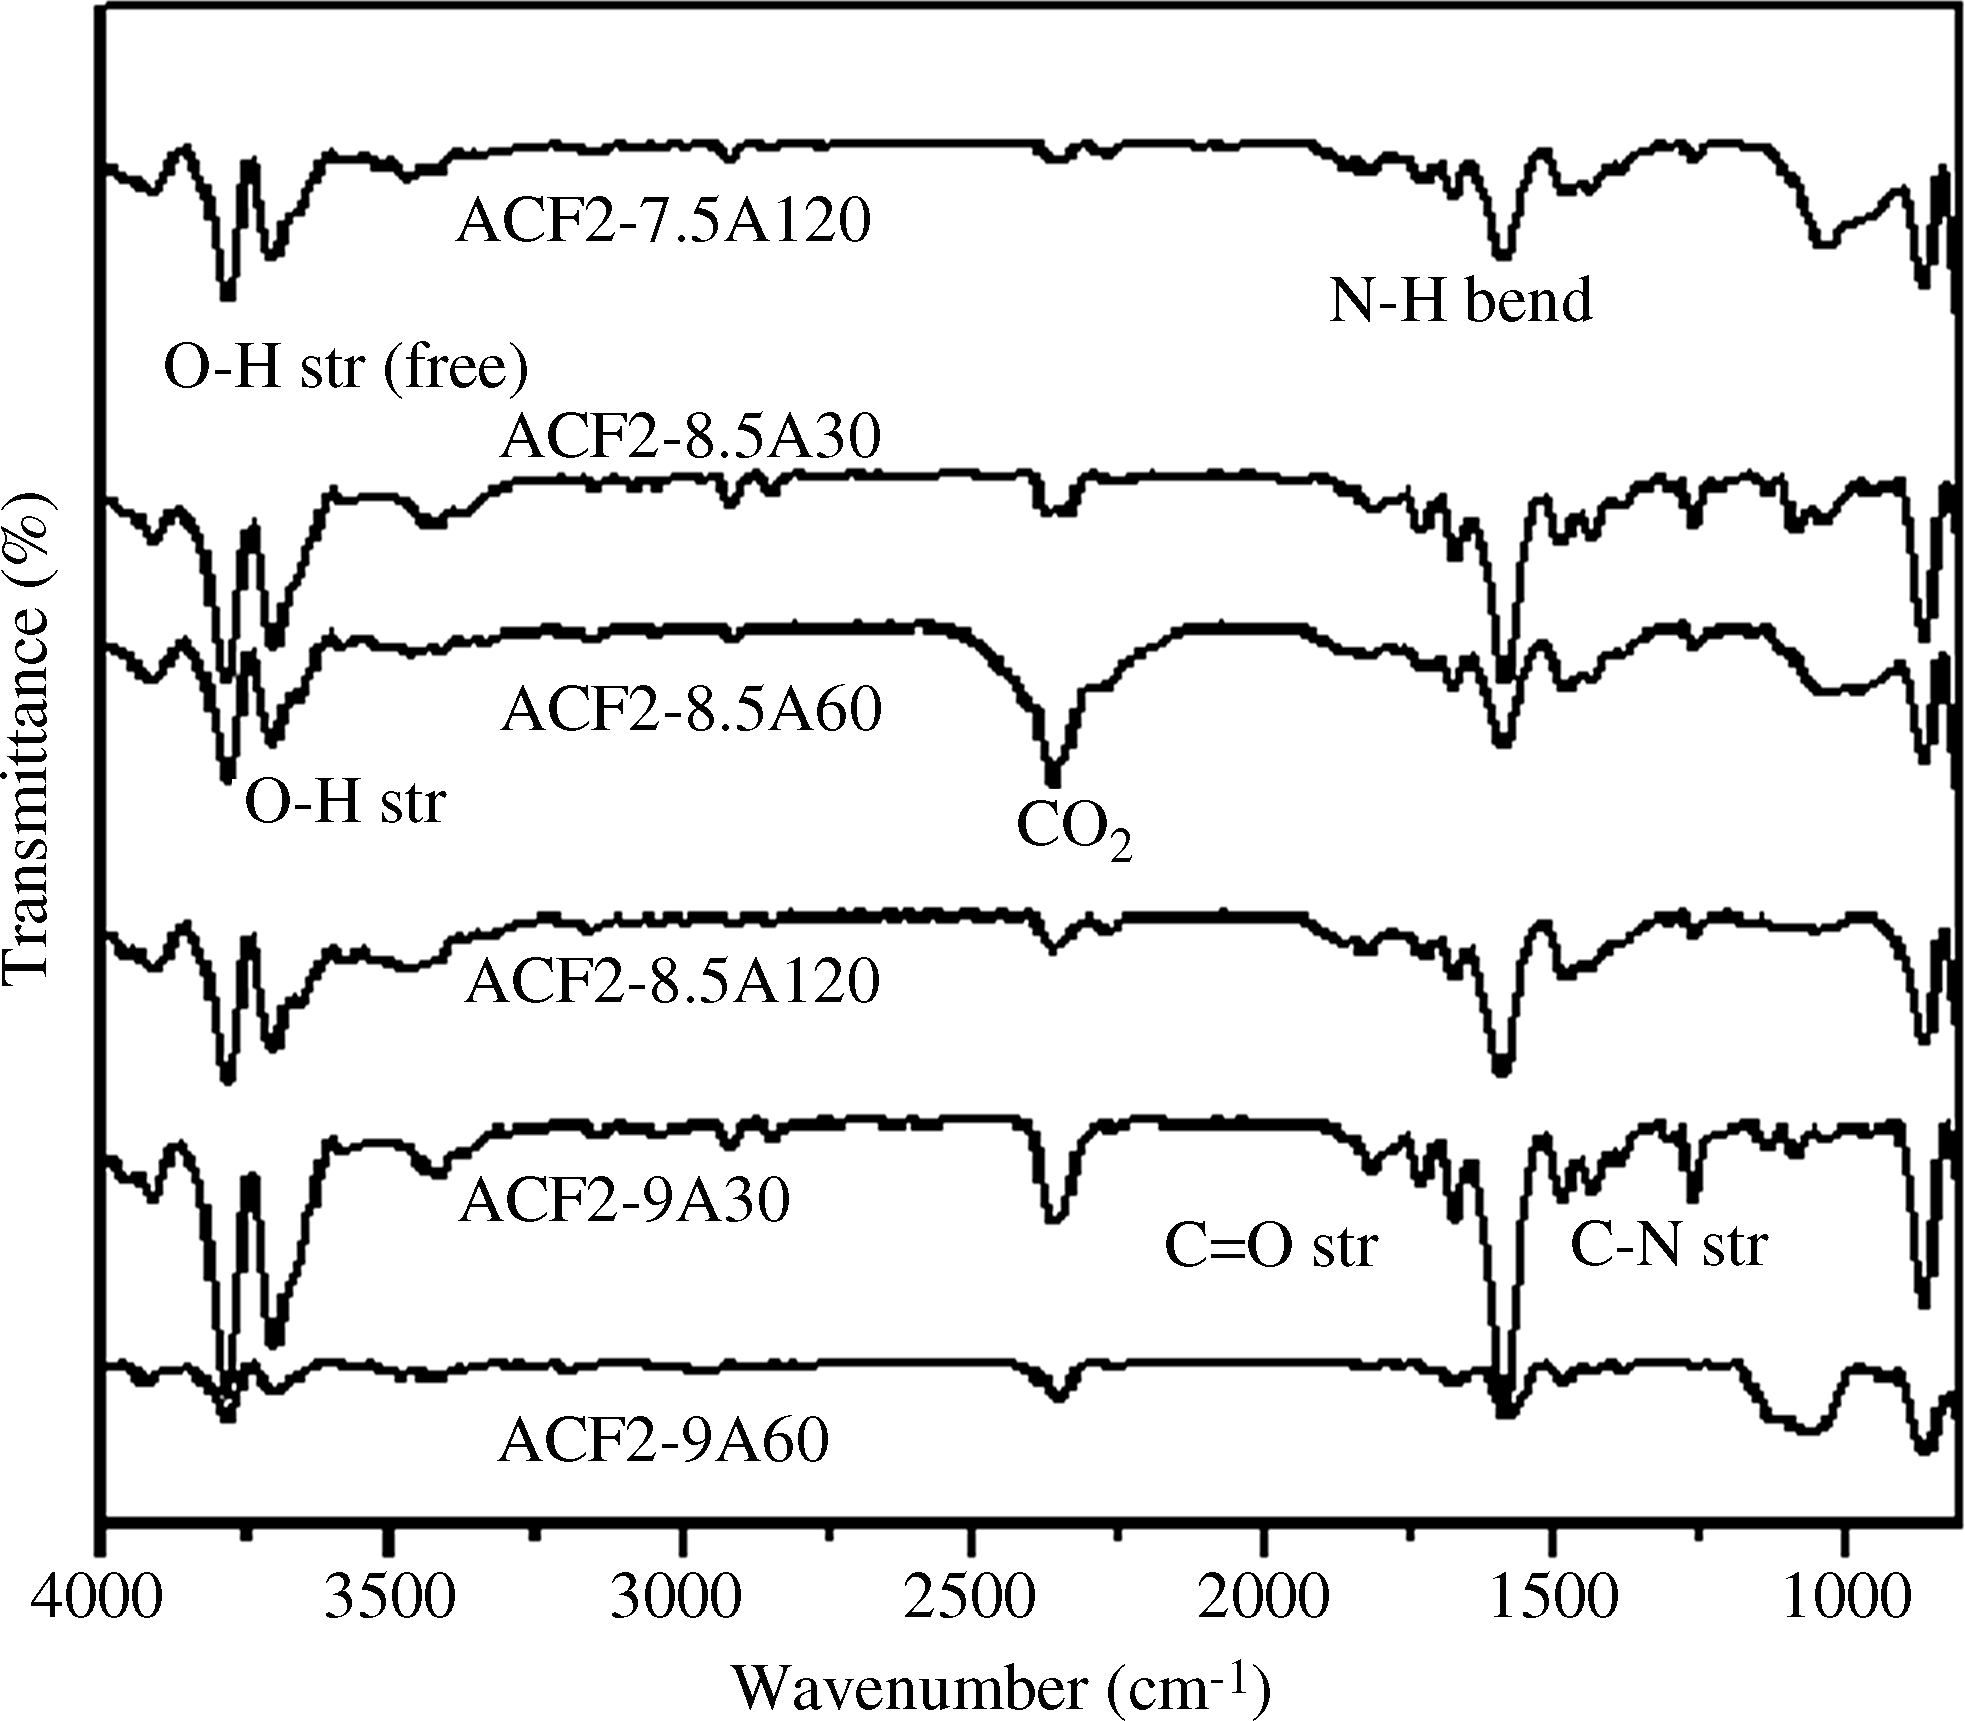
FTIR spectra of ACF2 activated at different conditions.
The FTIR spectra of the functionalized and untreated ACFs are described in Fig. 6. Modified ACFs samples showed a few pronounced peaks at wave numbers 1,240, 1,560, and 1,750 cm−1. The spectra for ACF1 and ACF2 showed similarities, suggesting that these samples possessed similar groups on their surfaces. Peaks between 1,760 and 1,665 cm−1 are assigned to −C=O stretching vibrations of ketone, aldehyde, carboxylic acid, ester, or carbonyl groups, and those between 1,650 and 1,585 cm−1 are assigned to N-H bending and C-C stretching. Peaks between 1,300 and 1,150 cm−1 are assigned to C-N stretching vibrations and C-H wagging. From the spectra, it was concluded that ACF can be functionalized to incorporate various surface functional groups. It has also been reported that the modification of carbon material by H2O2 results in the incorporation of carboxylic, lactone, carboxyl, and carbonyl surface groups (Gan and Wu, 2008).
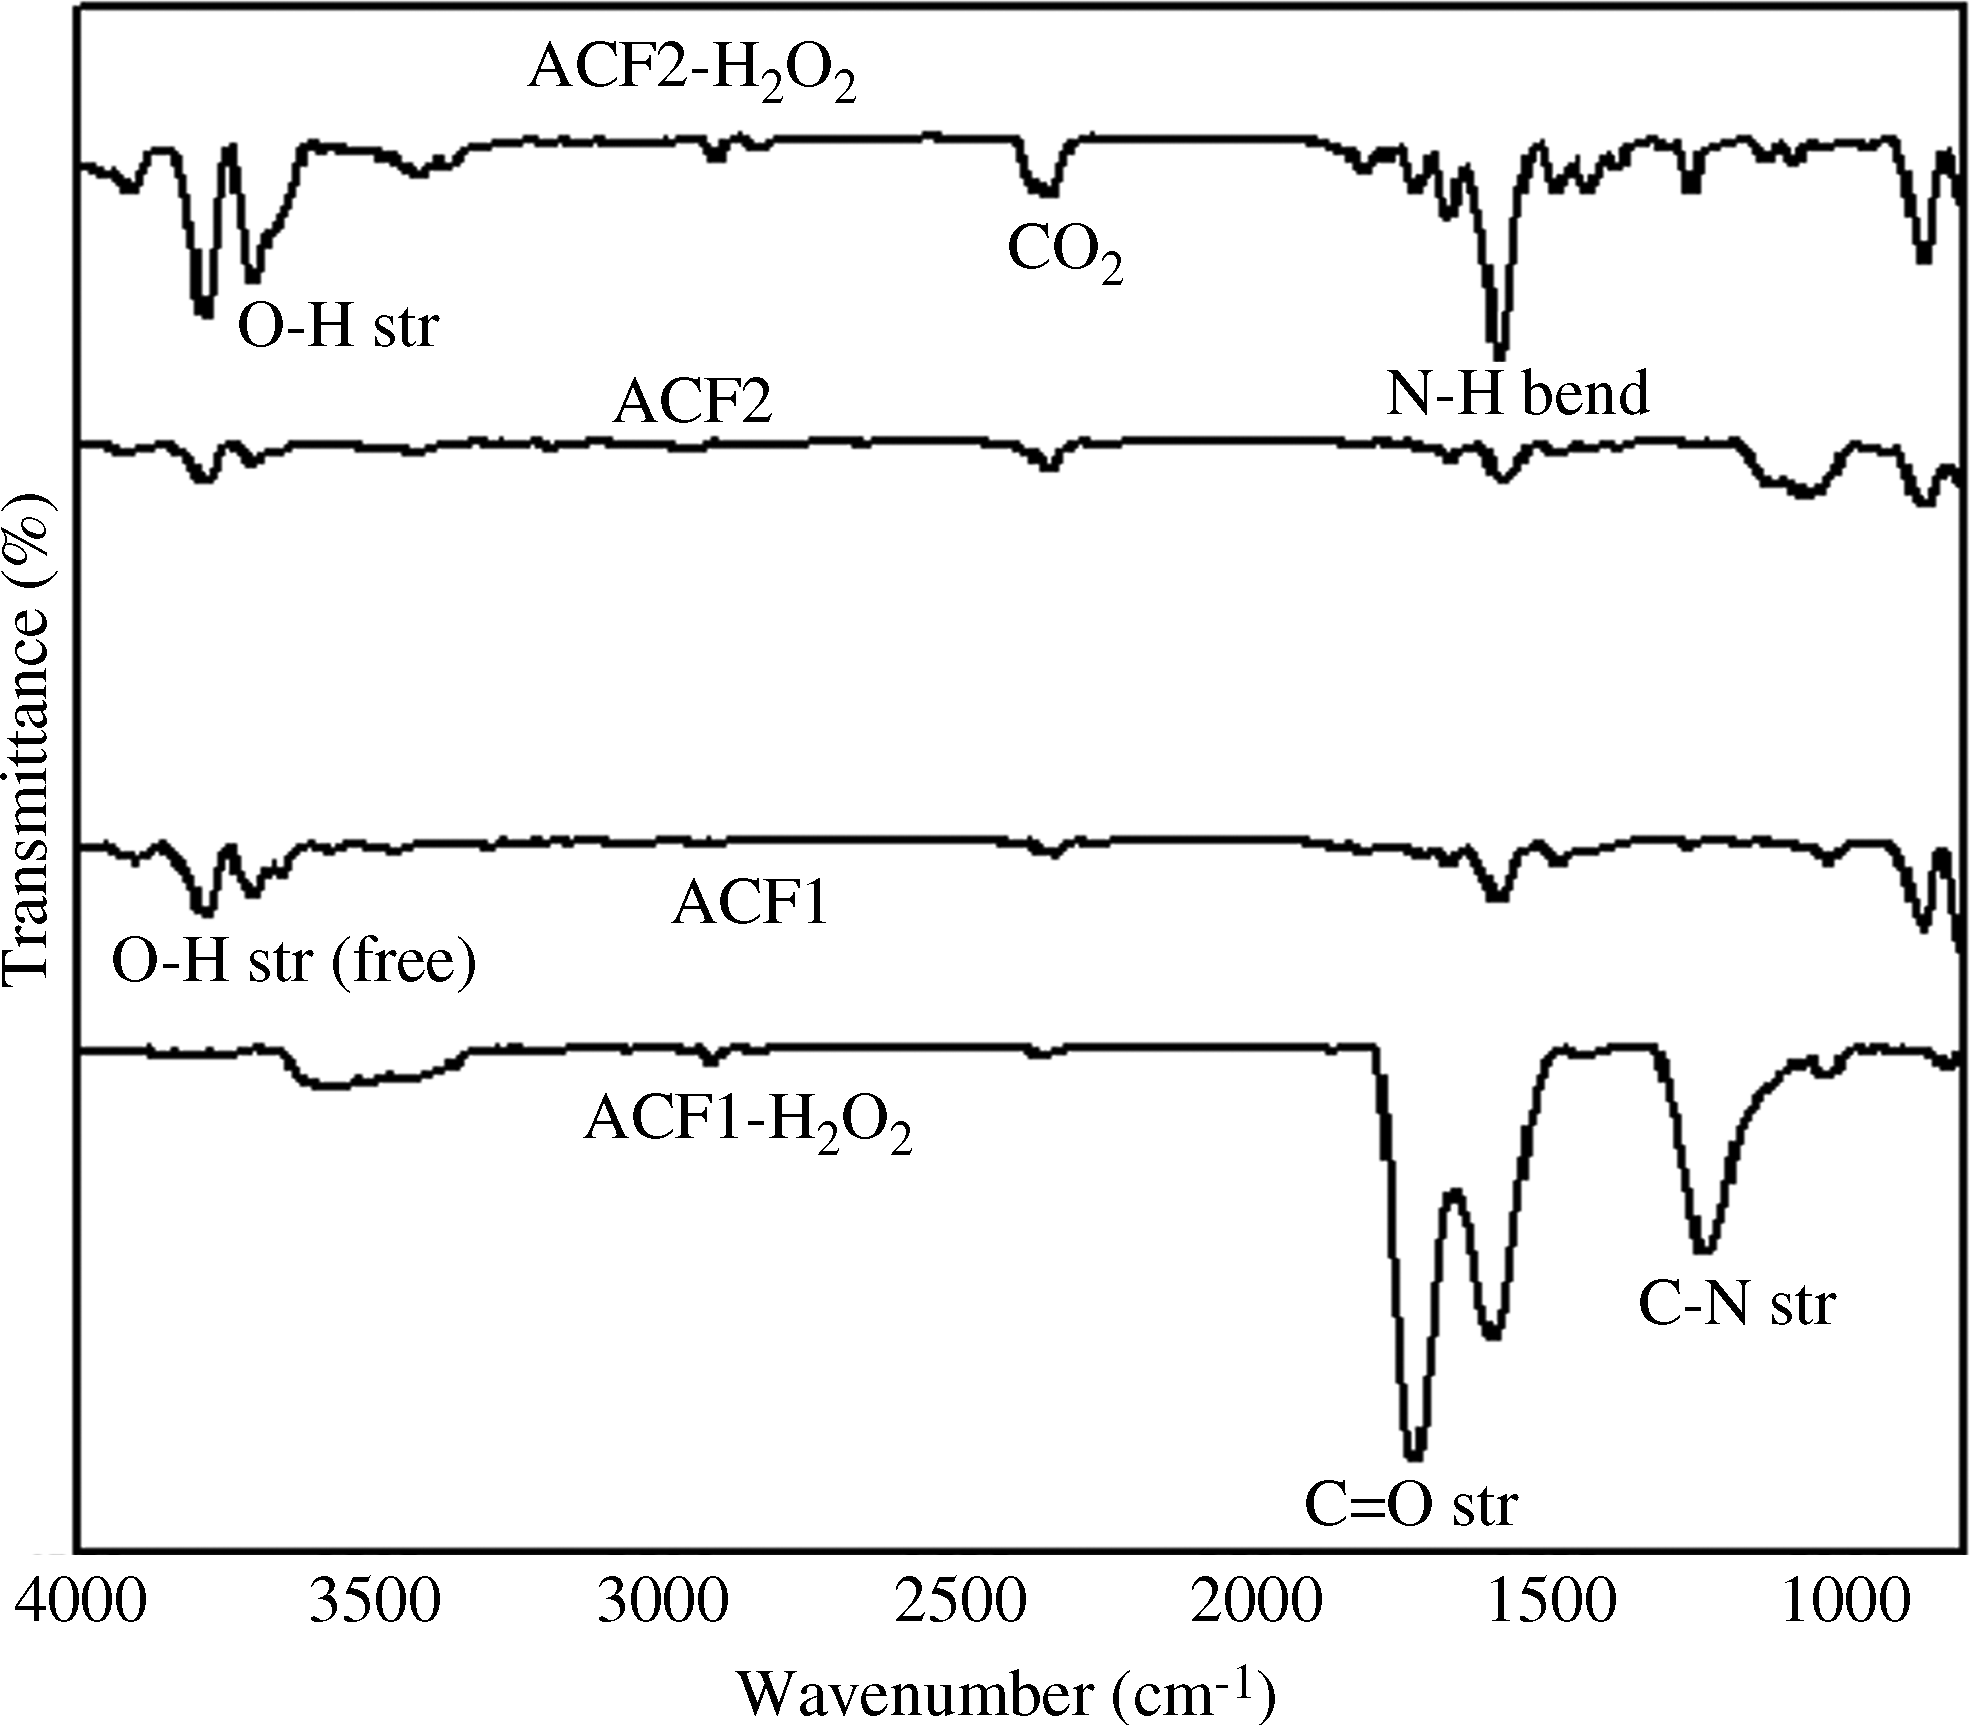
FTIR spectra of different ACF samples.
Scanning electron microscopy
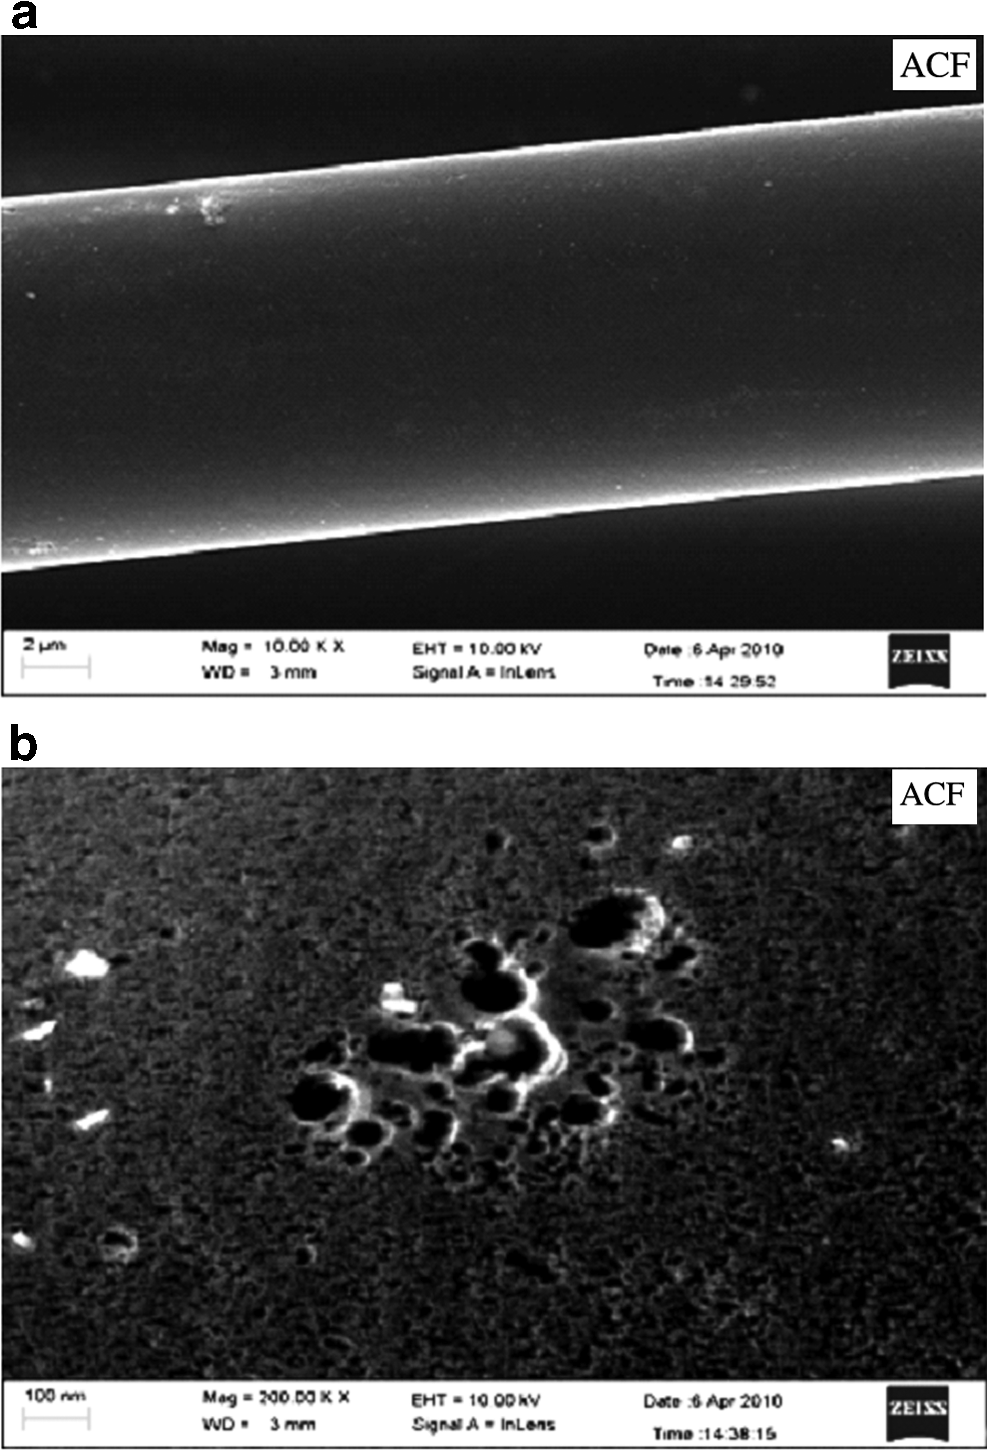
The surface morphology of ACF was examined by the SEM (Model: FE-SEM, Supra 40 VP; Zeiss). All images were taken with in-lens detector at accelerating voltage of 10 kV and filament current 2.37 A at a working distance of 2–4 mm. The SEM images and prepared samples were taken at a number of locations on the samples. As observed from the SEM image of ACF1 shown in Fig. 7a and b, the surface of carbon fibers was smooth and porous.
Elemental analysis
The elemental analysis of the ACF samples was carried out by CHNSO elemental analyzer (Model: CE-440 EL; Exeter Analytical Inc) to determine the percentage (w/w) amounts of C, H, N, and O present in the ACF1 samples. All samples were analyzed in duplicate, and the mean values were reported in the article. The data obtained were in the deviation of±0.3% absolute accuracy. The results are reported in Table 4. The carbon content is observed to increase because of activation. However, the percentage contents of hydrogen, oxygen, and nitrogen decrease after activation. The O/C ratio also decreases compared with that in the raw carbon fibers.
Oxygen contents calculated by difference.
Adsorption data
Figure 8 describes the equilibrium concentrations of MB in the solid phase as a function of the aqueous phase concentration for four types of samples: ACF1, ACF2, and H2O2 treated ACF1 and ACF2. All adsorption data are reported for 30°C±2°C. The initial aqueous phase concentration range varied from 100 to 1,000 ppm (mg/L). For each sample, concentrations in the solid phase were observed to increase with increasing solution concentrations. After a certain threshold concentration, the results showed saturation of the adsorbent.
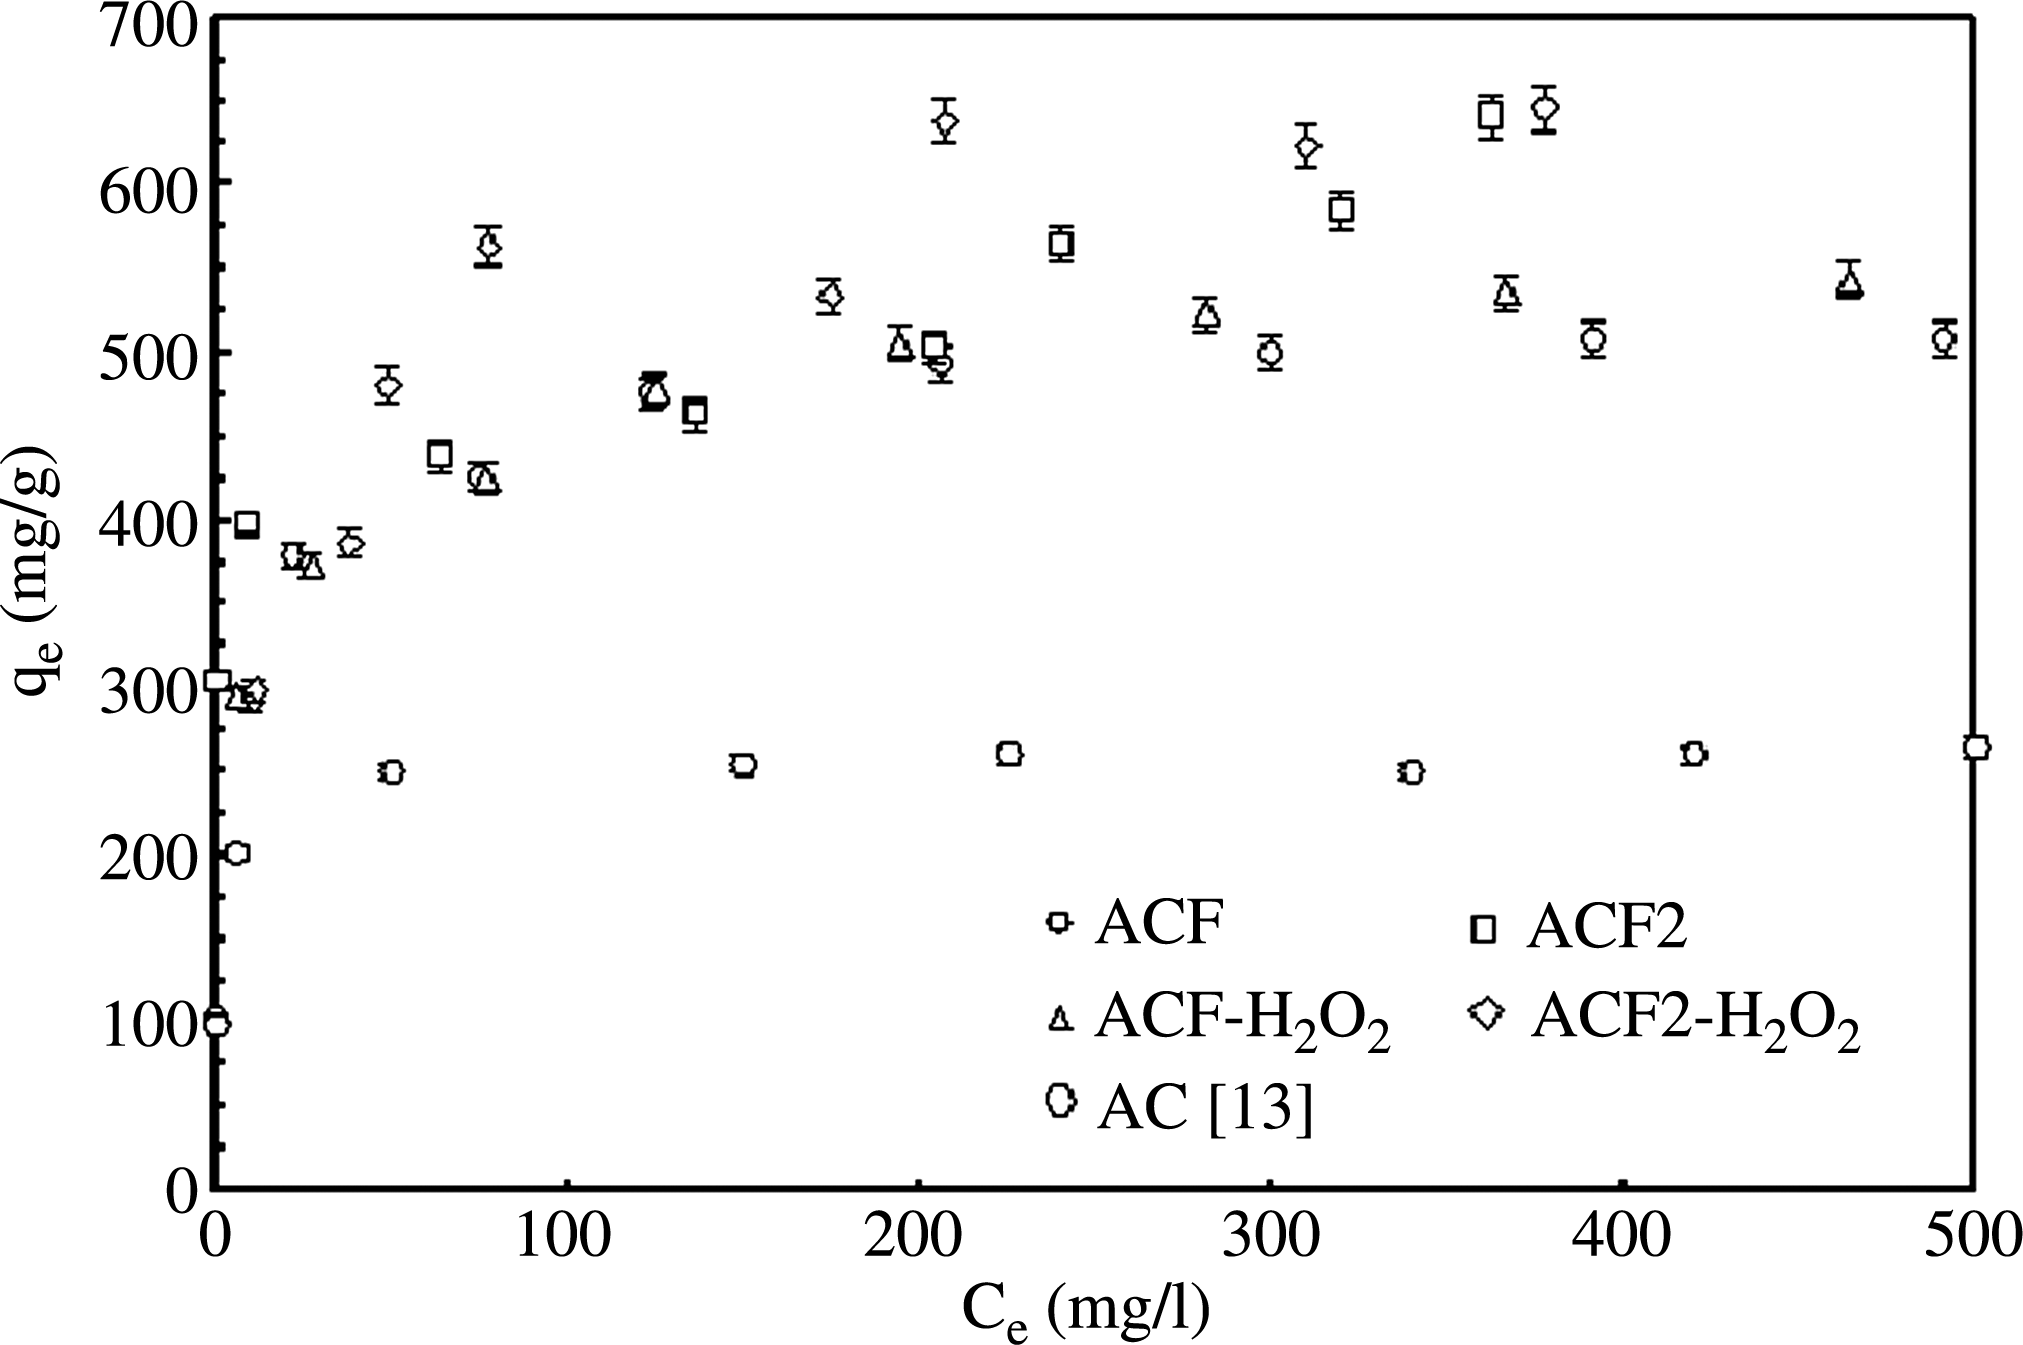
Adsorption isotherms of MB on various adsorbents. MB, methylene blue.
From the data shown in Fig. 8, it was concluded that the ACF samples functionalized with H2O2 had larger adsorption capacity compared with that of the untreated ACF. However, ACF2 modified with H2O2 had larger adsorption capacity compared with that for the functionalized ACF1. In summary, the adsorption capacity of MB on various adsorbents samples prepared in this study is in the following order: ACF2-H2O2>ACF2>ACF1>ACF1-H2O2.
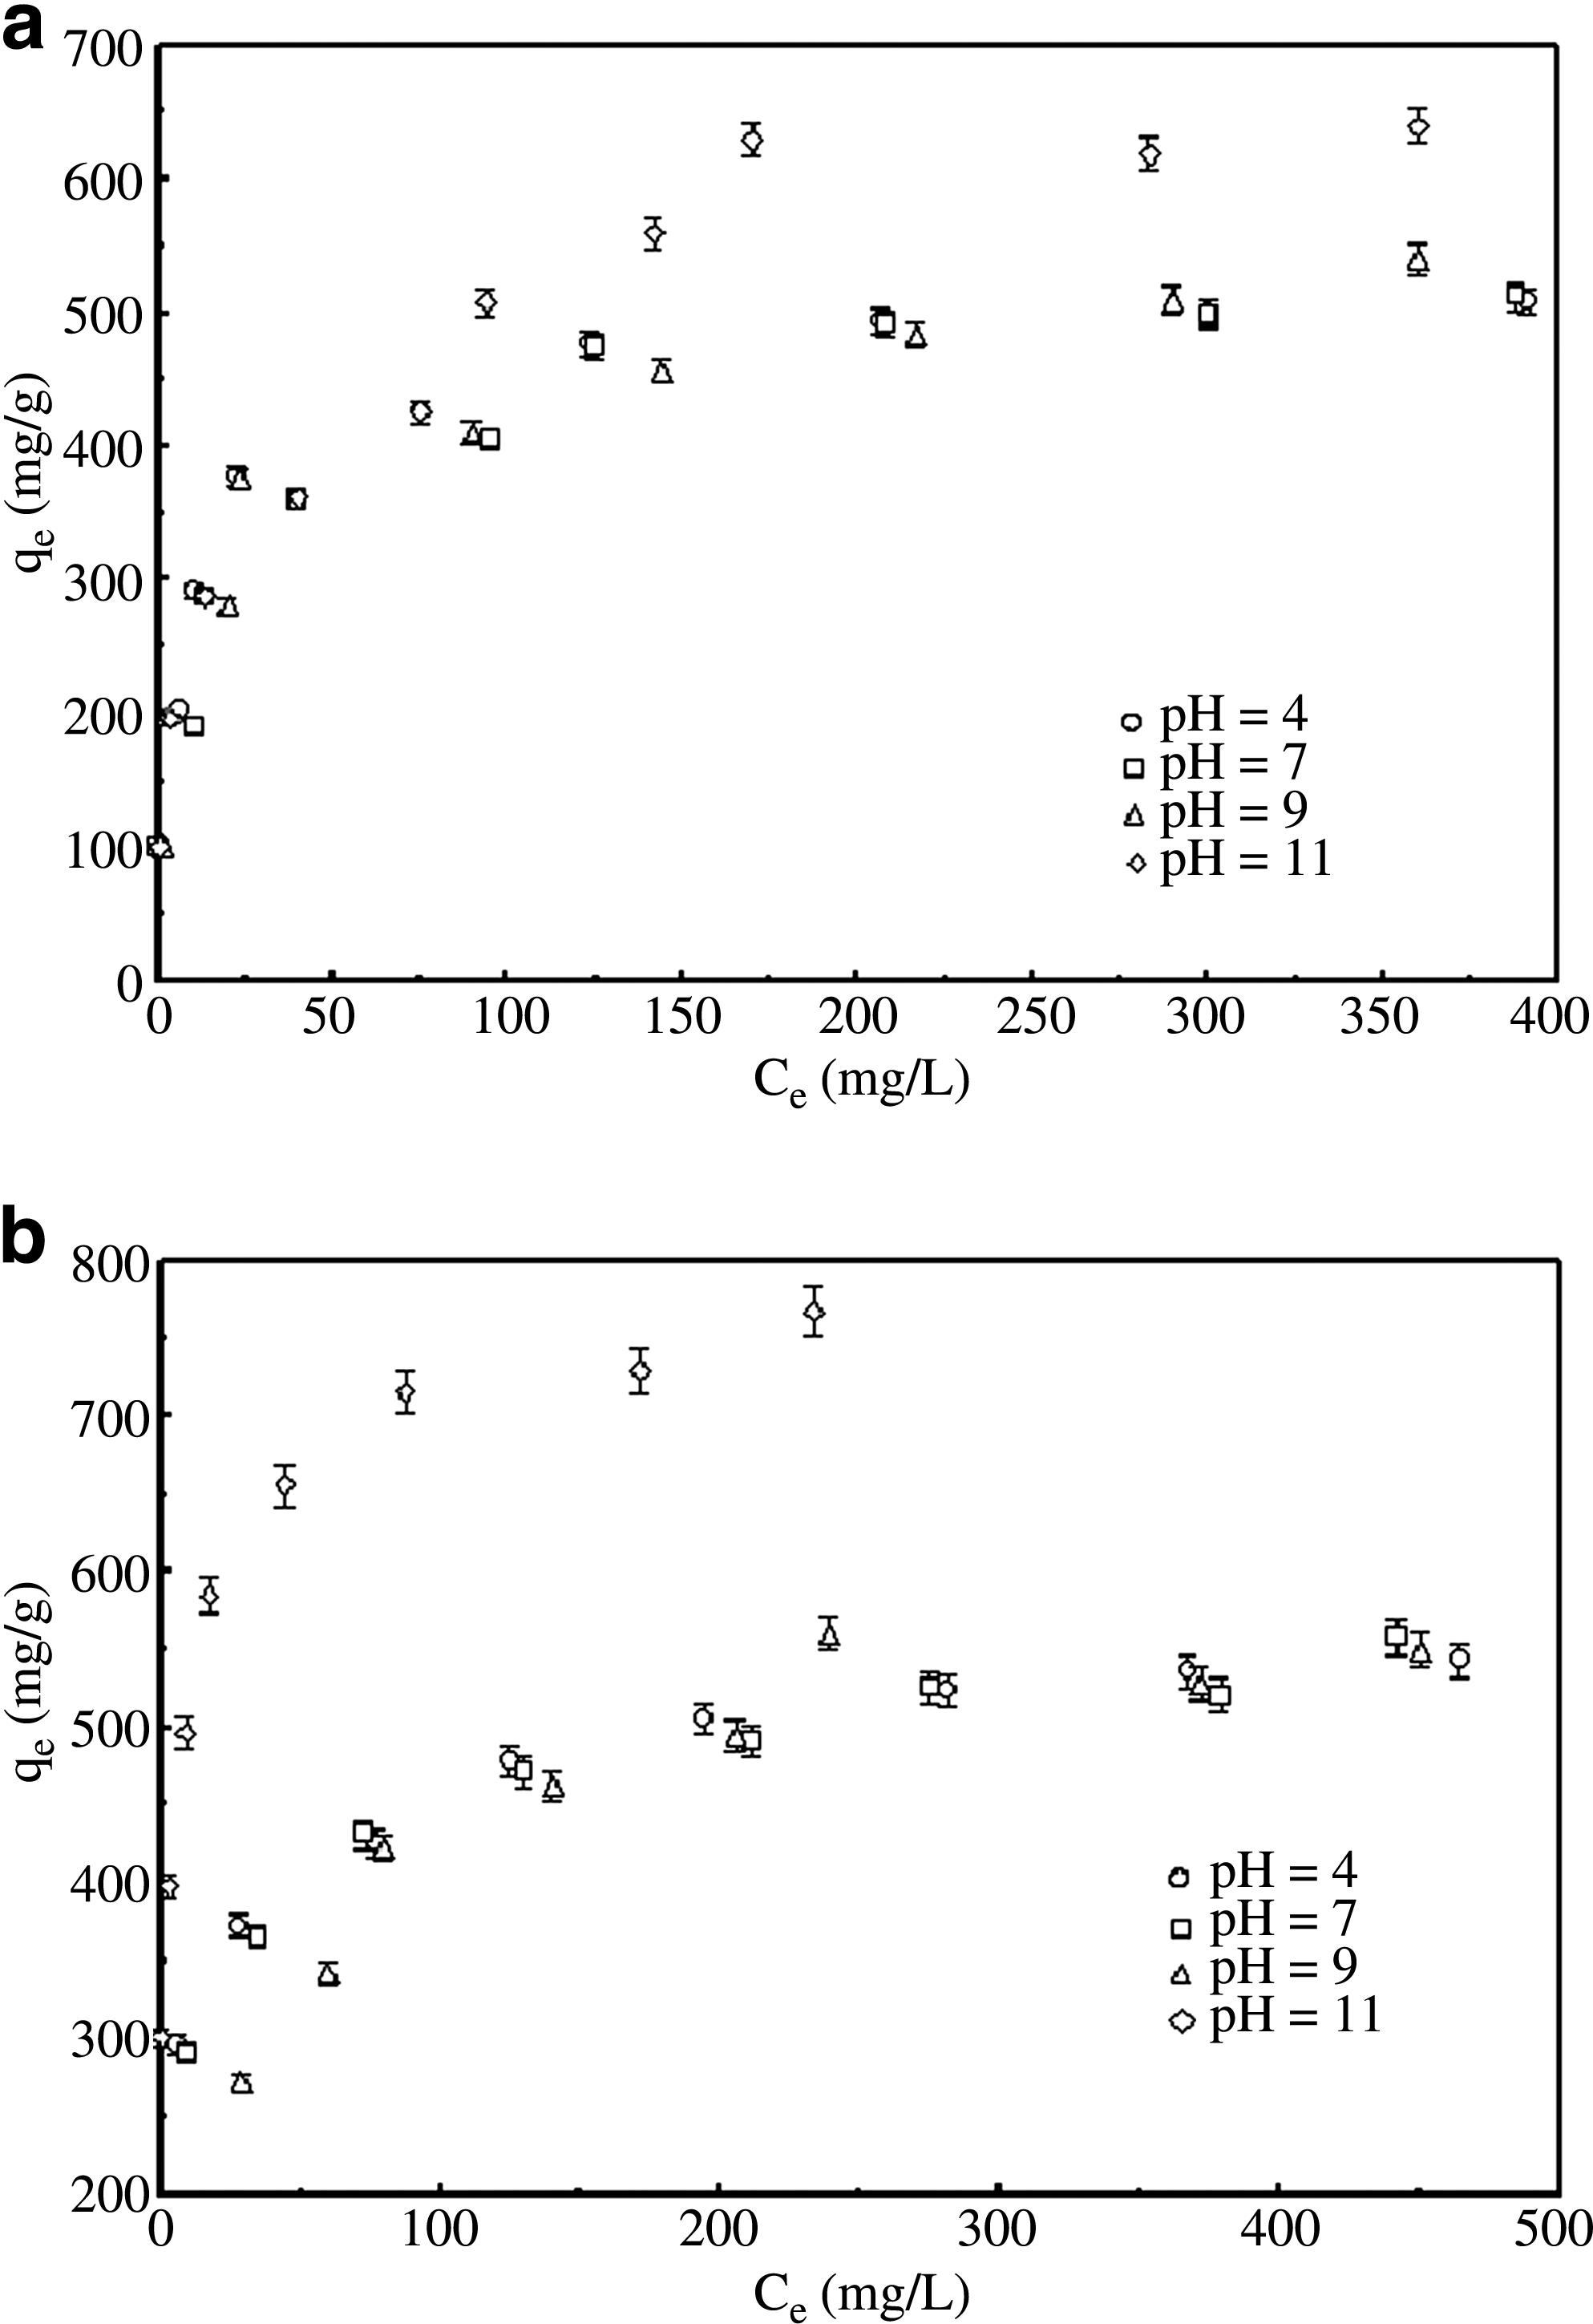
To determine the pH effects on the adsorption of MB, the tests were carried out on ACFs and ACFs functionalized with H2O2 between the pH range of 4–11. The adsorption isotherms of MB on ACF1 are shown in Fig. 9a. It can be observed that change in the adsorption capacity with increasing pH is insignificant at pH<9. However, significant enhancement in the equilibrium solute loading is observed at pH=11. Similar effects were observed for ACF1 functionalized with H2O2, as shown in Fig. 9b. Figure 10a and b describes change in the adsorption capacity of ACF2 (with and without functionalization with H2O2) with increasing pH. As observed, the adsorbents displayed similar pH effects, although to a lesser extent than previous case (ACF1).

Numerous studies have been conducted on adsorptive removal of MB from aqueous solution by various adsorbents. The equilibrium loadings of MB are reported as 6 mg/g on the thermally activated coir pith carbon prepared from coconut husk (Kavitha and Namasivayam, 2007), 85 mg/g on tea waste (Uddin et al., 2009), 17 mg/g on the activated carbons prepared from sunflower oil cake (Karagoz et al., 2008), 147 mg/g on AC prepared from rejected tea (Nasuha et al., 2010), 303 mg/g on the surface modified AC prepared from oil palm shell (Tan et al., 2008), and 280 mg/g on the bituminous coal-based AC (El Qada et al., 2006). In the present study the equilibrium loadings of MB on ACF1 and ACF2 were obtained as ∼508 and 584 mg/g, respectively. The H2O2 functionalized ACF1 and ACF2 yielded in the relatively larger loadings for MB (∼543 and 646 mg/g, respectively).
Conclusion
In this study, activation was carried out on the viscose rayon and phenolic resin-based carbon fibers, using steam as an activation agent. It was found that the burn-off values increased with increasing activation temperature and holding time. The characterization data revealed that prepared ACFs were highly porous and have the surface oxygenated groups. The MB adsorption capacity increased with increasing surface area, pore volume, PSD, and the surface oxygenated functional groups. These parameters were found to significantly increase with increasing activation temperature and time. The temperatures below 750°C were insufficient to create porosity. On the other hand, temperatures above 900°C and activation time greater than 30 min in the case of ACF1, and 60 min in the case of ACF2 resulted in over-activation and loss of fiber integrity. The surface functionalization of ACFs by H2O2 as an oxidizing agent to incorporate surface oxygen functional groups enhanced the adsorption capacity of ACFs for MB. The adsorption data exhibited larger adsorption capacity for treated ACFs compared with that for the untreated ACFs. ACF2 was found to be superior to ACF1.
Footnotes
Acknowledgments
The authors acknowledge the support from the DMSRDE, Kanpur (India), in the form of research grants. The authors also acknowledge the supply of ACF from Kynol Inc. Japan.
Author Disclosure Statement
No competing financial interests exist.