




Abstract
Abstract
The present study provides results from a study of the removal of copper from water through electrochemically generated Al3+ using aluminium alloy as the electrodes. Various operating conditions on the removal efficiency of copper were investigated, such as initial copper ion concentration, initial pH, current density, and temperature. Results showed that the optimum removal efficiency of 98.5% was achieved at a current density of 0.025 A/dm2, at pH of 7.0. Effects of co-existing anions such as carbonate, phosphate, silicate, and fluoride were studied on the removal efficiency of copper. Results of pilot scale study show that the process was technologically feasible. Adsorption of copper could be described by the Langmuir adsorption isotherm suggesting monolayer coverage of adsorbed molecules. First- and second-order rate equations, Elovich and Intraparticle diffusion models, were applied to study adsorption kinetics. The adsorption process follows the second-order kinetics model with good correlation. Temperature studies showed that adsorption was endothermic and spontaneous in nature.
Introduction
Although there are numerous reports related to electrochemical coagulation as a means of removal of many pollutants from water and wastewater, but there are limited works on copper removal by electrocoagulation method and its adsorption and kinetics studies. The present work provides an electrocoagulation process for the removal of copper from water using aluminium alloy as both anode and cathode. To optimize the maximum removal efficiency of copper, different parameters such as effect of initial concentration, effect of temperature, pH, and effect of current density were studied. In doing so, the equilibrium adsorption behavior is analyzed by fitting models of Langmuir, Freundlich, and Dubinin-Radushkevich (D-R) isotherms. Adsorption kinetics of electrocoagulants is analyzed using first-, second-order, Elovich, and Intraparticle models. Activation energy is evaluated to study the nature of adsorption.
Experimental Setup Methods
The electrochemical cell consisted of a 1.0 L glass vessel fitted with a PVC cover having suitable holes to introduce the electrodes, thermometer, pH sensor, and electrolyte. The anode and cathode with surface area of 0.2 dm2 were made of aluminum alloy containing Zn (1%–4%), In (0.006%–0.025%), Fe (0.15%), and Si (0%–0.15%) supplied by CECRI, (CSIR), India, and placed at an inter-electrode distance of 0.005 m. The temperature of the electrolyte was controlled to the desired value with a variation of±2K by adjusting the rate of flow of thermostatically controlled water through an external glass-cooling spiral. A regulated direct current (DC) was supplied from a rectifier (10 A, 0–25 V; Aplab model).
Copper nitrate (Analar Reagent; Merck) was dissolved in deionized water for the required concentration of about 1.0 L. The pH of the electrolyte was adjusted, if required, with 1 M HCl or NaOH (Analar Reagent; Merck) solutions. Temperature studies were carried out at varying temperature (313K–343K) to determine the type of reaction. To examine the effect of co-existing ions, for the removal of copper, sodium carbonate, sodium phosphate, sodium silicate, and sodium fluoride were added to the electrolyte for required concentrations. All the experiments were repeated thrice for reproducibility, and the accuracy of the results are±1%.
The copper analysis was analyzed using UV-Visible Spectrophotometer (MERCK; Spectroquant Pharo 300). The scanning electron microscope (SEM) and EDAX of copper-adsorbed aluminium hydroxide coagulant were analyzed with an SEM made by Hitachi (model s-3000h). The XRD of electrocoagulatioan-by products were analyzed by a JEOL X-ray diffractometer (Type–JEOL). The Fourier transform infrared spectrum of aluminium hydroxide was obtained using Nexus 670 FTIR spectrometer (Thermo Electron Corporation). The concentration of carbonate, silicate, fluoride, and phosphate were determined using UV-Visible Spectrophotometer (MERCK; Pharo 300).
Result and Discussion
Effect of electrolyte pH
It has been established that the initial pH of the electrolyte is one of the important factors affecting the performance of the electrochemical process, particularly the performance of the electrocoagulation process. To evaluate its effect, a series of experiments were performed, using 10 mg/L copper-containing solutions, with an initial pH varying in the range of 4–12 at a current density of 0.025 A/dm2. The removal efficiencies are 93, 96.8, 98.5, 98.3, 96.2, and 94.1 for pHs 4, 6, 7, 8, 10, and 12, respectively. The decrease of removal efficiency at more acidic and alkaline pH values has been observed by many investigators [Merzouk et al., 2009; Zaied and Bellakhal 2009]; and it is attributed that at low pH, such as 2–3, cationic monomeric species Al3+ and
Effect of initial copper concentration
To study the effect of initial concentration, experiments were conducted at varying initial concentrations from 2 to 10 mg/L. The results are illustrated in Fig. 1. From the results, it can be seen that the adsorption of copper is increased with an increase in copper concentration and remains constant after equilibrium time. The equilibrium time was 5 min for all of the concentrations studied (2–10 mg/L). The amount of copper adsorbed (qe) increased from 1.83 to 8.66 mg/g as the concentration was increased from 2 to 10 mg/L. The figure also shows that the adsorption is the rapid in the initial stages and gradually decreases with progress of adsorption. The plots are single, smooth, and continuous curves leading to saturation, suggesting the possible monolayer coverage to copper on the surface of the adsorbent.

Effect of agitation time and amount of copper adsorbed, at a current density of 0.025 A/dm2, pH of 7.0, and temperature of 303 K.
Effect of current density
To investigate the effect of current density, a series of experiments were carried out using 10 mg/L of copper containing electrolyte, at a pH 7.0, with the current density being varied from 0.01 to 0.125 A/dm2. The removal efficiencies of copper are 95.6%, 98.5%, 98.6%, 98.8%, 99.0%, and 99.1% for current densities 0.01, 0.025, 0.5, 0.075, 0.1, and 0.125 A/dm2, respectively. It is found that, above 0.025 A/dm2 the removal efficiency remains almost constant for higher current densities. So, further studies were carried out at 0.025 A/dm2. The results showed that as current density increases, removal of copper also increases. This can be attributed to the increase in the amount of Al ions being generated in situ, thereby resulting in rapid removal of copper. The amount (average value) of adsorbent [Al(OH)3] has been determined from the Faraday law:
where I is current in A, t is the time (s), M is the molecular weight, Z is the electron involved, and F is the Faraday constant (96,485.3 coulomb/mole). As expected, the amount of copper adsorption increases with the increase in adsorbent concentration, which indicates that the adsorption depends on the availability of binding sites for copper.
Effect of coexisting ions
Carbonate
\documentclass{aastex}\usepackage{amsbsy}\usepackage{amsfonts}\usepackage{amssymb}\usepackage{bm}\usepackage{mathrsfs}\usepackage{pifont}\usepackage{stmaryrd}\usepackage{textcomp}\usepackage{portland, xspace}\usepackage{amsmath, amsxtra}\pagestyle{empty}\DeclareMathSizes{10}{9}{7}{6}\begin{document}
$$({\rm HCO}_3^-)$$
\end{document}
The effect of
Phosphate
\documentclass{aastex}\usepackage{amsbsy}\usepackage{amsfonts}\usepackage{amssymb}\usepackage{bm}\usepackage{mathrsfs}\usepackage{pifont}\usepackage{stmaryrd}\usepackage{textcomp}\usepackage{portland, xspace}\usepackage{amsmath, amsxtra}\pagestyle{empty}\DeclareMathSizes{10}{9}{7}{6}\begin{document}
$$({\rm H}_2{\rm PO}_4^- \ {\rm and} \ {\rm HPO}_4^{2-})$$
\end{document}
The concentration of
Silicate
The effect of silicate on the removal efficiency of copper was investigated. The respective efficiencies for 0, 5, 10, and 15 mg/L of silicate are 98.5%, 68.0%, 63.2%, and 59.0%. The removal of copper decreased with increasing silicate concentration from 0 to 15 mg/L. In addition to preferential adsorption, silicate can interact with aluminium hydroxide to form soluble and highly dispersed colloids that are not removed by normal filtration (Vasudevan et al., 2009).
Fluoride
From the results, it is found that the efficiency decreased from 98.5%, 90.0%, 76.3%, 59.0%, and 30.5% by increasing the concentration of fluoride from 0, 0.2, 0.5, 2, and 5 mg/L. This is due to the preferential adsorption of fluoride compared with copper as the concentration of fluoride increases. So, when fluoride ions are present in the water to be treated, they compete greatly with copper ions for the binding sites (Vasudevan et al., 2009).
Adsorption kinetics
First- and second-order rate equation
The variation of the adsorbed copper with time was kinetically characterized using the first- and second-order rate equation proposed by Lagergren. The first-order Lagergren model as (Ho and McKay, 1998; Wan Ngah and Hanafiah, 2008)
where qt is the amount of copper adsorbed on the adsorbent at time t (min), and k1 (1/min) is the rate constant of first-order adsorption. The integrated form of the above equation with the boundary conditions t=0 to>0 (q=0 to>0) and then rearranged to obtain the following time-dependence function,
where qe is the amount of copper adsorbed at equilibrium. The qe and rate constant k1 were calculated from the slope of the plots of log (qe−q t ) versus time (t) (figure not shown).
The second-order kinetic model is expressed as (Wu et al., 2005; Benaissa and Elouchdi, 2007)
Eq. (5) can be rearranged and linearized as
where qe and q t are the amount of copper adsorbed on Al(OH)3 (mg/g) at equilibrium and at time t (min), respectively, and k2 is the rate constant for the second-order kinetic model. The equilibrium adsorption capacity, qe (cal) and k2, were determined from the slope and intercept of plot of t/qt versus time (t) (Fig. 2) and are compiled in Table 1. The plots were found to be linear with good correlation coefficients (0.9999, 0.9976, 0.9999, 0.9983, and 0.9999 for 2, 4, 6, 8, and 10 mg/L initial copper concentration, respectively); and the theoretical qe (cal) values agree well with the experimental qe (exp) values at all concentrations studied. This implies that the second-order model is in good agreement with experimental data and can be used to favorably explain the copper adsorption in Al(OH)3.
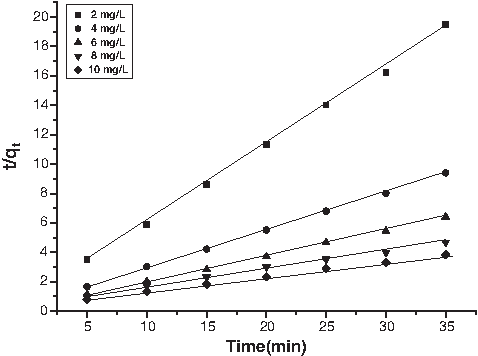
Second-order kinetic model plot of different concentrations of copper at current density of 0.025 A/dm2, temperature of 303K, and pH of 7.0.
Elovich model and intraparticle diffusion
The simplified form of Elovich model is (Oke et al., 2008)
where α is the initial adsorption rate (mg/[g·h]), and β is the desorption constant (g/mg). If copper adsorption fits the Elovich model, a plot of qt vs loge (t) should yield a linear relationship with the slope of (1/β) and an intercept of (1/β) loge (α·β). Table 2 depicts the results obtained from Elovich equation. Lower regression value shows the inapplicability of this model.
Intraparticle diffusion is expressed as (Weber et al., 1963; Allen et al., 1989),
A linearized form of Eq. (8) is followed by
in which a depicts the adsorption mechanism, and kid may be taken as the rate factor (percent of copper adsorbed per unit time). Lower and higher values of kid illustrate an enhancement in the rate of adsorption and better adsorption with improved bonding.
Tables 1 and 2 depict the computed results obtained from first-order, second-order, Elovich and intraparticle diffusion. The correlation coefficient values decrease from second-order, first-order, and intraparticle diffusion to Elovich model. This indicates that the adsorption follows the second-order than the other models. Further, the calculated qe values well agree with the experimental qe values for second-order kinetics model than other models studied; and it is concluded that the second-order kinetics equation is the best-fitting kinetic model.
Adsorption isotherm
To determine the isotherms, the initial pH was kept at 7, and the concentration of copper used was in the range of 2–10 mg/L.
Freundlich isotherm
The mathematical expression of the Freundlich model can be written as (Lee et al., 2004; Prasanna Kumar et al., 2006)
According to the Freundlich isotherm model, initially, the amount of adsorbed compounds increases rapidly; this increase slows down with the increasing surface coverage. Equation (10) can be linearized in logarithmic form, and the Freundlich constants can be determined as follows:
where kf is the Freundlich constant related to adsorption capacity n is the energy or intensity of adsorption; Ce is the equilibrium concentration of copper (mg/L). In testing the isotherm, the copper concentration used was 2–10 mg/L; and at an initial pH 7, the adsorption data is plotted as log qe versus log Ce and should result in a straight line with slope n and intercept kf. The intercept and the slope are indicators of adsorption capacity and adsorption intensity, respectively. The value of n falling in the range of 1–10 indicates favorable sorption. The Freundlich constants kf and n values are 0.9346 (mg/g) and 1.0011 (L/mg), respectively. From the analysis of the results, it is found that the Freundlich plots fit satisfactorily with the experimental data obtained in the present study.
Langmuir isotherm
The linearized form of Langmuir adsorption isotherm model is (Sarioglu et al., 2005; Bouzid et al., 2008)
where qe is the amount adsorbed at equilibrium concentration Ce, qm is the Langmuir constant representing maximum monolayer adsorption capacity, and b is the Langmuir constant related to energy of adsorption. The plots of 1/qe as a function of 1/Ce for the adsorption of copper on Al(OH)3 are shown in Fig. 3. The plots were found linear with good correlation coefficients (>0.99), indicating the applicability of the Langmuir model in the present study. The values of monolayer capacity (qm) is found to be 203.91 mg/g, and Langmuir constant (b) is found to be 0.0018 L/mg. The values of qm calculated by the Langmuir isotherm were all close to experimental values at given experimental conditions. These facts suggest that copper is adsorbed in the form of monolayer coverage on the surface of the adsorbent. The sorption isotherms of copper on aluminum hydroxide typically follow Langmuirian behavior as described by previous researchers (Sarioglu et al., 2005; Bouzid et al., 2008). The essential characteristics of the Langmuir isotherm can be expressed as the dimensionless constant RL:
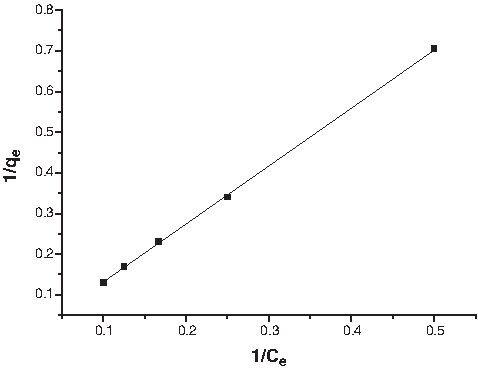
Langmuir plot for adsorption of copper at pH of 7.0, current density of 0.025 A/dm2, and temperature of 303K.
where RL is the equilibrium constant and indicates the type of adsorption, b is the Langmuir constant. Co is various concentrations of copper solution. The RL values between 0 and 1 indicate the favorable adsorption. The RL values were found to be between 0 and 1 for all the concentrations of copper studied. The results are presented in Table 3.
D-R isotherm
This model is represented by (Tan et al., 2007),
where ɛ=RT ln [1+1/Ce], B is related to the free energy of sorption per mole of the adsorbate as it migrates to the surface of the electrocoagulant from infinite distance in the solution, and qs is the D-R isotherm constant related to the degree of adsorbate adsorption by the adsorbent surface. The linearized form of Equation (14) is
The isotherm constants of qs and B are obtained from the intercept and slope of the plot of ln qe versus ɛ2 respectively (Demiral et al., 2008). The constant B gives the mean free energy E, of adsorption per molecule of the adsorbate when it is transferred to the surface of the solid from infinity in the solution and the relation is given as
The magnitude of E is useful for estimating the type of adsorption process. It was found to be 9.04 kJ/mol. So, the type of adsorption of copper on aluminium hydroxide was defined as chemical adsorption.
The correlation coefficient values of different isotherm models are listed in Table 3. The Langmuir isotherm model has a higher regression coefficient (R2=0.999) when compared with the other models, indicating that the Langmuir model provides a better description of the process.
Effect of temperature
The amount of copper adsorbed on the adsorbent increases by increasing the temperature, thus indicating the process to be endothermic. The diffusion co-efficient (D) for intraparticle transport of copper species into the adsorbent particles has been calculated at different temperature by
where t1/2 is the time of half adsorption (s), ro is the radius of the adsorbent particle (cm), and D is the diffusion co-efficient in cm2/s. For all chemisorption systems, the diffusivity co-efficient should be 10−5 to 10−13 cm2/s (Yang and Al-Duri, 2001). In the present work, D is found to be in the range of 10−10 cm2/s. The pore diffusion coefficient (D) values for various temperatures and different initial concentrations of copper are presented in Table 4.
To find out the energy of activation for adsorption of copper, the second-order rate constant is expressed in Arrhenius form (Golder et al., 2006),
where ko is the constant of the equation (g/[mg·min]), E is the energy of activation (J/mol), R is the gas constant (8.314 J/[mol·K]), and T is the temperature in K. The activation energy (0.396 kJ/mol) is calculated from the slope of the fitted equation from the plot log k2 versus 1/T. The free energy change is obtained using the following relationship,
where ΔG is the free energy (kJ/mol), Kc is the equilibrium constant, R is the gas constant, and T is the temperature in K. The Kc and ΔG values are presented in Table 5. From the table, it is found that the negative value of ΔG indicates the spontaneous nature of adsorption. Other thermodynamic parameters such as entropy change (ΔS) and enthalpy change (ΔH) were determined using the van't Hoff equation,
The enthalpy change (ΔH=18.664 kJ/mol) and entropy change (ΔS=0.06878 kJ/mol) were obtained from the slope and intercept of the van't Hoff linear plots of ln Kc versus 1/T (Fig. 4). Positive value of enthalpy change (ΔH) indicates that the adsorption process is endothermic in nature, and the negative value of change in internal energy (ΔG) shows the spontaneous adsorption of copper on the adsorbent. Positive values of entropy change show the increased randomness of the solution interface during the adsorption of copper on the adsorbent (Table 5). Enhancement of adsorption capacity of electrocoagulant (aluminium hydroxide) at higher temperatures may be attributed to the enlargement of pore size and or activation of the adsorbent surface. Using Lagergren rate equation, first-order rate constants and correlation co-efficient were calculated for different temperatures (305K–343K). The calculated qe values obtained from the second-order kinetics agree with the experimental qe values better than the first-order kinetics model. Table 6 depicts the computed results obtained from the second-order kinetic models. These results indicate that the adsorption follows the second-order kinetic model at different temperatures used in this study.
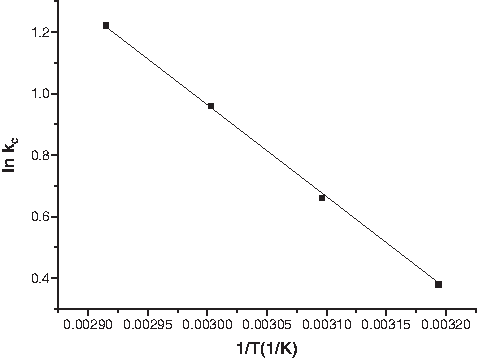
Plot of log kc and 1/T at pH of 7.0, current density of 0.025 A/dm2.
A pilot plant study
A pilot plant capacity cell (Fig. 5) was designed, fabricated, and operated for the removal of copper from water. The system consists of a direct-current power supply, an electrochemical reactor, a water tank, a feed pump, a flow control valve, a flow measuring unit, a circulation pump, settling tank, sludge collection tank, filtration unit provisions for gas outlet, and treated water outlet. The reactor is made of PVC with an active volume of 1000 L. The electrode sets (anode and cathode) each consist of five pieces of aluminum alloy sheets, situated approximately 5 mm apart from each other and submerged in the solution. The total electrode surface area is 1340 cm2 for both cathodes and anodes. The cell was operated at a current density of 0.025 A/dm2 and an electrolyte pH of 7.0. The results showed that the maximum removal efficiency of 97.0% was achieved at a current density of 0.025 A/dm2 and a pH of 7 using aluminium alloy as the anode and the cathode. The results were consistent with the results obtained from the laboratory scale, showing that the process was technologically feasible.
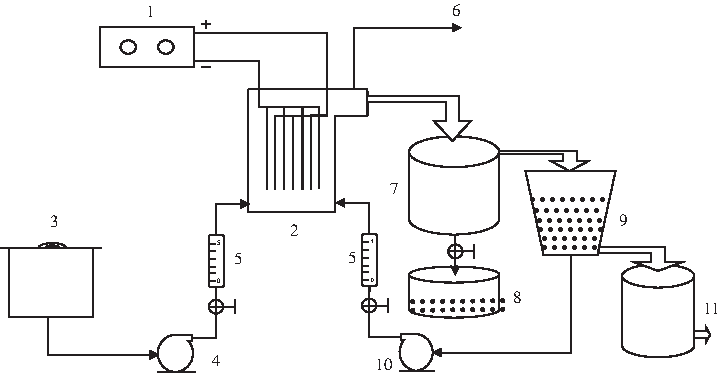
Flow diagram of pilot plant electrochemical system. 1, direct-current power supply; 2, electrocoagulation cell; 3, water tank; 4, inlet pump; 5, flow meter; 6, gas outlet; 7, settling tank; 8, sludge collection tank; 9, filtration unit; 10, recirculation pump; 11, treated water.
Surface morphology
SEM and EDAX studies
SEM images of aluminum anode, before and after electrocoagulation of copper electrolyte, were obtained to compare the surface texture. Figure 6a shows the original aluminum plate surface before its use in electrocoagulation experiments. The surface of the electrode is uniform. Figure 6b shows the SEM of the same electrode after several cycles of use in electrocoagulation experiments. The electrode surface is now found to be rough, with a number of dents. These dents are formed around the nucleus of the active sites where the electrode dissolution results in the production of aluminum hydroxides. The formation of a large number of dents may be attributed to the anode material consumption at active sites due to the generation of oxygen at its surface.

Scanning electron microscope image of the anode
Energy-dispersive analysis of X-rays was used to analyze the elemental constituents of copper-adsorbed aluminium hydroxide shown in Fig. 7. It shows that the presence of Cu, Al, and O appears in the spectrum. EDAX analysis provides direct evidence that copper is adsorbed on aluminium hydroxide. Other elements detected in the adsorbed aluminum hydroxide come from adsorption of the conducting electrolyte, chemicals used in the experiments, alloying, and the scrap impurities of the anode and cathode.

Energy dispersive x-ray analysis (EDAX) for copper-adsorbed electrocoagulant.
Fourier transform infrared spectroscopy (FTIR) analysis
Figure 8 presents the FTIR spectrum of copper–aluminum hydroxide. The sharp and strong peak at 3453.07 cm−1 is due to the O–H stretching vibration in the Al(OH)3 structures. The 1631.34 cm−1 peak indicates the bent vibration of H–O–H. The strong peak at 955.04 cm−1 is assigned to the Al–O–H bending. Cu–O vibration at 824 cm−1 is also observed.
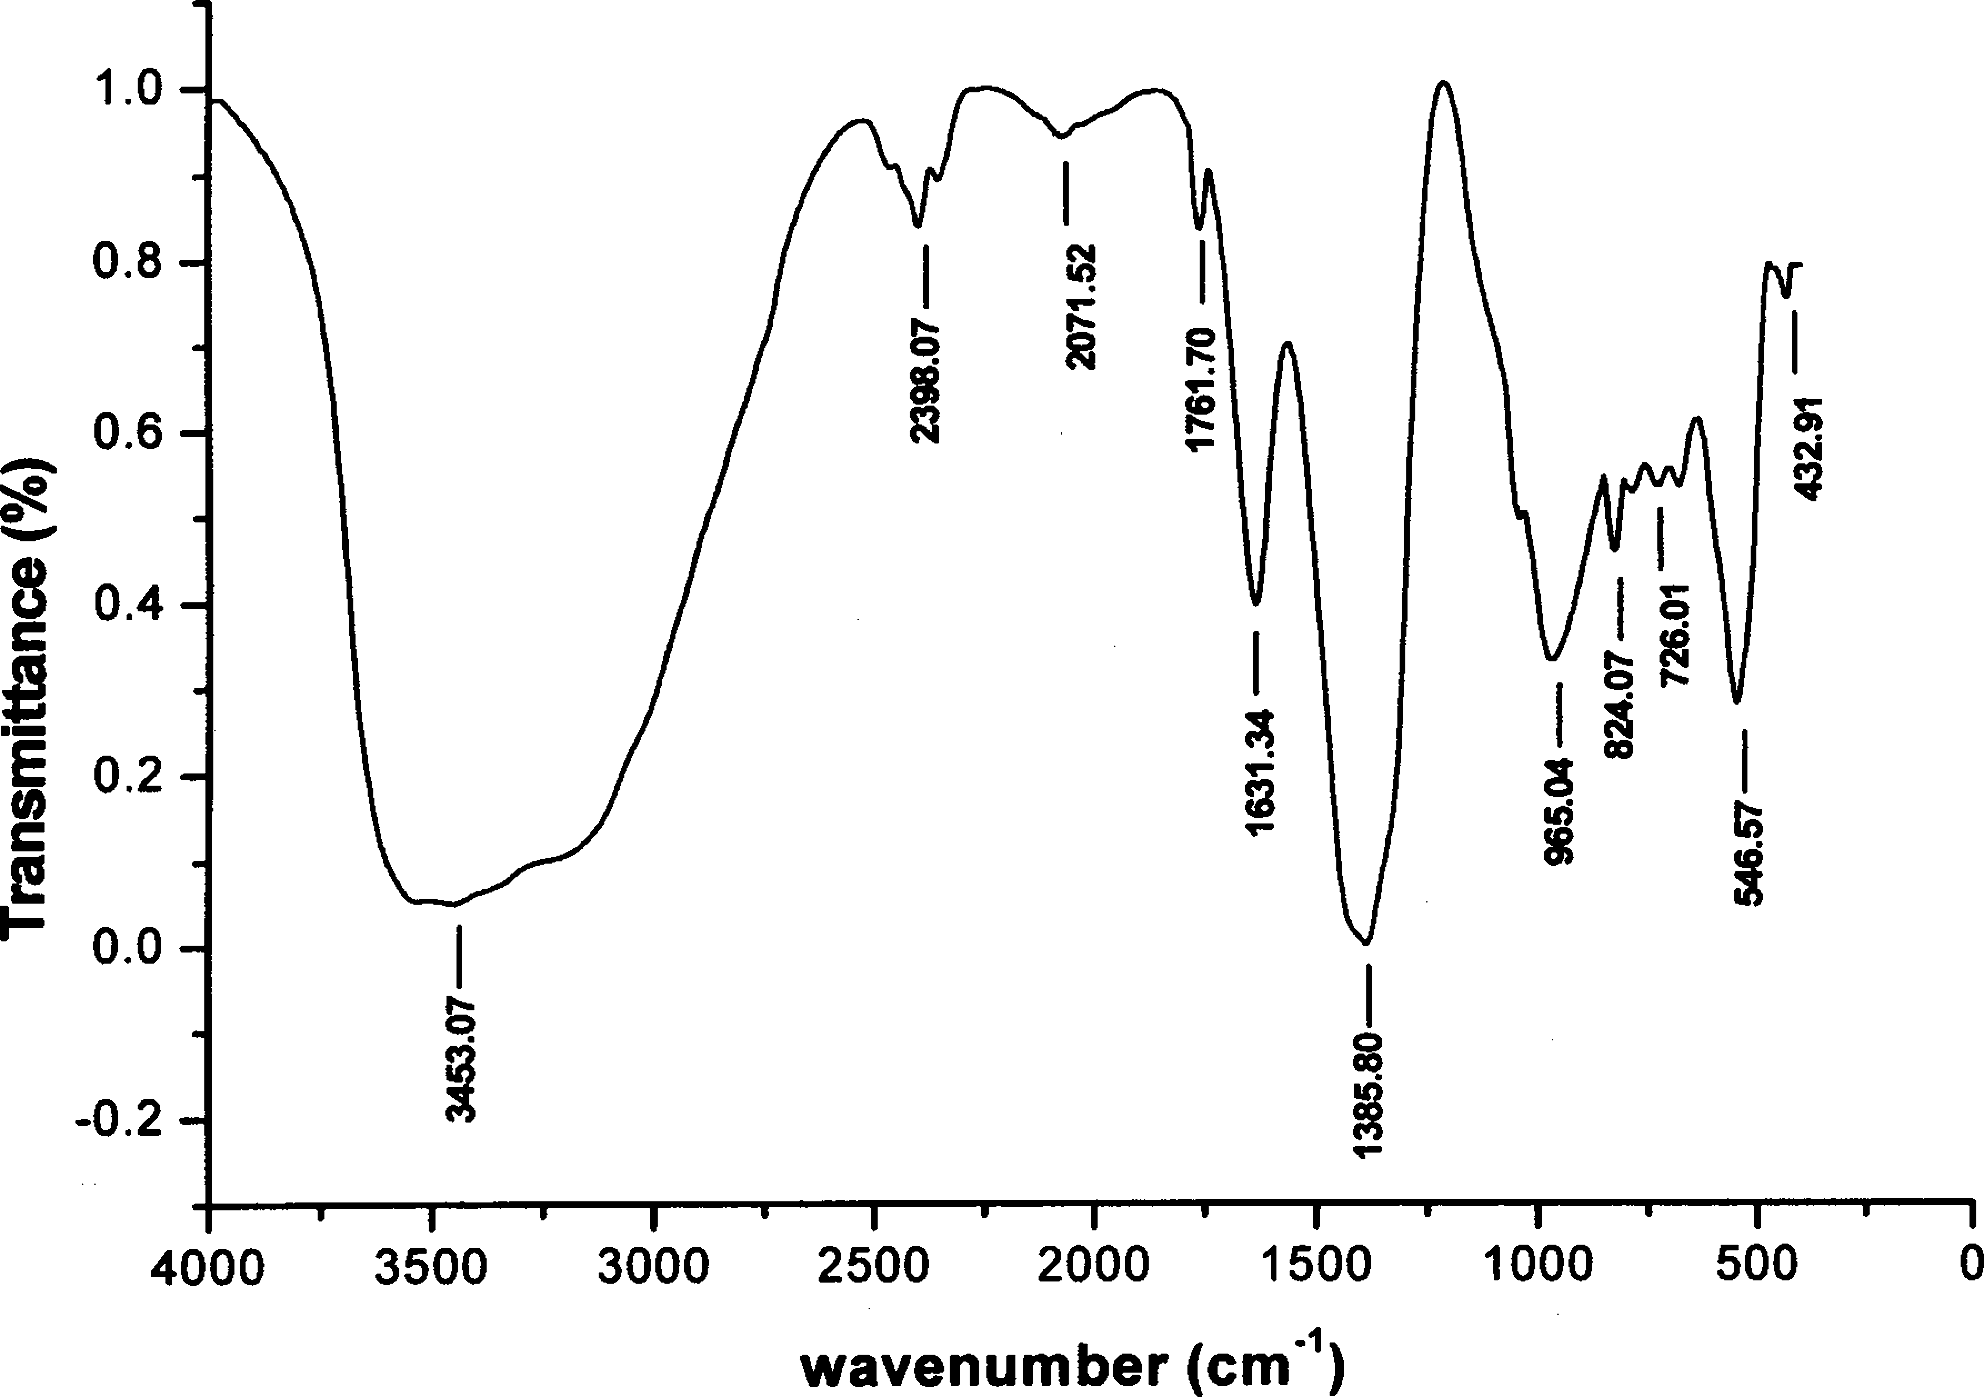
Fourier transform infrared spectroscopy (FTIR) spectrum for copper-adsorbed electrocoagulant.
XRD analysis
X-ray diffraction spectrum (Fig. 9) of aluminum electrode coagulant showed very broad and sallow diffraction peaks. This broad hump and low intensity indicate that the coagulant is amorphous or very poor crystalline in nature. It is reported (Gross et al., 2007) that the crystallization of aluminum hydroxide is a very slow process resulting in all aluminum hydroxides found to be either amorphous or very poorly crystalline. The literature on the amorphous nature of aluminum oxide layer supported the present results.

X-ray difraction (XRD) spectrum for copper-adsorbed electrocoagulant.
Conclusions
The results showed that the optimized removal efficiency of 98.5% was achieved at a current density of 0.025 A/dm2 and pH of 7.0 using aluminium alloy as both anode and cathode. The aluminium hydroxide generated in the cell removes the copper present in the water and reduces the copper concentration to less than 1 mg/L, thus making it fit for drinking. The results showed that the process was technologically feasible at a cost of 1.02 kW·h/m3. Langmuir adsorption isotherm was found to fit the equilibrium data for copper adsorption. The adsorption process follows second-order kinetics. Temperature studies showed that adsorption was endothermic and spontaneous in nature.
Footnotes
Acknowledgment
The authors wish to express their gratitude to the Director, Central Electrochemical Research Institute, Karaikudi, for aid in publishing this article.
Author Disclosure Statement
No competing financial interests exist.