




Abstract
Abstract
Heavy metals are a common pollutant in industrial wastewater. They are highly toxic and threaten human health and the ecosystem. Polyaniline-coated sawdust (PANI/SD) is a good adsorbent for removing toxic metal ions from contaminated water. In this study, PANI/SD was prepared via the oxidation of aniline on the surface of sawdust. Adsorption of Cu(II) from aqueous solutions in a continuous fixed-bed system was first investigated. Effects of the bed height, inlet flow rate, and concentration on the breakthrough characteristics of the adsorption system were determined. Average bed adsorption capacity q0 was 58.23 mg/g. The adsorption data were fitted to three well-established fixed-bed adsorption models. PANI/SD was shown to be an effective adsorbent for removing Cu(II) from wastewater. This not only provides a new way to remove Cu(II) but also presents a new application of polyaniline.
Introduction
The aim of the present work was to study and model the removal of copper from aqueous solutions by polyaniline-coated sawdust (PANI/SD) in fixed-bed columns. The effects of the bed height, influent concentration, and flow rate are explored during the column test. Additionally, three models were used to predict the performance.
Materials and Methods
Chemicals and reagents
CuSO4·5H2O (analytical grade) was used to prepare Cu(II) solutions. The other chemicals used, for example, aniline and ammonium peroxydisulfate, were of analytical reagent grade. Deionized water was used for all dilutions and reagent preparations. The pH of each test solution was adjusted to the required value with H2SO4 solutions.
Preparation of adsorbent
The sawdust used was obtained from a local furniture manufacturing company. The specific surface area of the sawdust was measured with a BET surface area analyzer. The values for specific surface area and pore diameter were 1.06 m2/g and 0.68 μm, respectively. The average particle diameter of the sawdust was 1.85 mm. The sawdust was washed to remove dust and other contaminants and then dried.
Polyaniline was synthesized through the oxidation of aniline in an acidic aqueous medium in the presence of an oxidant, ammonium peroxydisulfate. The sawdust was directly added to an aniline solution in 1 M hydrochloric acid. The polymerization was initiated by adding an ammonium peroxydisulfate solution in 1 M hydrochloric acid with continuous stirring at room temperature. The mixture was left overnight to complete the reaction. The insoluble precipitate was filtered and washed with water until the filtrate was colorless. The dark-green–colored polyaniline-doped sawdust (PANI/SD) was dried at 50°C in an oven. The surface area of the PANI/SD was also measured with a BET surface area analyzer. The specific surface area was measured to be 93.5 m2/g.
Fixed-bed experiments and data analysis
The fixed-bed experiments were performed in a water-jacketed glass column, with a 10 mm inner diameter and a length of 400 mm, at a constant temperature of 20°C. The column was packed with different bed heights of PANI/SD on a glass-wool support. The experiments were performed at pH 5. The batch experimental results showed that the adsorption rate was high at pH 5. A stock solution containing 1 g/L Cu(II) was prepared with reagent-grade CuSO4·5H2O. Then, a series of Cu(II) solutions with various concentrations (100, 200, and 300 mg/L) were prepared as dilutions. A solution with a known concentration was fed to the top of the column at the desired flow rate as regulated by a peristaltic pump. The samples in the outlet were collected, and their concentrations were analyzed at approximately 20-min intervals. The effluent concentration was measured with atomic adsorption spectrometry. All samples were analyzed in triplicate. The column studies were terminated when the column reached exhaustion.
Breakthrough curve is expressed in terms of the normalized concentration, which is defined as the ratio of the outlet to the inlet concentration (Ct/C0) as a function of time. The breakthrough time tB is defined as the time required for the concentration of metal ions in the effluent to reach 5% of the applied concentration. The exhaustion time tE is defined as the time when the concentration of metal ions in the effluent becomes 90% of the applied concentration. The breakthrough volumes VB and exhaustion volumes VE are the effluent volume at breakthrough time and exhaustion time, respectively. For a given feed concentration and flow rate, the adsorption capacity of the bed q0 (mg/g) can be determined by integration,
where C0 and Ct are, respectively, the initial and effluent adsorbate concentrations (mg/L), V is the volume of effluent (mL), Vt is the effluent volume at time t (mL), W is the mass of the adsorbent (g), and Q is the flow rate that circulates through the column in milliliter per minute.
Results and Discussion
Effect of bed depth
The effect of bed depth on the breakthrough curves was investigated for beds with heights of 15, 20, and 25 cm made by uniform packing of 3.05, 4.6, and 6.1 g of adsorbent. The feed solution had a metal ion concentration C0 of 200 mg/L in all cases and was allowed to flow through the beds with an effluent rate of 4 mL/min. Figure 1 illustrates the results for the removal of Cu(II) at pH 5.0 as obtained by varying the depth of the PANI/SD beds in the columns.

Cu(II) adsorption breakthrough curve at three bed depths.
An increase in column height resulted in an increase in the breakthrough time, and the slope of breakthrough curve decreased as bed height increased. In general, it was seen that a PANI/SD bed of a lower depth saturated more quickly than the PANI/SD bed of a greater depth. Increasing bed height resulted in an increased contact time between the metal ions and the PANI/SD and a corresponding increase in the amount of adsorbate uptake. Therefore, higher bed column decreases the solute concentration in the effluent more than lower bed columns. The column data and parameters obtained at different bed heights are also listed in Table 1. The results obtained were found to be similar to those reported by other workers (Vijayaraghavan and Prabu, 2006; Sushanta et al., 2010).
Effect of feed flow rate
The effect of flow rate on the Cu(II) adsorption characteristics of PANI/SD in the continuous flow packed column was examined by varying the flow rate (2, 4, and 6 mL/min) but the metal ion concentration was held constant at 200 mg/L. The quality of the adsorbent and the depth of the column were also unchanged.
Figure 2 demonstrates the effect of the effluent flow rate on the breakthrough curves in removing Cu(II) at pH 5.0 with a PANI/SD bed of a fixed depth of 20 cm. The details of the breakthrough time tB, exhaustion time tE, and adsorption capacity are presented in Table 1. It was shown that breakthrough and exhaustion generally occurred more quickly for higher flow rates. The variation in the slopes of the breakthrough curve may be explained on the basis of mass transfer fundamentals. At a lower rate of influent, Cu(II) had more time to be in contact with the adsorbent, which resulted in a greater adsorption capacity in the column. With the increase of flow rate, the adsorbent did not have enough time to bind the metal ions effectively from the mobile phase. Thus, the solute left the column before equilibrium occurred and the plateau of the breakthrough curves arrived early. These results are in agreement with those reported in the literature (Oualid, 2009; Francisco and André, 2010).
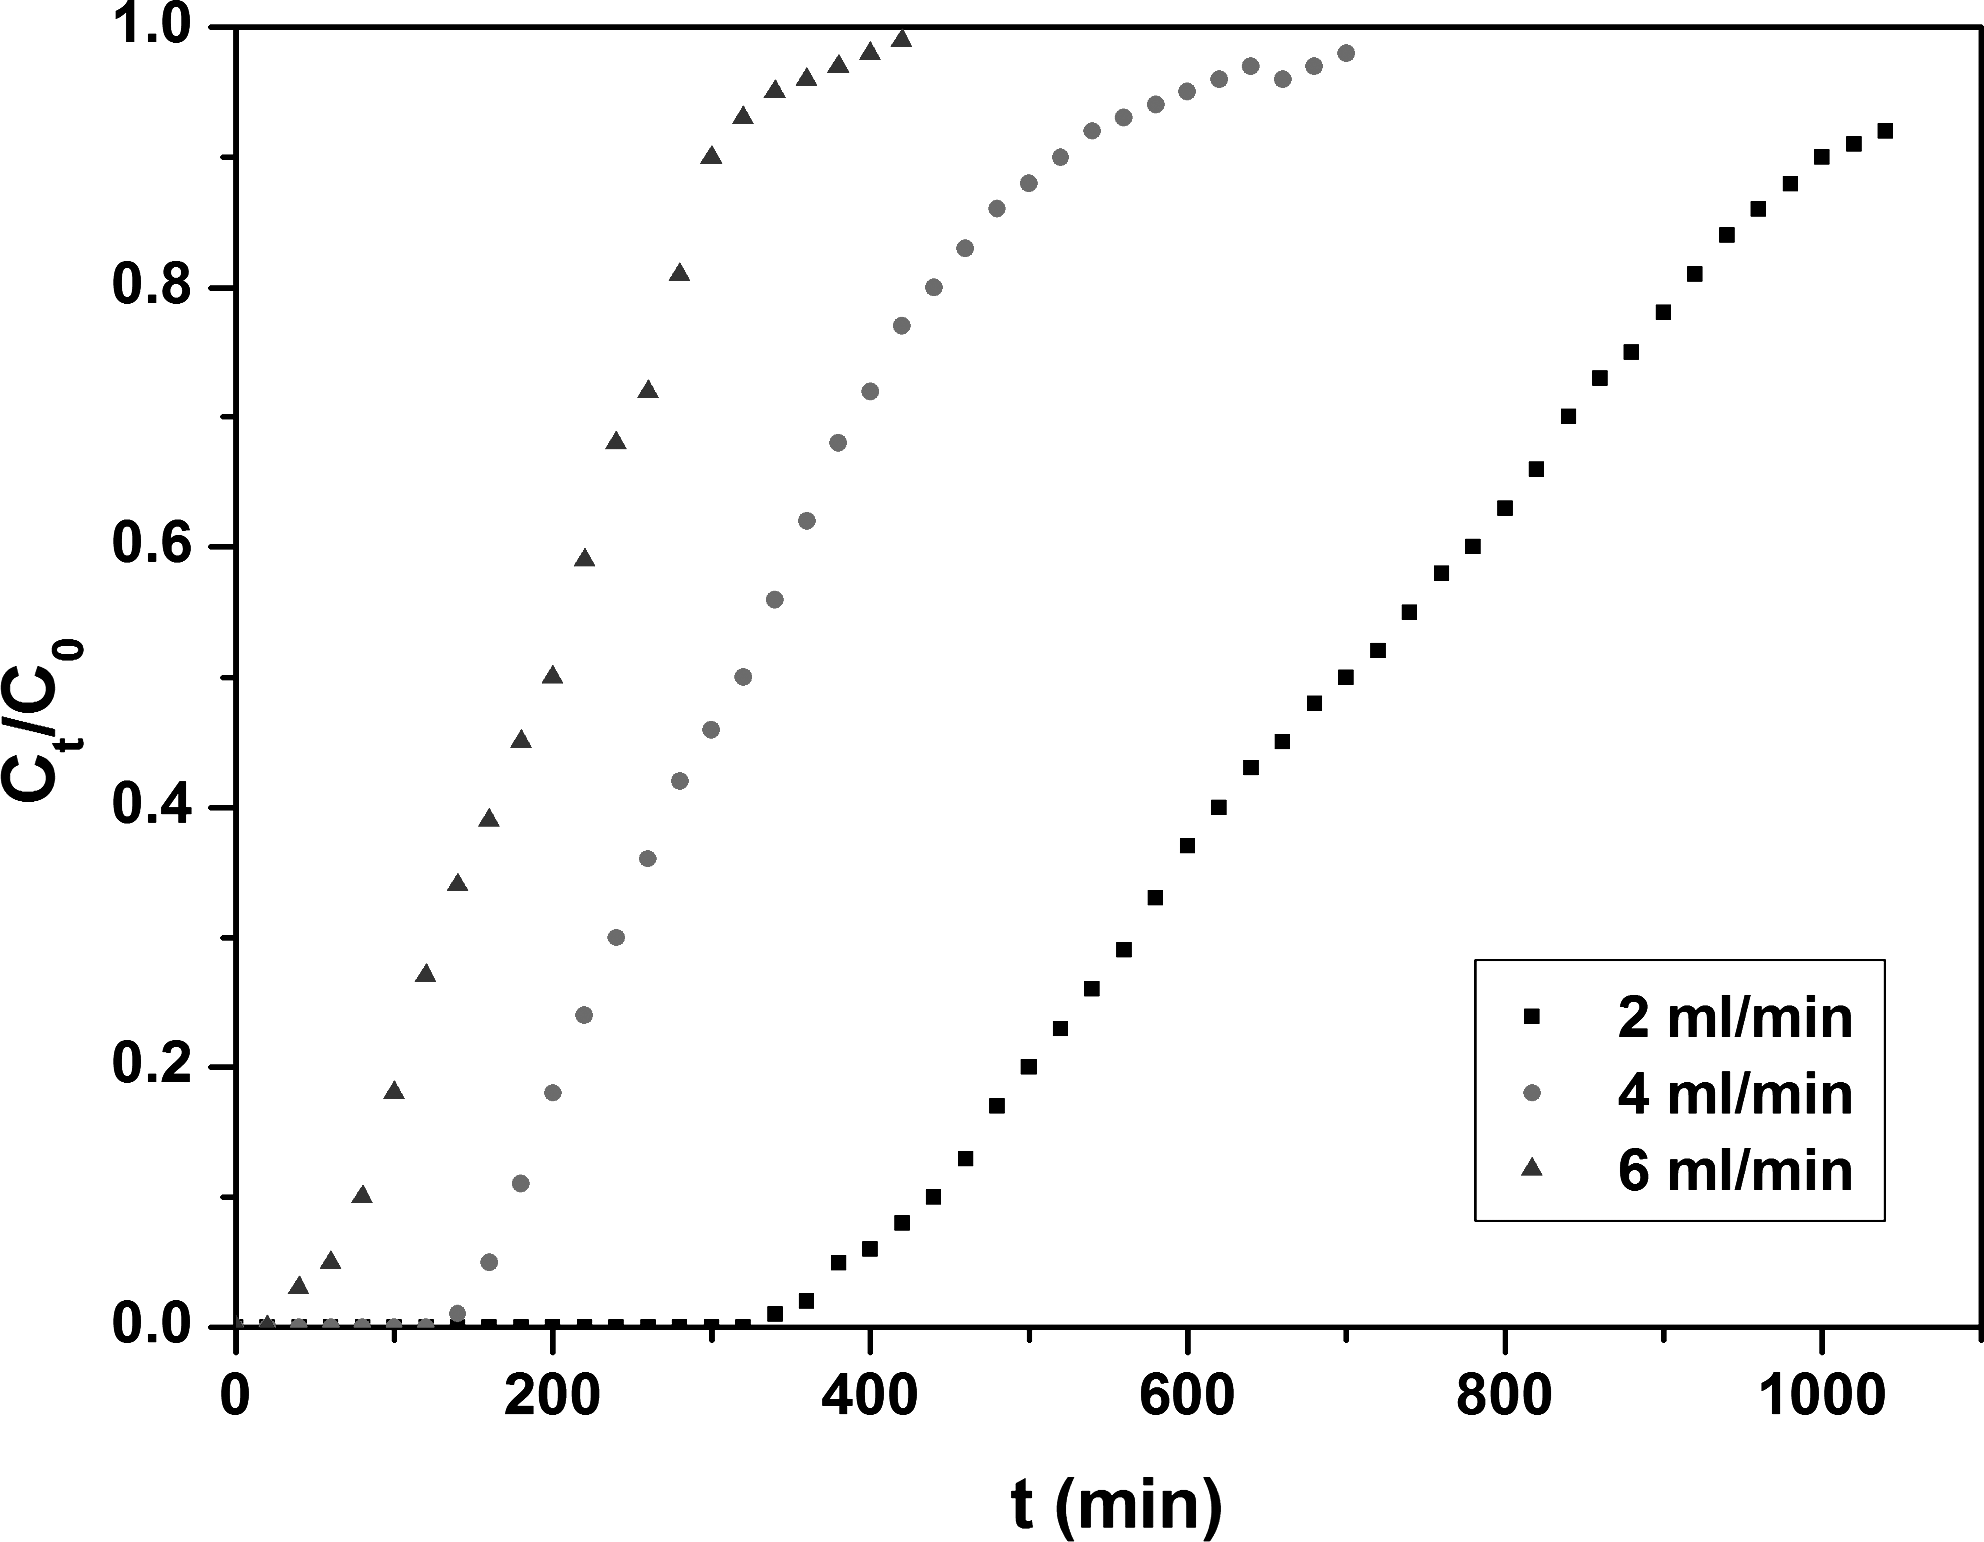
Cu(II) adsorption breakthrough curve at three different flow rates.
Effect of inlet concentration
The effect of the metal ion concentrations in the feed solution, C0 100, 200, and 300 mg/L, on the breakthrough curves was investigated for columns with a fixed bed of depth 20 cm and an effluent flow rate of 4.0 mL/min. Figure 3 shows the effect of the feed concentration on the breakthrough curve at pH 5.0.

Cu(II) adsorption breakthrough curve at three different inlet concentrations.
As influent concentration increased, the breakthrough curves became sharper, and the column with the highest inlet concentration saturated most quickly. The earlier appearance of the breakthrough point with increasing C0 is due to the high mass of solute per unit area that impinges on the surface of the adsorbent when the fresh solution appeared over the bed from the reservoir and the primary adsorption zone mobilized rapidly across the bed. This effect can be explained by considering that a lower concentration gradient results in a slower transport because of a decrease in the diffusion coefficient or the mass transfer coefficient. These results are similar to those found by other researchers in columns with different sorbent materials (Shukla et al., 2009).
Column data analysis
The Bed-Depth Service-Time model
The bed-depth service-time (BDST) model is generated from the Adams–Bohart equation. Hutchins (1973) modified the equation and predicted a linear relationship between the bed depth and service time.
where t is the service time (min), N0 is the adsorption capacity per unit volume of bed (mg/L), Z is the depth of the adsorbent bed (cm), u the linear flow rate (cm/s), C0 and Ct are the influent and the effluent adsorbate concentration (mg/L), respectively, and kads is the adsorption rate constant (L/mg min). A plot of t versus Z will generate a straight line with the following equation:
where a is the slope of the BDST line (a=N0/C0 u) and b is the intercept of this equation.
The BDST technique requires three column tests with three different bed depths to collect the necessary data. Linear BDST plots for three bed columns at 10%, 50%, and 90% breakthrough (calculated from Fig. 1) are shown in Fig. 4. The values of kads and N0 were calculated from the intercept and slope, and the results are shown in Table 2. It can be seen that the correlation coefficient values are 0.99, which suggests that the data fit the BDST model. At lower breakthrough values, there are some active sites of the adsorbent still unoccupied by metal ions. The value of N0 in such low breakthrough condition is therefore bound to be lower than the full bed capacity of the adsorbent. A similar fact was also observed (Han et al., 2009).

Bed-depth service-time plot for Cu(II) adsorption at various breakthroughs (Fig. 1 data were used).
The Thomas model
The linearized form of the Thomas model is as follows:
where kTh is the Thomas rate constant (mL/min mg), q0 is the equilibrium uptake capacity (mg/g), Q is the volumetric flow rate (L/min), and W is the mass of the adsorbent (g). The kinetic coefficient (kTh) and the equilibrium uptake capacity (q0) can be determined from a plot of ln([C0/C]−1) against t at a given flow rate.
This model was applied to the data beginning at the breakthrough time and ending at the exhaustion time of the column. The determined coefficients and relative constants were obtained with linear regression analysis according to Equation (5), and the results are presented in Table 3.
With increasing inlet concentration, the concentration difference between the metal ions in solution and the metal ions on the adsorbent is enlarged and the driving force for adsorption is increased. However, the kinetics constant kTh tends to decrease as the concentration increases. These results agree with those obtained by other researchers (Aksu and Gönen, 2004; Calero et al., 2009).
It was also found (Table 3) that the model rate constant kTh decreased and the equilibrium adsorption capacity q0 increased with increasing bed depth. The decrease of kTh is due to the increase of mass-transport resistance with increasing bed depth in columns. The increase of q0 is due to the increase of adsorption sites with increasing bed depth.
The bed capacity q0 decreased and the coefficient kTh increased with increasing flow rates. The values of the regression coefficient R2 indicate that the model describes the column performance data well for the adsorption of Cu(II) (R2>0.95).
The averaged uptake q0 predicted by the Thomas model is 57.14 mg/g, with a standard deviation of 1.09 mg/g, which is quite close to the average experimental value. The difference between the average experimental uptake and the average value predicted from the Thomas model was statistically insignificant. Therefore, the Thomas model can be considered as a suitable kinetic model to describe Cu(II) adsorption in a fixed bed of PANI/SD.
The Yoon–Nelson model
The Yoon–Nelson equation for a single-component system is expressed as Equation (6):
where kYN is the Yoon and Nelson's rate constant (min−1) and τ is the time required to retain an adsorbate breakthrough of 50% (min). The linearized form of the Yoon–Nelson model is given as Equation (7):
This model has also been applied to the same range of effluent concentrations as for the Thomas model (between the breakthrough time and the saturation time). The values of kYN and τ were determined from ln[Ct/(C0−Ct)] versus t at different operating conditions. The values of kYN and τ are listed in Table 3. The rate constant kYN increased and the 50% breakthrough time (τ) decreased as the flow rate increased. The greater value for the rate constant when the inlet Cu(II) concentration is higher may be related to the increase in the forces that control the mass transfer in the liquid phase. On the other hand, the 50% breakthrough time τ significantly decreases when the inlet concentration increases, because the saturation of the column occurs more rapidly. As the bed heights increased, the values of τ increased, whereas the values of kYN decreased. With the Yoon–Nelson model, the values of the correlation coefficients (R2) listed in Table 3 also provide a fit (R2>0.97). The calculated τ values are quite close to those found experimentally.
Conclusion
This study evaluated the performance of polymer-coated sawdust fixed-bed systems for the removal of Cu(II) from aqueous solution. Polyaniline was directly synthesized on the surface of sawdust by adding an ammonium peroxydisulfate in an aniline solution under acidic conditions. This polyaniline/sawdust was used as an adsorbent in fixed-bed columns. The results of this study show that PANI/SD can efficiently remove Cu(II) from wastewater.
Footnotes
Author Disclosure Statement
No competing financial interests exist.