
Abstract
Abstract
In this study, iron oxides immobilized onto silica and alumina granular carriers in a fluidized-bed reactor were applied as silica granule (SG) and alumina granule (AG) catalysts, respectively; the SG and AG catalysts were used to explore the catalytic decomposition of H2O2. Effects of H2O2 concentration and temperature on the oxidation of aniline were determined to compare the reactive efficiencies of the SG and AG catalysts. Results showed that H2O2 decomposition could be efficiently catalyzed by the SG and AG catalysts. Degradation rates of aniline increased with increasing H2O2 concentration and temperature in both catalyst systems. The AG catalyst (smaller particle size) had more surface sites for precipitation of iron oxide than the SG catalyst (larger particle size). Consequently, in the initial stages of the reaction, hydroxyl radicals (•OH) were generated more rapidly with the AG catalyst than with the SG catalyst and the degradation of aniline by the AG catalyst was faster than that by the SG catalyst. The activation energy (Ea) value for aniline was 13.65–15.54 kJ mol−1.
Introduction
The optimum pH for the Fenton process was found to be pH 3. In the conventional Fenton process (Eq. 1), a low pH can prevent the rapid oxidation of Fe2+ and improve the rate of H2O2 decomposition. However, the Fenton reaction produces a significant amount of ferric hydroxide sludge following the destruction of the organic compounds, which requires further separation and disposal. According to previous studies (Chou et al., 1999, 2001), the fluidized-bed Fenton process has been proposed as a possible solution to the problem of ferric hydroxide sludge, whereby Fe3+ is transformed into an iron oxide precipitated or crystallized on the carrier surface in the fluidized-bed reactor (FBR). The fluidized-bed Fenton process includes homogeneous chemical oxidation (Fe2+/H2O2), heterogeneous chemical oxidation (iron oxide/H2O2), fluidized bed crystallization, and the reductive dissolution of iron oxides. This process efficiently degrades organic compounds and reduces the production of ferric hydroxide sludge. Further, the ferric hydroxide coated on the carrier could act as a heterogeneous catalyst for H2O2 decomposition (Chou et al., 2001).
The immobilized iron oxides that are produced from the FBR could be used as catalysts for the efficient degradation of organic compounds (Hsueh et al., 2006; Huang and Huang, 2008; Huang et al., 2009b). Moreover, the immobilized iron oxides were recyclable and cheaper than active iron oxides (Huang et al., 2009a). Hsueh et al. (2006) prepared an iron oxide catalyst using alumina grains as a support for the oxidation of the azo dye Reactive Black 5. Huang and Huang (2008) have reported the use of iron oxide immobilized on a silica support for the catalytic degradation of phenol. However, the effect of the carrier types for the crystallization or sedimentation of iron oxide on the degradation of aniline has not been studied thus far.
In this study, silica and alumina granules were used as carriers for preparing immobilized iron oxide catalysts. The objective of this study is to explore the effect of loading of catalyst and properties of catalysts (SG, iron oxide precipitation on silica granule; AG, iron oxide precipitation on alumina granule) on the catalysis of H2O2. Further, the study compares the effect of temperature and H2O2 concentration on the rate of aniline degradation and activation energy in the presence of the SG and AG catalysts.
Materials and Methods
Materials and iron oxide catalysts
The SG and AG catalysts, that is, immobilized iron oxide on silica and alumina carrier, respectively, were developed in the following manner (Huang and Huang, 2008; Huang et al., 2009a). The ferrous ions in groundwater were oxidized by aeration, and the iron oxide produced was simultaneously immobilized on the silica and alumina carriers in a FBR. The internal circulation of the FBR was controlled to maintain an up flow superficial velocity of 40m/L with 50% bed expansion. The SG and AG catalysts were collected from the FBR for over 3 months. Aniline (Merck) and H2O2 (35%; Merck) were of reagent grade, and they were used without further purification. The solution pH was adjusted to 3 at the initial stage using HCl and NaOH. The dissolved iron species were determined using an atomic absorption spectrometer (Hitachi Z6100 polarized Zeeman).
Characterization of iron oxides
The crystallization of the iron oxides was measured using X-ray diffraction with CuKα radiation (Rigaku RX III). The surface area and porosity of the catalysts were measured using Micromeritics ASAP 2010. The specific surface area of the catalyst was calculated using the BET equation.
Catalysis of H2O2 and degradation of aniline
H2O2 was added to a 0.5 L beaker and the solution pH was adjusted to 3. The temperature was controlled in water baths. Then, the SG/AG catalysts were added to the beaker, and the reaction began at a stirring speed of 150 rpm. Samples withdrawn during the reaction were filtered using 0.45 μm membrane filters. The concentration of H2O2 was detected by the standard method using titanium sulfate (Eisenberg, 1943). In the catalytic degradation of aniline, a 0.001 M aniline solution was conditioned in a 0.5 L beaker and treated with H2O2 and the SG/AG catalyst systems at a stirring speed of 150 rpm. The concentration of the withdrawn aniline was measured using a gas chromatograph (HP4890) equipped with a flame ionization detector and an HP-5 column (ø 0.53 mm×15 m). The column temperature was initially set at 85°C for 3 min, increased to 200°C at 65°C/min and maintained for 5 min. The injector and detector temperatures were set at 250°C.
Results and Discussion
Catalyst properties
Figure 1 shows the X-ray diffraction patterns of the SG and AG catalysts; the presence of an amorphous phase is due to the ambient temperature preparation (room temperature). The physical properties of the catalysts are presented in Table 1. The particle size of the AG catalyst is smaller than that of the SG catalyst. It was also observed that there was more iron precipitation and/or crystallization on the surface of the alumina granules. Moreover, the specific surface area of the AG catalyst is slightly larger than that of the SG catalyst, which suggests that the AG catalyst has more active sites for the adsorption and desorption reactions. It was found that the immobilized iron oxides were not readily removed from the surface of the silica and alumina granules by agitation (the result is not shown), which indicates that the content of immobilized iron oxides was not changed during the catalysis of H2O2.
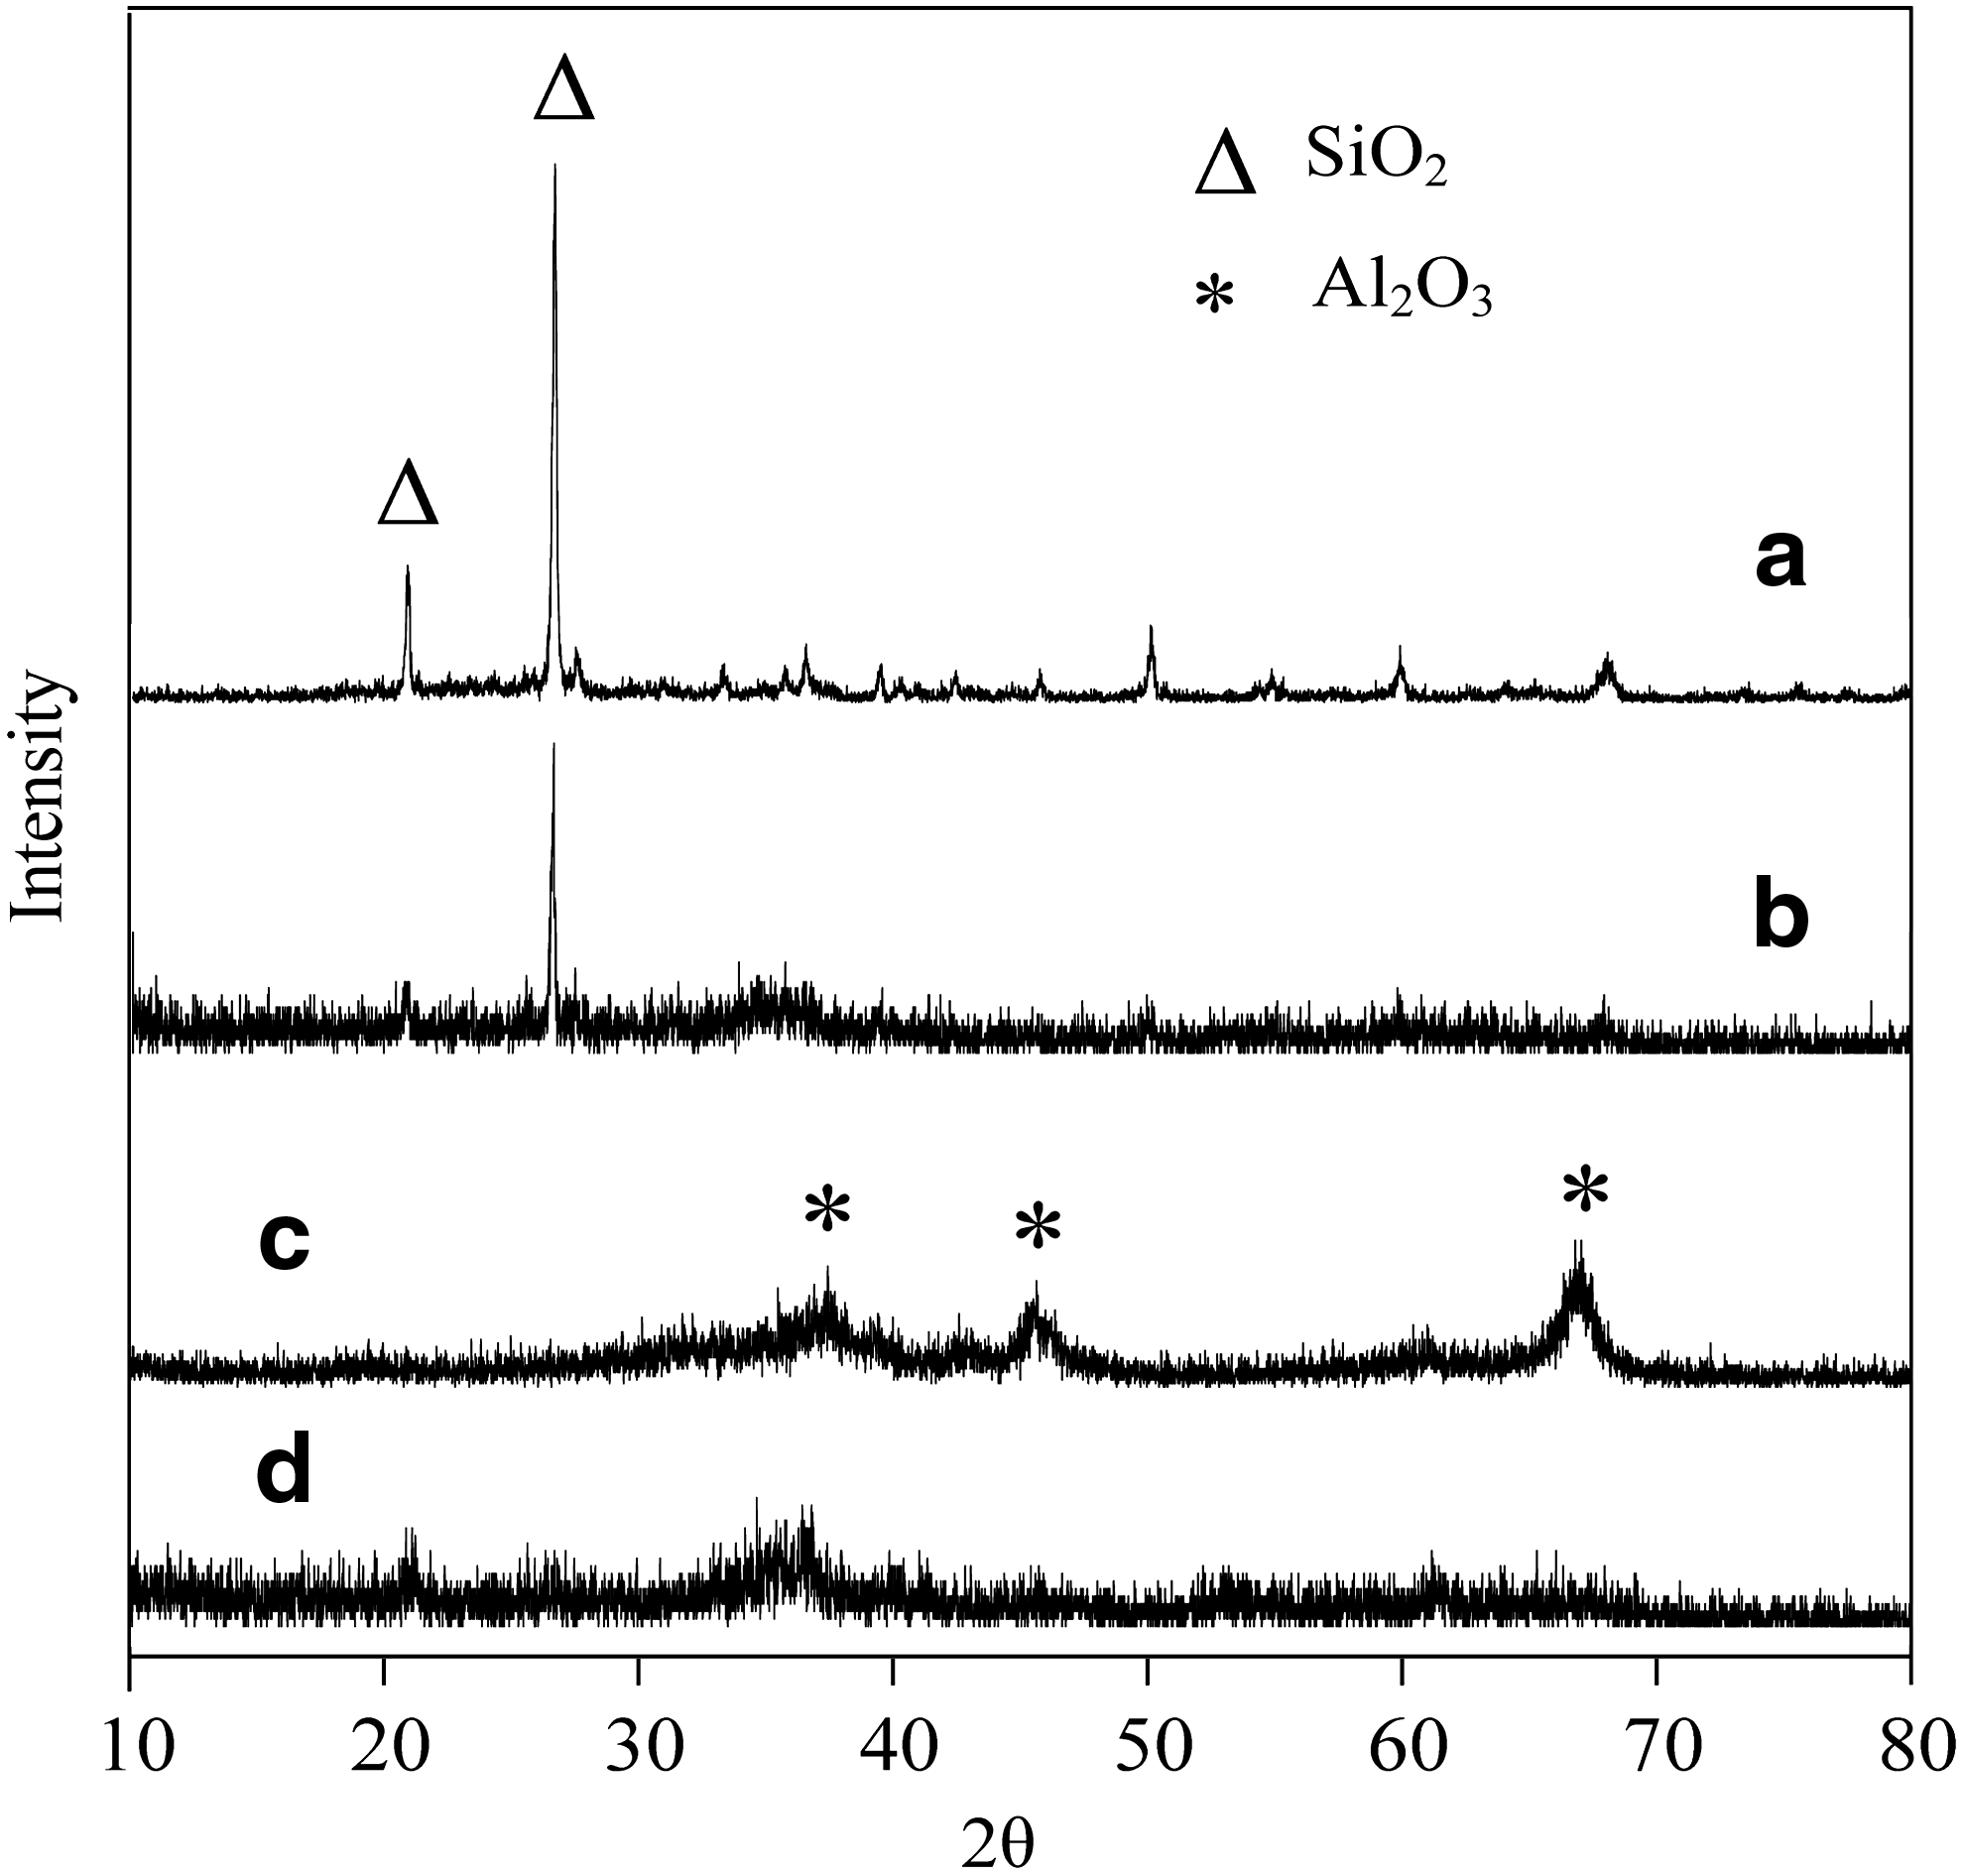
X-ray diffraction patterns of
Mass of solid divided by volume of solid and void.
Mass of solid divided by volume of solid.
Comparison of the effect of concentration and properties of immobilized iron oxide catalysts on H2O2 catalysis
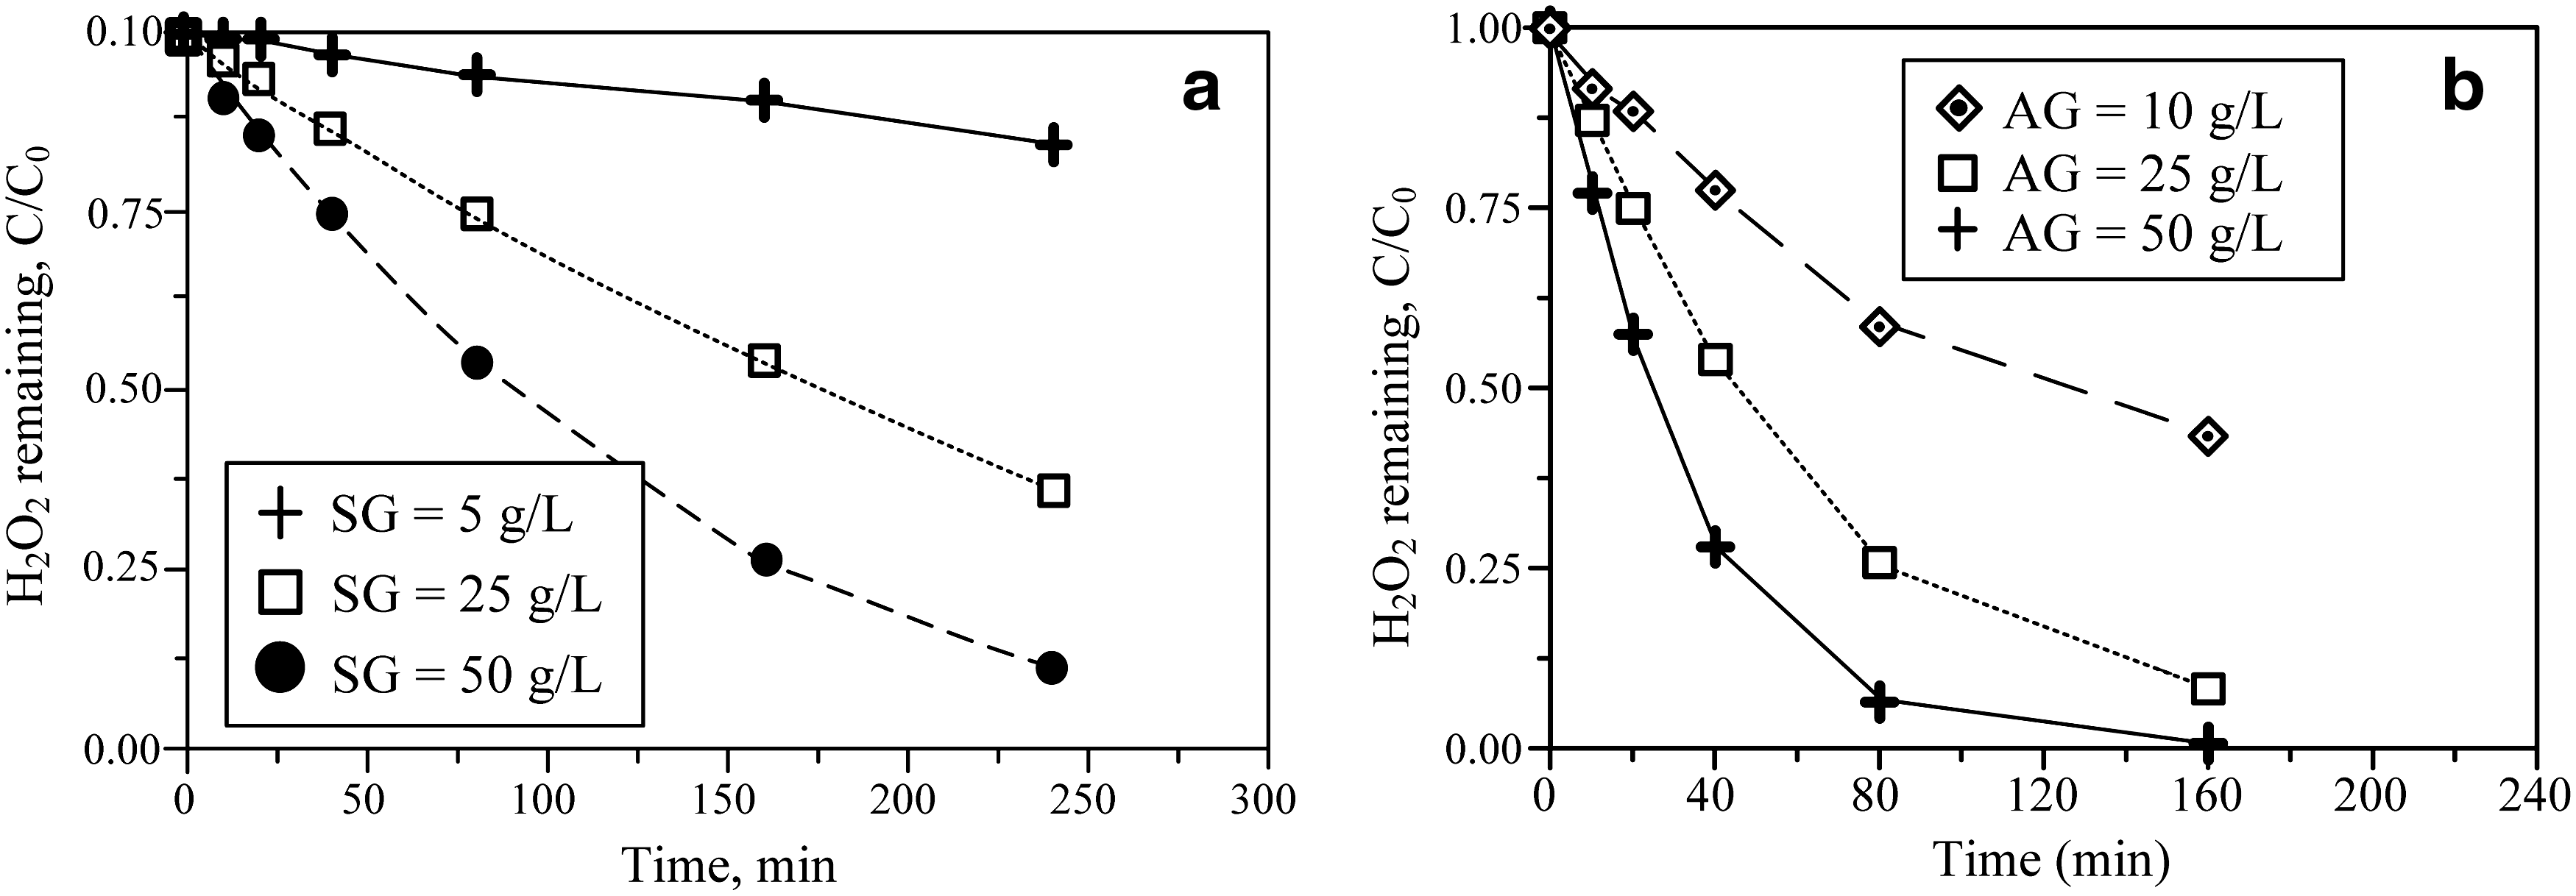
Catalyst loading has a significant effect on the catalysis of H2O2. Figure 2 shows the plot of H2O2 concentration against reaction time for various loadings of the catalyst. A change in the catalyst loading from 5 to 50 g/L results in a substantial increase in the decomposition of H2O2. H2O2 was completely consumed in the presence of the AG catalyst within a reaction time of 160 min. On the other hand, in the case of the SG catalyst system, there was a gradual decline in the H2O2 concentration with increasing reaction time. Nonetheless, the amount of residual H2O2 was very close to zero at reaction time of 240 and 80 min for the SG catalyst and AG catalyst systems, respectively. The initial reaction between H2O2 and iron oxides was assumed to be the rate limiting reaction (Miller and Valentine, 1999). From the results, the decomposition of H2O2 followed pseudo first-order kinetics:
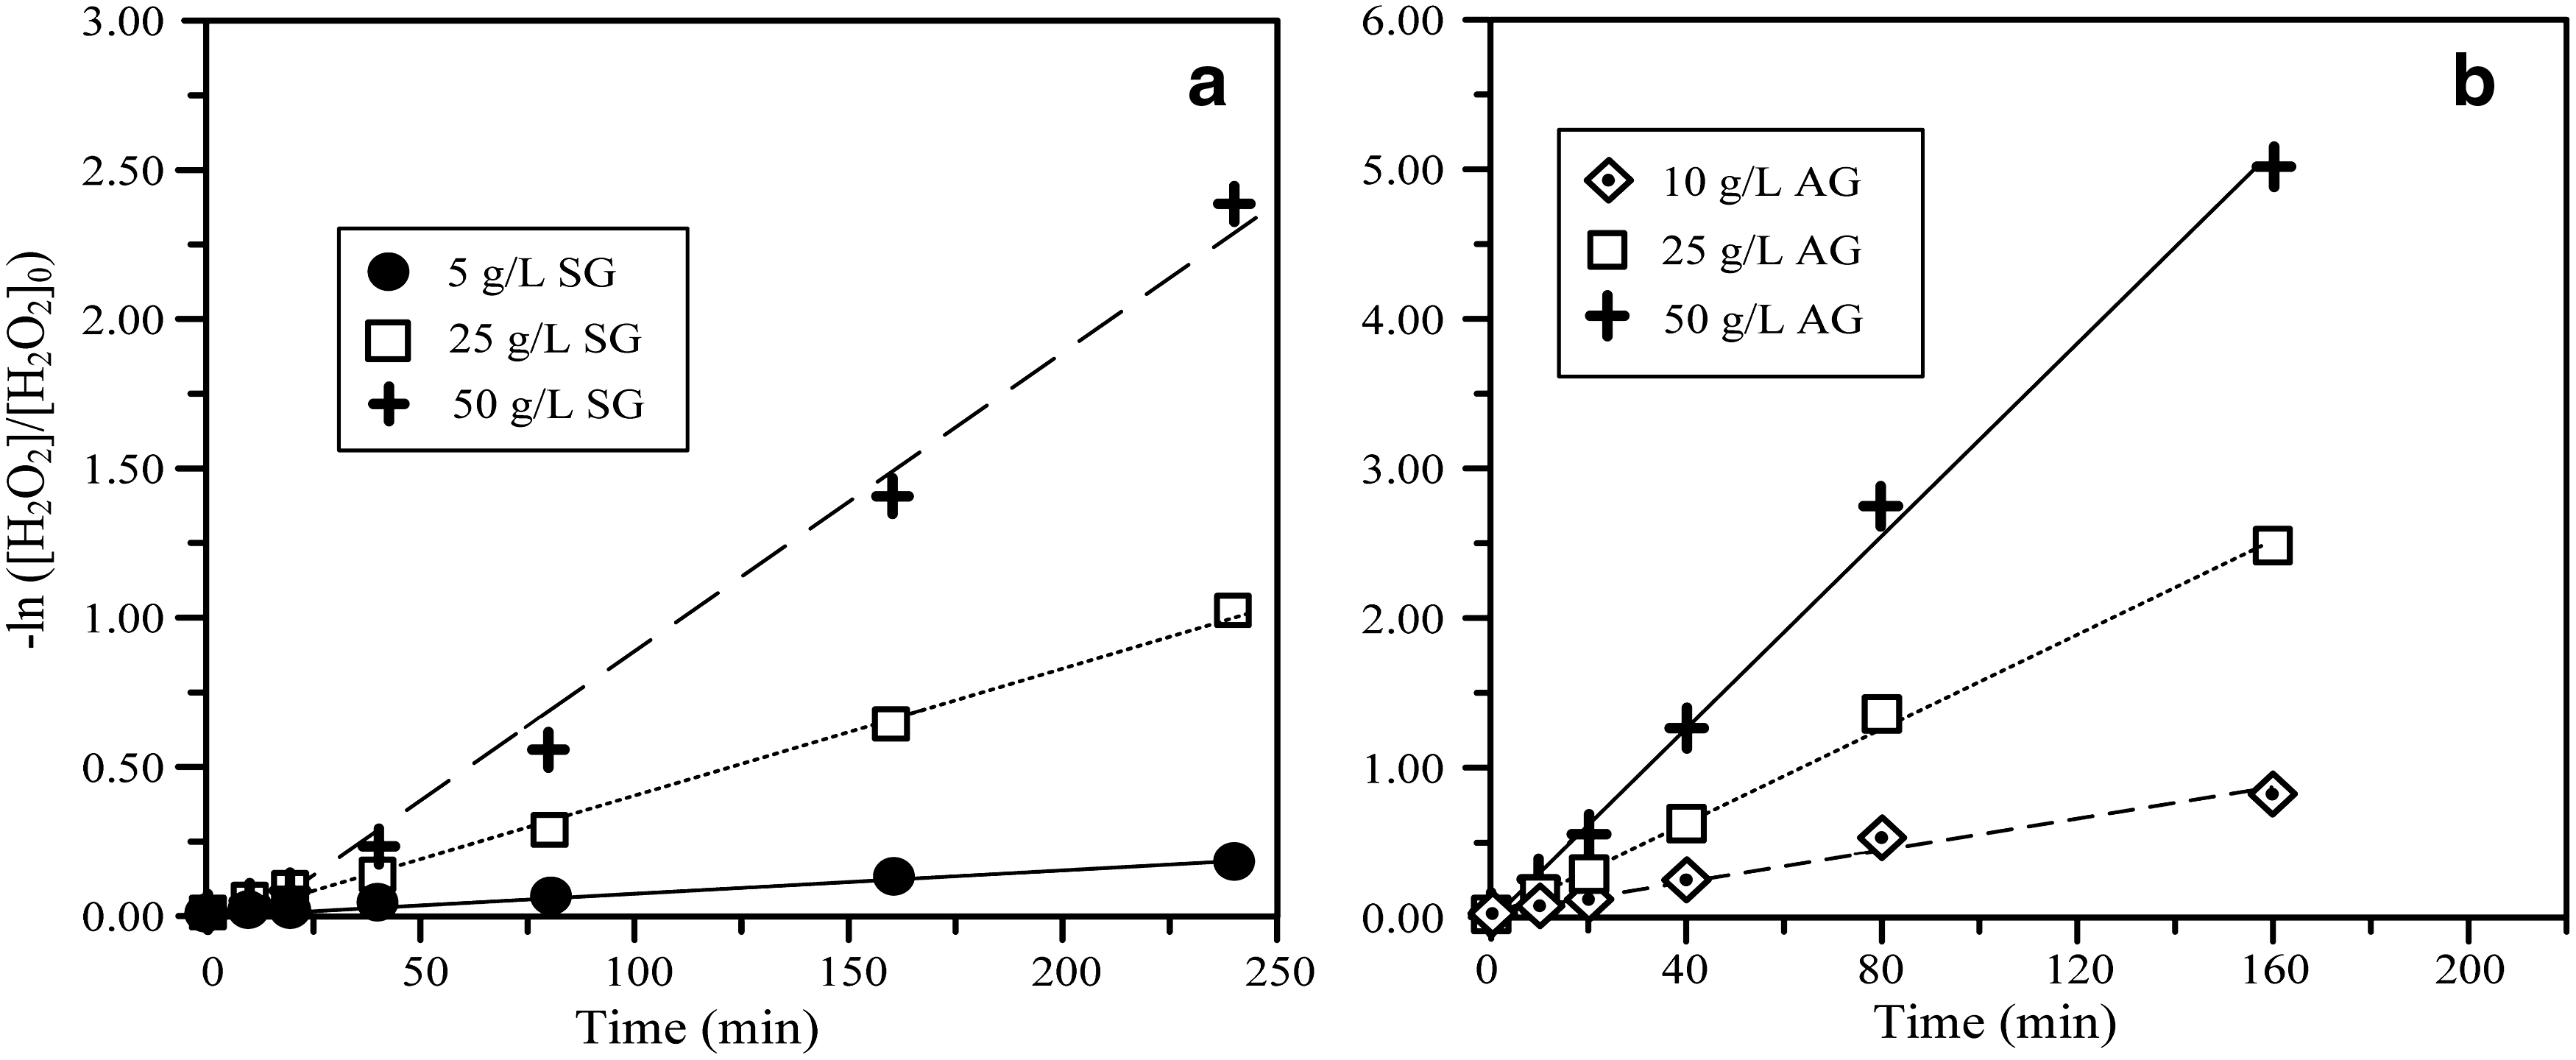
Effect of SG
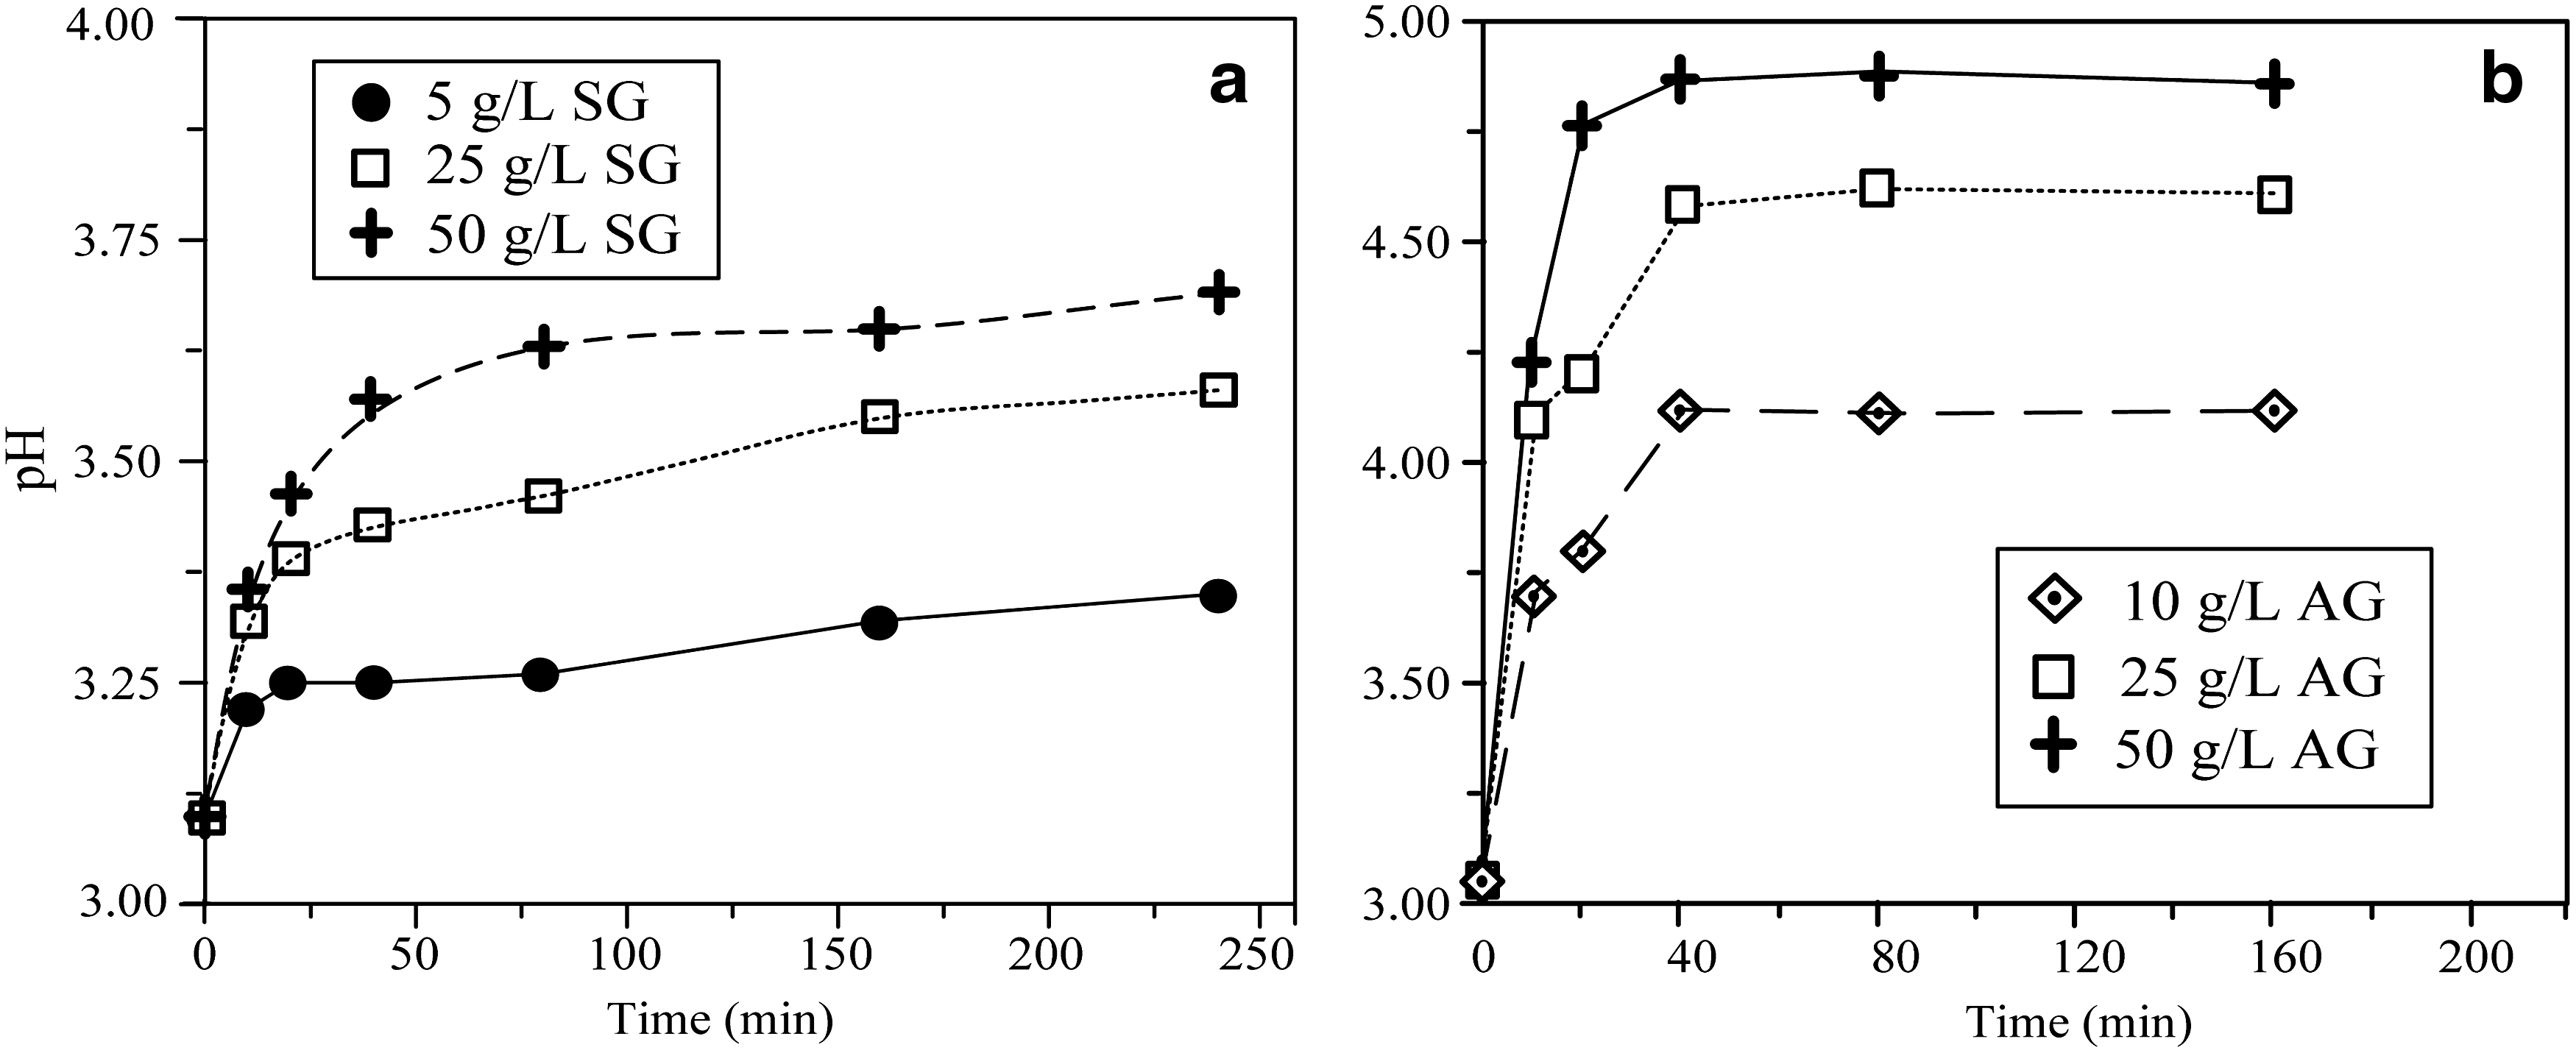
where k app is the apparent first-order rate constant, [H2O2] and [H2O2]0 are the concentrations of H2O2 in the solution at time t and time zero, respectively. The rate constant k app represent the ability of the surface reaction of iron oxide with H2O2. This type of phenomenon was also suggested in the literature (Miller and Valentine, 1999; Gallard and Laat, 2000). The data in Fig. 3 were fitted using linear regression to yield correlation coefficients>0.980. Figure 3a and b show that the decomposition rate of H2O2 was dependent on the loading of the SG and AG catalysts. The generation rate of the •OH radical was proportional to the consumption rate of H2O2 (Kwan and Voelker, 2003). These results indicate that catalyst loading of 50 g/L was optimal, and this loading was used in the subsequent experiments. A plot of the apparent first-order H2O2 decomposition rate (k app ) as a function of the SG and AG catalyst loading (Fig. 4), shows that the k app values are proportional to the amount of catalyst. Further, the k app value in the presence of the SG catalyst is significantly smaller than that with the AG catalyst. From Fig. 5, it can be seen that the catalytic decomposition of H2O2 led to an increase in pH values with both SG and AG catalysts, and the final pH value (at 40 min) was proportional to the amount of SG and AG added. This implies that the H2O2 decomposition was not substantially affected by the pH variation. In addition, the heterogeneous chemical oxidation (iron oxide/H2O2) was not significantly affected by the pH of the solution, as compared with the homogeneous chemical oxidation (Fe2+/H2O2).
Kinetics of H2O2 decomposition with various loadings of
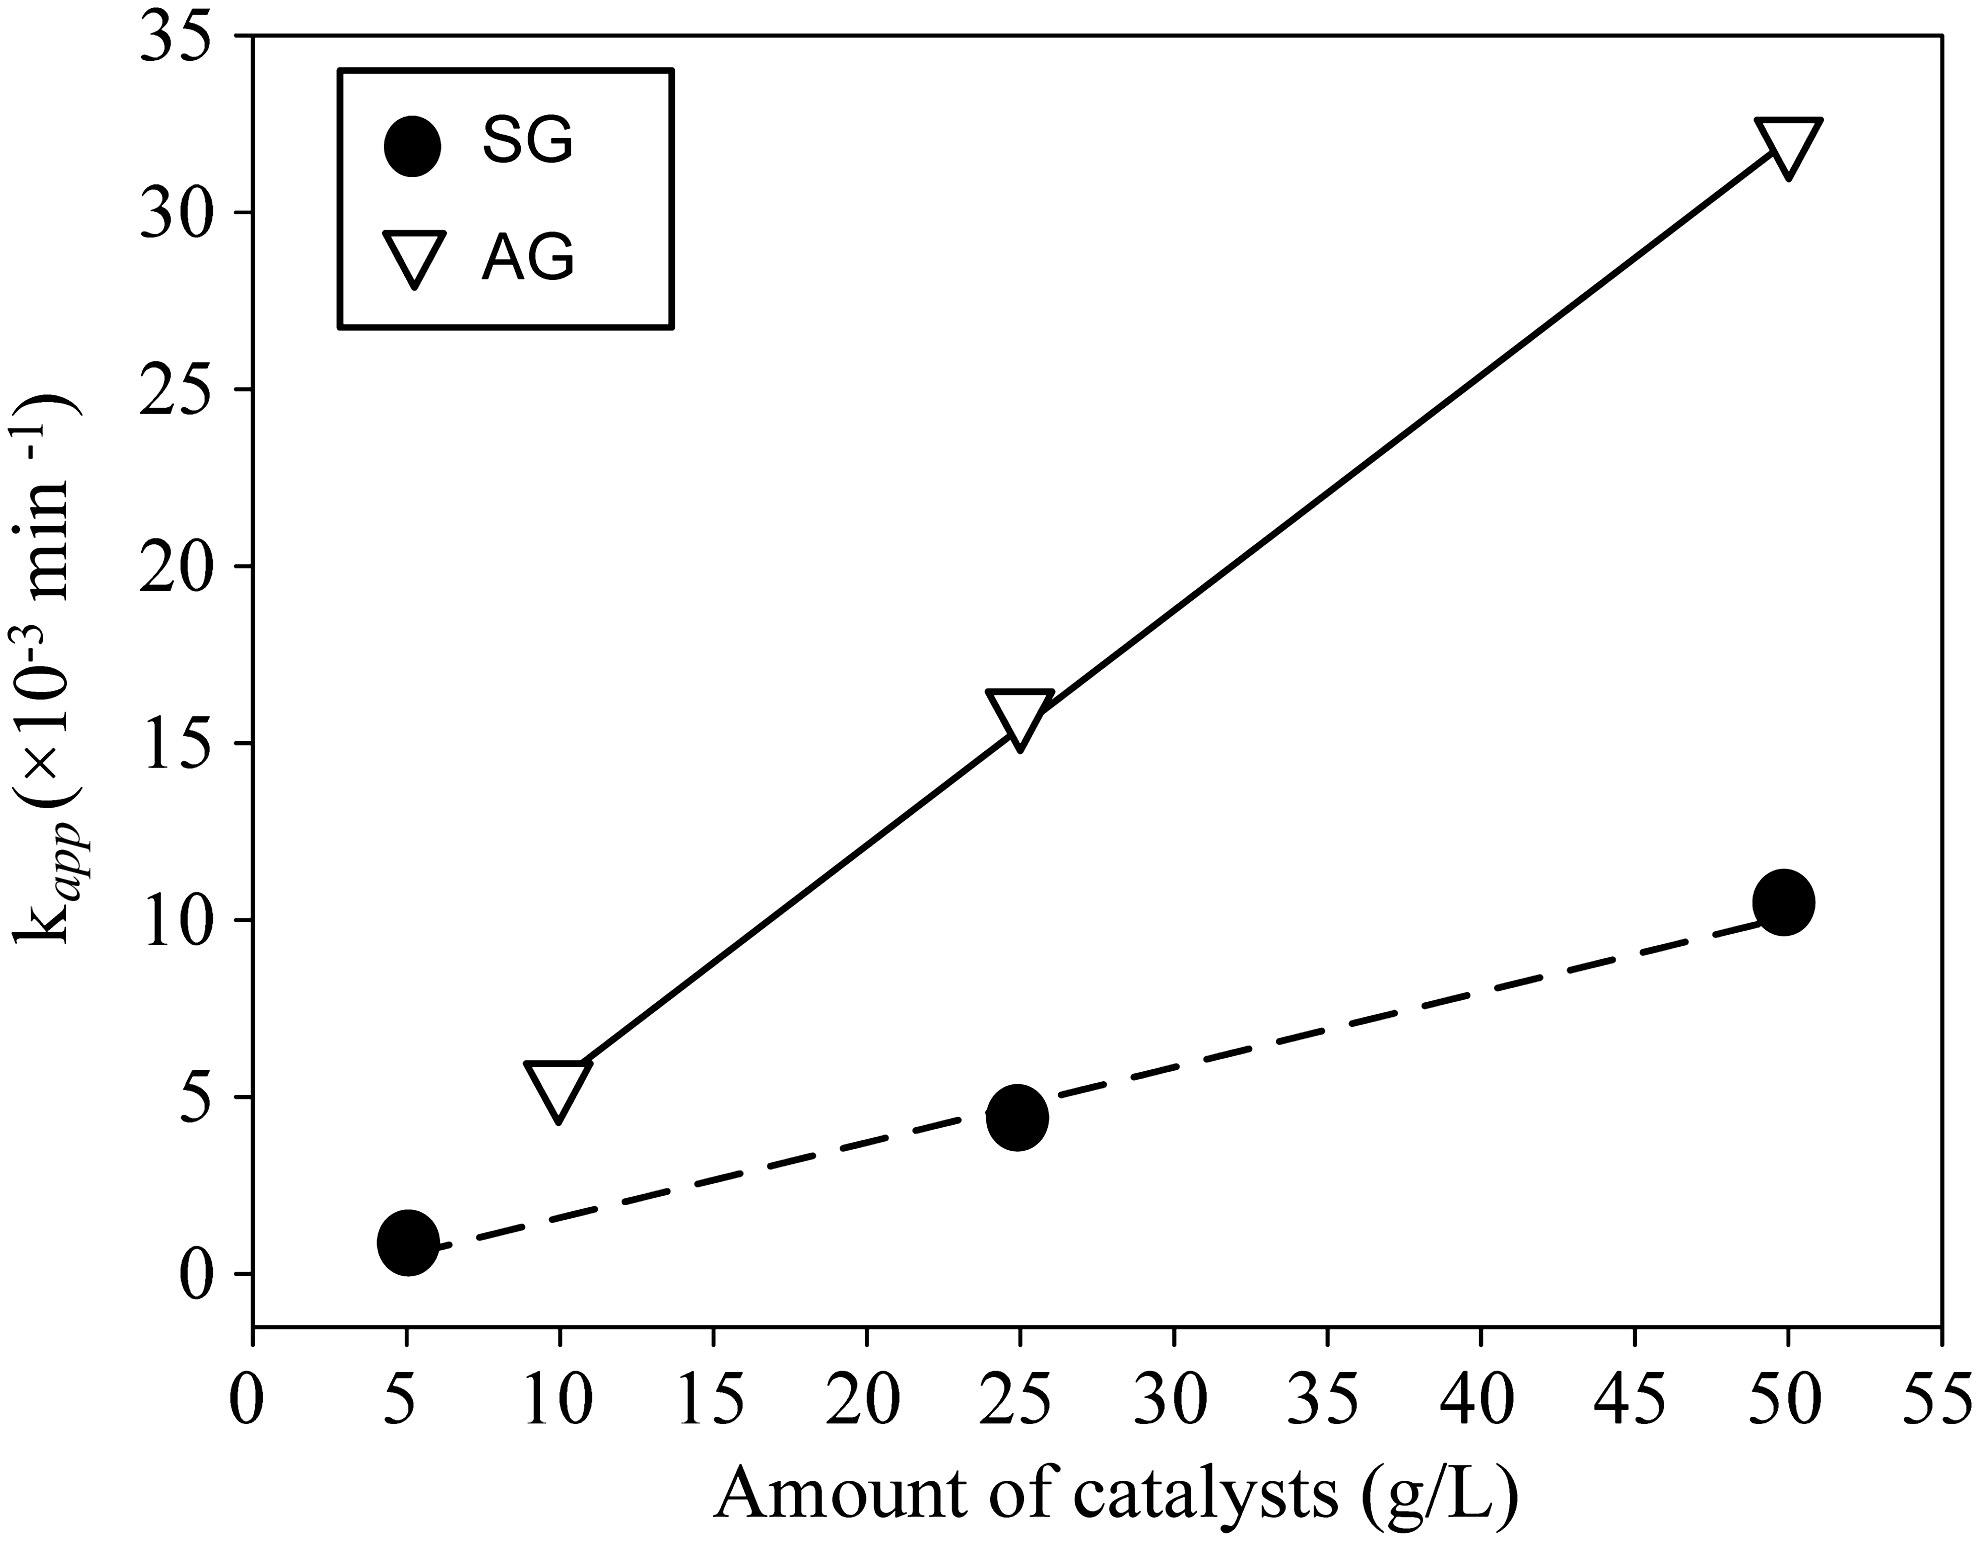
Various kapp values with different loadings of catalyst ([H2O2]=0.05 M, pH 3, 30°C).
pH variation during the H2O2 decomposition with various loadings of
Effect of H2O2 concentration and temperature on aniline degradation
In the Fenton process, the H2O2 concentration is directly related to the number of •OH radicals. Figure 6a and b show that aniline can be degraded by H2O2 in the presence of SG and AG catalysts at different concentrations of H2O2. The degradation rate of aniline increased with increasing H2O2 concentration in the case of both catalysts. Aniline removal is greatly enhanced during the first 80 min in the AG catalyst system. However, the aniline removal is gradually rises by the SG catalyst system with increasing reaction time until the end of reaction. The degradation of aniline in the AG catalyst system is higher than that in the SG catalyst system. As in the case of 0.1 M H2O2, around 60% of the aniline was degraded after 80 min in the AG catalyst system and after 160 min in the SG catalyst system. The result suggests that AG has more active sites than SG and, therefore, •OH radicals are generated more rapidly in the solution with the AG catalyst. Consequently, aniline was significantly degraded in the presence of the AG catalyst.
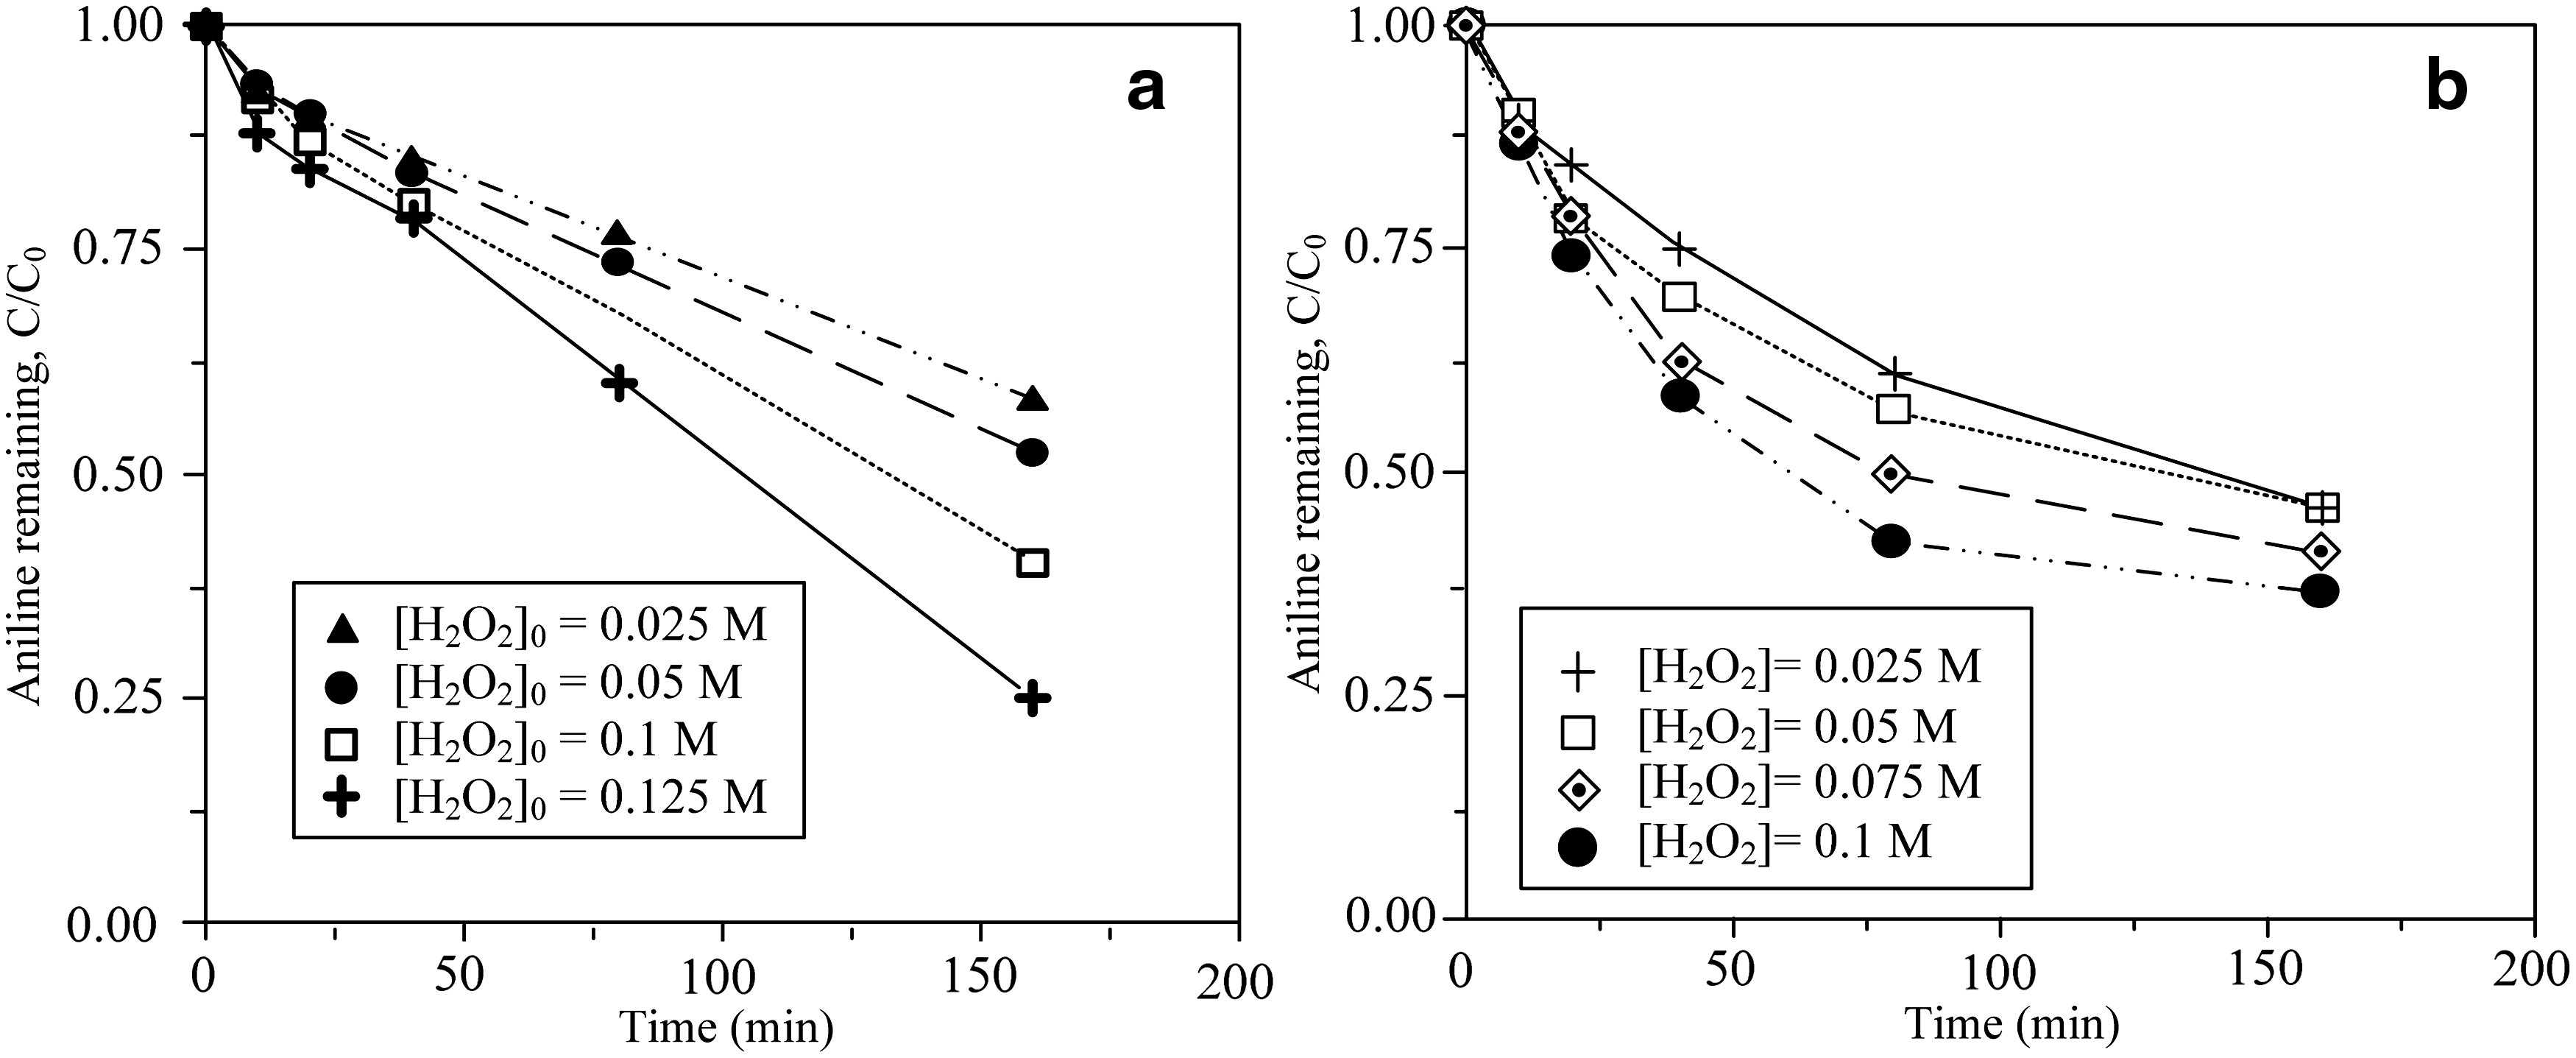
Effects of H2O2 concentration on aniline degradation at
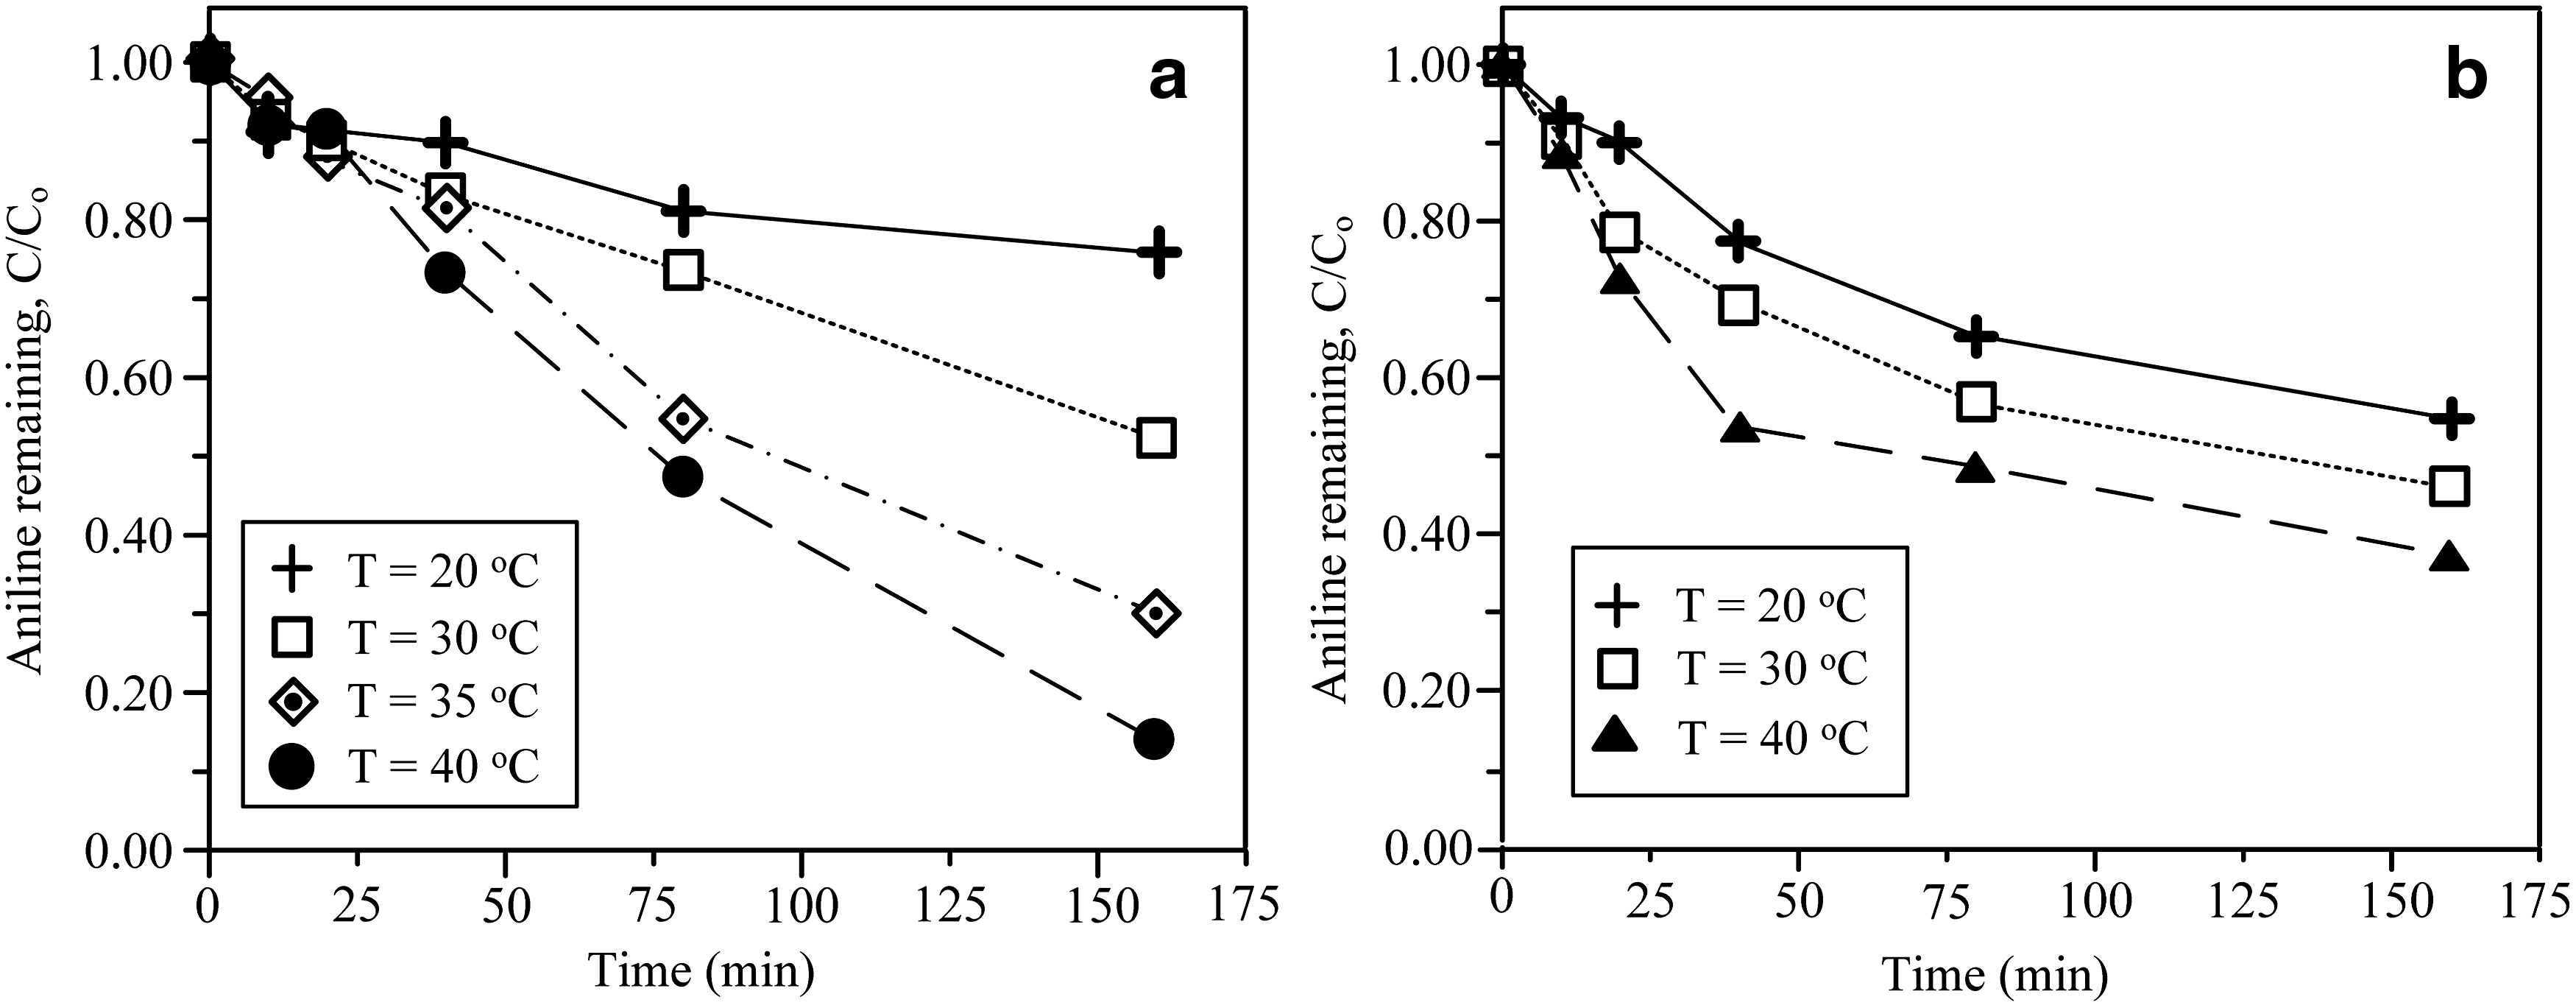
Figure 7 shows the plot of the aniline concentration against reaction time (0–160 min) for various temperatures. The increase in the reaction temperature can increase the overall degradation of aniline. However, the effect of temperature on the degradation of aniline is quite different for the SG and AG catalysts systems. Before a reaction time of 25 min, the aniline oxidation was not significantly changed as the temperature was increased from 20°C to 40°C in the SG catalyst system. After 40 min, the degradation of aniline showed a significant increase with increasing temperature. At the end of the reaction, about 24% and 86% aniline were eliminated in the SG catalyst systems at 20°C and 40°C, respectively. The result showed that a high temperature (over 35°C) leads to remarkable interaction between H2O2 and the SG catalyst, which gradually produces •OH radicals to attack aniline. In the AG catalyst system, the degradation of aniline increased significantly as the temperature increased from 20°C to 40°C, before a reaction time of 80 min. After 80 min, the degradation of aniline slowed slightly because the H2O2 decomposition was almost complete during the first 80 min of the reaction, when 50 g AG catalyst/L was used (Fig. 2b). At the end of the reaction, around 46% and 62% aniline were eliminated in the AG catalyst system at 20°C and 40°C, respectively.
Effects of temperature of solution on aniline degradation at
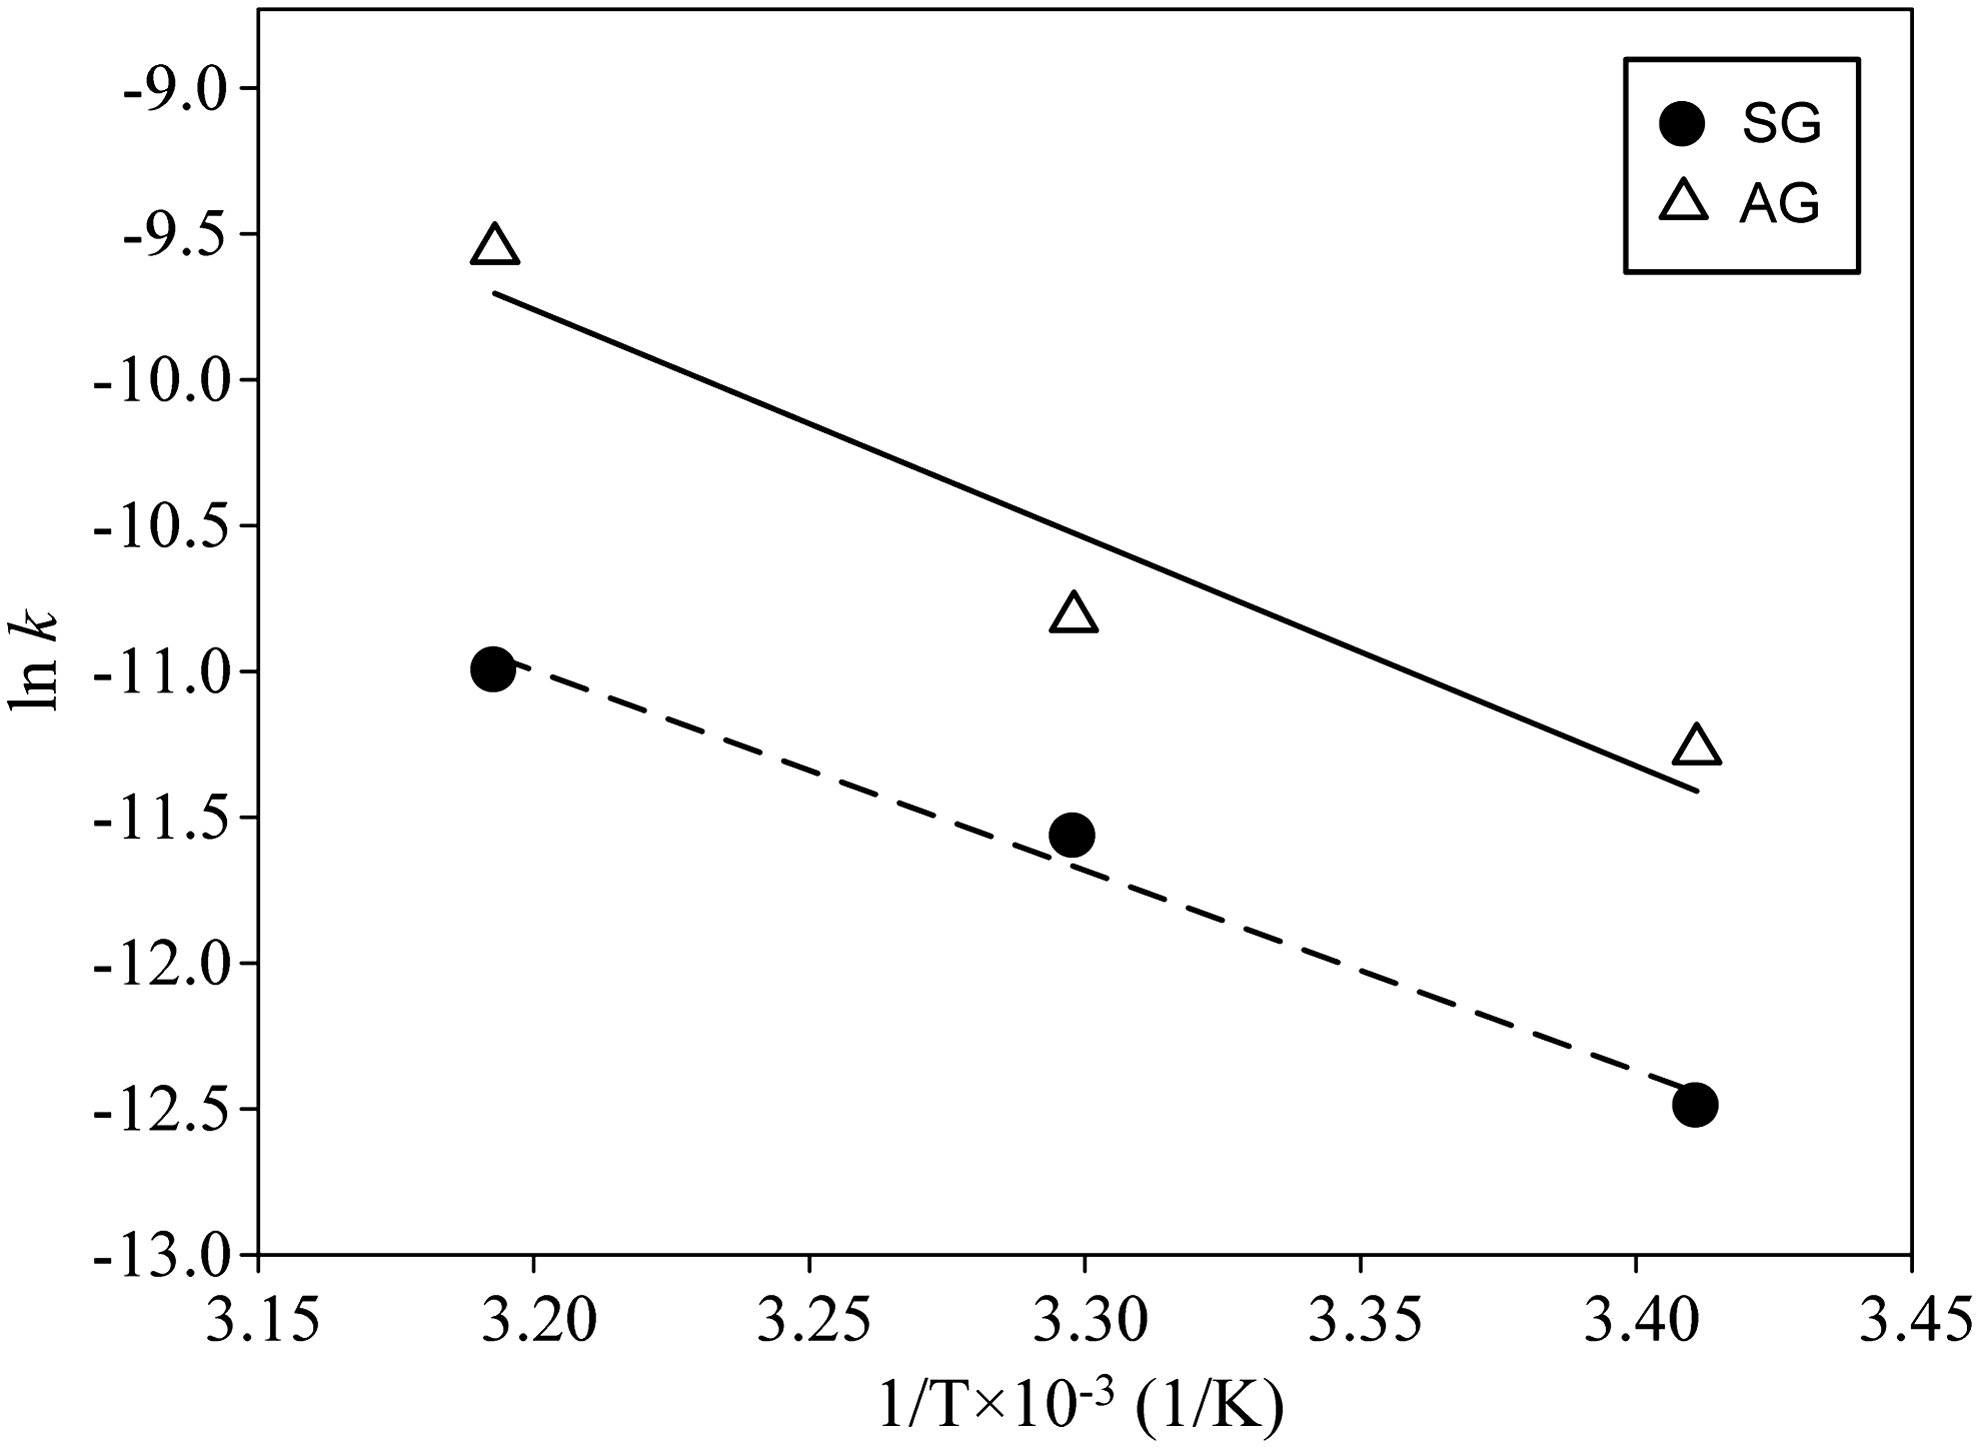
Figure 8 shows the Arrhenius plot (ln k versus 1/T) of the data. The activation energy (Ea) of the reactions was obtained from the slope of the straight lines. The Arrhenius equation is as follows:
Kinetics of aniline degradation at different temperatures. Initial conditions were as follows: 1×10⁻³ M of aniline, 0.05 M of H2O2 and 50 g catalysts/L at pH 3.
where k0 and k are the frequency factor and reaction rate constant, respectively. T and R denote the absolute temperature and ideal gas constant (8.314 J mol−1K−1), respectively. Temperature has a significant effect on the reaction rates, and temperature control provides unique insights into the reaction mechanisms. The measured activation energy values for the degradation of aniline in the presence of SG and AG catalysts were 13.65 and 15.54 kJ/mol, respectively. These values imply that the surface chemical adsorption is not the rate limiting process.
Conclusions
The k app values reflect the properties of the surface coated iron oxide related to the reaction with hydrogen peroxide; the AG catalyst has higher k app value. The higher k app value was attributed to the presence of more sites for the surface precipitation of iron oxide on the AG catalyst (smaller particle size), as compared with the SG catalyst (larger particle size). This resulted in the rapid generation of hydroxyl (•OH) radicals and an increase in the rate of H2O2 consumption in the initial stages of the reaction, in the presence of the AG catalyst. The degradation rates of aniline increased with increasing H2O2 concentration and temperature in both catalyst systems. Before 80 min, H2O2 was rapidly catalyzed in the AG catalyst system at various temperatures, accompanied by a significant increase in the degradation of aniline. In the SG catalyst system, the degradation of aniline gradually increased because of the mild generation of •OH radicals. The activation energies (Ea) of aniline degradation in the presence of SG and AG catalysts were 13.65 and 15.54 kJ mol−1, respectively.
Footnotes
Acknowledgment
The authors would like to thank the National Science Council of Taiwan for financially supporting this research under Contract No. NSC 96-2628-E-041-001-MY3.
Author Disclosure Statement
No competing financial interests exist.