
Abstract
Abstract
Knowledge of the biokinetic parameters of heterotrophic biofilm is important for reliable modeling and optimization of biofilm wastewater treatment systems. In this article, an approach to quantify heterotrophic biokinetic parameters, including the maximum specific oxygen uptake rate (
Introduction
Microelectrodes as a powerful tool have been developed and used over the last several decades to investigate the microbial processes in the biofilm (Gillam et al., 2005). Yurt et al. (2003) developed a method of extracting growth parameters based on the in situ measurement of oxygen microprofiles in the colony biofilm of L. discophora; however, only the colony biofilm composed of single microbial species has been inspected. Further, the biomass density used in the model is usually assumed to be constant represented by the mean volatile suspended solids (VSS), despite the fact that the density varies tremendously across the biofilm depth (Zhang and Bishop, 1994; Beyenal and Lewandowski, 2000). Phospholipids, present on bacterial membrane up to 90%–98%, do not form part of cell reserves and are easily degraded during bacteria lysis, which make it reasonable to use the phospholipids concentration to represent the living biomass in biofilms (Findlay et al., 1989).
In the study, an approach is established and evaluated to quantify the growth biokinetic parameters of biofilm in wastewater treatment by means of oxygen microelectrodes. The layered VSS was obtained by using the spatial distribution of living biomass determined by the phospholipids analysis and micro-slicing technique. Results of biokinetic parameters derived from the average and layered VSS were compared to investigate the impact of biomass heterogeneity on the biokinetic parameters of biofilm.
Materials and Methods
Biofilm systems
The support material for biofilm was a piece of flat polymerized ethylene resin with an area of 30 mm×30 mm. One side of the resin was rubbed coarse to make the bacterial inoculation easier. The introduced activated sludge was taken from a bench-scale oxidation ditch. After 1 day of inoculation, the introduced activated sludge was completely withdrawn. Subsequently, eight pieces of support material were immersed in a 2.5 L reactor, and the biofilm was statically cultured with domestic wastewater from the drainage of Tsinghua University Campus (Table 1) at a room temperature of 18°C±2°C. Air from the gas blower was introduced to the reactor to maintain an oxygen concentration of about 5–6 mg/L. The domestic wastewater in the reactor was shifted every 12 h. After 2–3 months of operation, the biofilm was ready for experiment.
Except pH.
Microelectrode measurements
The schematic set up for the in situ microelectrode measurement of oxygen microprofiles in the biofilm was shown in Fig. 1. One piece of media was taken from the reactor for microelectrode measurement, from which the biofilm grown on one side of the substratum was wiped off. The nonbiofilm side was fixed onto a measuring vessel. A metal-alloy-filled solid-state microelectrode with gold electroplated on the electrode tip was fabricated with a tip diameter of about 10 μm as reported by Yu (2000). The 90% response time of the microelectrodes was in most cases <15 s with an insignificant stirring sensitivity (<5%). The manipulating of microelectrode as well as how to minimize the ambient interference can be found in our previous work (Zhou et al., 2008b, 2008c).

Experimental set up for measurement of oxygen in biofilm by microelectrode.
Phospholipids analysis
The spatial distribution of layer phospholipids concentration in the biofilm was acquired by using microslicing technique as similar as reported by Taylor et al. (1997). A biofilm sample with an area of ∼0.5 cm×0.5 cm cut from the support media with a blade was attached to a cutting stage with the freezing compound (Tissue-Tek O.C.T. 4583; Miles, Inc.). Biofilm was sliced parallel to its surface by using a (LEICA CM1900) cryostatic microtome with 40 μm thickness. Four or five adjacent slices were accumulated and then transferred to carry out the phospholipids analysis. The detailed procedures of phospholipids analysis are described by Zhang and Bishop (1994).
Quantification of the biokinetic parameters in the biofilm
The basic assumptions will be made in the following kinetic analysis:
1. The rates of bacterial growth and substrate removal can be represented by the Monod kinetics, and the rate of reaction is not affected by the presence of reaction products; 2. Oxygen is the growth limiting factor; 3. Oxygen in the biofilm is transported by diffusion in the form of Fick's first law.
Based on the assumptions just mentioned, mass balance for dissolved oxygen through biofilm in one dimension is expressed as follows by taking into consideration the maintenance process.
where So is the oxygen concentration, mg O2/L; D is the effective diffusion coefficient of oxygen in biofilms, assumed to be 1.43×10⁻⁵ cm2/s (25°C), 32% lower than the value in pure water as reported by Beyenal and Tanyolac (1994a);
where Sob is the oxygen concentration at the interface of bulk solution/biofilm, mg O2/L; xL is the depth of biofilm, mm. A numerical solution algorithm was applied to compute the biokinetic parameters in Eq. (1). All computations were performed by MATLAB program as follows:
1. Reading the experimental data (So with respect to x); 2. Assuming 3. Using minimization searching procedure to find the optimized biokinetic parameters. 4. Calculating the sum of squares of the difference (SSD) between the pairs of computed and measured values as
Minimization search procedure continues until it finds
O2 profiles in the biofilm
The trustworthiness of the biokinetic parameters depends on how closely the experimental system and the experimental procedures adhere to the assumptions of the model we used. Oxygen is the growth limiting substrate that was assumed in this study. To make sure that this assumption applied, the following experiment was conducted. First, biofilm in the measuring vessel was immersed in the tap water without adding substrate for over 24 h. Then, the external substrate at concentrations of 500, 1000, and 2000 mg COD/L (in form of glucose), respectively, was supplied into the vessel to replace the pure water. After 2 h of cultivation, O2 profiles in the biofilm were sequentially measured at each concentration to determine the condition for which microbial growth in the biofilms was limited by oxygen. After that, O2 profiles were re-measured at the different locations in the biofilm. Note that the bulk solution over the biofilm maintained stable growth without influent and effluent during the whole experiment.
All measurements were conducted at a room temperature of 18°C±2°C.
Results and Discussion
Biofilm
After 2 months' cultivation, biofilms with thickness of 1.2–1.5 mm was observed growing on the supporting media. The spatial distribution of living biomass in forms of phospholipids concentrations was measured as depicted in Fig. 2, as well as the average biofilm density in forms of VSS was measured to be 27.1 g VSS/L (n=10, S.D.=3.4 g VSS/L). The phospholipids values were in the range of 803–1892 mg P/L with a maximum value occurring at the depth of 0.64 mm, indicating the highest concentration of the living cell in the biofilm. Previous studies have shown that the phospholipids values have a linear relationship with biomass in a unit of TSS or VSS (Findlay et al., 1989; Zhang and Bishop, 1994); therefore, the layered VSS were obtained according to the spatial distribution of phospholipids and used in the following model of biokinetic parameters.

Spatial distribution of phospholipids concentrations measured in the biofilm.
Oxygen microprofiles in the biofilm
Figure 3 demonstrated the measured oxygen microprofiles in the biofilms grown at the feed substrate concentrations of 500, 1000, and 2000 mg COD/L. It was clear that the oxygen microprofiles changed little when the substrate concentrations exceeded 1000 mg COD/L; therefore, to make sure that oxygen is the limiting factor in microbial growth in our measurements, we used 2000 mg COD/L as the feed concentration.
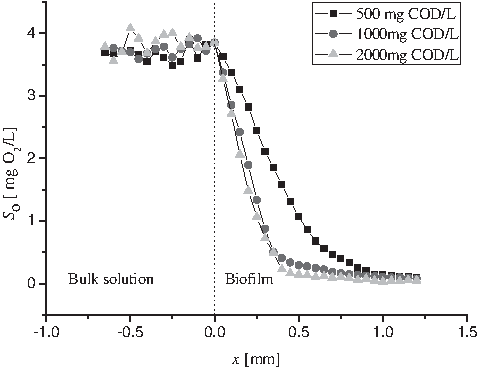
Measured oxygen microprofiles at different feed substrate concentrations in the biofilm (▪ 500 mg COD/L, ● 1000 mg COD/L, ▴ 2000 mg COD/L).
Even though lower substrate concentrations gave increased oxygen concentration in the biofilm, the oxygen was completely depleted before it reached the substratum. Oxygen could not be transported >950 μm into the biofilm under any of the three substrate concentrations, which is consistent with the results that the mass transport greatly influences the rate of biotransformation in attached biofilm systems in contrast to the dispersed bacterial growth (Lu, 2001; Boessmann et al., 2004; Seo and Bishop, 2008). The oxygen penetration depths in the biofilm were in the range of 750–950 μm. Compared with the results reported earlier [(usually in the range of 240–600 μm measured by Seo and Bishop (2008), Boessmann et al. (2004), and Lu (2001)], the oxygen penetrations are really deeper in the study. It indicated the slow bacterial activities or the little active biomass in the biofilm, which would result in the decrease in the oxygen consumption. In addition, the loose structure caused by static cultivation or other growth conditions would increase the diffusivity of oxygen in the biofilm, which is another factor attributed to the deep oxygen penetration.
To confirm uniformity of the biofilm, four oxygen microprofiles were measured at different locations in the biofilm at the concentration of 2000 mg/L, as shown in Fig. 4. The measuring points were located at the intersection points of square's sides with a distance of about 500 μm (see the insert in Fig. 4). Compared with the results measured in colony biofilms reported in the literature by Yurt et al. (2003), the change in oxygen concentrations in water immersed biofilm was more irregular due to its more heterogeneous structure, especially the oxygen concentrations measured above the biofilm. This phenomenon was partly due to the function of the suspended bacteria released in the bulk solution from the biofilm. Figure 4 also demonstrated that the oxygen distributions in the biofilm at different locations were similar although they were not indeed identical, which was thought to accord with the assumption of the uniform distribution of microorganisms in the biofilm.

Measured oxygen microprofiles at different locations in the biofilm. The length of square's side was ∼500 μm.
Sensitivity analysis
A sensitivity analysis of biokinetic parameters in the model was conducted to test whether the oxygen profiles were sufficiently sensitive to the biokinetic parameters. It was conducted by varying one model parameter while holding the remaining parameters constant as shown by Riefler et al. (1998). Sensitivity was judged by the effects that these perturbations had on the resulting dissolved oxygen profiles. Figure 5 showed the predicted oxygen profiles for different values of the biokinetic parameters including
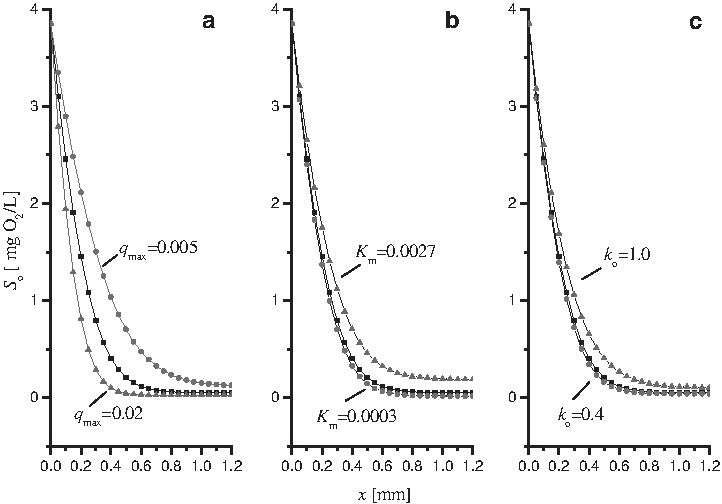
Sensitivity of dissolved oxygen profile to the biokinetic parameters of
Growth biokinetic parameters
Table 2 demonstrated the computed biokinetic parameters and SSD from the four measured oxygen microprofiles in Fig. 4, by using the average VSS and layered VSS obtained from the phospholipids analysis. As shown in Table 2, the biokinetic parameters derived from the average VSS possessed the smaller
VSS, volatile suspended solids; SSD, sum of squares of the difference.
The half saturation coefficient ko had a close relationship with the mass transport limitation in attached growth systems (Kappeler and Gujer, 1992; Chen et al., 2003; Pérez et al., 2005). The computed ko was 0.45–0.5 mg O2/L on an average (n=4). It was larger than the values measured for microorganisms grown in suspension (0.25 mg O2/L, Kappeler and Gujer, 1992; 0.20 mg O2/L recommended by IWA Task Group, 2000), which was in well agreement with the conclusion reported by Pérez et al. (2005) that the effect of mass transport limitations is reflected by half-velocity coefficients in the Monod expression.
Conclusions
From the work presented, the following conclusions can be obtained:
1. With the help of microelectrodes, the biokinetic parameters in the heterotrophic biofilms for wastewater treatment were thoroughly investigated. The biokinetic parameters derived from the average VSS possessed the smaller 2. A diffusion-reaction model was established to simulate the oxygen consumption and distribution in the biofilms. With the sensitivity analysis, the
Footnotes
Acknowledgments
This research work was supported by the China Postdoctoral Science Foundation funded project (20080430046, 200801093) and Tsinghua University Initiative Scientific Research Program (20101081834).
Author Disclosure Statement
No competing financial interests exist.