
Abstract
Abstract
A nephelometric turbidimeter monitoring system (NTMS) was utilized to measure the standard deviation (SD) of turbidity of suspension solutions. Experimental results demonstrated that turbidity SD was consistent with the theory that underlay the “turbidity fluctuation technique.” The NTMS was also used at a full-scale drinking water treatment plant to continuously monitor turbidity in all flocculation tanks. Experimental results revealed that under coagulant dosages of 0.33, 0.92, 1.67, and 2.67 mg/L, turbidity SD was strongly correlated with floc diameter in the flocculation tank. Turbidity SD and floc diameter increased to their maximum values at a coagulant dosage of 0.92 mg/L. This result suggested that turbidity SD obtained by using an NTMS could be used to determine the operational important parameters of water treatment plants.
Introduction
In this work, a scatter-type turbidity meter with a data-acquisition function that was based on a nephelometric turbidimeter monitoring system (NTMS) was constructed. This nephelometric turbidimeter was installed to obtain turbidity data at 1 s intervals. A light-emitting diode on the nephelometric turbidimeter probe illuminated the sample, and turbidity was determined by measuring the amount of scattered light that reached the detector. For Poisson distribution, the variance was equal to the mean; and so, the standard deviation (SD) was the square root of the mean (Svedberg and Inouye, 1911). Therefore, when a nephelome tric turbidimeter was used to obtain turbidity data, the turbidity SD value that was calculated from measured data made over a period was similar to the FI value obtained from PDA measurements. Based on the analytical results of previous NTMS research, turbidity SD and floc diameters were strongly and linearly correlated with each other (Cheng et al., 2008). Also, based on the results of a jar test and a pilot test using a set of test solutions with a broad range of turbidities, turbidity SD could be used as a basis for determining the suitable operational conditions and applying in floc strength analysis (Cheng et al., 2010a, 2010b, 2010c). Accordingly, in this study, NTMS was tested to elucidate the relationship between CN1/2 and turbidity SD. The NTMS was subsequently tested at a full-scale drinking water treatment plant (Ming-Der Water Treatment Plant). The relationship between turbidity SD obtained by NTMS and the coagulant dosage was evaluated. This study attempted to determine a suitable coagulant dosage for floc formation in a full-scale drinking water treatment plant based on turbidity SD as an evaluation parameter.
Experimental Methods
Evaluating the relationship among Q, r, N, and turbidity SD
In the experiment, dry corncob powder and silica dioxide (SiO2) were used as organic and inorganic particles, respectively. These particles were screened through a series of sieves to classify them based on diameters (mesh No. 170-40; dia. 90–425 m). The average particle diameters (dia.) of the corncob powder were 108 m (dia. 90–125 m), 231 m (dia. 212–250 m), and 338 m (dia. 250–425 m); the average particle diameter (d) of the silica dioxide powder was 108 m (dia. 90–125 m). These particles were then utilized to prepare raw water with various turbidities (10, 100, 200, 300, 400, 500, 600, 700, 800, 900, and 1000 NTU). The particles were used to simulate variations in the parameters Q, r, and N of the test solutions. These test solutions were then used to generate 1.0 L of each solution; each test solution was added separately to the container with the NTMS. The solution was mixed at 150 rpm. Based on a scatter-type turbidity meter (WTW model MIQ/C184), the NTMS probe (WTW model VisoTurb 700 IQ) was using infrared light as a light source with a wavelength of 860 nm. This wavelength was outside the wavelength range of visible light. Thus, potential coloration of the sample did not influence the measurements. Ultrasound cleaning of the turbidity probe (VisoTurb 700 IQ) could reduce any fouling and soiling on the optical windows. Maintenance work and measuring costs could, thus, be considerably reduced. In this study, the NTMS probe was inserted to about 3 cm below the surface of the solution for continuously online monitoring the turbidity. A data acquisition unit (model FX-106-0-2; YOKOGAWA) was used to record turbidity data every 1-s interval. The turbidity data were sampled for 10 min; thus, 600 turbidity data were obtained. Turbidity SD values were then calculated. The raw water was accurately diluted so that the diluted sample water ha d a turbidity of 10 NTU. Then, the sample water was measured for its particle numbers by using a particle counter (Model 8000A HRLD-400HC and Hiac/Royco MC100S; Pacific Scientific).
Full-scale flocculation process
Experiments were performed at a full-scale plant, Ming-Der Water Treatment Plant. Its treatment capacity was ∼30,000 m3/day. Polyaluminum chloride (basicity: 47.6%; Al 2O3: 10.57%, Chung Hwa Chemical Industrial Works, Ltd.) was added, so that the Al concentration reached 0.92 mg/L in the rapid-mixing tank. The raw and treated water quality parameters were recorded as pH=7.91 and 7.34, turbidity=9.83 and 0.29 NTU, and apparent color=20 and <5 (Pt-Co Unit), respectively. After mixing, the treated water flowed into three flocculation tanks that had been connected in series. Each flocculation tank was 8×8×5.4 m (Cheng et al., 2010a). Flocculation mixing was performed using mechanical paddle mixers. The velocity gradient in each flocculation tank was set to be 22.7 s−1. The total hydraulic retention time of the three flocculation tanks was roughly 42 min. After flocculation, the water was treated continuously with sedimentation, filtration, and chlorination to meet drinking water standards. One of the four probes of the NTMS was installed in the raw water inlet tank, and each of the other three was installed in one of the flocculation tanks at 1.0 m below water surface. Turbidity data were continuously online recorded for each probe every second. During the experimental period, four coagulant dosages were added stepwise (0.33, 0.92, 1.67, and 2.67 mg/L Al). Since the total hydraulic retention time for three flocculation tanks was 42 min, the operational period for each dosing experiment was set to be 70 min. The 600 data that were collected in the last 10 min of this period were used to calculate turbidity SD. A digital image of the treated water sample was captured to determine the diameter of the particles. The zeta potential of the particles in the rapid-mixing tank was also measured.
Capturing digital image
A CCD video camera (Watec Co Wat-20 2B) was used to capture the image of particles or flocs in a free settling test (in which the number of particles exceeded 2000). The digital images were then analyzed by using National Instruments Vision Assistant 7.1 software to determine the mean diameter of the particles.
Zeta-potential measurements
To determine the surface charge of particle s, their zeta potentials were measured by using a Zeta-Meter System 3.0 (Zeta-Meter, Inc.). Samples with volumes of around 0.5 mL were extracted from the rapid-mixing tank using a 2 mL syringe and directly transferred to a cuvette. Typically, 10 electrophoretic mobility data were obtained for each sample. The zeta potentials were calculated from its mean electrophoretic mobility.
Results and Discussion
Relationship among turbidity SD and particle characteristics Q, r, and N
To confirm that turbidity SD was proportional to CN1/2, the turbidity of each test solution was monitored every second; 600 data points, recorded by the NTMS, were used to calculate the turbidity SD. The scattering cross section (C) of a single particle's radius (r) was equal to Qπr2, where Q was the scattering efficient of the particle (Gregory, 2009a). Since the average diameters of the corncob powder (108, 231, and 338 m) in this investigation exceeded the wavelength of the light (860 nm) and the particles were all of the same material, the scattering coefficient (Q) was a constant. Therefore, for various particle diameters (various r values), and various suspension turbidities (various N values) of a corncob suspended stock solution, the turbidity SD was strongly correlated with πr2N1/2 as a linear relationship (Fig. 1). Figure 1 also revealed that when the particles in the simulated solution had a large diameter, the range of turbidity SDs became broad. This experimental result demonstrated that the linear slope or scattering coefficient (Q) was independent of the simulated turbidity and particle diameter.
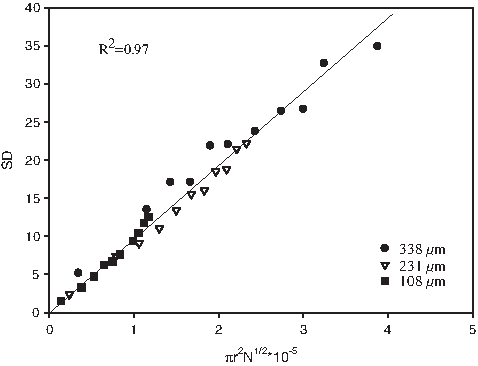
Relationship between turbidity standard deviation (SD) and πr2N1/2 for different average particle diameters and numbers (corncob powder).
Similar to particle diameters and particle numbers, other physical factors, including particle density, could affect light scattering behavior (Gregory, 2009a). Gregory (2009b) noted that when the particle density was low, light scattered by particles was small. Therefore, two materials, corncob powder and silica dioxide, were used to simulate suspended particles in this study. The density of the corncob powder was 0.28 (g/cm3) and that of silica dioxide was 2.21 (g/cm3). Both materials had an average particle diameter of 108 m. Figure 2 showed the photographs of corncob powder and silica dioxide. They exhibited similar particle shapes. The fractal dimension values in two dimensions (D2) for corncob powder and silica dioxide particles were 1.63 and 1.62, respectively. Thus, at the conditions of same particle diameter and similar particle shapes, increasing the particle density could increase the particle scattering coefficient (Q). Due to turbidity, SD was proportional to Qπr2N1/2; therefore, the experimental data revealed that the linear slope of the plotted data (turbidity SD vs. πr2N1/2) for silica dioxide (5.5×10⁶) was greatly higher than that of the plotted data for corncob powder (1.0×10⁶) (Fig. 3). Based on the above discussion, all of the experimental results herein confirmed that the turbidity SD obtained from the NTMS was proportional to the CN1/2 value.
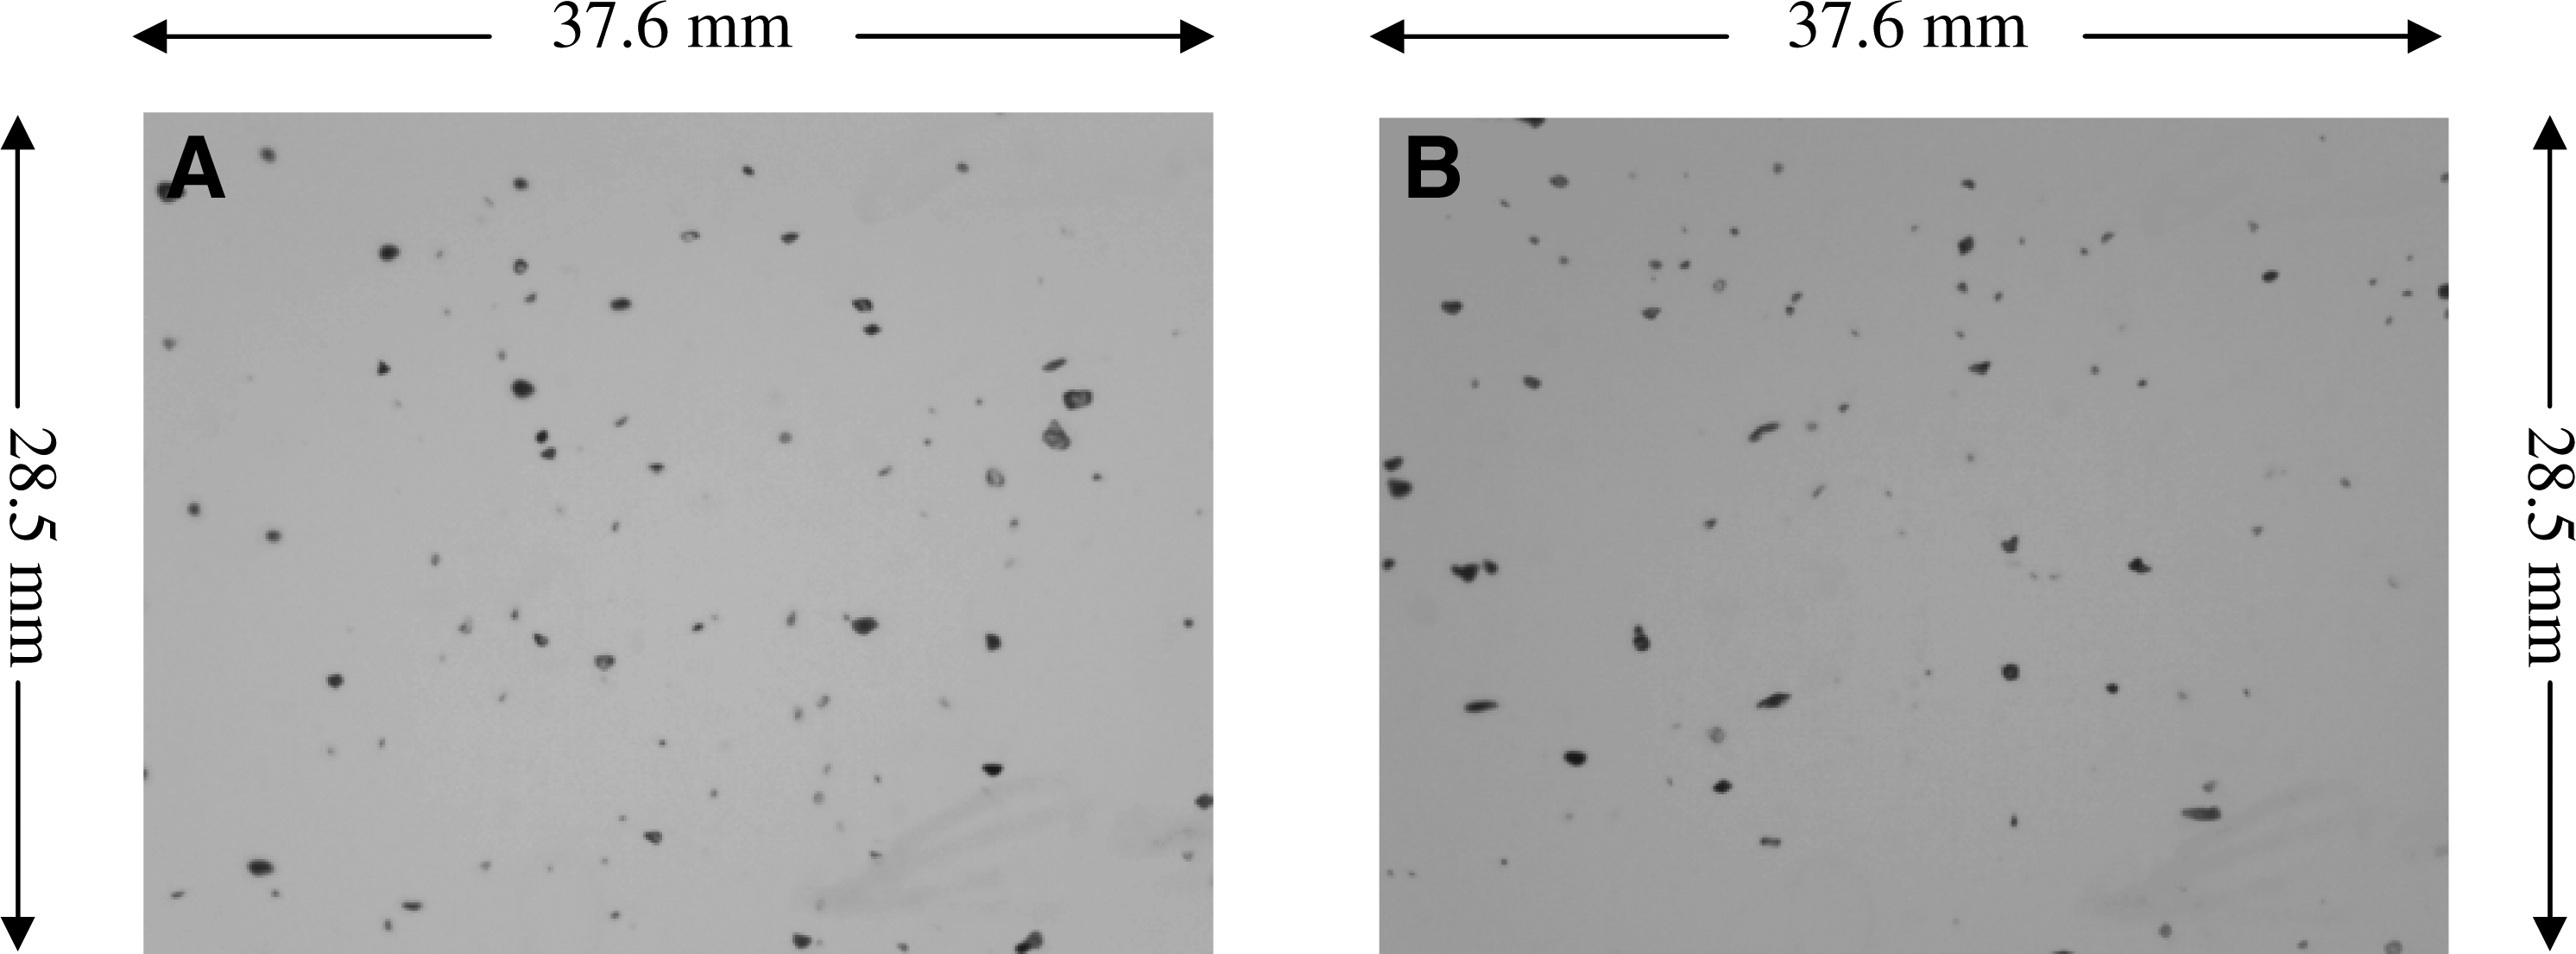
Photographs of
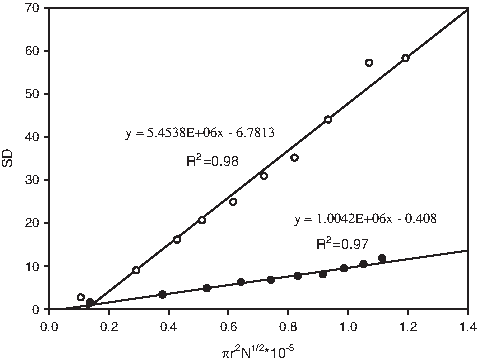
Relationship between turbidity SD and πr2N1/2 for different particulate materials (○ silica dioxide, ● corncob powder).
Application of NTMS in full-scale drinking water treatment plant
The probes of the NTMS were installed in three flocculation tanks at the Ming-Der Water Treatment Plant. Various coagulant dosages were used to confirm that an NTMS could be used to determine a suitable coagulant dosage. A comparison of turbidity results under the same coagulant dosage indicated that after fluctuation, turbidity was various in each flocculation tank (Fig. 4). The recorded turbidity data (600 data points in the last 10 min) were used to calculate turbidity SD. All calculations indicated that the first flocculation tank (flocculation 1) did not generate large flocs, because the flocculation time was insufficient. Therefore, the amplitude of turbidity (or turbidity SD) in that tank was smaller than those in the other flocculation tanks. When treated water flowed into the second and third flocculation tanks, turbidity data amplitudes (or turbidity SD values) increased with the hydraulic retention time at all coagulant dosages. In the third flocculation tank, a comparison of turbidity SD values at various coagulant dosages revealed that a coagulant dose within the range 0.92–1.67 mg/L Al yielded a relatively large turbidity SD than other doses (Fig. 4). To confirm the effect of dosage on floc formation, the zeta potential of a sample that was collected from the rapid-mixing tank was measured at various dosages. The measurements (Fig. 5) indicated that the zeta potential obviously increased from negative to positive as the coagulant dosage was increased from 0.92 mg/L Al to 1.67 mg/L Al. This analytical result showed that adding aluminum cation with positive charges could increase the surface potential of flocs. Additionally, the experimental data (Fig. 5) revealed that the turbidity SD values in the third flocculation tank rose to high values when zeta potential of the floc reversed its value from negative to positive at dosages from 0.92 to 1.67 mg/L Al. Simon et al. (2007) reported that a particular zeta potential range, including positive and negative values, favored the removal of particles. Ratnaweera et al. (1999) also suggested that colloid destabilization happened before complete neutralization of the colloid surface charge. Therefore, the optimum zeta potential was not necessary to be zero. Accordingly, the coagulation dosage suitable for forming flocs could be set to 0.92 mg/L Al herein, and the results proved that the NTMS could help determine a favorable coagulant dosage in a drinking water treatment plant.
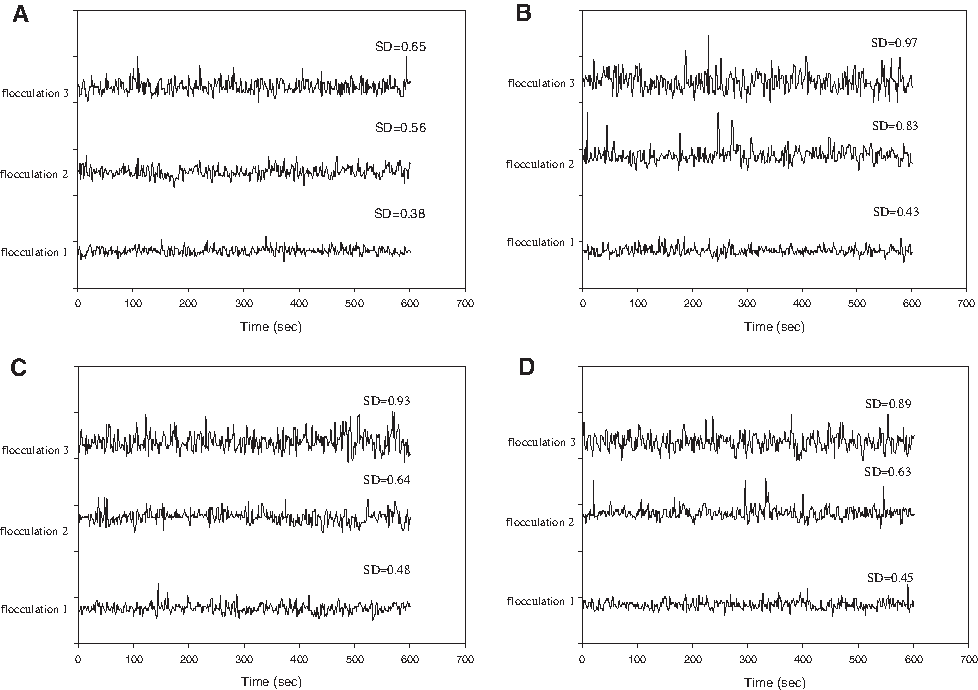
Turbidity amplitude diagram at coagulant doses of
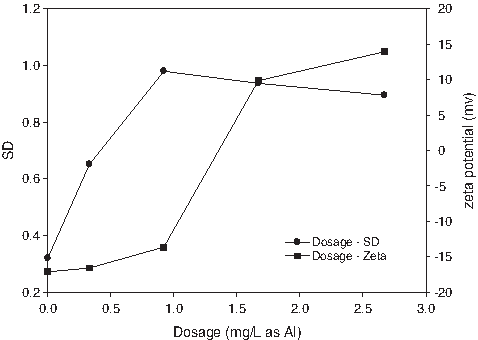
Turbidity SD and zeta potential in the third flocculation tank against coagulant dosage.
To confirm that the maximum turbidity SD value was associated with a large particle diameter, a digital image, captured by a CCD color camera, was analyzed to calculate floc diameter. Figure 6 exhibited turbidity SD and average floc diameter in the third flocculation tank at the coagulant doses from 0.92 to 1.67 mg/L Al. The analytical result showed that they formed very similar curves (Fig. 6). The turbidity SD reached the maximum at 0.92 mg/L Al, at which the average floc diameter was also becoming the largest value. This analytical result revealed that the turbidity SD value could be used to determine the most suitable coagulant dosage. Additionally, based on the “turbidity fluctuation technique,” which was proposed by Gregory and Nelson (1986), and based on the results of previous jar test studies, a good correlation existed between turbidity SD and the floc diameter (Cheng et al., 2008). The experimental data (Fig. 4) were re-plotted to confirm the existence of a relationship between a turbidity SD and an average floc diameter under different coagulant dosages in a full-scale drinking water treatment plant. Figure 7 presented these re-plotted data, indicating a strong correlation between a turbidity SD and an average floc diameter. The strong correlation indicated that the turbidity SD obtained by using the NTMS was useful for determining the change in floc diameter in a full-scale water treatment plant.

Turbidity SD and floc diameter data in the third flocculation tank against coagulant dosage.
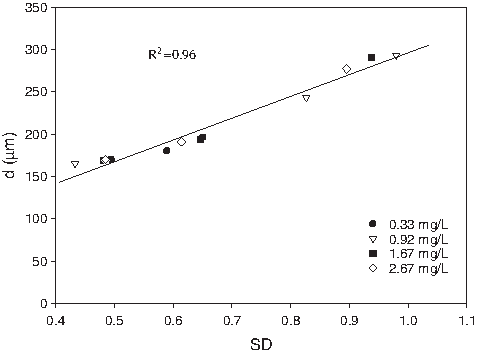
Floc diameter (d) as a function of turbidity SD.
Conclusions
In this study, an NTMS and a particle counter were used to study the relationship between turbidity SDs and particle characteristics. Experimental results indicated that the turbidity SD obtained from the NTMS was proportional to CN1/2.
An NTMS that was applied at a full-scale drinking water treatment plant was used to obtain the turbidity SD at various coagulant dosages. The turbidity SD reached its maximum at the dosage at which the zeta potential changed from negative to positive. At this point, the average floc diameter reached the largest value. The experimental results also confirmed that the average floc diameter was strongly and linearly correlated with the turbidity SD. This experimental result revealed that the turbidity SD obtained from the NTMS could be utilized as a reference to select a suitable coagulant dosage in a full-scale drinking water treatment plant.
Footnotes
Acknowledgments
The authors acknowledge the financial support of National Science Council, Taiwan, R.O.C., for this work (N SC-98-2221-E-239-006-MY3). The authors also want to thank Taiwan Water Corporation, especially Mr. Chao Hung Ku, Mr. Yu Sheng Yang, and Miss Liu Wei Wang, for providing the experimental venues and study advice.
Author Disclosure Statement
No competing financial interests exist.