In this study, the species generated during carbon dioxide (CO2) absorption by primary, secondary, or tertiary aqueous alkanolamines were studied by 1H and 13C nuclear magnetic resonance (NMR). Using a vapor–liquid equilibrium apparatus, the CO2 loading capacities and relative absorption rates of aqueous monoethanolamine (MEA), diethanolamine (DEA), or triethanolamine (TEA) were estimated. After reaching an absorption equilibrium, NMR spectroscopy was used to characterize the structural changes during absorption and to examine the species distribution. Mechanisms of CO2 absorption in each absorbent were elucidated based on the NMR measurements. In addition, vapor–liquid equilibrium experimental results revealed CO2 absorption rates in the order of MEA>DEA>TEA. Carbamates in MEA and DEA were found to be hydrolyzed to bicarbonate at CO2 loading levels and exceeded 0.5 mole. The tertiary amine, TEA, was found to absorb CO2 to form bicarbonate, and the absorption capacity was higher than that of the primary or secondary amines.
Introduction
The Intergovernmental Panel on Climate Change proposes a scenario in which the primary cause of global warming is the presence of greenhouse gases, of which carbon dioxide (CO2) accounts for a high percentage, 76.7%. Among the world energy sources, fossil fuels contribute most to CO2 emissions, 56.6%, and this level is expected to persist beyond 2030. Therefore, international regulations for controlling CO2 emissions have become necessary. CO2 reductions through carbon capture and sequestration provide a potential countermeasure (Pachauri et al., 2007).
Postcombustion capture technologies mainly treat CO2 in flue gases generated by the combustion of fossil fuels and air in thermoelectric power plants. Industry capture technologies commonly rely on chemical absorption by aqueous absorbents. Alkanolamines are the most widely commercialized absorbents, and diverse studies have examined their structural characteristics, absorption capacities, gas flux properties, reaction temperature sensitivities, and correlation between CO2 partial pressure and absorbent concentration (Bonenfant et al., 2003; Yoon and Lee, 2003). Monoethanolamine (MEA) is an excellent absorbent with a high CO2 absorption rate; however, it has several disadvantages, such as a high cost associated with the need for companion corrosion inhibitors and a high vapor pressure. MEA is strongly corrosive, and the absorption capacity decreases over long-term operation as a result of degradation. Diethanolamine (DEA) and triethanolamine (TEA) are less corrosive than MEA, and their vapor pressures are lower, which minimizes evaporation loss; however, DEA and TEA provide low rates of absorption. To ameliorate these disadvantages, blends of the alkanolamines or promoters were prepared in an effort to improve the reaction rates (Glasscock et al., 1991; Closmann et al., 2009).
Understanding the reaction mechanisms that underlie CO2 absorption can guide development of new absorbents and more efficient processes by articulating models of the chemical equilibria in mixed absorbents or absorbent–promoter blends. Thus far, studies of species formation in absorbents with absorbed CO2 have relied on molecular modeling (Ma'mun et al., 2006; Edali et al., 2009). Although researchers have experimentally studied alkanolamine species formation in absorbents (Jakobens et al., 2008; Yang et al., 2009; Barzagli et al., 2009), a few studies have examined the absorption characteristics of primary, secondary, and tertiary alkanolamines. This study measured the CO2 absorption rates and capacities by aqueous solutions of MEA, DEA, and TEA by using a vapor–liquid equilibrium (VLE) apparatus, and the distributions and absorption characteristics of the species were characterized by 1H and 13C nuclear magnetic resonance (NMR) spectral analysis.
Reaction and Mechanisms
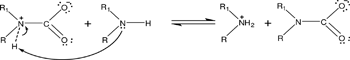
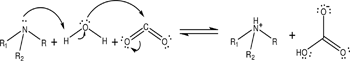
CO2 absorption in aqueous MEA (primary alkanolamine) or DEA (secondary alkanolamine) solutions has been described from a mechanistic perspective by Caplow (1968) and Danckwerts (1979). Danckwerts proposed that zwitterions formed by a reaction between amines and CO2 with base removal of the zwitterion protons to form a carbamate. The mechanism of reaction between CO2 and an amine is also a zwitterion mechanism. The major mechanisms of CO2 absorption by amine aqueous solutions are presented in Equations (1)–(4). Primary and secondary amines absorb CO2 to form carbamate or bicarbonate/carbonate and are regenerated as free amines at high temperatures accompanied by CO2 discharge.
(1)
(2)
(3)
MEA: R=CH2CH2OH, R1=H
DEA: R=CH2CH2OH, R1=CH2CH2OH
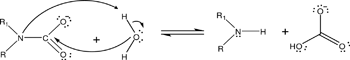
TEA, a tertiary alkanolamine, does not directly react with CO2 to form carbamate; rather, it forms bicarbonate through hydrolysis of CO2. Donaldson and Nguyen (1980) and Singh and Versteeg (2008) studied the kinetics of CO2 reaction with TEA and reported that TEA acted as a base catalyst. They concluded that carbamate did not form. In this study, 13C NMR peak analysis showed that TEA formed bicarbonate.
(4)
TEA: R=CH2CH2OH, R1=CH2CH2OH, R2=CH2CH2OH
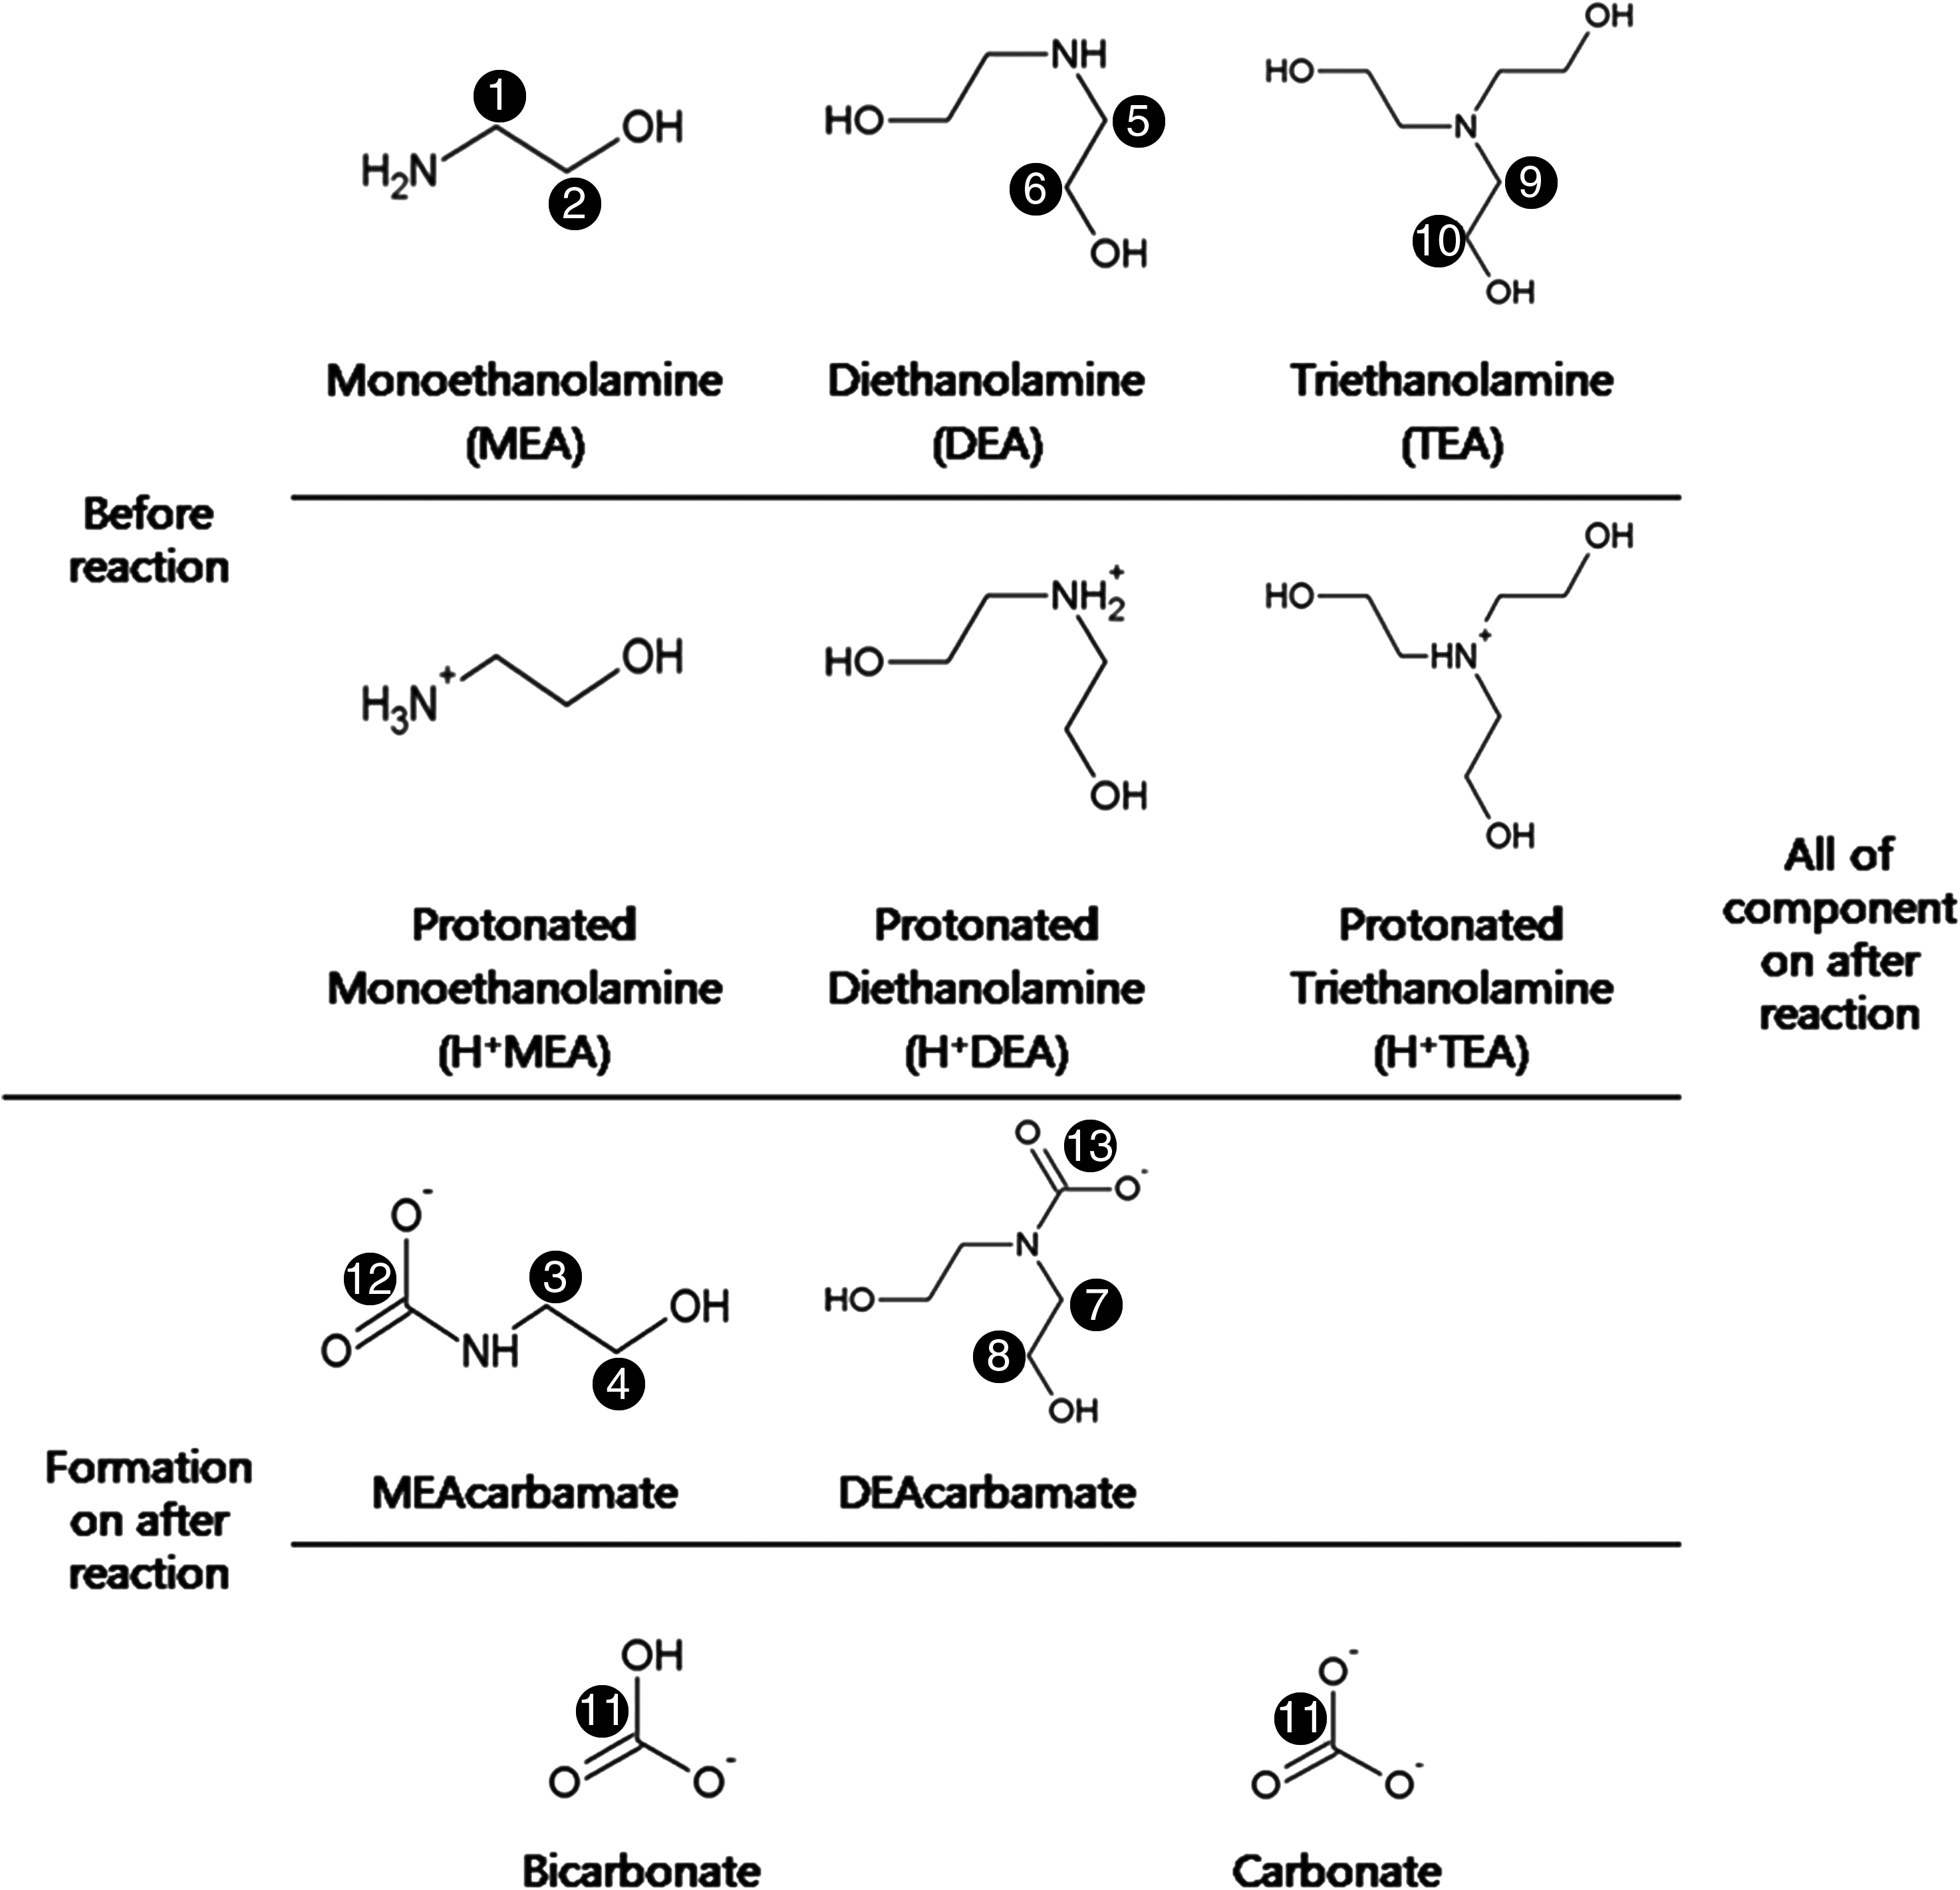
The reactions of primary, secondary, and tertiary amines suggested that MEA, DEA, and TEA aqueous solutions would form the species shown in Fig. 1 after absorbing CO2.
Molecular structures of the species present in CO2-loaded MEA, DEA, or TEA aqueous solutions. MEA, monoethanolamine; DEA, diethanolamine; TEA, triethanolamine.
Experimental
MEA (99%), DEA (98.5%), and TEA (99%) used in preparing samples for VLE absorption experiments and NMR analysis were purchased from Samchun Chemical Co. All reagents were used as received. MEA, DEA, and TEA absorbents were used to prepare 30 mass% aqueous solutions in deionized water. The gas used in all experiments was 99.99 vol% CO2.
A diagram of the VLE apparatus is shown in Fig. 2. The apparatus included a stainless steel CO2 gas reservoir, a stainless steel reactor for reactions between the absorbents and CO2, an indicator for indicating the temperature and pressure, and a recorder for storing the CO2 pressure measurements in real time. The reactor was charged with a batch of absorbent solution and a magnetic stirrer to maximize the contact area between CO2 and absorbents. The internal volumes were 300.29 cm3 for the reservoir and 322.56 cm3 for the reactor. The volume difference was calibrated by using 99.999 vol% N2. CO2 was injected into the reservoir after preheating to 313K by using a constant-temperature water bath. The reactor was maintained at 333K to measure the absorption capacities as a function of temperature. Before injecting CO2, residual gases in the reactor were removed by using a vacuum pump. When the temperature of the gas reservoir and reactor reached the experimental temperature, a CO2 injection valve was opened to inject CO2 into the reactor. The pressure of CO2 in the reactor was shown to decrease over time. The pressure in the reactor was measured every five seconds. When the temperature and pressure stabilized, a state of equilibrium was reached, and the pressure in that state was measured to calculate the CO2 equilibrium partial pressure. The pressure of the injected gas and the pressure of the gas after equilibrium were measured to calculate the moles of CO2 absorbed by the absorbent. Since CO2 reacted with the absorbents only in the closed reactor, the absorption rate could be calculated from the pressure difference. After the initial CO2 injection into the reactor, CO2 was injected again after equilibrium had been reached to establish a new equilibrium state.
Schematic diagram of experimental vapor–liquid equilibrium apparatus: 1, CO2 gas; 2, gas reservoir; 3, reactor; 4, magnetic stirrer; 5, vacuum pump; 6, pressure measuring instrument; 7, recorder; 8, pressure transmitter; 9, temperature indicator.
The CO2 loading capacity of an absorbent was calculated by using the ideal gas equations. The experiments in this study were conducted at low pressures (20–800 kPa), and the ideal gas equation can be used to calculate the CO2 loading capacity.
The CO2 loading capacity in the reactor can be calculated by using Equations (5–8):
\documentclass{aastex}\usepackage{amsbsy}\usepackage{amsfonts}\usepackage{amssymb}\usepackage{bm}\usepackage{mathrsfs}\usepackage{pifont}\usepackage{stmaryrd}\usepackage{textcomp}\usepackage{portland, xspace}\usepackage{amsmath, amsxtra}\pagestyle{empty}\DeclareMathSizes{10}{9}{7}{6}\begin{document}
\begin{align*}
n_{{S_{{\rm CO}_2}}} = \frac {(P_{Si} - P_{St}) \times V_S} {RT_S} \tag{5}
\end{align*}
\end{document}
The amount of CO2\documentclass{aastex}\usepackage{amsbsy}\usepackage{amsfonts}\usepackage{amssymb}\usepackage{bm}\usepackage{mathrsfs}\usepackage{pifont}\usepackage{stmaryrd}\usepackage{textcomp}\usepackage{portland, xspace}\usepackage{amsmath, amsxtra}\pagestyle{empty}\DeclareMathSizes{10}{9}{7}{6}\begin{document}
$$(n_{{S_{{\rm CO}_2}}})$$
\end{document} that reacted at the reservoir can be obtained by multiplying the terminal pressure (PSt) difference after an injection to the reservoir at the initial pressure (PSi) of the reservoir with the volume of the reservoir (VS) followed by the division of universal gas constant (R) and the temperature of the reservoir (TS).
\documentclass{aastex}\usepackage{amsbsy}\usepackage{amsfonts}\usepackage{amssymb}\usepackage{bm}\usepackage{mathrsfs}\usepackage{pifont}\usepackage{stmaryrd}\usepackage{textcomp}\usepackage{portland, xspace}\usepackage{amsmath, amsxtra}\pagestyle{empty}\DeclareMathSizes{10}{9}{7}{6}\begin{document}
\begin{align*}
n_{{R_{{\rm CO}_2}}} = \frac {(P_{Ri} - P_{Rt}) \times V_R} {RT_R} \tag{6}
\end{align*}
\end{document}
The amount of CO2\documentclass{aastex}\usepackage{amsbsy}\usepackage{amsfonts}\usepackage{amssymb}\usepackage{bm}\usepackage{mathrsfs}\usepackage{pifont}\usepackage{stmaryrd}\usepackage{textcomp}\usepackage{portland, xspace}\usepackage{amsmath, amsxtra}\pagestyle{empty}\DeclareMathSizes{10}{9}{7}{6}\begin{document}
$$n_{{R_{{\rm CO}_2}}}$$
\end{document} that reacted to a reactor can be also obtained in the same way. The pressure before the injection of a reactor is (PRi), and the remaining pressure after the injection of a reactor is (PRt). The volume of a reactor is (VR), and the temperature of a reactor is (TR).
From Equations (5) and (6), the amount of CO2 absorbed by reaction can be calculated by
\documentclass{aastex}\usepackage{amsbsy}\usepackage{amsfonts}\usepackage{amssymb}\usepackage{bm}\usepackage{mathrsfs}\usepackage{pifont}\usepackage{stmaryrd}\usepackage{textcomp}\usepackage{portland, xspace}\usepackage{amsmath, amsxtra}\pagestyle{empty}\DeclareMathSizes{10}{9}{7}{6}\begin{document}
\begin{align*}
n_{{{\rm absorbed}_{{\rm CO}_2}}} = n_{{S_{{\rm CO}_2}}} - n_{{R_{{\rm CO}_2}}} \tag{7}
\end{align*}
\end{document}
The CO2 loading capacity can then be calculated by
\documentclass{aastex}\usepackage{amsbsy}\usepackage{amsfonts}\usepackage{amssymb}\usepackage{bm}\usepackage{mathrsfs}\usepackage{pifont}\usepackage{stmaryrd}\usepackage{textcomp}\usepackage{portland, xspace}\usepackage{amsmath, amsxtra}\pagestyle{empty}\DeclareMathSizes{10}{9}{7}{6}\begin{document}
\begin{align*}
{\rm CO}_2 \ {\rm loading} = \frac {n_{{{\rm absorbed}_{{\rm CO}_2}}}} {n_{a \min e}} \tag{8}
\end{align*}
\end{document}
The reactor was designed so that the internal pressure, measured during the absorption reactions, could be stored in real time. Each sample was sealed and analyzed by NMR.
1H NMR and 13C NMR were measured by using a model AVANCE 500 MHz from Bruker Co., and the solvent used in the analytical experiments was deuterium oxide (D2O) 99.99% from Sigma-Aldrich Co. The NMR analytical conditions of each sample are provided in Table 1.
Parameter of Nuclear Magnetic Resonance Analysis at Room Temperature
Analysis parameter
1H-NMR
13C-NMR
Number of scans
32
64
Acquisition time
3.172 s
1.019 s
Relaxation delay
1
6
Dwell time
48.4 μL
16.65 μL
NMR, nuclear magnetic resonance.
Results and Discussion
Speciation
The hydroxyl groups (-OH) in MEA and DEA polarize the molecular electronic distribution by pulling electron density away from adjacent atoms. Since -OH groups reduce the electron density of adjacent protons, thereby reducing the local response to diamagnetic shielding effects, the peaks of these protons shift down-field. The peak positions in the 1H NMR and 13C NMR spectra are shown in Figs. 3–5 and 6–8, respectively. The formation of carbamate and bicarbonate moieties was indicated by the evolution of low-field peaks at 165–160 ppm in the 13C MNR spectrum. In this study, carbamate and bicarbonate were formed in both MEA and DEA, as shown in Figs. 6 and 7. In the case of TEA, bicarbonate formed selectively, and carbamate did not form (Fig. 8). These results were consistent with the results of a study performed by Singh and Versteeg (2008). The CO2 loading capacities of MEA, DEA, and TEA aqueous solutions and the resultant chemical shifts are given in Tables 2–4. In the NMR samples, mixed DOH molecules formed due to proton exchange with the D2O solvent. The protons of amine groups and OH– could not be separately distinguished in 1H NMR, and the missing protons appeared as new DOH peaks. In this experiment, such protons appeared near δ=4.8. The composition of the MEA and DEA solutions differed significantly at the start of the reaction. DEA formed carbamate and bicarbonate simultaneously at the start of the CO2 absorption process, whereas MEA formed bicarbonate only after certain levels of carbamate had accumulated. The VLE absorption results showed that CO2 loading in MEA and DEA could not theoretically exceed 0.5 moles for stoichiometric reasons, and additional absorption was only possible on formation of free amines through the hydrolysis of carbamate. Sartori and Savage (1983) explained this observation in terms of the stability of the carbamate moiety. The reactions that formed bicarbonate in TEA were initiated by reactions between water and CO2, so the maximum equilibrium loading exceeded that in the primary or secondary amines. However, the reaction rate was quite low.
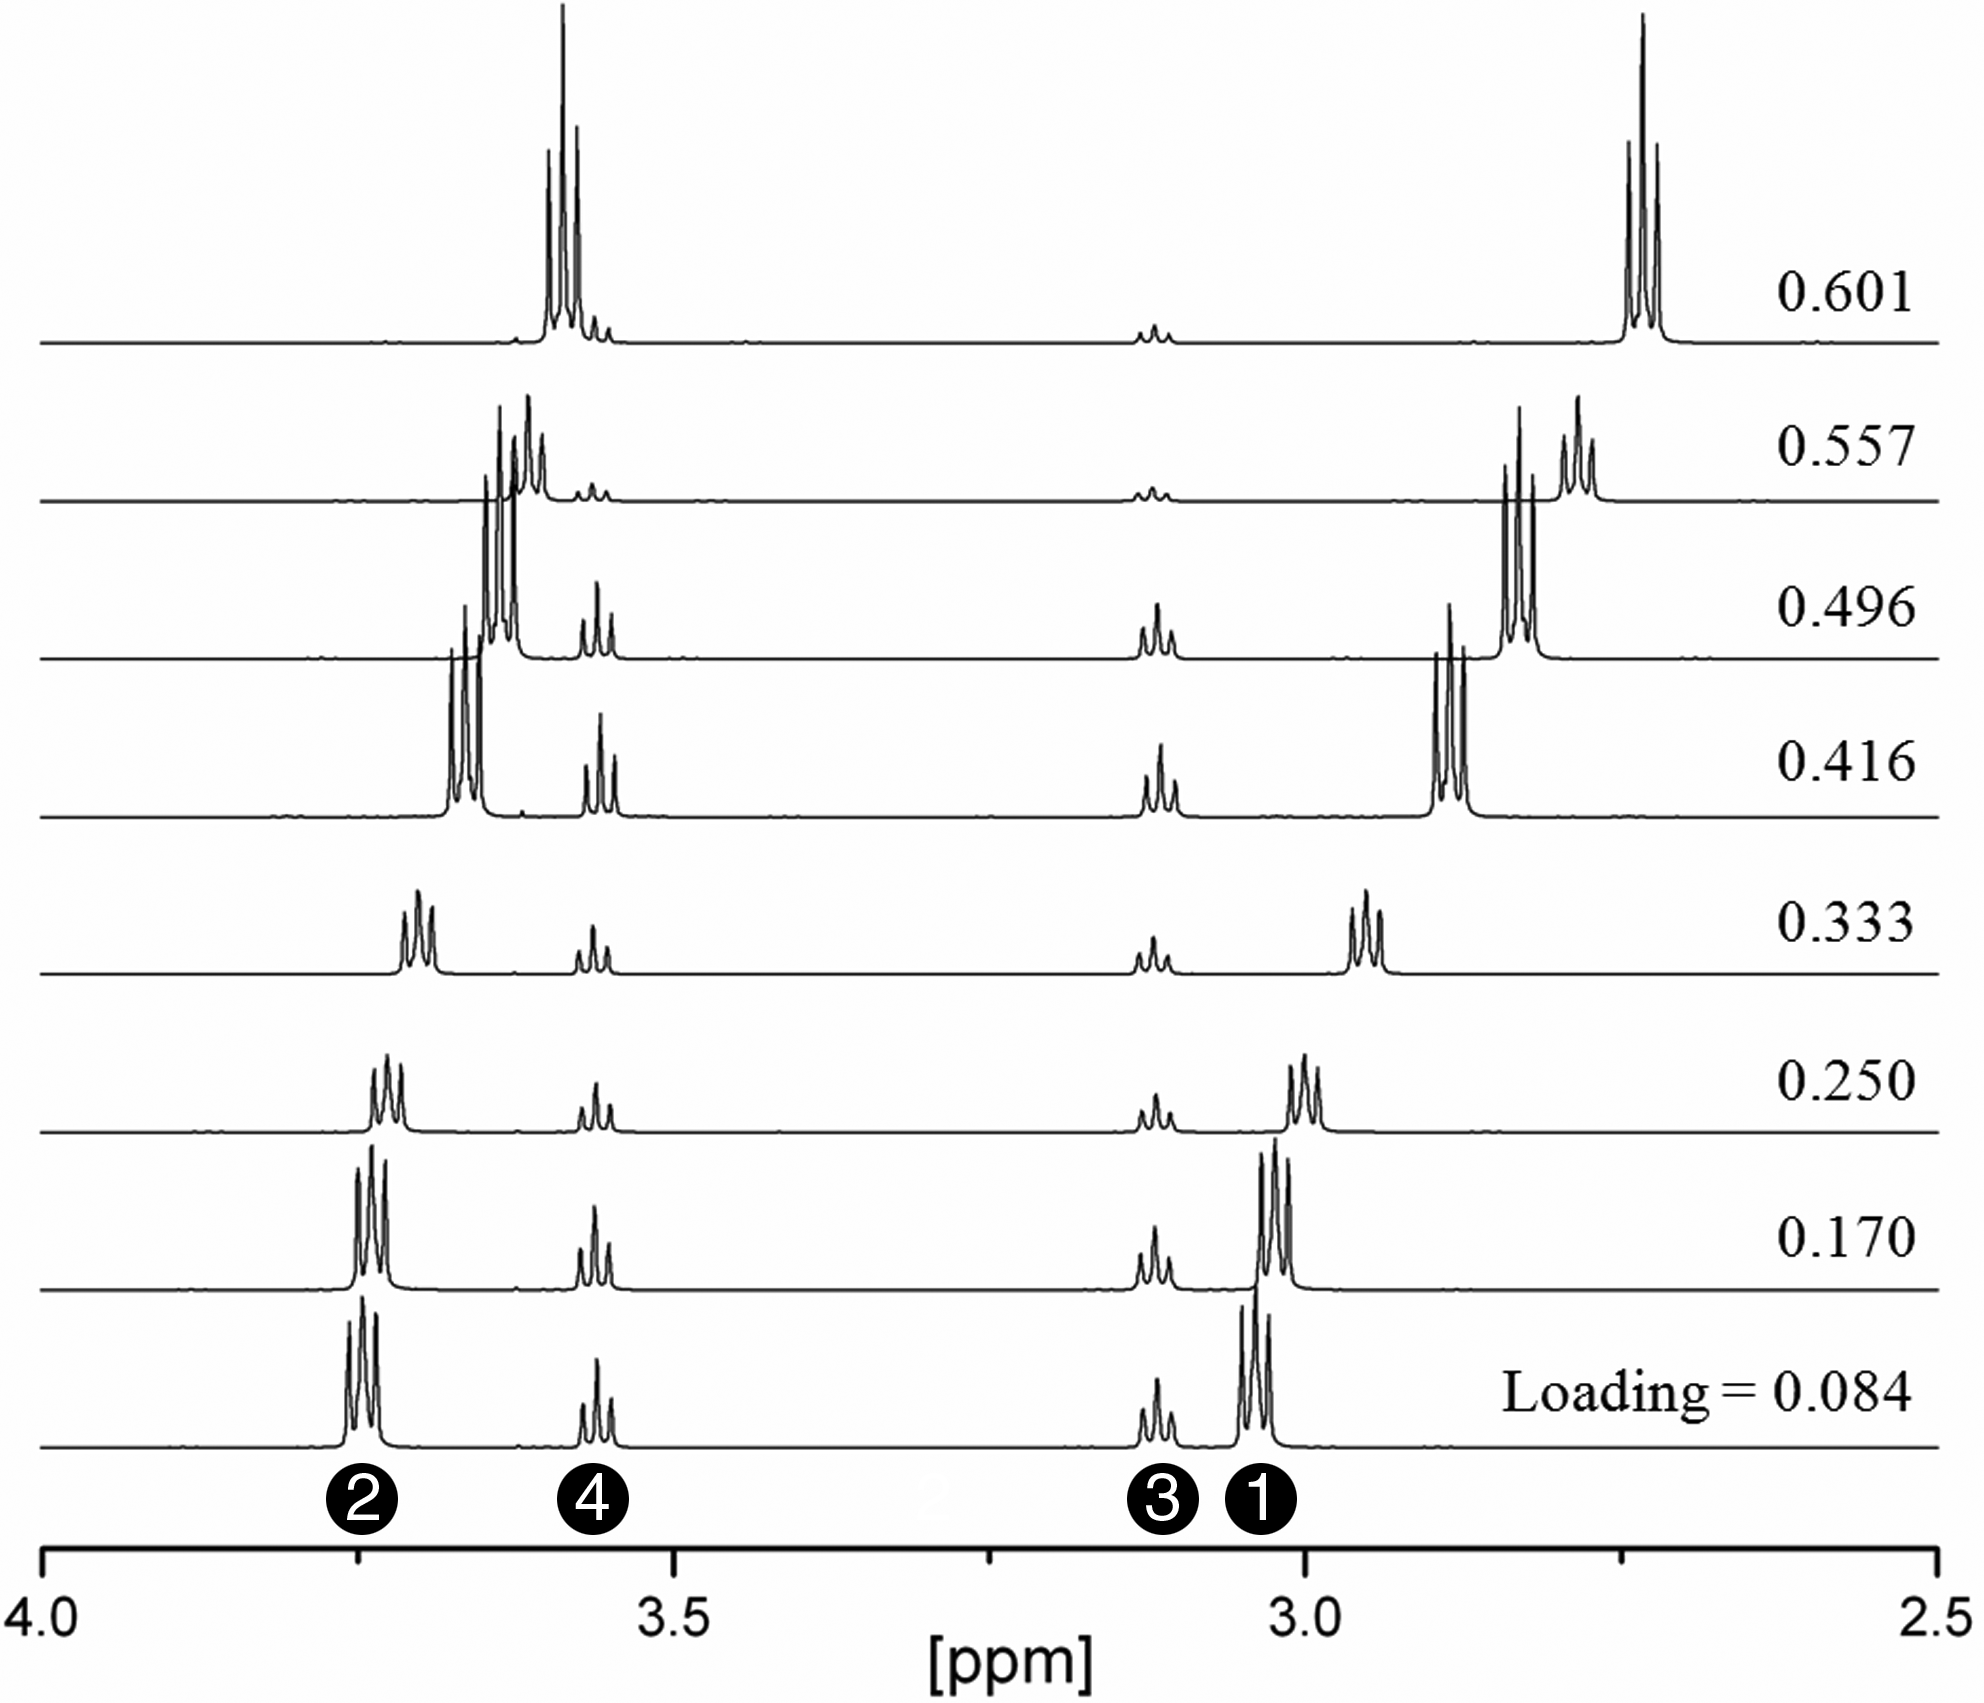
1H-NMR spectra during CO2 absorption by the MEA-H2O-CO2 system at 333K. Proton resonances at different CO2 absorption levels in eight 30 mass% MEA solutions as a function of CO2 loading. NMR, nuclear magnetic resonance.
1H-NMR spectra during CO2 absorption by the DEA-H2O-CO2 system at 333K. Proton resonances at different CO2 absorption levels in eight 30 mass% DEA solutions as a function of CO2 loading.
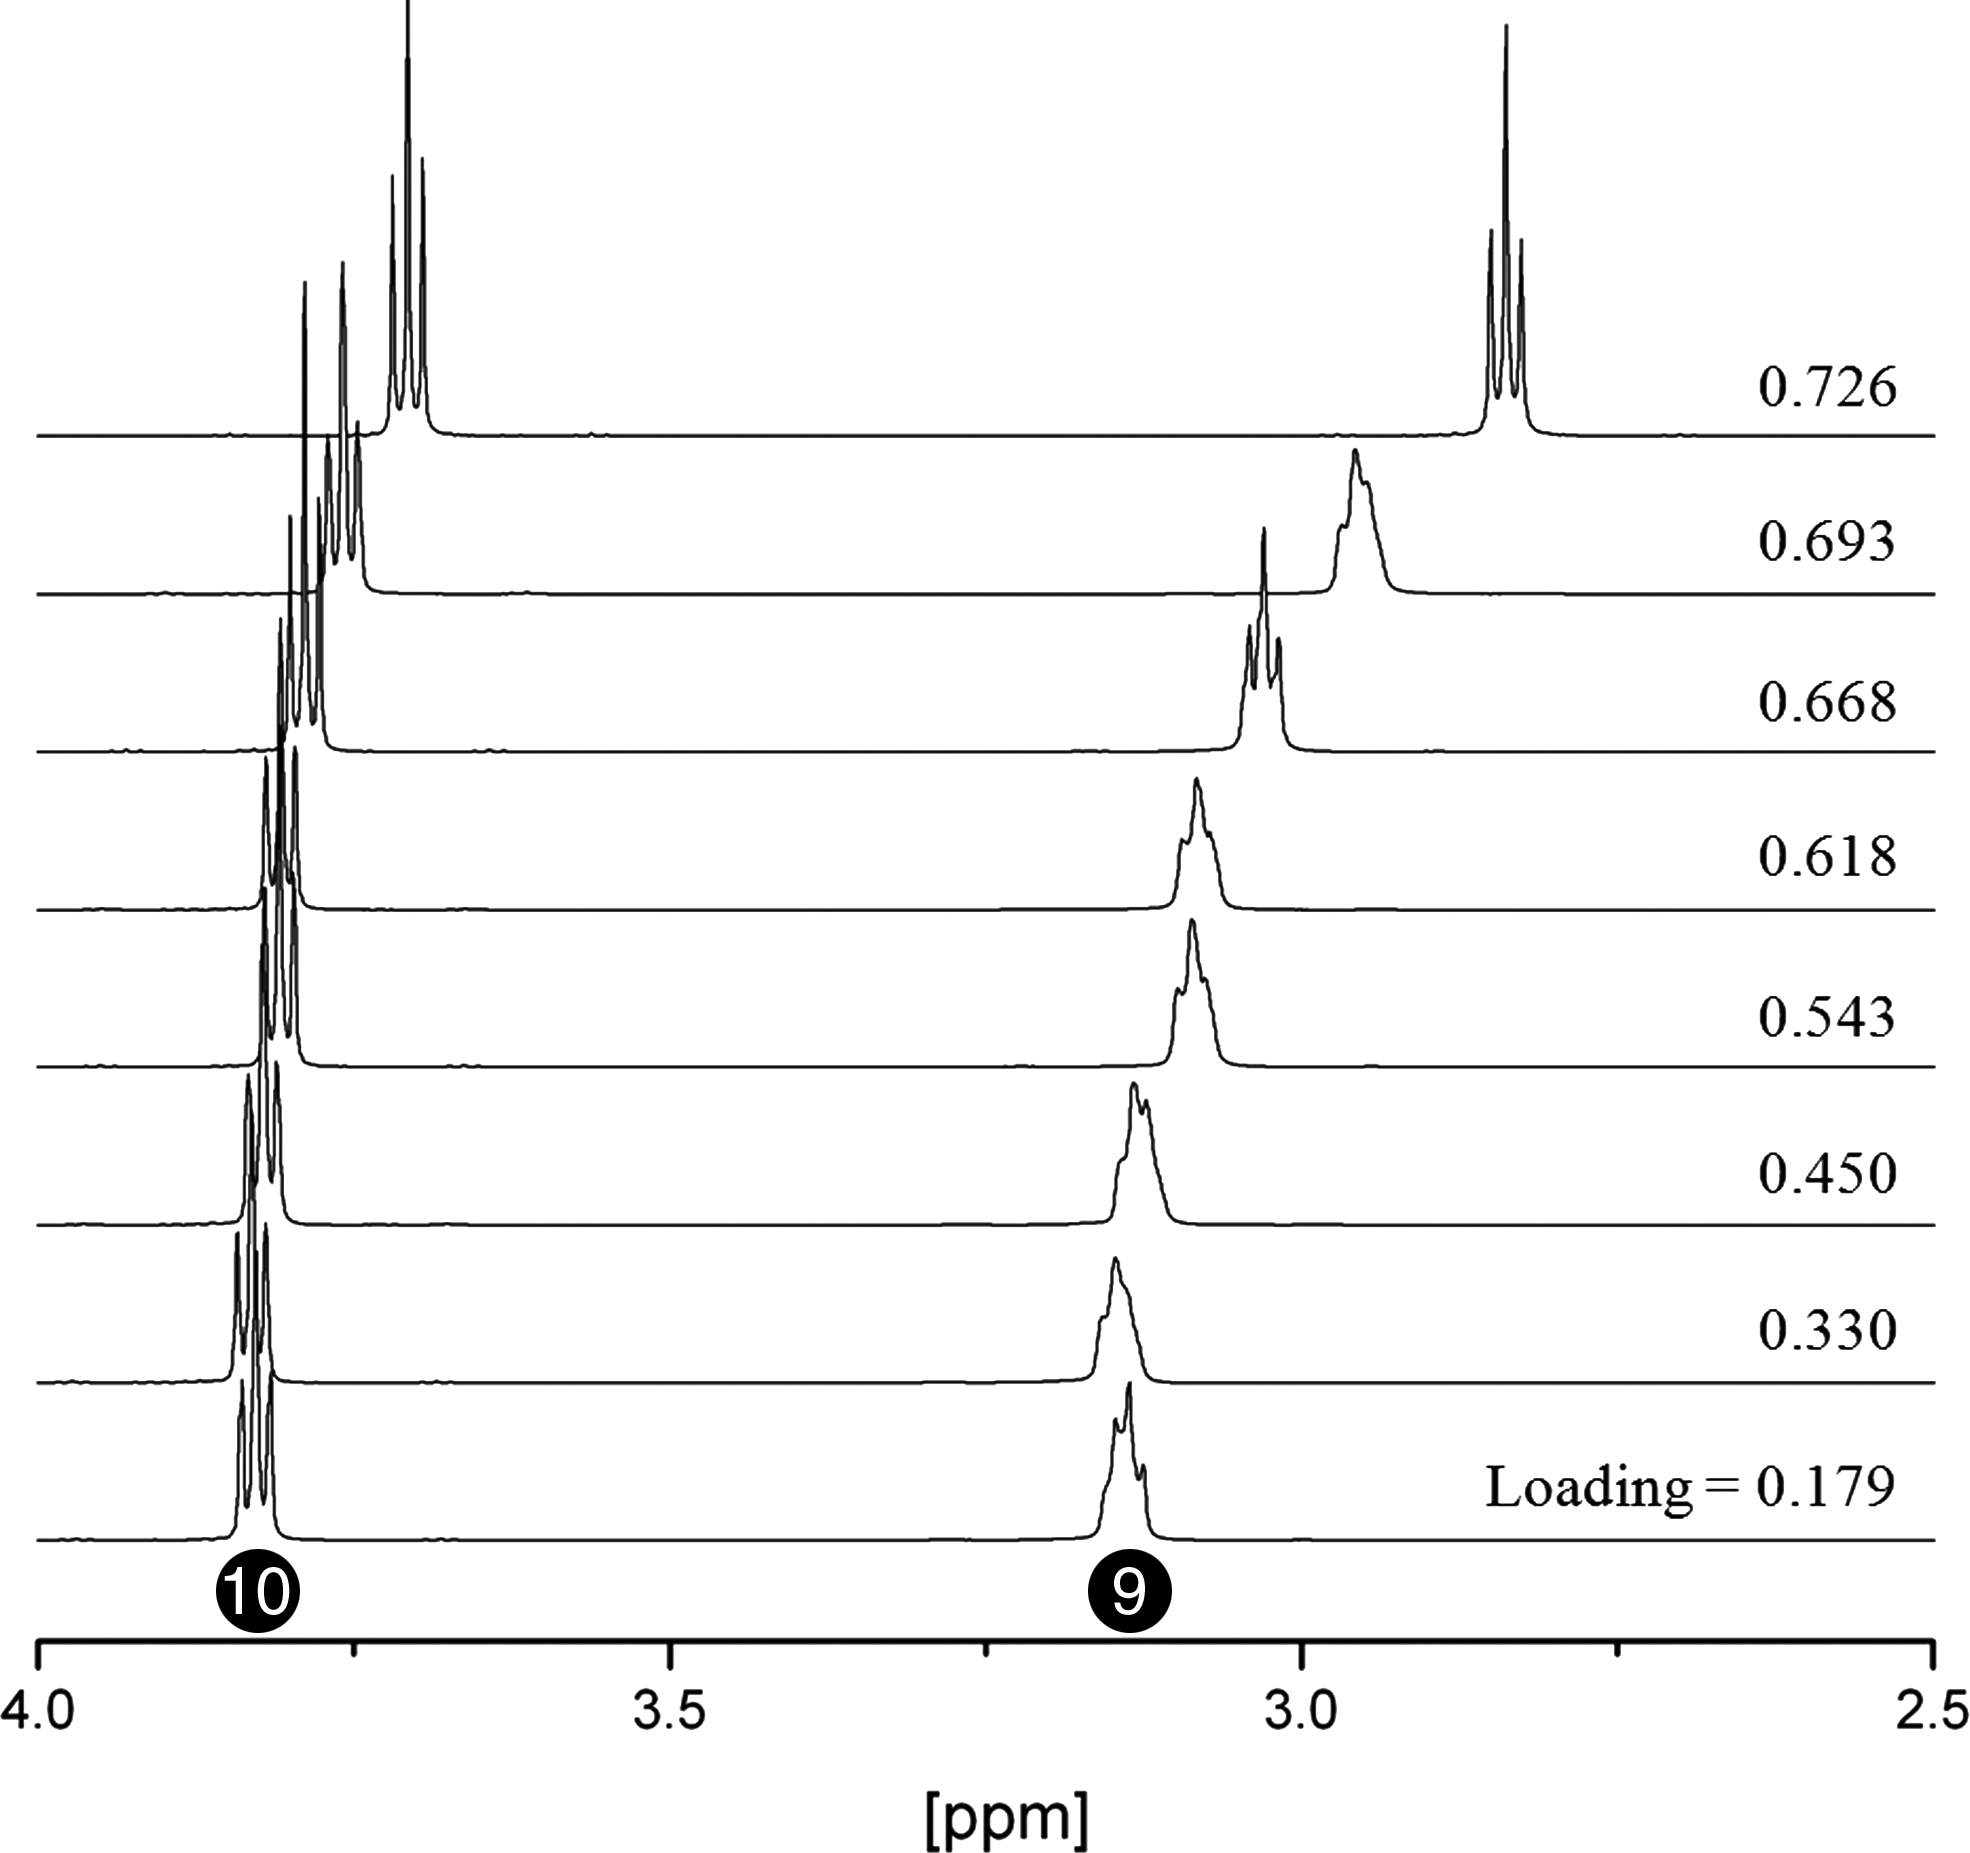
1H-NMR spectra during CO2 absorption by the TEA-H2O-CO2 system at 333K. Proton resonances at different CO2 absorption levels in eight 30 mass% TEA solutions as a function of CO2 loading.
13C-NMR spectra during CO2 absorption by the MEA-H2O-CO2 system at 333K. Carbon resonances at different CO2 absorption levels in eight 30 mass% MEA solutions as a function of CO2 loading.
13C-NMR spectra during CO2 absorption by the DEA-H2O-CO2 system at 333K. Carbon resonances at different CO2 absorption levels in eight 30 mass% DEA solutions as a function of CO2 loading.
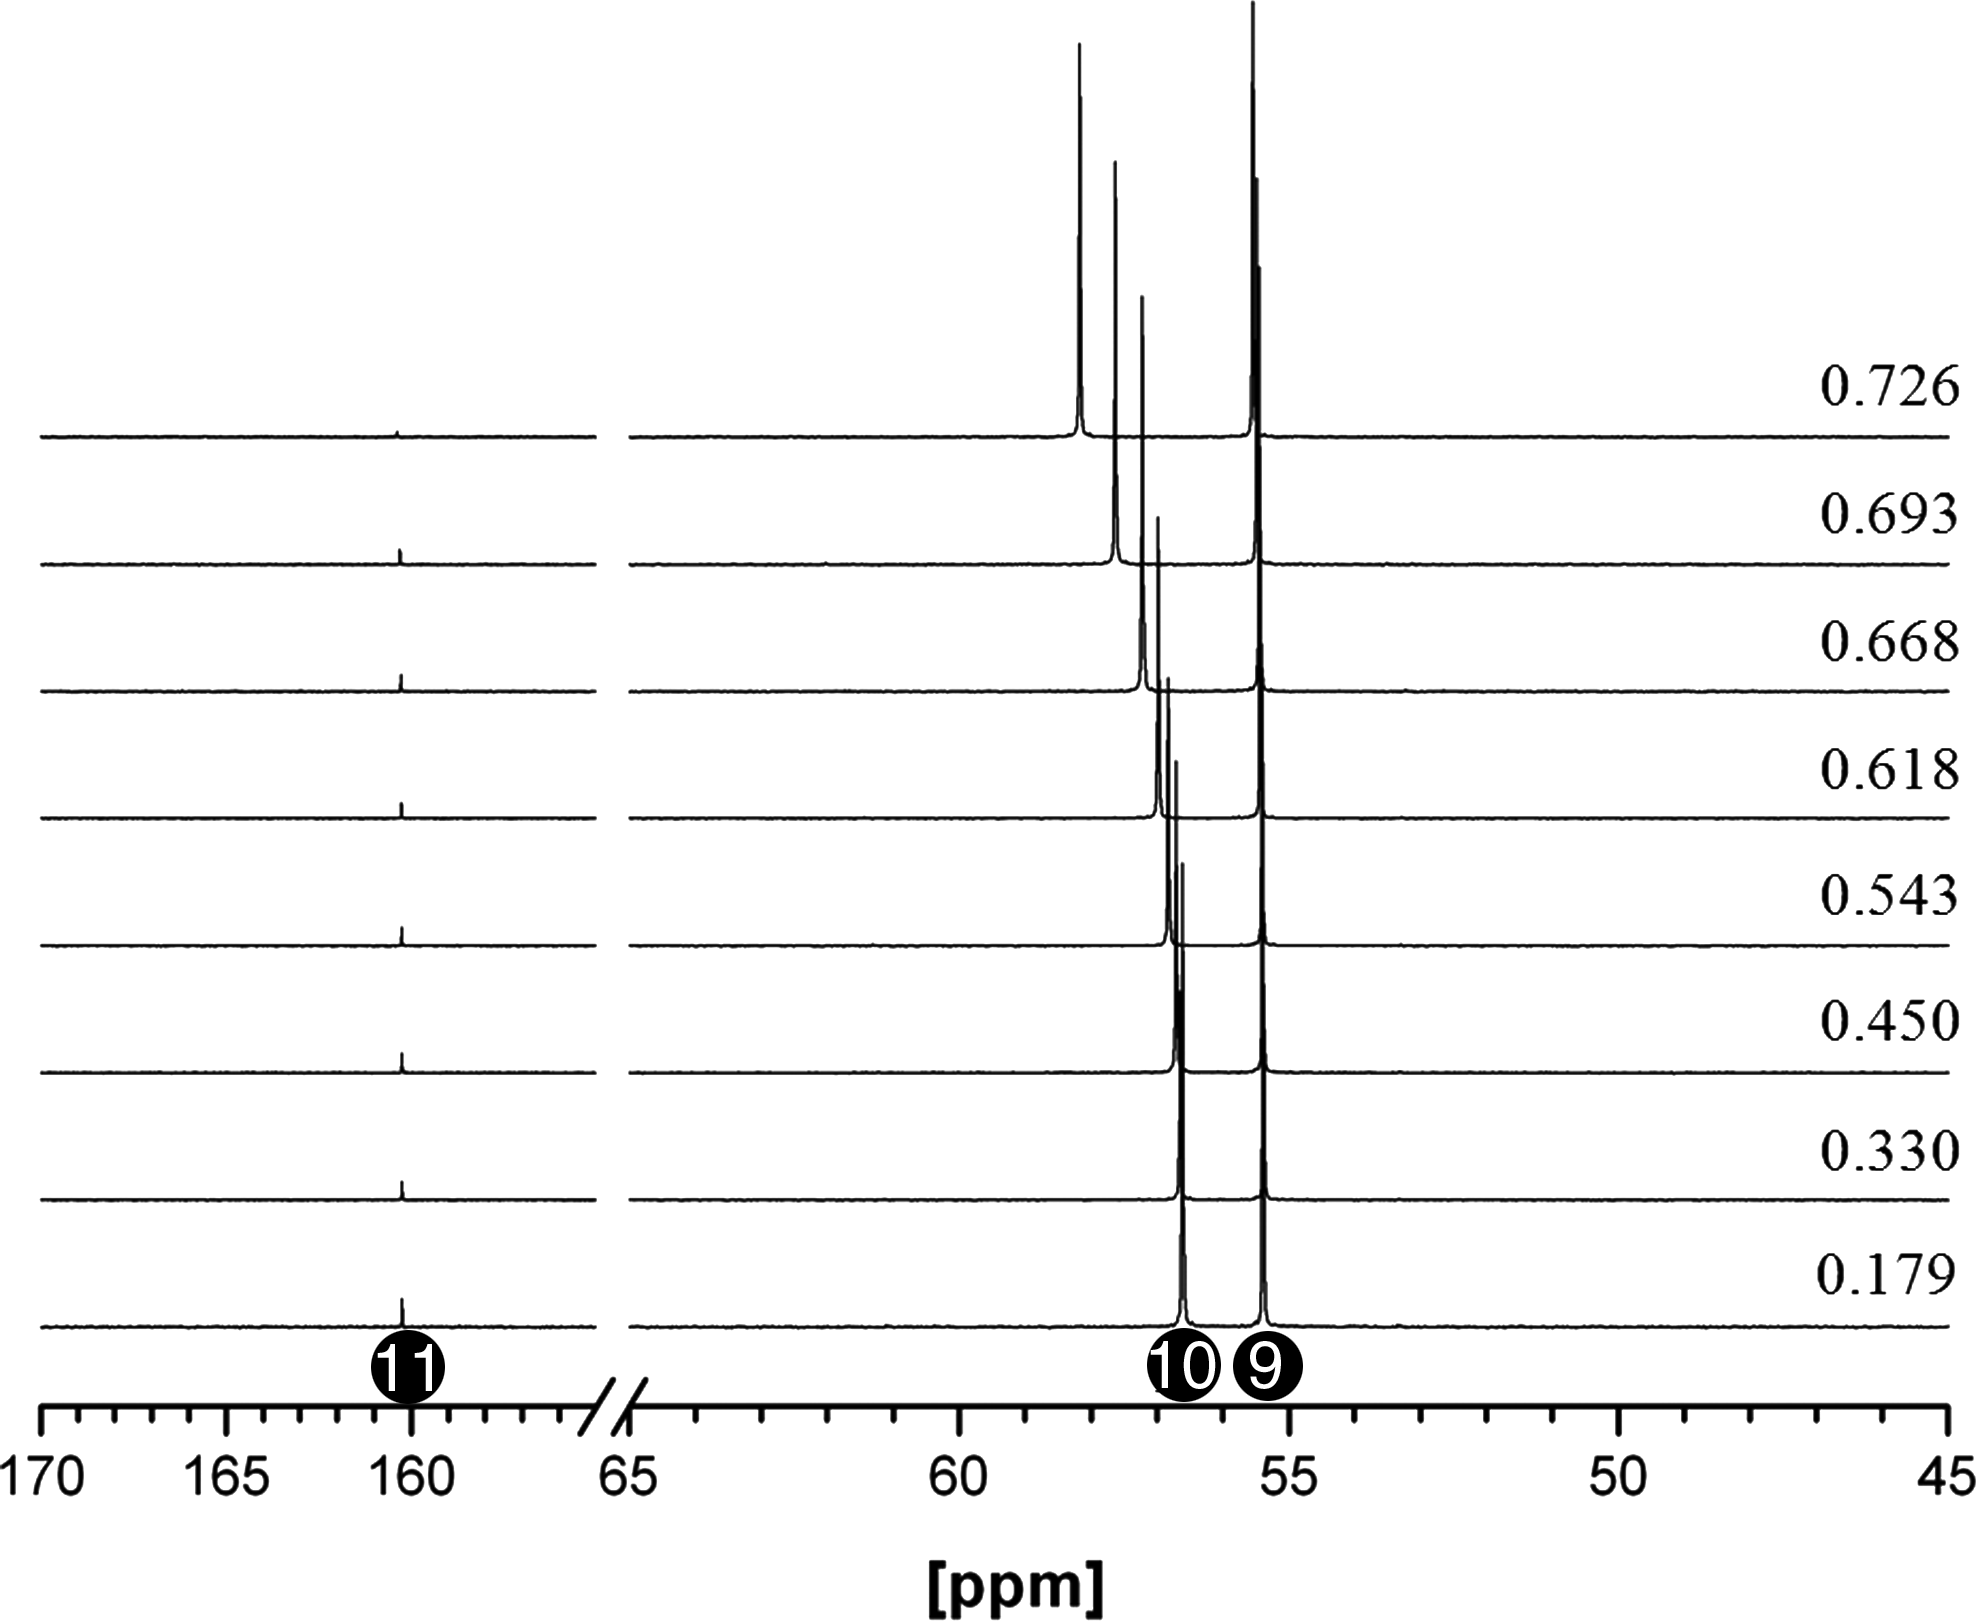
13C-NMR spectra during CO2 absorption by the TEA-H2O-CO2 system at 333K. Carbon resonances at different CO2 absorption levels in eight 30 mass% TEA solutions as a function of CO2 loading.
1H Nuclear Magnetic Resonance Spectra of Chemical Shift and Peak Areas of Monoethanolamine at 333K
Loading
1H-NMR species in solution, δ (ppm)
Amine
Mole CO2/mole absorbent
Free MEA (CH2-NH2)
Carbamate (CH2-NHCOO−)
Carbamate (CH2-OH−)
Free MEA (CH2-OH)
MEA
0.084
3.588 (0.99)
3.562 (0.08)
3.119 (0.07)
2.733 (1.00)
0.170
3.616 (1.01)
3.565 (0.15)
3.122 (0.15)
2.785 (1.00)
0.250
3.639 (1.01)
3.561 (0.23)
3.118 (0.23)
2.832 (1.00)
0.333
3.666 (100)
3.559 (0.32)
3.116 (0.32)
2.887 (1.00)
0.416
3.704 (1.00)
3.565 (0.38)
3.122 (0.38)
2.953 (1.00)
0.496
3.728 (1.00)
3.563 (0.40)
3.119 (0.41)
3.002 (1.00)
0.557
3.741 (1.00)
3.564 (0.36)
3.121 (0.37)
3.026 (1.00)
0.601
3.748 (0.99)
3.562 (0.36)
3.119 (0.36)
3.041 (1.00)
The values inside parenthesis are integral calculus values.
MEA, monoethanolamine.
1H Nuclear Magnetic Resonance Spectra of Chemical Shift and Peak Areas of Diethanolamine at 333K
Loading
1H-NMR species in solution, δ (ppm)
Amine
Mole CO2/mole absorbent
Free DEA (CH2-NCOO−)
Carbamate (CH2-NH)
Carbamate (CH2-OH)
Free DEA (CH2-OH−)
DEA
0.147
3.696 (0.99)
3.654 (0.05)
3.363 (0.04)
2.808 (1.00)
0.293
3.725 (0.99)
3.653 (0.08)
3.362 (0.07)
2.890 (1.00)
0.427
3.751 (1.00)
3.654 (0.08)
3.363 (0.08)
2.963 (1.00)
0.547
3.774 (1.00)
3.655 (0.08)
3.364 (0.08)
3.023 (1.00)
0.642
3.786 (1.00)
3.654 (0.08)
3.363 (0.07)
3.059 (1.00)
0.707
3.796 (1.00)
3.652 (0.08)
3.361 (0.07)
3.090 (1.00)
0.750
3.802 (1.00)
3.652 (0.07)
3.361 (0.06)
3.106 (1.00)
0.785
3.806 (1.00)
3.654 (0.07)
3.363 (0.06)
3.114 (1.00)
The values inside parenthesis are integral calculus values.
DEA, diethanolamine.
1H Nuclear Magnetic Resonance Spectra of Chemical Shift and Peak Areas of Triethanolamine at 333 K
Loading
1H-NMR species in solution, δ (ppm)
Amine
Mole CO2/mole absorbent
Free TEA (CH2-N)
Carbamate (CH2-NHCOO−)
Carbamate (CH2-OH−)
Free TEA (CH2-OH)
TEA
0.179
3.708
x
x
2.838
0.330
3.759
x
x
2.958
0.450
3.788
x
x
3.029
0.543
3.808
x
x
3.083
0.618
3.809
x
x
3.086
0.668
3.823
x
x
3.133
0.693
3.831
x
x
3.157
0.726
3.828
x
x
3.136
TEA, triethanolamine.
During the conversion of bicarbonate (\documentclass{aastex}\usepackage{amsbsy}\usepackage{amsfonts}\usepackage{amssymb}\usepackage{bm}\usepackage{mathrsfs}\usepackage{pifont}\usepackage{stmaryrd}\usepackage{textcomp}\usepackage{portland, xspace}\usepackage{amsmath, amsxtra}\pagestyle{empty}\DeclareMathSizes{10}{9}{7}{6}\begin{document}
$${\rm HCO}_3^-$$
\end{document}) to carbonate (\documentclass{aastex}\usepackage{amsbsy}\usepackage{amsfonts}\usepackage{amssymb}\usepackage{bm}\usepackage{mathrsfs}\usepackage{pifont}\usepackage{stmaryrd}\usepackage{textcomp}\usepackage{portland, xspace}\usepackage{amsmath, amsxtra}\pagestyle{empty}\DeclareMathSizes{10}{9}{7}{6}\begin{document}
$${\rm CO}_3^{2 -}$$
\end{document}), the 13C NMR chemical shifts corresponding to aqueous amines merged into a single peak at δ=160–164 ppm due to kinetic averaging. The relative intensities of the bicarbonate and carbonate peaks indicated the position of the equilibration (Mani et al., 2006). The relative quantities of \documentclass{aastex}\usepackage{amsbsy}\usepackage{amsfonts}\usepackage{amssymb}\usepackage{bm}\usepackage{mathrsfs}\usepackage{pifont}\usepackage{stmaryrd}\usepackage{textcomp}\usepackage{portland, xspace}\usepackage{amsmath, amsxtra}\pagestyle{empty}\DeclareMathSizes{10}{9}{7}{6}\begin{document}
$${\rm HCO}_3^-$$
\end{document} and \documentclass{aastex}\usepackage{amsbsy}\usepackage{amsfonts}\usepackage{amssymb}\usepackage{bm}\usepackage{mathrsfs}\usepackage{pifont}\usepackage{stmaryrd}\usepackage{textcomp}\usepackage{portland, xspace}\usepackage{amsmath, amsxtra}\pagestyle{empty}\DeclareMathSizes{10}{9}{7}{6}\begin{document}
$${\rm CO}_3^{2 -}$$
\end{document} were indicated by the position of merged 13C NMR peak, based on analysis of the chemical shifts of KHCO3 (δ=160.82) and K2CO3 (δ=168.24). According to the method described by Mani, the relative quantities of the components could be determined from the shift in the \documentclass{aastex}\usepackage{amsbsy}\usepackage{amsfonts}\usepackage{amssymb}\usepackage{bm}\usepackage{mathrsfs}\usepackage{pifont}\usepackage{stmaryrd}\usepackage{textcomp}\usepackage{portland, xspace}\usepackage{amsmath, amsxtra}\pagestyle{empty}\DeclareMathSizes{10}{9}{7}{6}\begin{document}
$${\rm HCO}_3^- / {\rm CO}_3^{2 -}$$
\end{document} peak, shown in Figs. 6 and 7, which increased with CO2 loading. That is, as the CO2 loading increased, a higher rate of the reverse reaction, corresponding to the conversion of \documentclass{aastex}\usepackage{amsbsy}\usepackage{amsfonts}\usepackage{amssymb}\usepackage{bm}\usepackage{mathrsfs}\usepackage{pifont}\usepackage{stmaryrd}\usepackage{textcomp}\usepackage{portland, xspace}\usepackage{amsmath, amsxtra}\pagestyle{empty}\DeclareMathSizes{10}{9}{7}{6}\begin{document}
$${\rm HCO}_3^{-}$$
\end{document} to \documentclass{aastex}\usepackage{amsbsy}\usepackage{amsfonts}\usepackage{amssymb}\usepackage{bm}\usepackage{mathrsfs}\usepackage{pifont}\usepackage{stmaryrd}\usepackage{textcomp}\usepackage{portland, xspace}\usepackage{amsmath, amsxtra}\pagestyle{empty}\DeclareMathSizes{10}{9}{7}{6}\begin{document}
$${\rm CO}_3^{2 -}$$
\end{document}, resulted in a gradual shift toward higher field strengths. Increasing the CO2 loading prevented the conversion of \documentclass{aastex}\usepackage{amsbsy}\usepackage{amsfonts}\usepackage{amssymb}\usepackage{bm}\usepackage{mathrsfs}\usepackage{pifont}\usepackage{stmaryrd}\usepackage{textcomp}\usepackage{portland, xspace}\usepackage{amsmath, amsxtra}\pagestyle{empty}\DeclareMathSizes{10}{9}{7}{6}\begin{document}
$${\rm HCO}_3^-$$
\end{document} to \documentclass{aastex}\usepackage{amsbsy}\usepackage{amsfonts}\usepackage{amssymb}\usepackage{bm}\usepackage{mathrsfs}\usepackage{pifont}\usepackage{stmaryrd}\usepackage{textcomp}\usepackage{portland, xspace}\usepackage{amsmath, amsxtra}\pagestyle{empty}\DeclareMathSizes{10}{9}{7}{6}\begin{document}
$${\rm CO}_3^{2 -}$$
\end{document}, as indicated by the absence of a chemical shift in the \documentclass{aastex}\usepackage{amsbsy}\usepackage{amsfonts}\usepackage{amssymb}\usepackage{bm}\usepackage{mathrsfs}\usepackage{pifont}\usepackage{stmaryrd}\usepackage{textcomp}\usepackage{portland, xspace}\usepackage{amsmath, amsxtra}\pagestyle{empty}\DeclareMathSizes{10}{9}{7}{6}\begin{document}
$${\rm HCO}_3^- / {\rm CO}_3^{2 -}$$
\end{document} peak (Fig. 8). The initial absorption of CO2 proceeded through the carbonate.
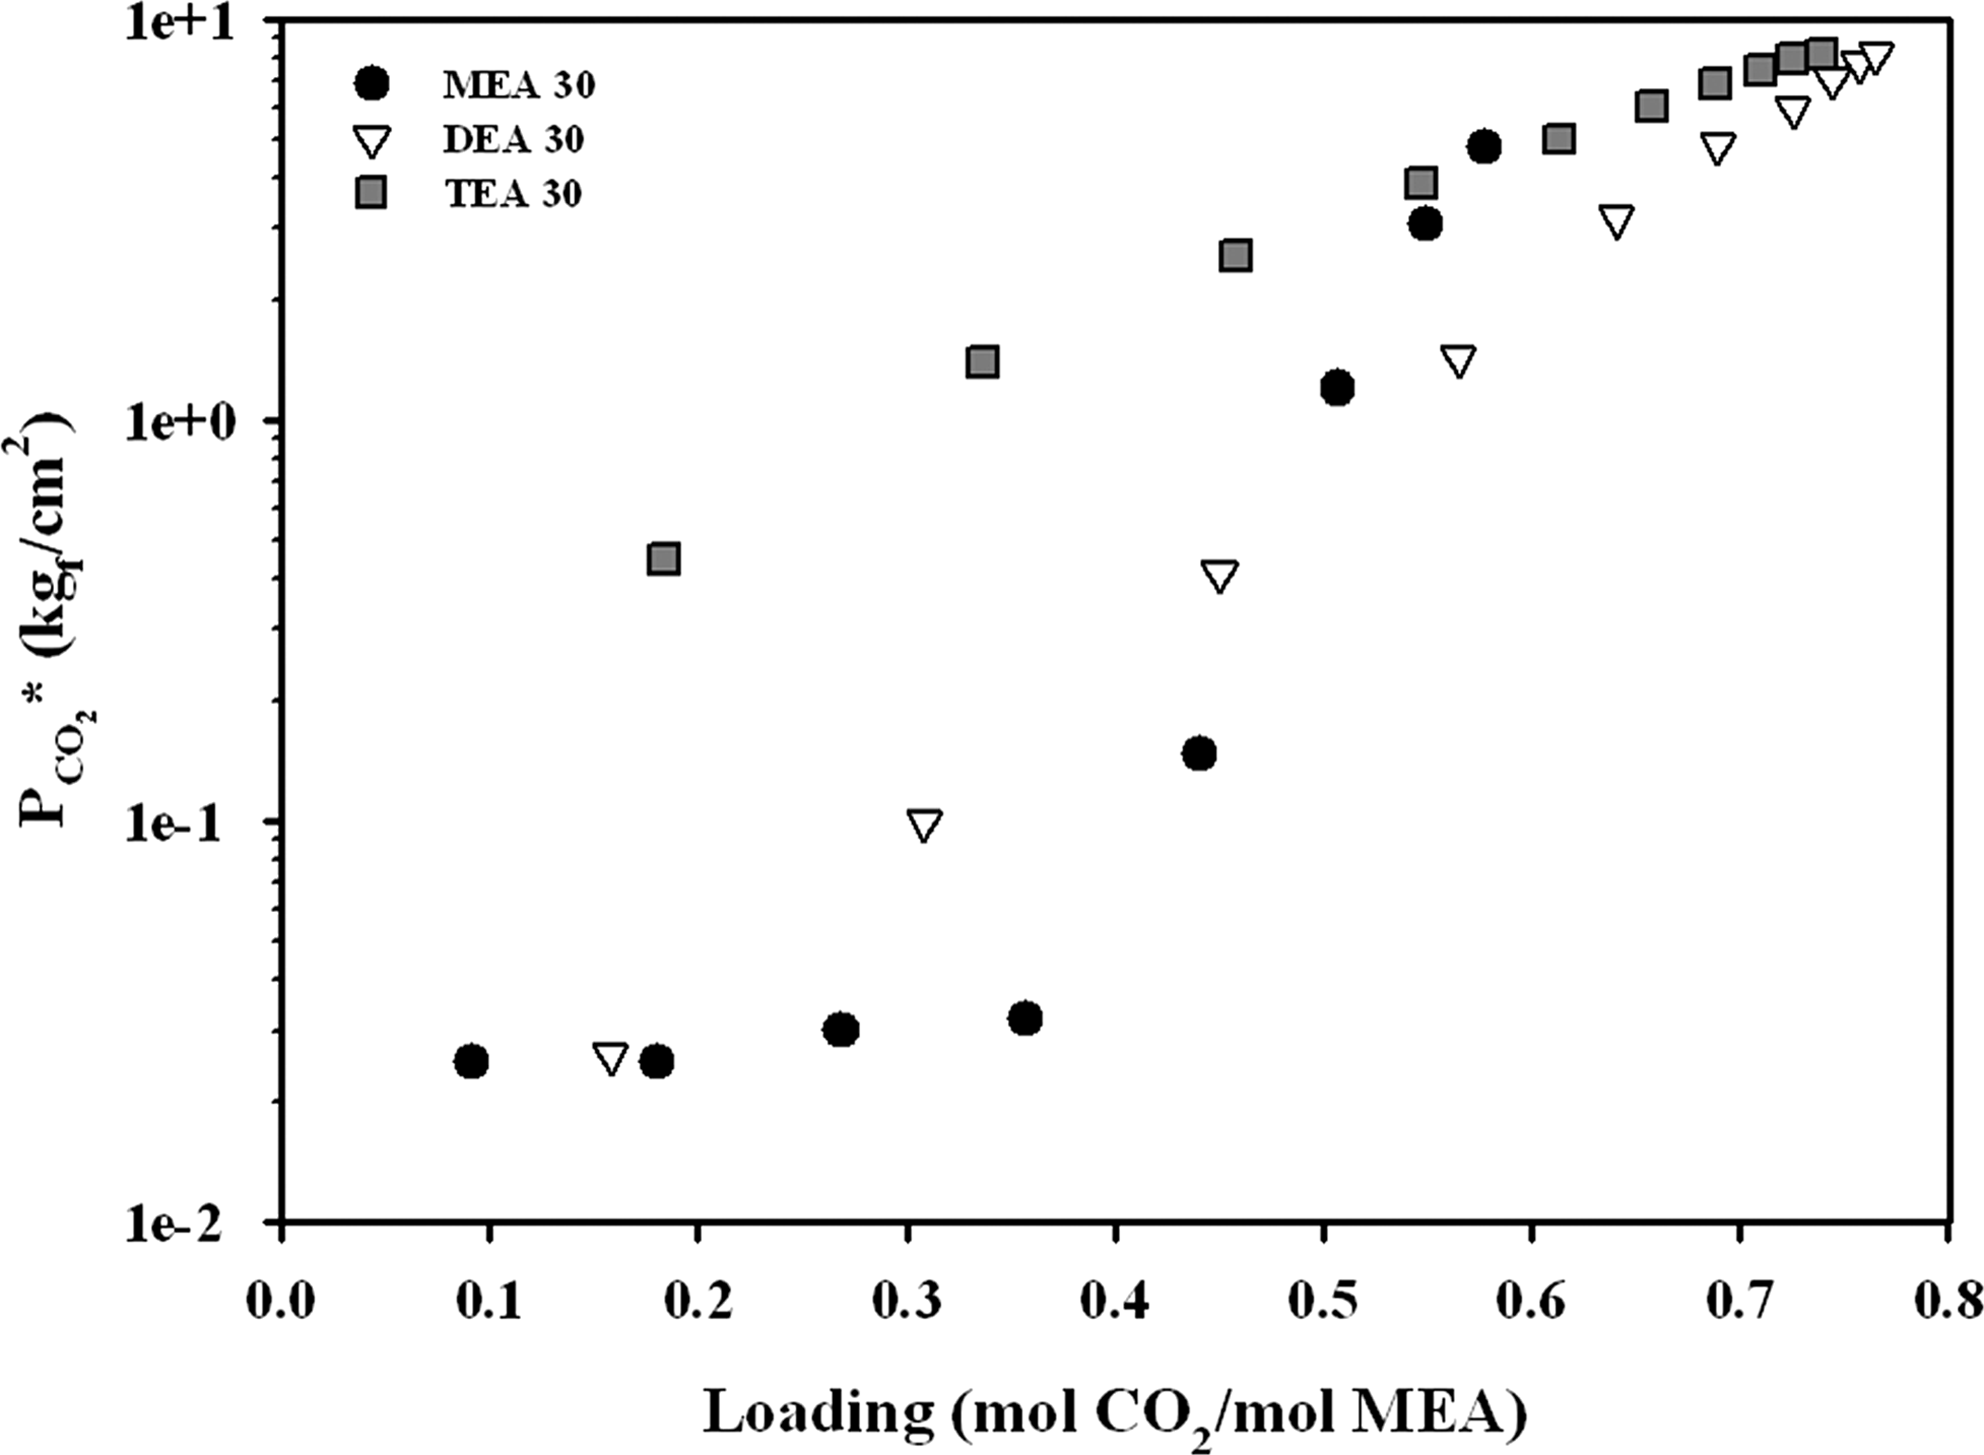
Vapor–liquid equilibrium
The extent of CO2 absorption at equilibrium by 30 mass % MEA, DEA, or TEA aqueous solutions is shown in Fig. 9. The graph shows the specific partial pressure of CO2 (\documentclass{aastex}\usepackage{amsbsy}\usepackage{amsfonts}\usepackage{amssymb}\usepackage{bm}\usepackage{mathrsfs}\usepackage{pifont}\usepackage{stmaryrd}\usepackage{textcomp}\usepackage{portland, xspace}\usepackage{amsmath, amsxtra}\pagestyle{empty}\DeclareMathSizes{10}{9}{7}{6}\begin{document}
$$P_{{\rm CO}2}{}^*$$
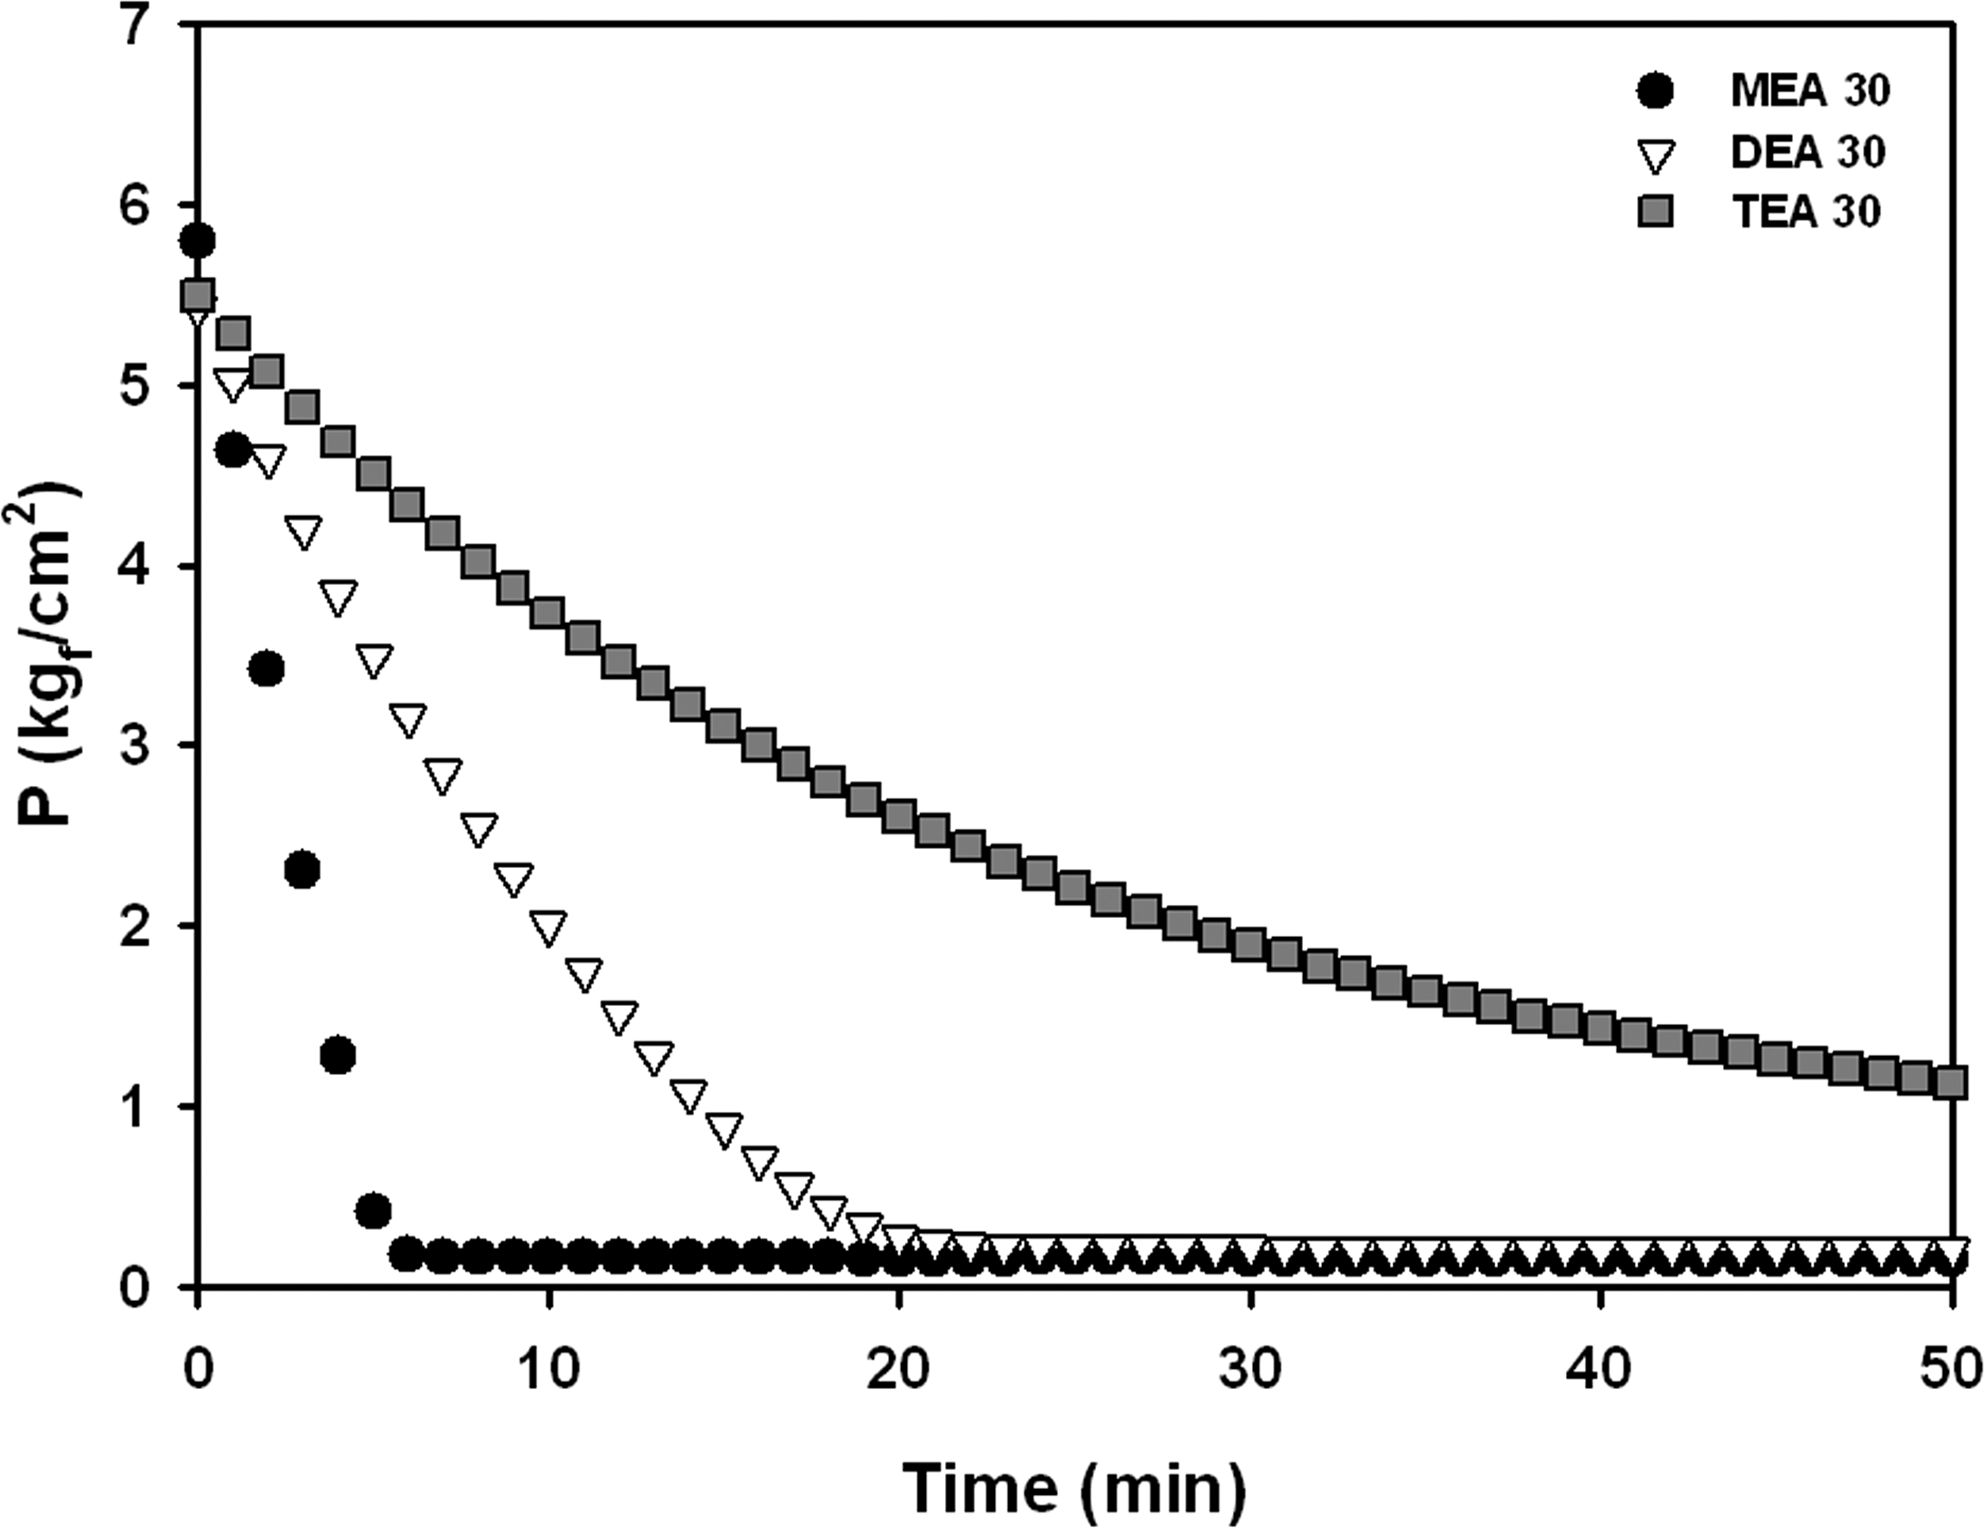
\end{document}) as a function of CO2 loading in the absorbents. CO2 loading is the moles CO2 absorbed by 1 mole amine. At a given CO2 loading, low specific partial pressures of CO2 yield high absorption capacities. The slope of the absorption capacity of MEA rapidly increased from a CO2 loading of 0.4 mole, and the absorption capacity reached a maximum at 0.6 mole, after which point, further absorption was not observed. Two moles of amine in MEA or DEA reacted with 1 mole of CO2, and the equilibrium loading reached a limit at 0.5 moles (Sartori and Savage, 1983). Absorption of 0.5 mole CO2 or higher resulted in the generation of free amine groups due to the hydrolysis of carbamate. The free amine groups also absorbed CO2. The equilibrium CO2 loading of DEA was higher, because the carbamate stability was lower than in MEA. Since TEA acts as a base catalyst in the reaction between water and CO2, TEA showed an equilibrium loading similar to that of DEA under saturated conditions. Changes in pressure in the reactor over time after CO2 was initially injected into the absorbent are shown in Fig. 10. These changes indicated the relative absorption reaction rates of individual absorbents. The order of the CO2 absorption rates was MEA>DEA>TEA. In this study, the 1H and 13C NMR data for MEA, DEA, and TEA were used to calculate the CO2 absorption mechanism. 1H and 13C NMR results provided information about the species distribution and reaction mechanism. The species distribution in the absorbents is key to the design of reliable CO2 capture processes. The species distributions and analysis methods used in this study provide guidelines that can be used to develop new absorbents.
Equilibrium solubility of CO2 in aqueous 30 mass% MEA, DEA, and TEA solutions at 333K.
Total pressure of the gases in aqueous MEA, DEA, and TEA 30 mass% at 333K.
Conclusions
The distribution of species formed on CO2 absorption by primary, secondary, or tertiary amine aqueous solutions was identified by analysis of 1H NMR and 13C NMR spectra. The \documentclass{aastex}\usepackage{amsbsy}\usepackage{amsfonts}\usepackage{amssymb}\usepackage{bm}\usepackage{mathrsfs}\usepackage{pifont}\usepackage{stmaryrd}\usepackage{textcomp}\usepackage{portland, xspace}\usepackage{amsmath, amsxtra}\pagestyle{empty}\DeclareMathSizes{10}{9}{7}{6}\begin{document}
$${\rm HCO}_3^- / {\rm CO}_3^{2 -}$$
\end{document} peaks did not appear in the CO2-absorbed MEA 13C NMR spectrum at low CO2 loading but were observed at high CO2 loading (loading=0.416 moles). These peaks appeared at δ=160.78–162.55 ppm, depending on the CO2 loading. \documentclass{aastex}\usepackage{amsbsy}\usepackage{amsfonts}\usepackage{amssymb}\usepackage{bm}\usepackage{mathrsfs}\usepackage{pifont}\usepackage{stmaryrd}\usepackage{textcomp}\usepackage{portland, xspace}\usepackage{amsmath, amsxtra}\pagestyle{empty}\DeclareMathSizes{10}{9}{7}{6}\begin{document}
$${\rm HCO}_3^- / {\rm CO}_3^{2 -}$$
\end{document} peaks appeared in the CO2-absorbed DEA 13C NMR spectrum at δ=160.50–162.70 ppm. Although the \documentclass{aastex}\usepackage{amsbsy}\usepackage{amsfonts}\usepackage{amssymb}\usepackage{bm}\usepackage{mathrsfs}\usepackage{pifont}\usepackage{stmaryrd}\usepackage{textcomp}\usepackage{portland, xspace}\usepackage{amsmath, amsxtra}\pagestyle{empty}\DeclareMathSizes{10}{9}{7}{6}\begin{document}
$${\rm HCO}_3^- / {\rm CO}_3^{2 -}$$
\end{document} peaks appeared at low levels of TEA CO2 loading, as with DEA, the peak intensities were very small at δ=160.27–160.37 ppm. Therefore, as the CO2 loading increased, the fraction of \documentclass{aastex}\usepackage{amsbsy}\usepackage{amsfonts}\usepackage{amssymb}\usepackage{bm}\usepackage{mathrsfs}\usepackage{pifont}\usepackage{stmaryrd}\usepackage{textcomp}\usepackage{portland, xspace}\usepackage{amsmath, amsxtra}\pagestyle{empty}\DeclareMathSizes{10}{9}{7}{6}\begin{document}
$${\rm HCO}_3^-$$
\end{document} exceeded that of \documentclass{aastex}\usepackage{amsbsy}\usepackage{amsfonts}\usepackage{amssymb}\usepackage{bm}\usepackage{mathrsfs}\usepackage{pifont}\usepackage{stmaryrd}\usepackage{textcomp}\usepackage{portland, xspace}\usepackage{amsmath, amsxtra}\pagestyle{empty}\DeclareMathSizes{10}{9}{7}{6}\begin{document}
$${\rm CO}_3^{2 -}$$
\end{document}, and the \documentclass{aastex}\usepackage{amsbsy}\usepackage{amsfonts}\usepackage{amssymb}\usepackage{bm}\usepackage{mathrsfs}\usepackage{pifont}\usepackage{stmaryrd}\usepackage{textcomp}\usepackage{portland, xspace}\usepackage{amsmath, amsxtra}\pagestyle{empty}\DeclareMathSizes{10}{9}{7}{6}\begin{document}
$${\rm HCO}_3^- / {\rm CO}_3^{2 -}$$
\end{document} peaks were shifted up-field. 1H NMR analysis showed that at CO2 absorption of >0.5 moles by MEA or DEA, the predicted stoichiometric point of saturation, the reactions shifted from carbamate formation to bicarbonate and carbonate formation, thus reflecting the maximum level of absorption by the individual amines.
Footnotes
Acknowledgment
This work was supported by Energy & Resource R&D program (2008CCD27P010000) under the Ministry of Knowledge Economy, Republic of Korea.
Author Disclosure Statement
No competing financial interests exist.
Notation
References
1.
BarzagliF., ManiF., PeruzziniM.2009. A 13C NMR study of the carbon dioxide absorption and desorption equilibria by aqueous 2-aminoethanol and N-methyl-substituted 2-aminoethanol. Energy Environ. Sci., 2:322.
2.
BonenfantD., MimeaultM., HauslerR.2003. Determination of the structural features of distinct amines important for the absorption of CO2 and regeneration in aqueous solution. Ind. Eng. Chem. Res., 42:3179.
3.
CaplowM.1968. Kinetics of carbamate formation and breakdown. J. Am. Chem. Soc., 90:6795.
4.
ClosmannF., NguyenT., RochelleG.T.2009. MDEA/Piperazine as a solvent for CO2 capture. Energy Procedia., 1:1351.
5.
DanckwertsP.V.1979. The reaction of CO2 with ethanolamine. Chem. Eng. Sci., 34:443.
6.
DonaldsonT.L., NguyenT.N.1980. Carbon dioxide reaction kinetics and transport in aqueous amine membranes. Ind. Eng. Chem. Fundam., 19:260.
7.
EdaliM., AboudheirA., IdemR.2009. Kinetics of carbon dioxide absorption into mixed aqueous solutions of MDEA and MEA using a laminar jet apparatus and a numerically solved 2D absorption rate/kinetics model. Int. J. Greenhouse Gas Control, 3:550.
8.
GlasscockD.A., CritchfieldJ.E., RochelleG.T.1991. CO2 absorption/desorption in mixtures of methyldiethanolamine with monoethanolamine or diethanolamine. Chem. Eng. Sci., 46:2829.
9.
JakobensJ.P., da SilvaE.F., KraneJ., SvendsenH.F.2008. NMR study and quantum mechanical calculations on the 2-[(2-aminoethyl)amino]-ethanol–H2O–CO2 system. J. Magn. Reson., 191:304.
10.
Ma'munS., JakobsenJ.P., SvendsenH.F.2006. Experimental and modeling study of the solubility of carbon dioxide in aqueous 30 mass % 2-((2-aminoethyl)amino)ethanol solution. Ind. Eng. Chem. Res., 45:2505.
11.
ManiF., PeruzziniM., StoppioniP.2006. CO2 absorption by aqueous NH3 solutions: speciation of ammonium carbamate, bicarbonate and carbonate by a 13C NMR study. Green Chem., 8:995.
SartoriG., SavageD.W.1983. Sterically hindered amine for CO2 removal from gases. Ind. Eng. Chem. Fundam., 22:239.
14.
SinghP., VersteegG.F.2008. Structure and activity relationships for CO2 regeneration from aqueous amine-based absorbents. Process Saf. Environ. Protect., 86:347.
15.
YangQ., BownM., AliA., WinklerD., PuxtyG., AttallaM.2009. A carbon-13 NMR study of carbon dioxide absorption and desorption with aqueous amine solutions. Energy Procedia., 1:955.
16.
YoonS.J., LeeH.2003. Substituent effect in amine–CO2 interaction investigated by NMR and IR spectroscopies. Chem. Lett., 32:344.

 (1)
(1) (2)
(2) (3)
(3) (4)
(4)