
Abstract
Abstract
This study examined critical factors related to the short-term variation of algae growth in reservoirs during the summer. To this end, statistical tests were carried out at a small dam reservoir to determine how chemical factors (e.g., nutrient concentrations) and physical factors (e.g., theoretical and relative residence times, temperature) influenced the chlorophyll a (Chl-a) concentration. Statistical tests revealed that, although phosphorus (P) concentration was significant for Chl-a, residence time had much stronger relationship to Chl-a concentration than chemical factors. In addition, the study verified that relative residence time (RRT) best explained the relation of water status to algae growth. RRT was found to be useful in identifying water status related to the summer algae bloom. Finally, this study raised the possibility of inhibiting summer algae growth by operating dam reservoirs moderately. These findings need to be seriously considered when reservoir operators establish effective strategies for water quality management in summer.
Introduction
It is well known that algae growth is variously influenced by abiotic and biotic factors. Abiotic factors are divided into physical factors (e.g., temperature, light penetration, and residence time), and chemical factors, that is, diverse nutrient concentrations (Jones and Bachmann, 1976; Hoyer and Jones, 1983; Søballe and Kimmel, 1987; Gomes and Miranda, 2001). Although temperature and light density have a substantial effect on algae growth (Rittmann and McCarty, 2003), nutrient concentration and residence time are known to be the most important factors for algae growth in summer (Correll, 1998; Dickman, 1969; Gomes and Miranda, 2001). Many researchers have reported that phosphorus is critical value for algae growth (OECD, 1982; Schindler, 1977; Correll, 1998; Moss et al., 1989). This results from the decrease of N/P ratio. Conversely, a few researchers have argued that nitrogen is limiting factor for algae growth (Ryther and Dunstan, 1971). Unlike these researchers, Dickman (1969) argued that water residence time is more likely to be important for algae bloom than nutrient concentration, especially for small reservoirs. Gomes and Miranda (2001) showed that chlorophyll a (Chl-a) increases with increasing residence time and decreases with increasing discharge. Reynolds and Lund (1988) reported that heavy rainfall could change the phytoplankton populations in lakes where the residence time is short. Maberly and others (2002) studied many small upland lakes in the English Lake District and demonstrated that short residence time supplied an unsuitable environment for the growth of nitrogen-fixing cyanobacteria.
Although shorter residence time generally leads to limitations on algal colonization, growth, and reproduction in reservoirs and lakes (Søballe and Kimmel, 1987; Jones and Elliot, 2007; Jones et al., 1984; Gameiro et al., 2004), some researchers have reported no correlation between residence time and phytoplankton biomass (Moss et al., 1989; Kawara et al., 1998; Renella and Quirós, 2006). In two shallow lakes, however, Renella and Quirós (2006) did show that phytoplankton biomass reached a higher level when the water residence time was short.These results contradict the results of Gomes and Miranda (2001) and Maberly and others (2002). We suppose that the inconsistency in the relationship between residence time and Chl-a concentration comes about because different methods were used to define residence time and because some definitions did not distinguish water status in detail.
In summary, algae growth is affected by various factors, and thus for efficient water quality management in a reservoir or lake, it is necessary to reveal the critical factors related to algae growth. Hence, this study aims to statistically elucidate the relationships between algae growth and various factors with sample data from a small dam reservoir during the summer season. To do so, regression models are built while the Chl-a concentration is regarded as a function of chemical and/or physical factors. The results are then discussed with the obtained statistics and other researchers' results. Finally, this case is expected to have important implications to water engineers and managers who are interested in restraining algae bloom and devising systematic strategies for the water quality management of lakes or dam reservoirs.
Study Area
The Sueo dam reservoir is located in a temperate region in the southern part of South Korea. It was constructed in 1978 for agricultural and industrial water supply. It has a long and narrow shape, as shown in Fig. 1A. The catchment area is 49 km2, and the reservoir has a surface area of 1.6 km2, total storage capacity of 27.5×10⁶ m3, and a mean depth of 25 m. Theoretical residence time is known to be relatively short, approximately 40 days. There are two inflows and one outflow. The main inflow is the Sueo Stream, which alone does not supply enough water for dam operation. As a result, the Seomjin River was connected to the reservoir via an underground pipe across a mountain. The water quality of the Seomjin River is worse than that of the Sueo Stream, according to the Water Management Information System (www.wamis.go.kr), a government database, and hence the Seomjin River is usually diverted from the reservoir in the summer when algae bloom is apt to occur. Stored water is discharged mainly at an intake tower, and the intake rate is nearly constant at around 3.0 m3/s in all seasons. Although a spillway has been constructed to protect the area in case of flooding, it is not being operated. It can thus be said that the reservoir has a stable outflow and two inflows that fluctuate relatively over time.

Based on data from the Water Management Information System database (www.wamis.go.kr), total nitrogen (TN) and total phosphorus (TP) concentration are about 1000–2000 and 1–39 mg/m3, respectively. Thus the Sueo dam reservoir approximates a mesotrophic condition according to Nürnberg's standard (1996). Various phytoplankton species (e.g., green algae, Coelastrum, nontoxic cyanobacteria, Microcystis, and diatoms Asterionella) are observed in the Sueo dam reservoir. In summer, cyanobacteria, Microcystis is dominant. In addition, water quality in summer is generally worse than in other seasons. During the summer of 2000, for example, Chl-a reached 34.2 mg/m3, which was much higher than the average (below 10 mg/m3) of other seasons. As shown in Fig. 1, six hypolimnetic aerators were installed near the intake tower in 2003 to prevent summer algae bloom.
Study Methods
Sampling
To investigate the relationship of chemical factors and physical factors with Chl-a concentration, three sampling sites, A, B, and C, were added to the dam operator's two existing sampling sites, S1 and S2, as depicted in Fig. 1B. The dam operator had been measuring water quality and temperature at monthly intervals at S1 and S2. However, since we decided to collect samplings on a weekly basis for the period from early May to late September in 2008 at five sampling sites, 85 samplings (17 samples × 5 sampling sites) were separately gathered for this study. Also, at each time and point, water samples were collected at 5 m intervals of water depth. Sampling was carried out in the early morning when wind was modest.
Measurement items included Chl-a, temperature, water depth, dissolved oxygen (DO), TN, TP, dissolved total nitrogen (DTN), and dissolved total phosphorus (DTP). Temperature and DO were estimated by a YSI probe after calibration, and water depth was measured by a portable depth sounder (SM-5) in the field. The other items were analyzed in the laboratory by the standard methods (APHA et al., 1985). Namely, TP and DTP were determined with the ascorbic acid method, and TN and DTN were analyzed with the ultraviolet spectrophotometric method. Before estimation of DTN and DTP, each sample was filtered using Whatman GF/C filters (Soares et al., 2008). To quantify the amount of phytoplankton biomass, the spectrophotometric method was used to estimate the Chl-a concentration, after phytoplanktons were extracted with 90% acetone (Lorenzen, 1967). The Chl-a samples were stored and preserved in a dark cooler with ice packs. In all cases, a laboratory analysis was performed within 10 days of sampling.
Estimation of water residence time
Data on inflow/outflow rates and water volume, accumulated over many years by the reservoir operator, is available from the Water Management Information System database (www.wamis.go.kr), and was used here to calculate three types of water residence time. Since it is assumed that reservoirs are completely mixed reactors (Kerneïs et al., 1995), theoretical residence time (TRT) is often defined as water volume divided by inflow or outflow rate (Kawara et al., 1998; Renella and Quirós, 2006). Depending on which flow rate dominates water status, TRT can be expressed as
where TRTin and TRTout are, respectively, the theoretical residence times on the base of the inflow and outflow (day), Qin and Qout are the inflow and outflow rate (m3/s), and V is the water volume (m3).
There is another way to define water residence time, which was presented by Gomes and Miranda (2001). Known as relative residence time (RRT), it is defined as the time needed to fill a changed volume, RRT (day). RRT can be expressed as the daily changed water volume divided by the inflow rate, as given below:
where ΔV is the daily changed water volume (m3), V1 is the water volume at the present point in time (m3), and V0 is the water volume on the previous day (m3). Unlike two theoretical residence times, RRT can have a negative or positive sign, depending on whether the water volume decreases or increases over time. If the water volume decreases while the outflow rate is higher than the inflow rate, hydraulic movements in a reservoir become transient. That is, when the RRT value is negative, the water body can be viewed as being in a lotic condition. In contrast, if the water volume increases while the inflow is higher due to precipitation or stream flows, the RRT value becomes positive, and the water body can then be regarded as being in a lentic condition. It is therefore concluded that RRT helps to distinguish water status, although there is no theoretical consensus on lentic-lotic distinctions (Søballe and Kimmel, 1987).
Statistical estimation
To identify the critical factors for algae growth, the Chl-a concentration was considered as a function that potentially depends on chemical factors (TN, TP, DTN, and DTP), and physical factors (temperature, TRTin, TRTout, and RRT). It was anticipated that residence times were more influential than nutrient concentration for Chl-a concentration, because the targeted reservoir is relatively small. In addition, it was thought that the manner in which residence time was defined would result in different relationships between residence time and Chl-a concentration. These hypotheses were tested by using a simple regression model, presuming that the Chl-a concentration, y (mg/m3), had the following relation with each factor xi (temperature, TN, TP, DTN, DTP, TRTout, TRTin, and RRT).
where Fi(x) is a predetermined function of xi, which is the best-fitting curve on the scattergram between xi and y, and which was selected among a line, a polynomial function, an exponential function, or logarithmic function (SPSS® ver.12.0 was used as the statistical software). α
i
and β
i
are regression coefficients. By defining a new variable, zi=Fi(xi), Equation (4) becomes
In Equation (5), the p-value of β
i
, the correlation coefficient
Results and Discussion
Variation of Chl-a concentration
Figure 2 shows the Chl-a variation of the epilimnion at each sampling site. Temporal patterns were similar at all sites. The Chl-a concentration was high in the early sampling period and then decreased until 25 June. Thereafter, the concentration was below 10 mg/m3 on all days (a clear water phase), excluding 7 July and 25 August. It should be noted that notwithstanding less precipitation and sufficient sunshine, the Chl-a concentration was low during July and August. Potentially because phytoplankton biomass spreads horizontally, the largest variation of Chl-a spatially, was detected on 19 June. On 27 May and 9 June, maximum Chl-a concentrations were observed at the S2 site, which is close to the inlets of inflows. A few days later (19 June), maximum Chl-a concentrations were detected in sites B and S1, which were close to the intake tower.
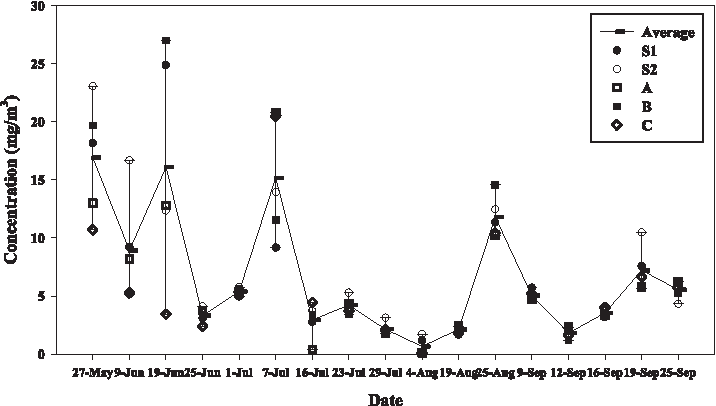
Temporal and spatial variations of Chl-a concentration.
Variation of temperature and nutrient concentration
During the sampling period, the temperature in the epilimnion and hypolimnion varied from 20° to 28°C and 7° to 18°C, respectively, as shown in Fig. 3. It was observed that the average temperature in the epilimnion increased very slightly over time, whereas that in the hypolimnion increased rapidly. Temperature differences between the epilimnion and hypolimnion were found to be large in the early sampling period, 8° or 13°C, depending on the sampling points. The stratification decreased over time, and around 25 August, overturn was observed.
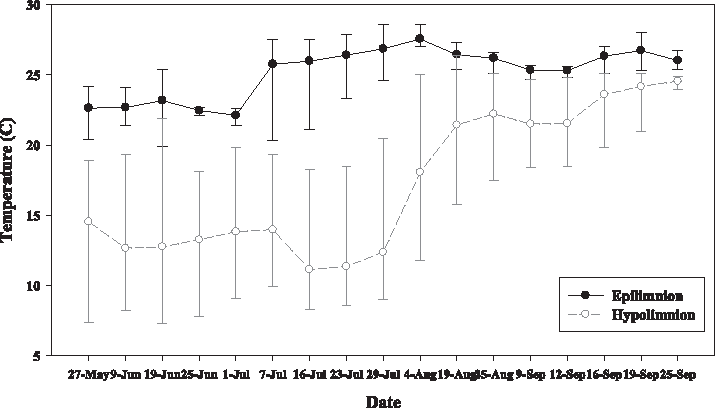
Variation of temperature in the epilimnion and hypolimnion. The upper and lower parts of the individual error box denote the maximum and minimum values among five sampling points.
Fig. 3 shows that hypolimnion temperature manifested a much wider variation than epilimnion temperature. This is because the water depth of the hypolimnion varies by the sampling point. Temperature of the epilimnion was maintained at > 20°C, irrespective of the sampling point. For the hypolimnion, the temperature was low at sites S1, A, and B, which were deep. As depicted in Fig. 4, it was therefore found that as the water depth becomes greater, the temperature difference between the epilimnion and hypolimnion increases.
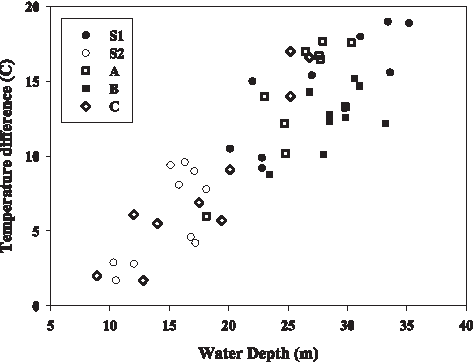
Temperature difference versus water depth (y-axis denotes temperature difference between epilimnion and hypolimnion). Data are observed at each sampling point from 27 May to 25 August.
In all cases, higher nutrients were observed in the earlier period (Figs. 5 and 6). This tendency was more obvious for potassium than for nitrogen. For example, at site A, the average TP and DTP concentrations were 52.5 and 21 mg/m3, respectively, on 27 May. They were sustained at relatively high levels until 1 July. However, TP and DTP continuously decreased, dropping to 4.2 and 4 mg/m3, on 29 July. Thereafter, TP and DTP varied slightly from 3.0 to 7.2 mg/m3 and from 1.0 to 6.0 mg/m3, respectively, with the exception of values of 19.5 mg/m3 and 14 mg/m3 on 9 September. TN and DTN concentrations started at 1371 and 886 mg/m3 and reached peaks of 1903 and 1413 mg/m3, respectively, on 16 July. They then decreased continuously. This trend was also observed at other sites.

Variation of TP and DTP. The upper and lower parts of the individual error box denote the maximum and minimum values among five sampling points.
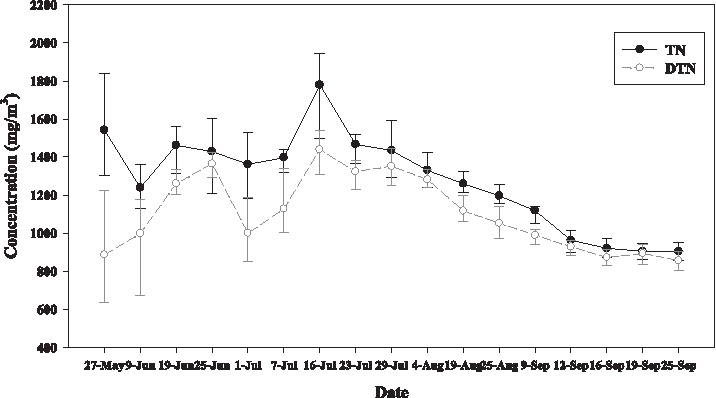
Variation of TN and DTN. The upper and lower parts of the individual error box denote the maximum and minimum values among five sampling points.
The maximum nutrient concentrations were observed 35 and 14 times out of 68 times at sites B and C, respectively. Given that B and C are the closest to the intake tower among sampling sites, this may have been caused by the transportation and accumulation of nutrients. Indeed, all the hypolimnions were continuously in an oxic condition, based on the results of measured DO concentration. It is thought that nutrients are not released in large amounts from sediments (Penn et al., 2000). It is therefore concluded that the variation of nutrient concentrations depended on the accumulation of external loadings.
Variation of residence time
Variations of hydrologic conditions (e.g., two inflows, outflow, and water volume), were first estimated, as shown in Fig. 7. Inflow from the Sueo Stream was greatly increased by heavy rainfall on 27 May, 18 June, 28 June, and 2 July, and the maximum amount was roughly 20 m3/s, recorded on 18 June. After early August, inflow changed moderately as there was no rainfall during this period. Inflow from the Seomjin River was vastly different. The maximum was merely 2.7 m3/s recorded on 16 June, and the inflow was cut off between 18 June and 3 August. As previously mentioned, the outflow was nearly constant at 3.0 m3/s. For this reason, water volume was mainly changed by inflow. Water volume sharply increased from 18 June to 4 July, when heavy rainfall increased the inflow from the Sueo Stream, and later decreased gradually.

Variation of inflow/outflow rate and water volume during sampling periods.
Water residence time changed according to variations of hydrologic conditions. Figure 8 presents the variations of three types of water residence time obtained using Equations (1)–(3). Because outflow was nearly constant, TRTout was quite proportional to water volume. Variation of TRTout, ranging from 127 to 202 days, was modest compared to other residence times. TRTin was not only affected by water volume but also determined by instantly varying inflows. As a result, its temporal variation was more severe, ranging from 10 to 147 days. Since RRT was estimated with deviation of water volume and inflows, it showed the largest variation over the period. Furthermore, RRT was positive or negative according to the direction to which water volume deviated. As seen in Fig. 8, RRT was negative for most of the period. This is because water volume was raised by large inflows several times between late May and early July. For the remaining period, water volume stagnated or decreased.
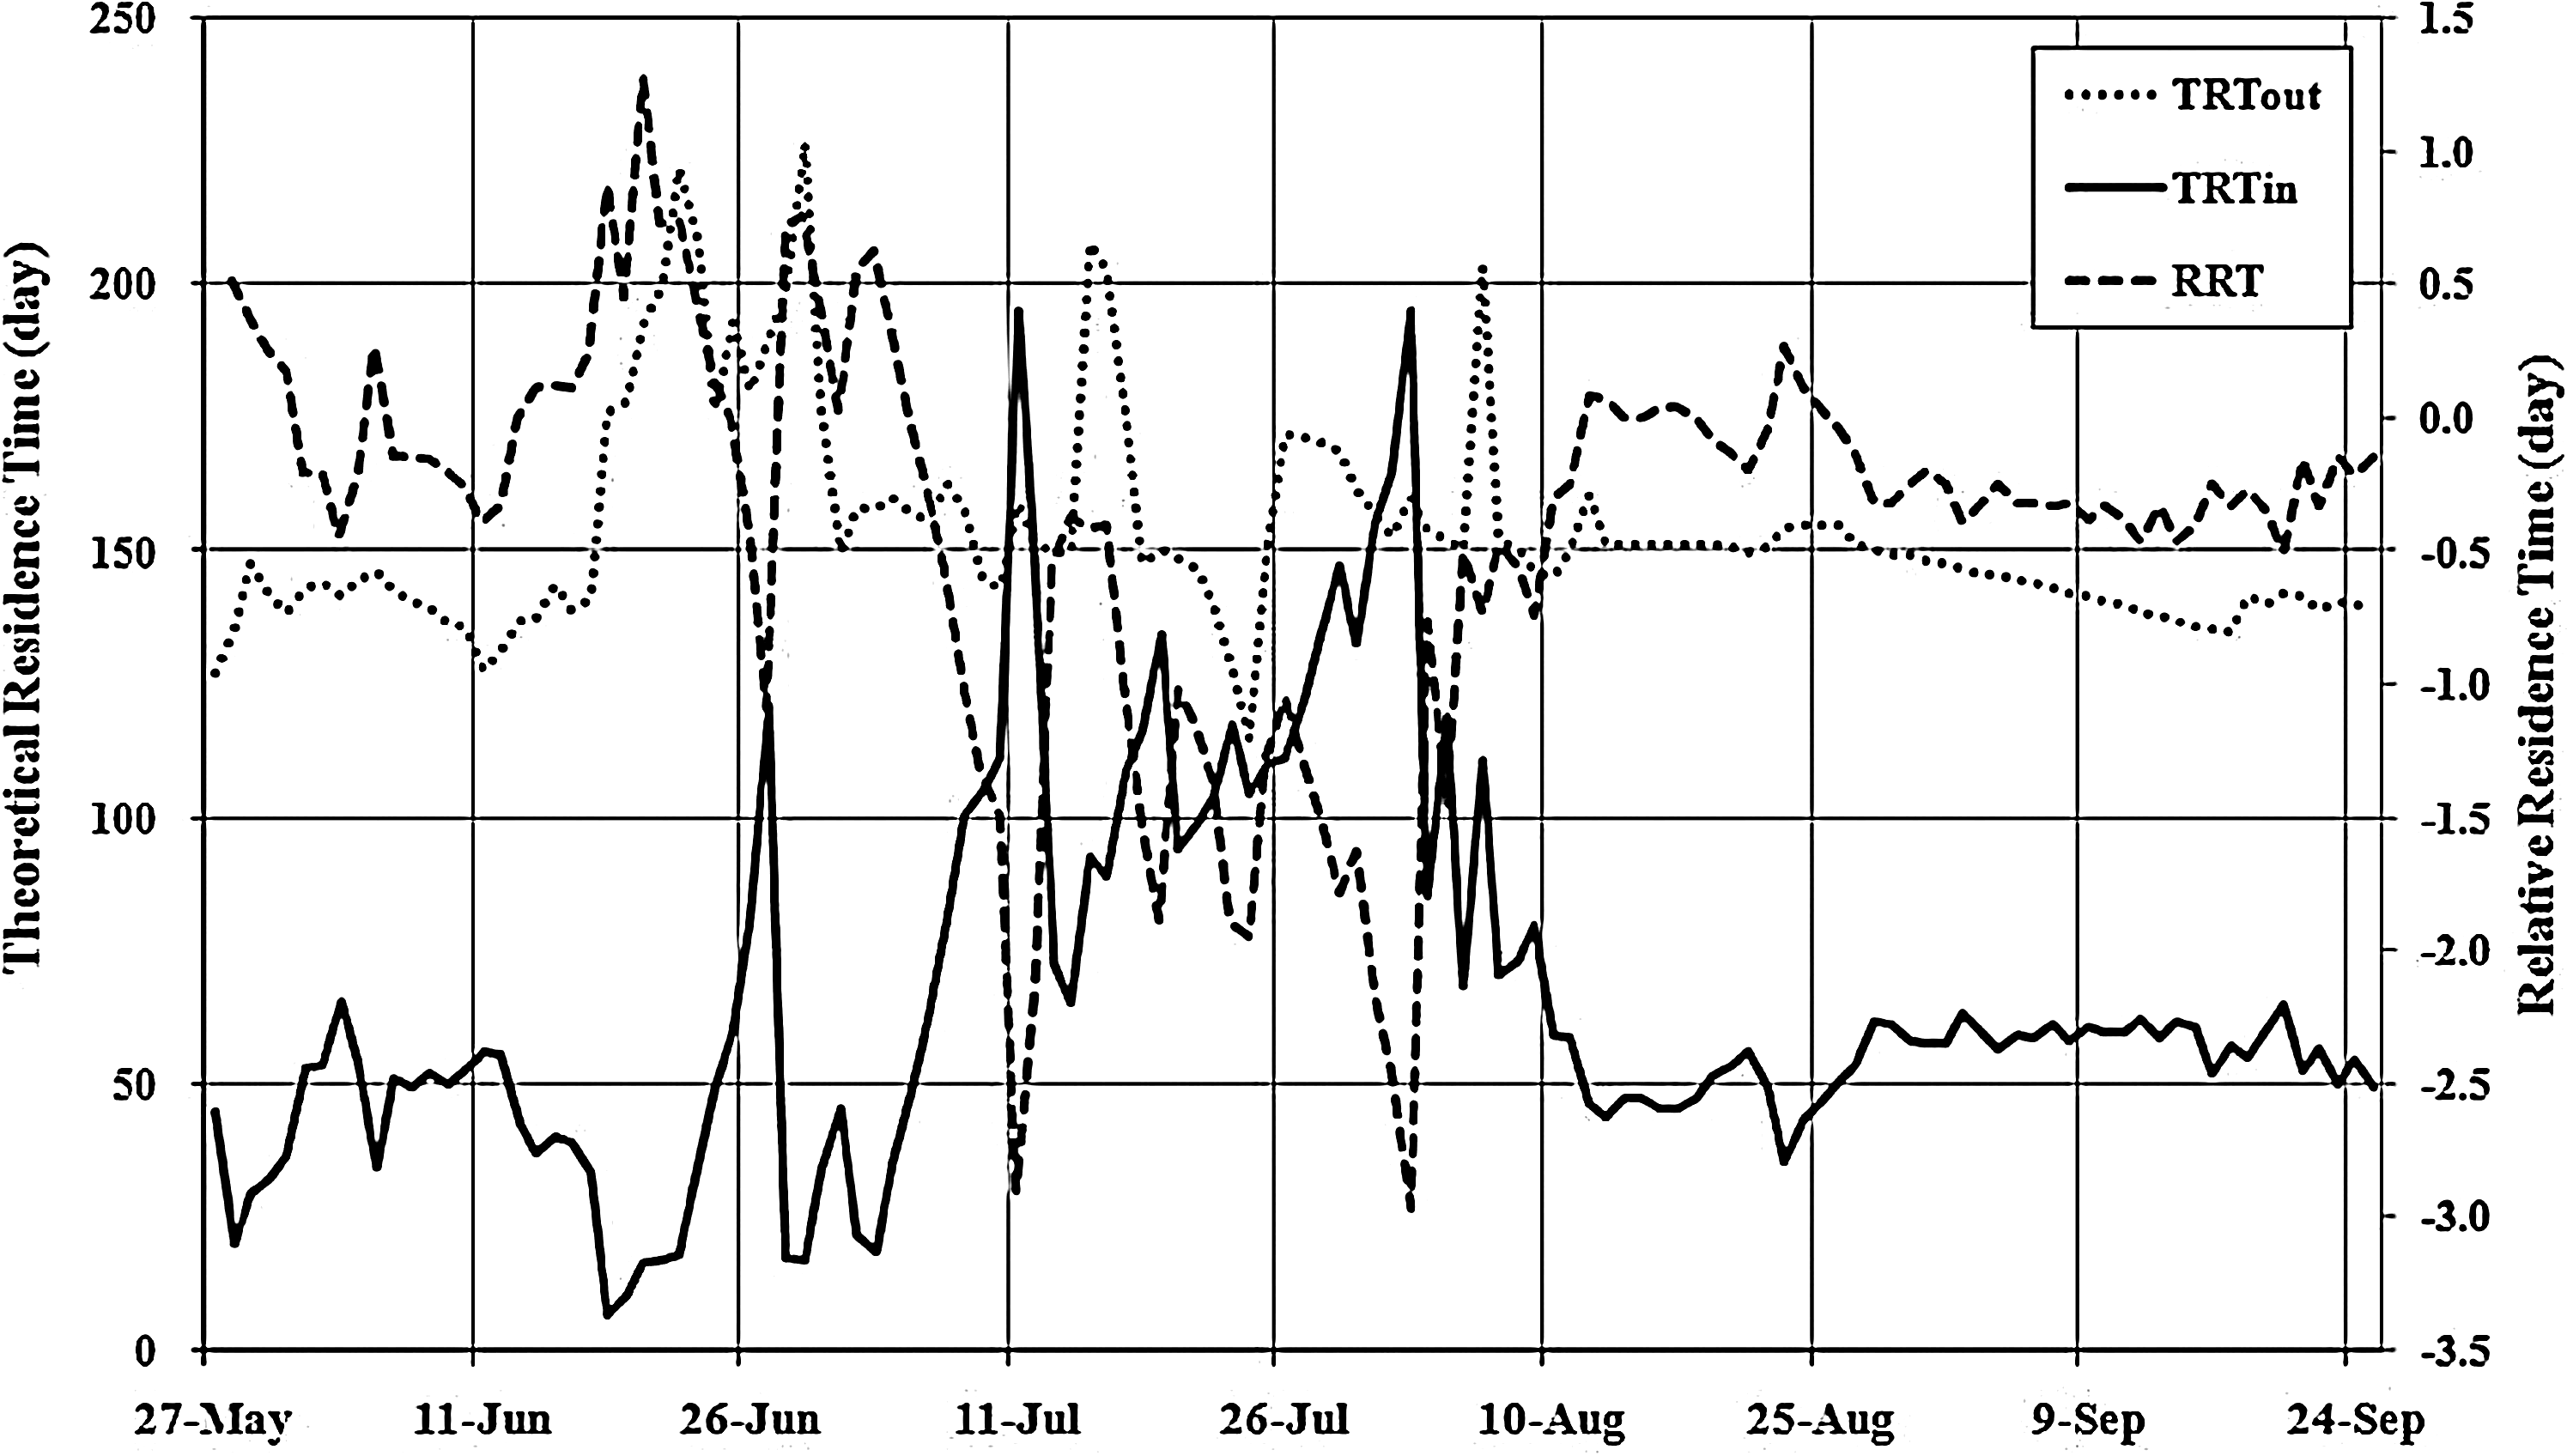
Residence time during sampling period.
Effects of chemical factors on algae growth
Table 1 shows the results of applying the regression model of Equation (5), including the effects of chemical factors nutrient concentrations) on Chl-a concentration. From the results of the analysis of the effects of nitrogen concentrations, high p-values (0.447 for TN and 0.364 for DTN) reveal that nitrogen concentrations were not significant in terms of changing algae growth. Consequently, the correlation coefficient between nitrogen concentration and Chl-a concentration was 0.198 for TN and 0.235 for DTN. These values are too low to consider their effects serious. For phosphorus concentrations, p-values were estimated to be low, 0.099 for TP and 0.118 for DTP, and the correlation coefficient rather high, 0.414 for TP and 0.394 for DTP. Nevertheless, it was estimated that phosphorus concentrations did not have a strong influence on algae growth. The elasticity of TP
Effects of physical factors on algae growth
Table 2 shows the results of the statistical analysis of physical factors (temperature and three types of residence times). The results appear to imply that the effect of epilimnion temperature was very meaningful. This is, in part, because the temperature seemed to have a plausible effect on Chl-a concentration, given that the p-value of the regression parameter β1 was estimated to be around 0.05. The correlation coefficient between temperature and Chl-a concentration was 0.465. This value can be considered high, especially in light of the fact that algae growth is theoretically influenced by a variety of factors and that all samples included unavoidable errors in field conditions. However, the Chl-a change over the temperature change
TRTout is definitely insignificant for algae growth, as the p-value of the regression parameter was very large and the correlation coefficient was almost zero. This finding is similar to that of Renella and Quirós (2006) who argued that there was no relationship between phytoplankton biomass and theoretical residence time.
Two other residence times are very significant for algae growth, as shown by low p-values and high correlation coefficients. The elasticities of TRTin and RRT,
However, there is a serious problem in relating TRTin to algae growth. Since
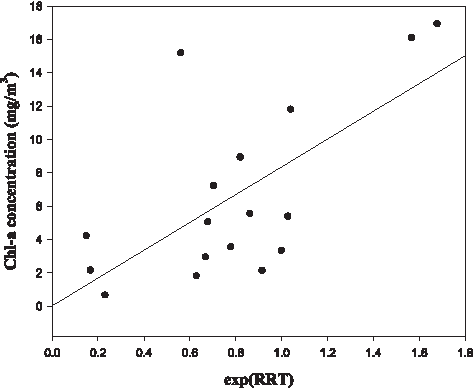
As seen in Table 2, the RRT reasonably explains how residence time affected algae growth. The Chl-a change over RRT change
Variation of Chl-a and RRT over the sampling period
Because nitrogen and potassium are essential for algae growth and reproduction, it is easy to think that TN and TP concentrations are important for algae growth. In fact, it has been demonstrated that the effect of DTP concentration cannot be disregarded. However, the present case clearly proves that short-term variation of algae growth is more influenced by residence time. Algae bloom in the summer of 2000, for example, can be explained by residence time. Because, according to the Water Management Information System database (www.wamis.go.kr), outflow rate was not increased with inflow rate only in the summer of 2000 water residence time increased in 2000 and algae bloom occurred. This tendency may turn out to be clearer in small reservoirs having short residence times (Dickman, 1969; Reynolds and Lund, 1988). Therefore, we plan to carry out further studies in a large number of small dam reservoirs to reexamine how Chl-a concentration is controlled by residence time.
Conclusions
This research investigated the impact of chemical factors (TN, TP, DTN, and DTP) and physical factors (temperature, TRTin, TRTout, and RRT) on phytoplankton biomass in a small dam reservoir during the summer season by using a simple regression model. Based on data obtained from sampling in the summer season of 2008 and from a government database, we arrived at the following conclusions:
1. It is widely known that nitrogen and potassium concentrations are essential for algae growth. From analyses of the data it was found that TP and DTP concentrations had more significant relationships with Chl-a than other chemical factors. However, none of the chemical factors studied here was a limiting factor on summer phytoplankton growth in the Sueo dam reservoir. 2. Residence times, except TRTout, were found to be statistically meaningful for Chl-a. Although TRTin is statistically related to Chl-a, in contrast with findings of most studies, higher Chl-a concentration was observed at shorter TRTin. Not all inflow could be discharged, since the outflow was constantly small, and thus, the water volume greatly varied. Hence, large inflow implied a water status that was lentic rather than lotic. It is thus concluded that TRTin is not an appropriate parameter to determine whether water status is lotic or lentic in the Sueo dam reservoir. 3. The Chl-a concentration exponentially increased with RRT, which agrees with previous studies that showed long residence time can provide sufficient time for phytoplankotn to come into contact with nutrients. It is thus found that positive and negative values of RRT can distinguish water status between lentic and lotic conditions, respectively. From these results, we expect that RRT can be used as an indicator to examine whether water status is lotic or lentic for the purpose of inhibiting algae growth. 4. According to previous studies, it is likely that the effects of residence time are more significant on algae growth in small dam reservoirs than in large dam reservoirs. Further studies are planned to verify this, targeting a number of dam reservoirs. It will then be possible to establish a cost-effective and reasonable strategy for controlling short-term algae bloom as watershed management for decreasing nutrient loading inevitably is costly and demanding.
Footnotes
Acknowledgment
This research was supported by the National Research Foundation of Korea (NRF) grant funded by the Korea government (MEST) (No. 2011-0012654).
Author Disclosure Statement
No competing financial interest exist.